Attached files
| file | filename |
|---|---|
| EX-32.3 - EXHIBIT 32.3 - WisdomTree Continuous Commodity Index Fund | t1600295_ex32-3.htm |
| EX-32.2 - EXHIBIT 32.2 - WisdomTree Continuous Commodity Index Fund | t1600295_ex32-2.htm |
| EX-31.4 - EXHIBIT 31.4 - WisdomTree Continuous Commodity Index Fund | t1600295_ex31-4.htm |
| EX-31.3 - EXHIBIT 31.3 - WisdomTree Continuous Commodity Index Fund | t1600295_ex31-3.htm |
| EX-31.1 - EXHIBIT 31.1 - WisdomTree Continuous Commodity Index Fund | t1600295_ex31-1.htm |
| EX-31.2 - EXHIBIT 31.2 - WisdomTree Continuous Commodity Index Fund | t1600295_ex31-2.htm |
| EX-32.4 - EXHIBIT 32.4 - WisdomTree Continuous Commodity Index Fund | t1600295_ex32-4.htm |
| EX-32.1 - EXHBIT 32.1 - WisdomTree Continuous Commodity Index Fund | t1600295_ex32-1.htm |
UNITED
STATES
SECURITIES AND EXCHANGE COMMISSION
Washington, D.C. 20549
FORM 10-Q
(Mark One)
| ☒ | QUARTERLY REPORT PURSUANT TO SECTION 13 OR 15(d) OF THE SECURITIES EXCHANGE ACT OF 1934 |
| For the quarterly period ended March 31, 2016 |
or
| ☐ | TRANSITION REPORT PURSUANT TO SECTION 13 OR 15(d) OF THE SECURITIES EXCHANGE ACT OF 1934 |
| For the transition period from _______________ to _______________ |
Commission File Numbers: 001-33908, 001-33909
WISDOMTREE CONTINUOUS COMMODITY INDEX FUND
(Registrant)
(Exact name of Registrant as specified in its charter)
WISDOMTREE CONTINUOUS COMMODITY INDEX MASTER FUND
(Rule 140 Co-Registrant)
(Exact name of Registrant as specified in its charter)
| Delaware | 26-0151234 26-0151301 |
| (State or Other Jurisdiction of Incorporation or | (IRS Employer |
| Organization) | Identification No.) |
| c/o WisdomTree Commodity Services, LLC | |
| 245 Park Avenue | |
| 35th Floor | |
| New York, NY | 10167 |
| (Address of Principal Executive Offices) | (Zip Code) |
1-866-909-9473
(Telephone number, including area code)
Indicate by check mark whether the registrant (1) has filed all reports required to be filed by Section 13 or 15(d) of the Securities Exchange Act of 1934 during the preceding 12 months (or for such shorter period that the registrant was required to file such reports) and (2) has been subject to such filing requirements for the past 90 days. Yes ☒ No ☐
Indicate by check mark whether the registrant has submitted electronically and posted on its corporate website, if any, every Interactive Data File required to be submitted and posted pursuant to Rule 405 of Regulation S-T during the preceding 12 months (or for such shorter period that the registrant was required to submit and post such files). Yes ☒ No ☐
Indicate by check mark whether the registrant is a large accelerated filer, an accelerated filer, or non-accelerated filer. See definition of “accelerated filer and large accelerated filer” in Rule 12b-2 of the Exchange Act. (Check one:)
| Large accelerated filer ☐ | Accelerated filer ☒ | Non-accelerated filer ☐ |
| Smaller reporting company ☐ |
Indicate by check mark whether the registrant is a shell company (as defined in Rule 12b-2 of the Exchange Act). Yes ☐ No ☒
Indicate the number of shares outstanding of each of the issuer’s classes of common stock as of March 31, 2016: 11,350,000 Limited Shares
WisdomTree Continuous Commodity Index Fund
WisdomTree Continuous Commodity Index Master Fund
Table of Contents
| 2 |
PART I – FINANCIAL INFORMATION
WisdomTree
Continuous Commodity Index Fund
Consolidated Statements of Financial Condition
March 31, 2016 (unaudited) and December 31, 2015
| March 31, 2016 (unaudited) | December 31, 2015 | |||||||
| Assets: | ||||||||
| Cash | $ | 17,643,027 | $ | — | ||||
| Cash held by broker for futures contracts (Note 3) | 14,299,879 | 83,440,007 | ||||||
| Short-term investments (cost $174,930,197 and $149,963,671 as of March 31, 2016 and December 31, 2015, respectively) | 174,962,390 | 149,980,000 | ||||||
| Net Unrealized appreciation on futures contracts | 5,868,632 | — | ||||||
| Total Assets | 212,773,928 | 233,420,007 | ||||||
| Liabilities and shareholders’ equity: | ||||||||
| Net Unrealized depreciation on futures contracts | — | 8,705,967 | ||||||
| Management fee payable to related party | 153,661 | 166,759 | ||||||
| Accrued brokerage fees and expenses payable | 63,301 | 28,756 | ||||||
| Total Liabilities | 216,962 | 8,901,482 | ||||||
| Shareholders’ equity: | ||||||||
| General Units: | ||||||||
| Paid in capital - 50 units issued | 1,500 | 1,500 | ||||||
| Accumulated deficit | (566 | ) | (572 | ) | ||||
| Total General Units | 934 | 928 | ||||||
| Limited Units: | ||||||||
| Paid in capital - 11,350,000 and 12,100,000 redeemable shares issued and outstanding as of March 31, 2016 and December 31, 2015, respectively | 346,464,742 | 360,079,849 | ||||||
| Accumulated deficit | (133,908,710 | ) | (135,562,252 | ) | ||||
| Total Limited Units | 212,556,032 | 224,517,597 | ||||||
| Total shareholders’ equity | 212,556,966 | 224,518,525 | ||||||
| Total liabilities and shareholders’ equity | $ | 212,773,928 | $ | 233,420,007 | ||||
| Net asset value per share | ||||||||
| General Units | $ | 18.73 | $ | 18.56 | ||||
| Limited Units | $ | 18.73 | $ | 18.56 | ||||
See accompanying notes to unaudited consolidated financial statements
| 3 |
WisdomTree Continuous Commodity Index Fund
Unaudited Consolidated Schedule of Investments
March 31, 2016
| Description | Percentage of Net Assets | Fair Value | Face Amount | |||||||||
| U.S. Treasury Obligations | ||||||||||||
| U.S. Treasury Bills | ||||||||||||
| 0.33%, 4/28/16 | 23.52 | % | $ | 49,993,800 | $ | 50,000,000 | ||||||
| 0.27%, 5/12/16 | 23.52 | 49,994,900 | 50,000,000 | |||||||||
| 0.32%, 5/26/16 | 7.05 | 14,997,150 | 15,000,000 | |||||||||
| 0.28%, 6/16/16 | 28.22 | 59,976,540 | 60,000,000 | |||||||||
| Total U.S. Treasury Obligations ($174,930,197) | 82.31 | % | $ | 174,962,390 | $ | 175,000,000 | ||||||
| Description | Contracts | Unrealized Appreciation/ (Depreciation) Percentage of Net Assets | Unrealized Appreciation/ (Depreciation) | Notional Value | ||||||||||||
| Futures Contracts Long | ||||||||||||||||
| Cocoa | ||||||||||||||||
| expiration date 5/13/16 | 141 | (0.07 | )% | $ | (153,660 | ) | $ | 4,159,500 | ||||||||
| expiration date 7/14/16 | 141 | (0.13 | ) | (281,030 | ) | 4,172,190 | ||||||||||
| expiration date 9/15/16 | 140 | 0.06 | 124,350 | 4,123,000 | ||||||||||||
| Coffee “C” | ||||||||||||||||
| expiration date 5/18/16 | 85 | 0.06 | 125,081 | 4,062,469 | ||||||||||||
| expiration date 7/19/16 | 86 | 0.10 | 213,431 | 4,177,987 | ||||||||||||
| expiration date 9/20/16 | 85 | 0.15 | 325,069 | 4,183,594 | ||||||||||||
| Copper | ||||||||||||||||
| expiration date 5/26/16 | 76 | (0.04 | ) | (88,400 | ) | 4,147,700 | ||||||||||
| expiration date 7/27/16 | 76 | 0.03 | 73,263 | 4,162,900 | ||||||||||||
| expiration date 9/28/16 | 76 | 0.13 | 273,213 | 4,174,300 | ||||||||||||
| Corn | ||||||||||||||||
| expiration date 5/13/16 | 235 | (0.18 | ) | (385,863 | ) | 4,130,125 | ||||||||||
| expiration date 7/14/16 | 234 | (0.12 | ) | (245,788 | ) | 4,162,275 | ||||||||||
| expiration date 9/14/16 | 234 | (0.08 | ) | (162,400 | ) | 4,217,850 | ||||||||||
| Cotton No. 2 | ||||||||||||||||
| expiration date 5/6/16 | 214 | (0.13 | ) | (283,145 | ) | 6,253,080 | ||||||||||
| expiration date 7/7/16 | 215 | (0.14 | ) | (298,405 | ) | 6,268,325 | ||||||||||
| Gold 100 Ounce | ||||||||||||||||
| expiration date 6/28/16 | 51 | 0.21 | 444,910 | 6,301,560 | ||||||||||||
| expiration date 8/29/16 | 50 | 0.19 | 402,660 | 6,185,000 | ||||||||||||
| Lean Hogs | ||||||||||||||||
| expiration date 4/14/16 | 83 | 0.00 | * | (670 | ) | 2,269,220 | ||||||||||
| expiration date 6/14/16 | 82 | 0.10 | 201,150 | 2,651,880 | ||||||||||||
| expiration date 7/15/16 | 82 | 0.09 | 190,860 | 2,650,240 | ||||||||||||
| expiration date 8/12/16 | 82 | 0.05 | 95,680 | 2,637,120 | ||||||||||||
| expiration date 10/14/16 | 82 | 0.01 | 14,700 | 2,260,740 | ||||||||||||
| Live Cattle | ||||||||||||||||
| expiration date 6/30/16 | 85 | 0.00 | * | 4,930 | 4,216,850 | |||||||||||
| expiration date 8/31/16 | 86 | (0.02 | ) | (44,880 | ) | 4,134,020 | ||||||||||
| expiration date 10/31/16 | 86 | 0.03 | 54,640 | 4,122,840 | ||||||||||||
| Natural Gas | ||||||||||||||||
| expiration date 4/27/16 | 118 | (0.15 | ) | (313,010 | ) | 2,311,620 | ||||||||||
| expiration date 5/26/16 | 118 | (0.13 | ) | (270,140 | ) | 2,423,720 | ||||||||||
| expiration date 6/28/16 | 118 | (0.12 | ) | (257,590 | ) | 2,540,540 | ||||||||||
| expiration date 7/27/16 | 117 | (0.02 | ) | (40,270 | ) | 2,588,040 | ||||||||||
| expiration date 8/29/16 | 117 | (0.01 | ) | (24,230 | ) | 2,617,290 | ||||||||||
| NY Harbor ULSD | ||||||||||||||||
| expiration date 4/29/16 | 50 | 0.06 | 129,709 | 2,489,550 | ||||||||||||
| expiration date 5/31/16 | 49 | 0.04 | 91,245 | 2,473,098 | ||||||||||||
| expiration date 6/30/16 | 49 | 0.10 | 207,031 | 2,513,847 | ||||||||||||
| expiration date 7/29/16 | 48 | 0.13 | 281,711 | 2,502,864 | ||||||||||||
| expiration date 8/31/16 | 48 | 0.13 | 283,298 | 2,547,216 | ||||||||||||
| Platinum | ||||||||||||||||
| expiration date 7/27/16 | 128 | 0.16 | 349,265 | 6,256,000 | ||||||||||||
| expiration date 10/27/16 | 127 | 0.08 | 162,000 | 6,218,555 | ||||||||||||
See accompanying notes to unaudited consolidated financial statements
| 4 |
WisdomTree Continuous Commodity Index Fund
Unaudited Consolidated Schedule of Investments (continued)
March 31, 2016
| Description | Contracts | Unrealized Appreciation/ (Depreciation) Percentage of Net Assets | Unrealized Appreciation/ (Depreciation) | Notional Value | ||||||||||||
| Silver | ||||||||||||||||
| expiration date 5/26/16 | 54 | 0.09 | % | $ | 199,055 | $ | 4,175,280 | |||||||||
| expiration date 7/27/16 | 54 | 0.14 | 287,145 | 4,185,540 | ||||||||||||
| expiration date 9/28/16 | 53 | (0.01 | ) | (11,955 | ) | 4,117,570 | ||||||||||
| Soybean | ||||||||||||||||
| expiration date 5/13/16 | 91 | 0.04 | 89,888 | 4,143,912 | ||||||||||||
| expiration date 7/14/16 | 91 | 0.09 | 193,550 | 4,175,762 | ||||||||||||
| expiration date 8/12/16 | 91 | 0.09 | 190,600 | 4,188,275 | ||||||||||||
| Soybean Oil | ||||||||||||||||
| expiration date 5/13/16 | 121 | 0.18 | 378,450 | 2,484,372 | ||||||||||||
| expiration date 7/14/16 | 121 | 0.19 | 401,934 | 2,500,344 | ||||||||||||
| expiration date 8/12/16 | 121 | 0.14 | 303,822 | 2,506,878 | ||||||||||||
| expiration date 9/14/16 | 121 | 0.10 | 207,912 | 2,514,138 | ||||||||||||
| expiration date 10/14/16 | 120 | 0.10 | 210,660 | 2,496,960 | ||||||||||||
| Sugar No. 11 | ||||||||||||||||
| expiration date 4/29/16 | 240 | 0.18 | 392,851 | 4,126,080 | ||||||||||||
| expiration date 6/30/16 | 240 | 0.17 | 350,358 | 4,152,960 | ||||||||||||
| expiration date 9/30/16 | 239 | 0.25 | 528,248 | 4,178,485 | ||||||||||||
| Wheat | ||||||||||||||||
| expiration date 5/13/16 | 173 | (0.08 | ) | (165,063 | ) | 4,095,775 | ||||||||||
| expiration date 7/14/16 | 173 | (0.05 | ) | (100,438 | ) | 4,158,487 | ||||||||||
| expiration date 9/14/16 | 173 | 0.05 | 112,650 | 4,240,662 | ||||||||||||
| WTI Crude Oil | ||||||||||||||||
| expiration date 4/20/16 | 62 | 0.05 | 97,410 | 2,377,080 | ||||||||||||
| expiration date 5/20/16 | 62 | 0.06 | 125,690 | 2,464,500 | ||||||||||||
| expiration date 6/21/16 | 62 | 0.10 | 221,980 | 2,522,780 | ||||||||||||
| expiration date 7/20/16 | 62 | 0.16 | 335,130 | 2,564,320 | ||||||||||||
| expiration date 8/22/16 | 62 | 0.15 | 320,040 | 2,597,800 | ||||||||||||
| Total | 2.76 | % | $ | 5,868,632 | $ | 212,275,065 | ||||||||||
| * | Denotes greater than 0.000% yet less than 0.005% |
See accompanying notes to unaudited consolidated financial statements
| 5 |
WisdomTree
Continuous Commodity Index Fund
Consolidated Schedule of Investments
December 31, 2015
| Description | Percentage of Net Assets | Fair Value | Face Amount | |||||||||
| U.S. Treasury Obligations | ||||||||||||
| U.S. Treasury Bills | ||||||||||||
| 0.17%, 1/28/16 | 22.27 | % | $ | 49,995,900 | $ | 50,000,000 | ||||||
| 0.14%, 2/11/16 | 22.27 | 49,993,400 | 50,000,000 | |||||||||
| 0.28%, 3/17/16 | 22.26 | 49,990,700 | 50,000,000 | |||||||||
| Total U.S. Treasury Obligations ($149,963,671) | 66.80 | % | $ | 149,980,000 | $ | 150,000,000 | ||||||
| Description | Contracts | Unrealized Appreciation/ (Depreciation) Percentage of Net Assets | Unrealized Appreciation/ (Depreciation) | Notional Value | ||||||||||||
| Futures Contracts Long | ||||||||||||||||
| Cocoa | ||||||||||||||||
| expiration date 3/15/16 | 137 | 0.05 | % | $ | 119,700 | $ | 4,399,070 | |||||||||
| expiration date 5/13/16 | 137 | 0.05 | 113,380 | 4,393,590 | ||||||||||||
| expiration date 7/14/16 | 138 | (0.05 | ) | (119,940 | ) | 4,420,140 | ||||||||||
| Coffee “C” | ||||||||||||||||
| expiration date 3/18/16 | 91 | (0.05 | ) | (118,144 | ) | 4,323,638 | ||||||||||
| expiration date 5/18/16 | 91 | (0.04 | ) | (96,862 | ) | 4,395,300 | ||||||||||
| expiration date 7/19/16 | 91 | 0.12 | 267,150 | 4,461,844 | ||||||||||||
| Copper | ||||||||||||||||
| expiration date 3/29/16 | 82 | (0.14 | ) | (309,850 | ) | 4,376,750 | ||||||||||
| expiration date 5/26/16 | 82 | (0.15 | ) | (338,513 | ) | 4,390,075 | ||||||||||
| expiration date 7/27/16 | 82 | (0.04 | ) | (81,925 | ) | 4,400,325 | ||||||||||
| Corn | ||||||||||||||||
| expiration date 3/14/16 | 242 | (0.13 | ) | (301,212 | ) | 4,340,875 | ||||||||||
| expiration date 5/13/16 | 242 | (0.14 | ) | (315,375 | ) | 4,410,450 | ||||||||||
| expiration date 7/14/16 | 241 | (0.05 | ) | (114,900 | ) | 4,464,525 | ||||||||||
| Cotton No. 2 | ||||||||||||||||
| expiration date 3/8/16 | 138 | (0.02 | ) | (35,815 | ) | 4,366,320 | ||||||||||
| expiration date 5/6/16 | 137 | (0.01 | ) | (12,455 | ) | 4,391,535 | ||||||||||
| expiration date 7/7/16 | 137 | 0.04 | 97,490 | 4,438,115 | ||||||||||||
| Gold 100 Ounce | ||||||||||||||||
| expiration date 2/25/16 | 42 | (0.18 | ) | (401,480 | ) | 4,452,840 | ||||||||||
| expiration date 4/27/16 | 41 | (0.09 | ) | (211,170 | ) | 4,349,280 | ||||||||||
| expiration date 6/28/16 | 41 | (0.05 | ) | (104,370 | ) | 4,352,150 | ||||||||||
| Lean Hogs | ||||||||||||||||
| expiration date 2/12/16 | 117 | (0.11 | ) | (239,750 | ) | 2,798,640 | ||||||||||
| expiration date 4/14/16 | 117 | (0.07 | ) | (148,820 | ) | 3,086,460 | ||||||||||
| expiration date 6/14/16 | 117 | 0.10 | 220,880 | 3,650,400 | ||||||||||||
| expiration date 7/15/16 | 117 | 0.08 | 185,740 | 3,643,380 | ||||||||||||
| Live Cattle | ||||||||||||||||
| expiration date 2/29/16 | 82 | (0.09 | ) | (204,150 | ) | 4,487,040 | ||||||||||
| expiration date 4/29/16 | 82 | (0.04 | ) | (86,140 | ) | 4,525,580 | ||||||||||
| expiration date 6/30/16 | 82 | 0.06 | 132,670 | 4,191,840 | ||||||||||||
| Natural Gas | ||||||||||||||||
| expiration date 1/27/16 | 111 | (0.18 | ) | (395,510 | ) | 2,594,070 | ||||||||||
| expiration date 2/25/16 | 110 | (0.14 | ) | (318,070 | ) | 2,599,300 | ||||||||||
| expiration date 3/29/16 | 110 | (0.11 | ) | (238,510 | ) | 2,625,700 | ||||||||||
| expiration date 4/27/16 | 110 | (0.02 | ) | (39,980 | ) | 2,666,400 | ||||||||||
| expiration date 5/26/16 | 110 | (0.02 | ) | (46,190 | ) | 2,714,800 | ||||||||||
| NY Harbor ULSD | ||||||||||||||||
| expiration date 1/29/16 | 54 | (0.38 | ) | (848,266 | ) | 2,549,005 | ||||||||||
| expiration date 2/29/16 | 54 | (0.35 | ) | (789,184 | ) | 2,605,705 | ||||||||||
| expiration date 3/31/16 | 54 | (0.32 | ) | (719,783 | ) | 2,647,436 | ||||||||||
| expiration date 4/29/16 | 53 | (0.25 | ) | (556,471 | ) | 2,649,163 | ||||||||||
| expiration date 5/31/16 | 53 | (0.24 | ) | (551,179 | ) | 2,705,480 | ||||||||||
| Platinum | ||||||||||||||||
| expiration date 4/27/16 | 147 | (0.11 | ) | (254,960 | ) | 6,565,020 | ||||||||||
| expiration date 7/27/16 | 148 | 0.06 | 126,785 | 6,615,600 | ||||||||||||
See accompanying notes to unaudited consolidated financial statements
| 6 |
WisdomTree
Continuous Commodity Index Fund
Consolidated Schedule of Investments (continued)
December 31, 2015
| Description | Contracts | Unrealized Appreciation/ (Depreciation) Percentage of Net Assets | Unrealized Appreciation/ (Depreciation) | Notional Value | ||||||||||||
| Silver | ||||||||||||||||
| expiration date 3/29/16 | 64 | (0.18 | )% | $ | (414,395 | ) | $ | 4,416,960 | ||||||||
| expiration date 5/26/16 | 64 | (0.17 | ) | (374,635 | ) | 4,426,880 | ||||||||||
| expiration date 7/27/16 | 63 | (0.07 | ) | (151,495 | ) | 4,368,105 | ||||||||||
| Soybean | ||||||||||||||||
| expiration date 3/14/16 | 101 | (0.10 | ) | (231,875 | ) | 4,364,463 | ||||||||||
| expiration date 5/13/16 | 101 | (0.10 | ) | (221,537 | ) | 4,390,975 | ||||||||||
| expiration date 7/14/16 | 101 | 0.01 | 24,500 | 4,427,587 | ||||||||||||
| Soybean Oil | ||||||||||||||||
| expiration date 3/14/16 | 237 | 0.12 | 277,464 | 4,372,650 | ||||||||||||
| expiration date 5/13/16 | 237 | 0.13 | 288,294 | 4,402,512 | ||||||||||||
| expiration date 7/14/16 | 237 | 0.18 | 391,830 | 4,433,796 | ||||||||||||
| Sugar No. 11 | ||||||||||||||||
| expiration date 2/29/16 | 263 | 0.27 | 600,074 | 4,489,094 | ||||||||||||
| expiration date 4/29/16 | 264 | 0.26 | 591,270 | 4,411,546 | ||||||||||||
| expiration date 6/30/16 | 264 | 0.06 | 126,717 | 4,328,755 | ||||||||||||
| Wheat | ||||||||||||||||
| expiration date 3/14/16 | 185 | (0.14 | ) | (314,138 | ) | 4,347,500 | ||||||||||
| expiration date 5/13/16 | 185 | (0.13 | ) | (298,525 | ) | 4,407,625 | ||||||||||
| expiration date 7/14/16 | 184 | (0.07 | ) | (160,687 | ) | 4,445,900 | ||||||||||
| WTI Crude Oil | ||||||||||||||||
| expiration date 1/20/16 | 68 | (0.22 | ) | (502,660 | ) | 2,518,720 | ||||||||||
| expiration date 2/22/16 | 68 | (0.22 | ) | (492,250 | ) | 2,595,560 | ||||||||||
| expiration date 3/21/16 | 68 | (0.20 | ) | (445,480 | ) | 2,660,840 | ||||||||||
| expiration date 4/20/16 | 67 | (0.15 | ) | (334,250 | ) | 2,678,660 | ||||||||||
| expiration date 5/20/16 | 67 | (0.15 | ) | (329,010 | ) | 2,727,570 | ||||||||||
| Total | (3.88 | )% | $ | (8,705,967 | ) | $ | 224,263,539 | |||||||||
See accompanying notes to unaudited consolidated financial statements
| 7 |
WisdomTree Continuous Commodity Index Fund
Unaudited Consolidated Statements of Income and Expenses
For the Three Months Ended March 31, 2016 and 2015
| 2016 | 2015 | |||||||
| Income: | ||||||||
| Interest income | $ | 89,300 | $ | 10,326 | ||||
| Expenses: | ||||||||
| Management fee to related party | 447,661 | 534,030 | ||||||
| Brokerage fees and expenses | 105,332 | 125,654 | ||||||
| Total expenses | 552,993 | 659,684 | ||||||
| Net investment loss | (463,693 | ) | (649,358 | ) | ||||
| Realized and Net Change in Unrealized Gain (Loss) on Investments and Futures Contracts: | ||||||||
| Net Realized Gain (Loss) from: | ||||||||
| Futures Contracts | (12,473,222 | ) | (28,433,985 | ) | ||||
| Net Realized Loss | (12,473,222 | ) | (28,433,985 | ) | ||||
| Net Change in Unrealized Gain (Loss) from: | ||||||||
| Investments | 15,864 | 1,521 | ||||||
| Futures Contracts | 14,574,599 | 10,547,678 | ||||||
| Net Change in Unrealized Gain (Loss) | 14,590,463 | 10,549,199 | ||||||
| Net Realized and Unrealized Gain (Loss) on Investments and Futures Contracts | 2,117,241 | (17,884,786 | ) | |||||
| Net Gain (Loss) | $ | 1,653,548 | $ | (18,534,144 | ) | |||
See accompanying notes to unaudited consolidated financial statements
| 8 |
WisdomTree Continuous Commodity Index Fund
Unaudited Consolidated Statement of Changes in Shareholders’ Equity
For the Three Months Ended March 31, 2016
| General Units | Limited Units | Total | ||||||||||||||||||||||||||||||||||
| Total | Total | |||||||||||||||||||||||||||||||||||
| General | Limited | Total | ||||||||||||||||||||||||||||||||||
| General Units | Accumulated | Shareholders’ | Limited Units | Accumulated | Shareholders’ | Shareholders’ | ||||||||||||||||||||||||||||||
| Units | Amount | Deficit | Equity | Units | Amount | Deficit | Equity | Equity | ||||||||||||||||||||||||||||
| Balance at December 31, 2015 | 50 | $ | 1,500 | $ | (572 | ) | $ | 928 | 12,100,000 | $ | 360,079,849 | $ | (135,562,252 | ) | $ | 224,517,597 | $ | 224,518,525 | ||||||||||||||||||
| Creation of Limited Units | — | — | — | — | — | — | — | — | — | |||||||||||||||||||||||||||
| Redemption of Limited Units | — | — | — | — | (750,000 | ) | (13,615,107 | ) | — | (13,615,107 | ) | (13,615,107 | ) | |||||||||||||||||||||||
| Net Gain (Loss): | ||||||||||||||||||||||||||||||||||||
| Net Investment Gain (Loss) | — | — | (3 | ) | (3 | ) | — | — | (463,690 | ) | (463,690 | ) | (463,693 | ) | ||||||||||||||||||||||
| Net Realized Gain (Loss) from Investments and Futures Contracts | — | — | (49 | ) | (49 | ) | — | — | (12,473,173 | ) | (12,473,173 | ) | (12,473,222 | ) | ||||||||||||||||||||||
| Net Change in Unrealized Gain (Loss) from Investments and Futures Contracts | — | — | 58 | 58 | — | — | 14,590,405 | 14,590,405 | 14,590,463 | |||||||||||||||||||||||||||
| Net Gain | — | — | 6 | 6 | — | — | 1,653,542 | 1,653,542 | 1,653,548 | |||||||||||||||||||||||||||
| Balance at March 31, 2016 | 50 | $ | 1,500 | $ | (566 | ) | $ | 934 | 11,350,000 | $ | 346,464,742 | $ | (133,908,710 | ) | $ | 212,556,032 | $ | 212,556,966 | ||||||||||||||||||
See accompanying notes to unaudited consolidated financial statements
| 9 |
WisdomTree Continuous Commodity Index Fund
Unaudited Consolidated Statements of Cash Flows
For the Three Months Ended March 31, 2016 and 2015
| 2016 | 2015 | |||||||
| Cash flows from operating activities | ||||||||
| Net Gain (Loss) | $ | 1,653,548 | $ | (18,534,144 | ) | |||
| Adjustments to reconcile net gain (loss) to net cash provided by (used for) operating activities: | ||||||||
| Purchases of investment securities | (174,877,226 | ) | (199,989,853 | ) | ||||
| Proceeds from sales of investment securities | 150,000,000 | 200,000,000 | ||||||
| Net accretion of discount | (89,300 | ) | (10,326 | ) | ||||
| Change in net unrealized depreciation (appreciation) on investments | (15,864 | ) | (1,521 | ) | ||||
| Changes in assets and liabilities | ||||||||
| (Increase)/Decrease in assets: | ||||||||
| Net unrealized appreciation on futures contracts | (5,868,632 | ) | — | |||||
| Increase/(Decrease) in liabilities: | ||||||||
| Net unrealized depreciation on futures contracts | (8,705,967 | ) | (10,547,678 | ) | ||||
| Management fee payable to related party | (13,098 | ) | (27,957 | ) | ||||
| Accrued brokerage fees and expenses payable | 34,545 | 45,080 | ||||||
| Net cash used for operating activities | (37,881,994 | ) | (29,066,399 | ) | ||||
| Cash flows from financing activities | ||||||||
| Proceeds from creation of Limited Units | — | 5,487,716 | ||||||
| Additional capital contribution | — | (10,086,172 | ) | |||||
| Redemption of Limited Units | (13,615,107 | ) | — | |||||
| Net cash provided by (used for) financing activities | (13,615,107 | ) | (4,598,456 | ) | ||||
| Net increase (decrease) in cash | (51,497,101 | ) | (33,664,855 | ) | ||||
| Cash* at beginning of period | 83,440,007 | 94,433,074 | ||||||
| Cash* at end of period | $ | 31,942,906 | $ | 60,768,219 | ||||
* Includes cash held by the broker for futures contracts.
See accompanying notes to unaudited consolidated financial statements
| 10 |
WisdomTree Continuous Commodity Index Master Fund
Consolidated Statements of Financial Condition
March 31, 2016 (unaudited) and December 31, 2015
| March 31, 2016 (unaudited) | December 31, 2015 | |||||||
| Assets: | ||||||||
| Cash | $ | 17,643,027 | $ | — | ||||
| Cash held by broker for futures contracts (Note 3) | 14,299,879 | 83,440,007 | ||||||
Short-term investments (cost $174,930,197 and $149,963,671 as of March 31, 2016 and December 31, 2015, respectively) | 174,962,390 | 149,980,000 | ||||||
| Net Unrealized appreciation on futures contracts | 5,868,632 | — | ||||||
| Total Assets | 212,773,928 | 233,420,007 | ||||||
| Liabilities and shareholders’ equity: | ||||||||
| Net Unrealized depreciation on futures contracts | — | 8,705,967 | ||||||
| Management fee payable to related party | 153,661 | 166,759 | ||||||
| Accrued brokerage fees and expenses payable | 63,301 | 28,756 | ||||||
| Total Liabilities | 216,962 | 8,901,482 | ||||||
| Shareholders’ equity: | ||||||||
| General Units: | ||||||||
| Paid in capital - 50 units issued | 1,500 | 1,500 | ||||||
| Accumulated deficit | (566 | ) | (572 | ) | ||||
| Total General Units | 934 | 928 | ||||||
| Limited Units: | ||||||||
Paid in capital - 11,350,000 and 12,100,000 redeemable shares issued and outstanding as of March 31, 2016 and December 31, 2015, respectively | 346,464,742 | 360,079,849 | ||||||
| Accumulated deficit | (133,908,710 | ) | (135,562,252 | ) | ||||
| Total Limited Units | 212,556,032 | 224,517,597 | ||||||
| Total shareholders’ equity | 212,556,966 | 224,518,525 | ||||||
| Total liabilities and shareholders’ equity | $ | 212,773,928 | $ | 233,420,007 | ||||
| Net asset value per share | ||||||||
| General Units | $ | 18.73 | $ | 18.56 | ||||
| Limited Units | $ | 18.73 | $ | 18.56 | ||||
See accompanying notes to unaudited consolidated financial statements
| 11 |
WisdomTree Continuous Commodity Index Master Fund
Unaudited Consolidated Schedule of Investments
March 31, 2016
| Description | Percentage of Net Assets | Fair Value | Face Amount | |||||||||
| U.S. Treasury Obligations | ||||||||||||
| U.S. Treasury Bills | ||||||||||||
| 0.33%, 4/28/16 | 23.52 | % | $ | 49,993,800 | $ | 50,000,000 | ||||||
| 0.27%, 5/12/16 | 23.52 | 49,994,900 | 50,000,000 | |||||||||
| 0.32%, 5/26/16 | 7.05 | 14,997,150 | 15,000,000 | |||||||||
| 0.28%, 6/16/16 | 28.22 | 59,976,540 | 60,000,000 | |||||||||
| Total U.S. Treasury Obligations ($174,930,197) | 82.31 | % | $ | 174,962,390 | $ | 175,000,000 | ||||||
| Description | Contracts | Unrealized Appreciation/ (Depreciation) Percentage of Net Assets | Unrealized Appreciation/ (Depreciation) | Notional Value | ||||||||||||
| Futures Contracts Long | ||||||||||||||||
| Cocoa | ||||||||||||||||
| expiration date 5/13/16 | 141 | (0.07 | )% | $ | (153,660 | ) | $ | 4,159,500 | ||||||||
| expiration date 7/14/16 | 141 | (0.13 | ) | (281,030 | ) | 4,172,190 | ||||||||||
| expiration date 9/15/16 | 140 | 0.06 | 124,350 | 4,123,000 | ||||||||||||
| Coffee “C” | ||||||||||||||||
| expiration date 5/18/16 | 85 | 0.06 | 125,081 | 4,062,469 | ||||||||||||
| expiration date 7/19/16 | 86 | 0.10 | 213,431 | 4,177,987 | ||||||||||||
| expiration date 9/20/16 | 85 | 0.15 | 325,069 | 4,183,594 | ||||||||||||
| Copper | ||||||||||||||||
| expiration date 5/26/16 | 76 | (0.04 | ) | (88,400 | ) | 4,147,700 | ||||||||||
| expiration date 7/27/16 | 76 | 0.03 | 73,263 | 4,162,900 | ||||||||||||
| expiration date 9/28/16 | 76 | 0.13 | 273,213 | 4,174,300 | ||||||||||||
| Corn | ||||||||||||||||
| expiration date 5/13/16 | 235 | (0.18 | ) | (385,863 | ) | 4,130,125 | ||||||||||
| expiration date 7/14/16 | 234 | (0.12 | ) | (245,788 | ) | 4,162,275 | ||||||||||
| expiration date 9/14/16 | 234 | (0.08 | ) | (162,400 | ) | 4,217,850 | ||||||||||
| Cotton No. 2 | ||||||||||||||||
| expiration date 5/6/16 | 214 | (0.13 | ) | (283,145 | ) | 6,253,080 | ||||||||||
| expiration date 7/7/16 | 215 | (0.14 | ) | (298,405 | ) | 6,268,325 | ||||||||||
| Gold 100 Ounce | ||||||||||||||||
| expiration date 6/28/16 | 51 | 0.21 | 444,910 | 6,301,560 | ||||||||||||
| expiration date 8/29/16 | 50 | 0.19 | 402,660 | 6,185,000 | ||||||||||||
| Lean Hogs | ||||||||||||||||
| expiration date 4/14/16 | 83 | 0.00 | * | (670 | ) | 2,269,220 | ||||||||||
| expiration date 6/14/16 | 82 | 0.10 | 201,150 | 2,651,880 | ||||||||||||
| expiration date 7/15/16 | 82 | 0.09 | 190,860 | 2,650,240 | ||||||||||||
| expiration date 8/12/16 | 82 | 0.05 | 95,680 | 2,637,120 | ||||||||||||
| expiration date 10/14/16 | 82 | 0.01 | 14,700 | 2,260,740 | ||||||||||||
| Live Cattle | ||||||||||||||||
| expiration date 6/30/16 | 85 | 0.00 | * | 4,930 | 4,216,850 | |||||||||||
| expiration date 8/31/16 | 86 | (0.02 | ) | (44,880 | ) | 4,134,020 | ||||||||||
| expiration date 10/31/16 | 86 | 0.03 | 54,640 | 4,122,840 | ||||||||||||
| Natural Gas | ||||||||||||||||
| expiration date 4/27/16 | 118 | (0.15 | ) | (313,010 | ) | 2,311,620 | ||||||||||
| expiration date 5/26/16 | 118 | (0.13 | ) | (270,140 | ) | 2,423,720 | ||||||||||
| expiration date 6/28/16 | 118 | (0.12 | ) | (257,590 | ) | 2,540,540 | ||||||||||
| expiration date 7/27/16 | 117 | (0.02 | ) | (40,270 | ) | 2,588,040 | ||||||||||
| expiration date 8/29/16 | 117 | (0.01 | ) | (24,230 | ) | 2,617,290 | ||||||||||
| NY Harbor ULSD | ||||||||||||||||
| expiration date 4/29/16 | 50 | 0.06 | 129,709 | 2,489,550 | ||||||||||||
| expiration date 5/31/16 | 49 | 0.04 | 91,245 | 2,473,098 | ||||||||||||
| expiration date 6/30/16 | 49 | 0.10 | 207,031 | 2,513,847 | ||||||||||||
| expiration date 7/29/16 | 48 | 0.13 | 281,711 | 2,502,864 | ||||||||||||
| expiration date 8/31/16 | 48 | 0.13 | 283,298 | 2,547,216 | ||||||||||||
| Platinum | ||||||||||||||||
| expiration date 7/27/16 | 128 | 0.16 | 349,265 | 6,256,000 | ||||||||||||
| expiration date 10/27/16 | 127 | 0.08 | 162,000 | 6,218,555 | ||||||||||||
See accompanying notes to unaudited consolidated financial statements
| 12 |
WisdomTree Continuous Commodity Index Master Fund
Unaudited Consolidated Schedule of Investments (continued)
March 31, 2016
| Description | Contracts | Unrealized Appreciation/ (Depreciation) Percentage of Net Assets | Unrealized Appreciation/ (Depreciation) | Notional Value | ||||||||||||
| Silver | ||||||||||||||||
| expiration date 5/26/16 | 54 | 0.09 | % | $ | 199,055 | $ | 4,175,280 | |||||||||
| expiration date 7/27/16 | 54 | 0.14 | 287,145 | 4,185,540 | ||||||||||||
| expiration date 9/28/16 | 53 | (0.01 | ) | (11,955 | ) | 4,117,570 | ||||||||||
| Soybean | ||||||||||||||||
| expiration date 5/13/16 | 91 | 0.04 | 89,888 | 4,143,912 | ||||||||||||
| expiration date 7/14/16 | 91 | 0.09 | 193,550 | 4,175,762 | ||||||||||||
| expiration date 8/12/16 | 91 | 0.09 | 190,600 | 4,188,275 | ||||||||||||
| Soybean Oil | ||||||||||||||||
| expiration date 5/13/16 | 121 | 0.18 | 378,450 | 2,484,372 | ||||||||||||
| expiration date 7/14/16 | 121 | 0.19 | 401,934 | 2,500,344 | ||||||||||||
| expiration date 8/12/16 | 121 | 0.14 | 303,822 | 2,506,878 | ||||||||||||
| expiration date 9/14/16 | 121 | 0.10 | 207,912 | 2,514,138 | ||||||||||||
| expiration date 10/14/16 | 120 | 0.10 | 210,660 | 2,496,960 | ||||||||||||
| Sugar No. 11 | ||||||||||||||||
| expiration date 4/29/16 | 240 | 0.18 | 392,851 | 4,126,080 | ||||||||||||
| expiration date 6/30/16 | 240 | 0.17 | 350,358 | 4,152,960 | ||||||||||||
| expiration date 9/30/16 | 239 | 0.25 | 528,248 | 4,178,485 | ||||||||||||
| Wheat | ||||||||||||||||
| expiration date 5/13/16 | 173 | (0.08 | ) | (165,063 | ) | 4,095,775 | ||||||||||
| expiration date 7/14/16 | 173 | (0.05 | ) | (100,438 | ) | 4,158,487 | ||||||||||
| expiration date 9/14/16 | 173 | 0.05 | 112,650 | 4,240,662 | ||||||||||||
| WTI Crude Oil | ||||||||||||||||
| expiration date 4/20/16 | 62 | 0.05 | 97,410 | 2,377,080 | ||||||||||||
| expiration date 5/20/16 | 62 | 0.06 | 125,690 | 2,464,500 | ||||||||||||
| expiration date 6/21/16 | 62 | 0.10 | 221,980 | 2,522,780 | ||||||||||||
| expiration date 7/20/16 | 62 | 0.16 | 335,130 | 2,564,320 | ||||||||||||
| expiration date 8/22/16 | 62 | 0.15 | 320,040 | 2,597,800 | ||||||||||||
| Total | 2.76 | % | $ | 5,868,632 | $ | 212,275,065 | ||||||||||
| * | Denotes greater than 0.000% yet less than 0.005% |
See accompanying notes to unaudited consolidated financial statements
| 13 |
WisdomTree Continuous Commodity Index Master Fund
Consolidated Schedule of Investments
December 31, 2015
| Description | Percentage of Net Assets | Fair Value | Face Amount | |||||||||
| U.S. Treasury Obligations | ||||||||||||
| U.S. Treasury Bills | ||||||||||||
| 0.17%, 1/28/16 | 22.27 | % | $ | 49,995,900 | $ | 50,000,000 | ||||||
| 0.14%, 2/11/16 | 22.27 | 49,993,400 | 50,000,000 | |||||||||
| 0.28%, 3/17/16 | 22.26 | 49,990,700 | 50,000,000 | |||||||||
| Total U.S. Treasury Obligations ($149,963,671) | 66.80 | % | $ | 149,980,000 | $ | 150,000,000 | ||||||
| Description | Contracts | Unrealized Appreciation/ (Depreciation) Percentage of Net Assets | Unrealized Appreciation/ (Depreciation) | Notional Value | ||||||||||||
| Futures Contracts Long | ||||||||||||||||
| Cocoa | ||||||||||||||||
| expiration date 3/15/16 | 137 | 0.05 | % | $ | 119,700 | $ | 4,399,070 | |||||||||
| expiration date 5/13/16 | 137 | 0.05 | 113,380 | 4,393,590 | ||||||||||||
| expiration date 7/14/16 | 138 | (0.05 | ) | (119,940 | ) | 4,420,140 | ||||||||||
| Coffee “C” | ||||||||||||||||
| expiration date 3/18/16 | 91 | (0.05 | ) | (118,144 | ) | 4,323,638 | ||||||||||
| expiration date 5/18/16 | 91 | (0.04 | ) | (96,862 | ) | 4,395,300 | ||||||||||
| expiration date 7/19/16 | 91 | 0.12 | 267,150 | 4,461,844 | ||||||||||||
| Copper | ||||||||||||||||
| expiration date 3/29/16 | 82 | (0.14 | ) | (309,850 | ) | 4,376,750 | ||||||||||
| expiration date 5/26/16 | 82 | (0.15 | ) | (338,513 | ) | 4,390,075 | ||||||||||
| expiration date 7/27/16 | 82 | (0.04 | ) | (81,925 | ) | 4,400,325 | ||||||||||
| Corn | ||||||||||||||||
| expiration date 3/14/16 | 242 | (0.13 | ) | (301,212 | ) | 4,340,875 | ||||||||||
| expiration date 5/13/16 | 242 | (0.14 | ) | (315,375 | ) | 4,410,450 | ||||||||||
| expiration date 7/14/16 | 241 | (0.05 | ) | (114,900 | ) | 4,464,525 | ||||||||||
| Cotton No. 2 | ||||||||||||||||
| expiration date 3/8/16 | 138 | (0.02 | ) | (35,815 | ) | 4,366,320 | ||||||||||
| expiration date 5/6/16 | 137 | (0.01 | ) | (12,455 | ) | 4,391,535 | ||||||||||
| expiration date 7/7/16 | 137 | 0.04 | 97,490 | 4,438,115 | ||||||||||||
| Gold 100 Ounce | ||||||||||||||||
| expiration date 2/25/16 | 42 | (0.18 | ) | (401,480 | ) | 4,452,840 | ||||||||||
| expiration date 4/27/16 | 41 | (0.09 | ) | (211,170 | ) | 4,349,280 | ||||||||||
| expiration date 6/28/16 | 41 | (0.05 | ) | (104,370 | ) | 4,352,150 | ||||||||||
| Lean Hogs | ||||||||||||||||
| expiration date 2/12/16 | 117 | (0.11 | ) | (239,750 | ) | 2,798,640 | ||||||||||
| expiration date 4/14/16 | 117 | (0.07 | ) | (148,820 | ) | 3,086,460 | ||||||||||
| expiration date 6/14/16 | 117 | 0.10 | 220,880 | 3,650,400 | ||||||||||||
| expiration date 7/15/16 | 117 | 0.08 | 185,740 | 3,643,380 | ||||||||||||
| Live Cattle | ||||||||||||||||
| expiration date 2/29/16 | 82 | (0.09 | ) | (204,150 | ) | 4,487,040 | ||||||||||
| expiration date 4/29/16 | 82 | (0.04 | ) | (86,140 | ) | 4,525,580 | ||||||||||
| expiration date 6/30/16 | 82 | 0.06 | 132,670 | 4,191,840 | ||||||||||||
| Natural Gas | ||||||||||||||||
| expiration date 1/27/16 | 111 | (0.18 | ) | (395,510 | ) | 2,594,070 | ||||||||||
| expiration date 2/25/16 | 110 | (0.14 | ) | (318,070 | ) | 2,599,300 | ||||||||||
| expiration date 3/29/16 | 110 | (0.11 | ) | (238,510 | ) | 2,625,700 | ||||||||||
| expiration date 4/27/16 | 110 | (0.02 | ) | (39,980 | ) | 2,666,400 | ||||||||||
| expiration date 5/26/16 | 110 | (0.02 | ) | (46,190 | ) | 2,714,800 | ||||||||||
| NY Harbor ULSD | ||||||||||||||||
| expiration date 1/29/16 | 54 | (0.38 | ) | (848,266 | ) | 2,549,005 | ||||||||||
| expiration date 2/29/16 | 54 | (0.35 | ) | (789,184 | ) | 2,605,705 | ||||||||||
| expiration date 3/31/16 | 54 | (0.32 | ) | (719,783 | ) | 2,647,436 | ||||||||||
| expiration date 4/29/16 | 53 | (0.25 | ) | (556,471 | ) | 2,649,163 | ||||||||||
| expiration date 5/31/16 | 53 | (0.24 | ) | (551,179 | ) | 2,705,480 | ||||||||||
| Platinum | ||||||||||||||||
| expiration date 4/27/16 | 147 | (0.11 | ) | (254,960 | ) | 6,565,020 | ||||||||||
| expiration date 7/27/16 | 148 | 0.06 | 126,785 | 6,615,600 | ||||||||||||
See accompanying notes to unaudited consolidated financial statements
| 14 |
WisdomTree Continuous Commodity Index Master Fund
Consolidated Schedule of Investments (continued)
December 31, 2015
| Description | Contracts | Unrealized Appreciation/ (Depreciation) Percentage of Net Assets | Unrealized Appreciation/ (Depreciation) | Notional Value | ||||||||||||
| Silver | ||||||||||||||||
| expiration date 3/29/16 | 64 | (0.18 | )% | $ | (414,395 | ) | $ | 4,416,960 | ||||||||
| expiration date 5/26/16 | 64 | (0.17 | ) | (374,635 | ) | 4,426,880 | ||||||||||
| expiration date 7/27/16 | 63 | (0.07 | ) | (151,495 | ) | 4,368,105 | ||||||||||
| Soybean | ||||||||||||||||
| expiration date 3/14/16 | 101 | (0.10 | ) | (231,875 | ) | 4,364,463 | ||||||||||
| expiration date 5/13/16 | 101 | (0.10 | ) | (221,537 | ) | 4,390,975 | ||||||||||
| expiration date 7/14/16 | 101 | 0.01 | 24,500 | 4,427,587 | ||||||||||||
| Soybean Oil | ||||||||||||||||
| expiration date 3/14/16 | 237 | 0.12 | 277,464 | 4,372,650 | ||||||||||||
| expiration date 5/13/16 | 237 | 0.13 | 288,294 | 4,402,512 | ||||||||||||
| expiration date 7/14/16 | 237 | 0.18 | 391,830 | 4,433,796 | ||||||||||||
| Sugar No. 11 | ||||||||||||||||
| expiration date 2/29/16 | 263 | 0.27 | 600,074 | 4,489,094 | ||||||||||||
| expiration date 4/29/16 | 264 | 0.26 | 591,270 | 4,411,546 | ||||||||||||
| expiration date 6/30/16 | 264 | 0.06 | 126,717 | 4,328,755 | ||||||||||||
| Wheat | ||||||||||||||||
| expiration date 3/14/16 | 185 | (0.14 | ) | (314,138 | ) | 4,347,500 | ||||||||||
| expiration date 5/13/16 | 185 | (0.13 | ) | (298,525 | ) | 4,407,625 | ||||||||||
| expiration date 7/14/16 | 184 | (0.07 | ) | (160,687 | ) | 4,445,900 | ||||||||||
| WTI Crude Oil | ||||||||||||||||
| expiration date 1/20/16 | 68 | (0.22 | ) | (502,660 | ) | 2,518,720 | ||||||||||
| expiration date 2/22/16 | 68 | (0.22 | ) | (492,250 | ) | 2,595,560 | ||||||||||
| expiration date 3/21/16 | 68 | (0.20 | ) | (445,480 | ) | 2,660,840 | ||||||||||
| expiration date 4/20/16 | 67 | (0.15 | ) | (334,250 | ) | 2,678,660 | ||||||||||
| expiration date 5/20/16 | 67 | (0.15 | ) | (329,010 | ) | 2,727,570 | ||||||||||
| Total | (3.88 | )% | $ | (8,705,967 | ) | $ | 224,263,539 | |||||||||
See accompanying notes to unaudited consolidated financial statements
| 15 |
WisdomTree Continuous Commodity Index Master Fund
Unaudited Consolidated Statements of Income and Expenses
For the Three Months Ended March 31, 2016 and 2015
| 2016 | 2015 | |||||||
| Income: | ||||||||
| Interest income | $ | 89,300 | $ | 10,326 | ||||
| Expenses: | ||||||||
| Management fee to related party | 447,661 | 534,030 | ||||||
| Brokerage fees and expenses | 105,332 | 125,654 | ||||||
| Total expenses | 552,993 | 659,684 | ||||||
| Net investment loss | (463,693 | ) | (649,358 | ) | ||||
| Realized and Net Change in Unrealized Gain (Loss) on Investments and Futures Contracts: | ||||||||
| Net Realized Gain (Loss) from: | ||||||||
| Futures Contracts | (12,473,222 | ) | (28,433,985 | ) | ||||
| Net Realized Loss | (12,473,222 | ) | (28,433,985 | ) | ||||
| Net Change in Unrealized Gain (Loss) from: | ||||||||
| Investments | 15,864 | 1,521 | ||||||
| Futures Contracts | 14,574,599 | 10,547,678 | ||||||
| Net Change in Unrealized Gain (Loss) | 14,590,463 | 10,549,199 | ||||||
| Net Realized and Unrealized Gain (Loss) on Investments and Futures Contracts | 2,117,241 | (17,884,786 | ) | |||||
| Net Gain (Loss) | $ | 1,653,548 | $ | (18,534,144 | ) | |||
See accompanying notes to unaudited consolidated financial statements
| 16 |
WisdomTree Continuous Commodity Index Master Fund
Unaudited Consolidated Statement of Changes in Shareholders’ Equity
For the Three Months Ended March 31, 2016
| General Units | Limited Units | Total | ||||||||||||||||||||||||||||||||||
| General Units | Accumulated | Total General Shareholders’ | Limited Units | Accumulated | Total Limited Shareholders’ | Total Shareholders’ | ||||||||||||||||||||||||||||||
| Units | Amount | Deficit | Equity | Units | Amount | Deficit | Equity | Equity | ||||||||||||||||||||||||||||
| Balance at December 31, 2015 | 50 | $ | 1,500 | $ | (572 | ) | $ | 928 | 12,100,000 | $ | 360,079,849 | $ | (135,562,252 | ) | $ | 224,517,597 | $ | 224,518,525 | ||||||||||||||||||
| Creation of Limited Units | — | — | — | — | — | — | — | — | — | |||||||||||||||||||||||||||
| Redemption of Limited Units | — | — | — | — | (750,000 | ) | (13,615,107 | ) | — | (13,615,107 | ) | (13,615,107 | ) | |||||||||||||||||||||||
| Net Gain (Loss): | ||||||||||||||||||||||||||||||||||||
| Net Investment Gain (loss) | — | — | (3 | ) | (3 | ) | — | — | (463,690 | ) | (463,690 | ) | (463,693 | ) | ||||||||||||||||||||||
| Net Realized Gain (loss) from Investments and Futures Contracts | — | — | (49 | ) | (49 | ) | — | — | (12,473,173 | ) | (12,473,173 | ) | (12,473,222 | ) | ||||||||||||||||||||||
| Net Change in Unrealized Gain (loss) from Investments and Futures Contracts | — | — | 58 | 58 | — | — | 14,590,405 | 14,590,405 | 14,590,463 | |||||||||||||||||||||||||||
| Net Gain | — | — | 6 | 6 | — | — | 1,653,542 | 1,653,542 | 1,653,548 | |||||||||||||||||||||||||||
| Balance at March 31, 2016 | 50 | $ | 1,500 | $ | (566 | ) | $ | 934 | 11,350,000 | $ | 346,464,742 | $ | (133,908,710 | ) | $ | 212,556,032 | $ | 212,556,966 | ||||||||||||||||||
See accompanying notes to unaudited consolidated financial statements
| 17 |
WisdomTree Continuous Commodity Index Master Fund
Unaudited Consolidated Statements of Cash Flows
For the Three Months Ended March 31, 2016 and 2015
| 2016 | 2015 | |||||||
| Cash flows from operating activities | ||||||||
| Net Gain (Loss) | $ | 1,653,548 | $ | (18,534,144 | ) | |||
| Adjustments to reconcile net gain (loss) to net cash provided by (used for) operating activities: | ||||||||
| Purchases of investment securities | (174,877,226 | ) | (199,989,853 | ) | ||||
| Proceeds from sales of investment securities | 150,000,000 | 200,000,000 | ||||||
| Net accretion of discount | (89,300 | ) | (10,326 | ) | ||||
| Change in net unrealized depreciation (appreciation) on investments | (15,864 | ) | (1,521 | ) | ||||
| Changes in assets and liabilities | ||||||||
| (Increase)/Decrease in assets: | ||||||||
| Net unrealized appreciation on futures contracts | (5,868,632 | ) | — | |||||
| Increase/(Decrease) in liabilities: | ||||||||
| Net unrealized depreciation on futures contracts | (8,705,967 | ) | (10,547,678 | ) | ||||
| Management fee payable to related party | (13,098 | ) | (27,957 | ) | ||||
| Accrued brokerage fees and expenses payable | 34,545 | 45,080 | ||||||
| Net cash used for operating activities | (37,881,994 | ) | (29,066,399 | ) | ||||
| Cash flows from financing activities | ||||||||
| Proceeds from creation of Limited Units | — | 5,487,716 | ||||||
| Additional capital contribution | — | (10,086,172 | ) | |||||
| Redemption of Limited Units | (13,615,107 | ) | — | |||||
| Net cash provided by (used for) financing activities | (13,615,107 | ) | (4,598,456 | ) | ||||
| Net increase (decrease) in cash | (51,497,101 | ) | (33,664,855 | ) | ||||
| Cash* at beginning of period | 83,440,007 | 94,433,074 | ||||||
| Cash* at end of period | $ | 31,942,906 | $ | 60,768,219 | ||||
* Includes cash held by the broker for futures contracts.
| 18 |
| WisdomTree Continuous Commodity Index Fund |
| WisdomTree Continuous Commodity Index Master Fund |
| Notes to Consolidated Financial Statements |
| March 31, 2016 |
(1) Organization
The WisdomTree Continuous Commodity Index Fund (the “Fund”; “Fund” may also refer to the Fund and the Master Fund (as defined below), collectively as the context requires) was formed as a Delaware statutory trust on October 27, 2006, and WisdomTree Continuous Commodity Index Master Fund (the “Master Fund”), was formed as a Delaware statutory trust on October 27, 2006. WisdomTree Commodity Services, LLC (the “Managing Owner”) serves the Fund as commodity pool operator and managing owner.
Effective January 1, 2016, in accordance with the terms of a Unit Purchase Agreement dated October 29, 2015, GreenHaven LLC sold 100% of the issued and outstanding membership interest in the Managing Owner to WisdomTree Investments Inc. Following the sale, the name of the Fund was changed from “GreenHaven Continuous Commodity Index Fund” to “WisdomTree Continuous Commodity Index Fund,” the name of the Master Fund was changed from “GreenHaven Continuous Commodity Index Master Fund” to “WisdomTree Continuous Commodity Index Master Fund,” and the name of the Managing Owner was changed from “GreenHaven Commodity Services LLC” to “WisdomTree Commodity Services LLC.” As of January 1, 2016, the Fund’s Sub-Advisor and commodity trading advisor is GreenHaven Advisors LLC.
The Fund offers common units of beneficial interest (the “Shares”). Upon inception of the Fund, 50 General Units of the Fund were issued to the Managing Owner in exchange for a capital contribution of $1,500.
The proceeds from the offering of Shares are invested in the Master Fund (See Note 7 for details of the procedures for creation and redemption of Shares in the Fund). The Master Fund actively trades exchange traded futures on the commodities comprising the Thomson Reuters Continuous Commodity Index (the “Index”), with a view to tracking the performance of the Index over time. The Master Fund’s Portfolio also includes United States Treasury securities and other high credit-quality, short-term fixed income securities for deposit with the Master Fund’s commodity broker as margin. The Fund wholly owns the Master Fund. The Fund and Master Fund commenced investment operations on January 23, 2008 with the offering of 350,000 Shares in exchange for $10,500,000. The Fund commenced trading on the American Stock Exchange (now known as the NYSE Arca) on January 24, 2008 and, as of November 25, 2008, was listed on the NYSE Arca.
The Index is intended to reflect the performance of certain commodities. Through January 6, 2013, the commodities comprising the Index (the “Index Commodities”) were: corn, soybeans, wheat, live cattle, lean hogs, gold, silver, copper, cocoa, coffee, sugar, cotton, orange juice, platinum, crude oil, NY Harbor ULSD (formerly known as heating oil), and natural gas. The Index was revised on January 7, 2013 to include soybean oil and remove orange juice.
The Managing Owner and the Shareholders share in any profits and losses attributable to the Fund in proportion to the percentage interest owned by each.
The Managing Owner, the Fund, and the Master Fund retain the services of third party service providers for the ongoing operations of the Fund and the Master Fund. (See Note (2)).
In accordance with Accounting Standard Update (“ASU”) 2013-08, Financial Service-Investment Companies, the Fund qualifies as an investment company and is applying the accounting and reporting guidance for investment companies.
Unaudited Interim Financial Information
The financial statements as of March 31, 2016 and for the three-months ended March 31, 2016 and 2015 included herein are unaudited. In the opinion of the Managing Owner, the unaudited financial statements have been prepared on the same basis as the annual financial statements and include all adjustments, which are of the normal recurring nature, necessary for a fair statement of the Fund’s financial position, investments, results of operations and its cash flows. Interim results are not necessarily indicative of the results that will be achieved for the year or for any other interim period or for any future year.
(2) Service Providers and Related Party Agreements
(a) “The Trustee” – CSC Trust is the trustee for the Fund and Master Fund. CSC Trust is headquartered in Wilmington, Delaware.
(b) “The Managing Owner” – WisdomTree Commodity Services, LLC (f/k/a GreenHaven Commodity Services, LLC) is the managing owner of the Fund and Master Fund and is responsible for the day to day operations of both entities. The Managing Owner charges the Fund a management fee for its services. The Managing Owner is a Delaware limited liability company with operations in New York, New York.
| 19 |
(c) “The Administrator” —State Street Bank and Trust Company is the Fund’s Administrator. The Administrator performs or supervises the services necessary for the operation and administration of the Fund (other than making investment decisions) in accordance with various services agreements entered into with the Fund. These services include calculating the daily NAV of the Fund (the “Net Asset Value”), accounting and other Fund administrative services. As the Fund’s transfer agent, the Administrator processes additions and redemptions of Shares. These transactions are processed on Depository Trust Company’s (“DTC”) book entry system. The Administrator retains certain financial books and records, including: Basket creation and redemption books and records, fund accounting records, ledgers with respect to assets, liabilities, capital, income and expenses, the registrar, transfer journals and related details and trading and related documents received from futures commission merchants. State Street Bank and Trust Company has an office in Boston, Massachusetts.
(d) “Commodity Broker” — Morgan Stanley & Co. LLC (“MS&Co.”) is the Master Fund’s Commodity Broker. In its capacity as the Commodity Broker, it executes and clears each of the Master Fund’s futures transactions and performs certain administrative services for the Master Fund. MS&Co. is based in New York, New York.
(e) “The Distributor” — Foreside Fund Services LLC (“FFS”) is the Fund’s Distributor. The Fund’s Distributor assists the Managing Owner and the Administrator with certain functions and duties relating to the creation and redemption of Baskets, including receiving and processing orders from Authorized Participants to create and redeem Baskets, coordinating the processing of such orders and related functions and duties. FFS has an office in Portland, Maine.
(f) “Authorized Participant” — Authorized Participants may create or redeem shares of the Fund. Each Authorized Participant must (1) be a registered broker-dealer or other securities market participant such as a bank or other financial institution which is not required to register as a broker-dealer to engage in securities transactions, (2) be a participant in the DTC, and (3) have entered into a Participant Agreement with the Fund and the Managing Owner. The Participant Agreement sets forth the procedures for the creation and redemption of Baskets of Shares and for the delivery of cash required for such creations or redemptions. The current Authorized Participants are J.P. Morgan Securities LLC, Merrill Lynch Professional Clearing Corporation, Morgan Stanley & Co. Incorporated, and RBC Capital Markets, LLC. A similar agreement between the Fund and the Master Fund sets forth the procedures for the creation and redemption of Baskets of Master Units.
(3) Summary of Significant Accounting Policies
(a) Use of Estimates
The preparation of the financial statements in conformity with accounting principles generally accepted in the United States of America requires management to make estimates and assumptions that affect the reported amounts of assets and liabilities, disclosure of contingent assets and liabilities at the date of the financial statements, and the reported amounts of income and expenses during the period. Actual results could differ from those estimates.
(b) Cash Held by Broker
The Fund defines cash held by broker to be cash and highly liquid investments with remaining maturities of three months or less when acquired. MS&Co. allows the Master Fund to apply its Treasury Bill portfolio towards its initial margin requirement for the Master Fund’s futures positions, hence all cash held by broker is unrestricted cash. The cash and Treasury Bill positions are held in segregated accounts at MS&Co. and are not insured by the Federal Deposit Insurance Corporation.
(c) U.S. Treasury Obligations
The Master Fund records purchases and sales of U.S. Treasury Obligations on a trade date basis. These holdings are marked to market based on quotations from broker-dealers or independent service providers. The Master Fund holds U.S. Treasury Obligations for deposit with the Commodity Broker as margin for trading and holding against initial margin of the open futures contracts. Interest income is recognized on an accrual basis when earned. Premiums and discounts are amortized or accreted over the life of the U.S. Treasury Obligations.
(d) Income Taxes
The Fund and Master Fund are classified as a grantor trust and a partnership respectively, for U.S. federal income tax purposes. Accordingly, neither the Fund nor the Master Fund is subject to U.S. federal, state, or local income taxes. Accordingly, no provision for federal, state, or local income taxes has been made in the accompanying consolidated financial statements, as investors are individually liable for income taxes, if any, on their allocable share of the Fund’s share of the Master Fund’s income, gain, loss, deductions and other items.
The Fund accounts for uncertainty in income taxes pursuant to the applicable accounting standard, which provides measurement, presentation and disclosure guidance related to uncertain tax positions. The guidance addresses how tax benefits claimed or expected to be claimed on a tax return should be recorded in the financial statements. Under this topic, the Fund may recognize the tax benefit from an uncertain tax position only if it is more likely than not that the tax position will be sustained on examination by the taxing authorities based on the technical merits of the position. The tax benefits recognized in the financial statements from such a position are measured based on the largest benefit that has a greater than fifty percent likelihood of being realized upon ultimate resolution.
| 20 |
(e) Futures Contracts
The Master Fund purchases and holds commodity futures contracts for investment purposes. These contracts are recorded on a trade date basis and open contracts are valued daily at settlement prices provided by the relevant exchanges. In the Consolidated Statement of Financial Condition, futures contracts are presented at their published settlement prices on the last business day of the period, in accordance with the fair value accounting standard. Since these contracts are actively traded in markets that are directly observable and which provide readily available price quotes, their market value is deemed to be their fair value under the fair value accounting standard. (See Note 4 — Fair Value Measurements).
However, when market closing prices are not available, the Managing Owner may value an asset of the Master Fund pursuant to such other principles as the Managing Owner deems fair and equitable provided such principles are consistent with the fair value accounting standard. Realized gains (losses) and changes in unrealized appreciation (depreciation) on open positions are determined on a specific identification basis and recognized in the Consolidated Statements of Income and Expenses in the period in which the contract is closed or the changes occur, respectively.
(f) Basis of Presentation and Consolidation
All of the capital raised by the Fund is used to purchase common units of beneficial interest of the Master Fund. The financial statement balances of the Master Fund are consolidated with the Fund’s financial statement balances and all significant inter-company balances and transactions are eliminated. Separate financial statements of the Master Fund are presented to comply with SEC reporting requirements as the Master Fund is a separate SEC registrant.
(g) Subsequent Events
For purposes of disclosure in the consolidated financial statements, the Fund has evaluated events occurring between the period ended March 31, 2016 and when the financial statements were issued.
During that period, 50,000 Limited Shares were created resulting in 11,400,000 Limited Shares outstanding.
Other than this event, the evaluation did not result in any subsequent events that necessitated disclosures and/or adjustments.
(4) Fair Value Measurements
The guidance for fair value measurements establishes the authoritative definition for fair value, sets out a framework for measuring fair value and outlines the required disclosures regarding fair value measurements. Fair value is the price that would be received to sell an asset or paid to transfer a liability (an exit price) in the principal or most advantageous market for the asset or liability in an orderly transaction between market participants at the measurement date. The Fund uses a three-tier fair value hierarchy based upon observable and unobservable inputs as follows:
Level 1 — Quoted prices (unadjusted) in active markets for identical assets or liabilities that the reporting entity can access at the measurement date.
Level 2 — Inputs other than quoted prices included within Level 1 that are observable for the asset or liability, either directly or indirectly.
Level 3 — Unobservable inputs for the asset or liability.
| 21 |
The inputs or methodology used for valuing securities are not necessarily an indication of the risk associated with investing in those securities. The assets of the Fund are either exchange-traded securities that are valued at the official closing price on the exchange where they are principally traded or U.S. government securities that are valued using dealer and broker quotations or other inputs that are observable or can be corroborated by observable market data. A summary of the Fund’s assets and liabilities at fair value as of March 31, 2016, classified according to the levels used to value them, is as follows:
| Assets | Quoted Prices in Active Market (Level 1) | Other Significant Observable Inputs (Level 2) | Significant Unobservable Inputs (Level 3) | Totals | ||||||||||||
| U.S. Treasury Obligations | $ | — | $ | 174,962,390 | $ | — | $ | 174,962,390 | ||||||||
| Unrealized appreciation on futures contracts | 5,868,632 | — | — | 5,868,632 | ||||||||||||
| Total | $ | 5,868,632 | $ | 174,962,390 | $ | — | $ | 180,831,022 | ||||||||
There were no transfers between Level 1 and Level 2 for the Fund during the three months ended March 31, 2016. The Fund did not hold any Level 3 securities during the three months ended March 31, 2016.
A summary of the Fund’s assets and liabilities at fair value as of December 31, 2015, classified according to the levels used to value them, is as follows:
| Assets | Quoted Prices in Active Market (Level 1) | Other Significant Observable Inputs (Level 2) | Significant Unobservable Inputs (Level 3) | Totals | ||||||||||||
| U.S. Treasury Obligations | $ | — | $ | 149,980,000 | $ | — | $ | 149,980,000 | ||||||||
Liabilities | ||||||||||||||||
| Unrealized depreciation on futures contracts | (8,705,967 | ) | — | — | (8,705,967 | ) | ||||||||||
| Total | $ | (8,705,967 | ) | $ | 149,980,000 | $ | — | $ | 141,274,033 | |||||||
There were no transfers between Level 1 and Level 2 for the Fund during the year ended December 31, 2015. The Fund did not hold any Level 3 securities during the year ended December 31, 2015.
(5) Derivative Instruments and Hedging Activities
The Fund uses derivative instruments as part of its principal investment strategy to achieve its investment objective. As of March 31, 2016, the Fund was invested in commodity futures contracts. For the three months ended March 31, 2016 and year ended December 31, 2015, the volume of derivative activity (based on average month-end notional amounts) were $213,886,138 and $247,056,205, respectively.
At March 31, 2016, the fair value of derivative instruments was as follows:
| Derivative Instruments | Asset Derivatives (i) | Liability Derivatives | ||||||
| Commodity Futures Contracts | $ | 5,868,632 | $ | — | ||||
| (i) | Values are disclosed on the March 31, 2016 Consolidated Statements of Financial Condition under unrealized appreciation on futures contracts. |
The following is a summary of the realized and unrealized gains and losses of the derivative instruments utilized by the Fund for the three months ended March 31, 2016:
| Derivative Instruments | Consolidated Statements of Income and Expenses Location | Realized Loss on Derivative Instruments | Net Change in Unrealized (Gain) Loss on Derivative Instruments | |||||||
| Commodity Futures Contracts | Net realized gain (loss) from futures contracts | $ | (12,473,222 | ) | ||||||
| Net change in unrealized gain (loss) from futures contracts | $ | 14,574,599 | ||||||||
At December 31, 2015, the fair value of derivative instruments was as follows:
| Derivative Instruments | Asset Derivatives | Liability Derivatives (ii) | ||||||
| Commodity Futures Contracts | $ | — | $ | 8,705,967 | ||||
| (ii) | Values are disclosed on the December 31, 2015 Consolidated Statements of Financial Condition under unrealized depreciation on futures contracts. |
| 22 |
The following is a summary of the realized and unrealized gains and losses of the derivative instruments utilized by the Fund for the three months ended March 31, 2015.
| Derivative Instruments | Consolidated Statements of Income and Expenses Location | Realized Loss on Derivative Instruments | Net Change in Unrealized (Gain) Loss on Derivative Instruments | |||||||
| Commodity Futures Contracts | Net realized gain (loss) from futures contracts | $ | (28,433,985 | ) | ||||||
| Net change in unrealized gain (loss) from futures contracts | $ | 10,547,678 | ||||||||
(6) Financial Instrument Risk
In the normal course of its business, the Fund may be party to financial instruments with off-balance sheet risk. The term “off-balance sheet risk” refers to an unrecorded potential liability that, even though it does not appear on the balance sheet, may result in a future obligation or loss. The financial instruments used by the Fund are commodity futures, whose values are based upon an underlying asset and generally represent future commitments which have a reasonable possibility to be settled in cash or through physical delivery. These instruments are traded on an exchange and are standardized contracts.
Market risk is the potential for changes in the value of the financial instruments traded by the Fund due to market changes, including fluctuations in commodity prices. In entering into these contracts, there exists a market risk that such contracts may be significantly influenced by conditions, resulting in such contracts being less valuable. If the markets should move against all of the futures interest positions at the same time, and the Managing Owner was unable to offset such positions, the Fund could experience substantial losses.
Credit risk is the possibility that a loss may occur due to the failure of an exchange clearinghouse to perform according to the terms of a contract. Credit risk with respect to exchange-traded instruments is reduced to the extent that an exchange or clearing organization acts as counterparty to the transactions. The Fund’s risk of loss in the event of counterparty default is typically limited to the amounts recognized in the Consolidated Statement of Financial Condition and not represented by the contract or notional amounts of the instruments.
The Fund and the Master Fund have not utilized, nor do they expect to utilize in the future, special purpose entities to facilitate off-balance sheet financing arrangements and has no loan guarantee arrangements or off-balance sheet arrangements of any kind other than agreements entered into in the normal course of business.
(7) Share Creations and Redemptions
(a) Creation of Shares
General. On any business day, an Authorized Participant may place an order with the Fund’s Distributor (as facilitated by the Fund’s Administrator) to create one or more Baskets. For purposes of processing both purchase and redemption orders, a “business day” means any day when NYSE Arca is open for regular trading. Purchase orders must be placed by 10:00 a.m., New York time. The day on which a valid purchase order is received is the purchase order date. Purchase orders are irrevocable. By placing a purchase order, and prior to delivery of such Baskets, an Authorized Participant’s DTC account will be charged the non-refundable transaction fee due for the purchase order.
Determination of Required Payment. The total payment required to create each Basket is the Net Asset Value of 50,000 Shares as of the closing time of NYSE Arca or the last to close of the exchanges on which the Index Commodities are traded, whichever is later, on the purchase order date. Baskets will be issued as of 12:00 p.m., New York time, on the business day immediately following the purchase order date at Net Asset Value per Share as of the closing time of NYSE Arca or the last to close of the exchanges on which the Index Commodities are traded, whichever is later, on the purchase order date during the continuous offering period, but only if the required payment has been timely received.
Because orders to create Baskets must be placed by 10:00 a.m., New York time, but the total payment required to create a Basket during the continuous offering period will not be determined until 4:00 p.m., New York time, on the date the purchase order is received, Authorized Participants will not know the total amount of the payment required to create a Basket at the time they submit an irrevocable purchase order for the Basket. The Fund’s Net Asset Value and the total amount of the payment required to create a Basket could rise or fall substantially between the time an irrevocable purchase order is submitted and the time the amount of the purchase price in respect thereof is determined.
Rejection of Purchase Orders. The Administrator may reject a creation order if:
(i) it determines that the purchase order is not in proper form;
(ii) the Managing Owner believes that the purchase order would have adverse tax consequences to the Fund or its Shareholders; or
| 23 |
(iii) circumstances outside the control of the Managing Owner or the Distributor make it, for all practical purposes, not feasible to process creations of Baskets.
The Distributor and the Managing Owner will not be liable for the rejection of any purchase order.
(b) Redemption of Shares
General. The procedures by which an Authorized Participant can redeem one or more Baskets mirror the procedures for the creation of Baskets. On any business day, an Authorized Participant may place an order with the Distributor (as facilitated by the Administrator) to redeem one or more Baskets. Redemption orders must be placed by 10:00 a.m., New York time. The day on which a valid redemption order is received in proper form is the redemption order date. Redemption orders are irrevocable. Individual Shareholders may not redeem directly from the Fund.
By placing a redemption order, an Authorized Participant agrees to deliver the Baskets to be redeemed through DTC’s book-entry system to the Fund not later than 12:00pm, New York time, on the business day immediately following the redemption order date. By placing a redemption order, and prior to receipt of the redemption proceeds, an Authorized Participant’s DTC account will be charged the non-refundable transaction fee due for the redemption order.
Determination of Required Payment. The redemption proceeds from the Fund consist of the cash redemption amount equal to the Net Asset Value of the number of Basket(s) requested in the Authorized Participant’s redemption order as of the closing time of the NYSE Arca or the last to close of the exchanges on which the Index Commodities are traded, whichever is later, on the redemption order date. The Managing Owner will distribute the cash redemption amount at 12:00 p.m., New York time, on the business day immediately following the redemption order date through DTC to the account of the Authorized Participant as recorded on DTC’s book entry system.
Delivery of Redemption Proceeds. The redemption proceeds due from the Fund are delivered to the Authorized Participant at 12:00pm, New York time, on the business day immediately following the redemption order date if, by such time, the Fund’s DTC account has been credited with the Baskets to be redeemed. If the Fund’s DTC account has not been credited with all of the Baskets to be redeemed by such time, the redemption distribution is delivered to the extent of whole Baskets received. Any remainder of the redemption distribution is delivered on the next business day to the extent of remaining whole Baskets received if the Distributor receives the fee applicable to the extension of the redemption distribution date which the Distributor may, from time-to-time, determine and the remaining Baskets to be redeemed are credited to the Fund’s DTC account by 12:00pm, New York time, on such next business day. Any further outstanding amount of the redemption order shall be cancelled. The Distributor is also authorized to deliver the redemption distribution notwithstanding that the Baskets to be redeemed are not credited to the Fund’s DTC account by 12:00pm, New York time, on the business day immediately following the redemption order date if the Authorized Participant has collateralized its obligation to deliver the Baskets through DTC’s book entry system on such terms as the Distributor and the Managing Owner may from time-to-time agree upon.
Suspension or Rejection of Redemption Orders. The Managing Owner may suspend the right of redemption, or postpone the redemption settlement date, (1) for any period during which an emergency exists as a result of which the redemption distribution is not reasonably practicable, or (2) for such other period as the Managing Owner determines to be necessary for the protection of the Shareholders. The Managing Owner will not be liable to any person or in any way for any loss or damages that may result from any such suspension or postponement.
A redemption order may be rejected if the order is not in proper form as described in the order form and/or Participant Agreement or if the fulfillment of the order, in the opinion of its counsel, might be unlawful.
(8) Operating Expenses
(a) Management Fee
The Fund pays the Managing Owner a management fee (the “Management Fee”) monthly in arrears, in an amount equal to 0.85% per annum of the net asset value of the Master Fund. The management fee incurred for the three months ended March 31, 2016 and 2015 were $447,661 and $534,030, respectively. The Management Fees were charged to the Fund and paid to the Managing Owner.
(b) Organization and Offering Expenses
Expenses incurred in connection with organizing the Fund and the offering of the Shares were paid by GreenHaven, LLC. GreenHaven, LLC is the former sole member of the Managing Owner. The Fund does not have an obligation to reimburse GreenHaven, LLC or its affiliates for organization and offering expenses paid on their behalf.
| 24 |
(c) Brokerage Commissions, Fees, and Routine Operational, Administrative, and Other Ordinary Expenses
The Fund will pay to the Commodity Brokers all brokerage commissions, including applicable exchange fees, NFA fees, give-up fees, pit brokerage fees and other transaction related fees and expenses charged in connection with trading activities. On average, total charges paid to the Commodity Broker are expected to be less than $20.00 per round-turn trade, although the Commodity Broker’s brokerage commissions and trading fees will be determined on a contract-by-contract basis. The Fund will also reimburse the Managing Owner for any routine operational, administrative and other ordinary expenses of the Fund and the Master Fund paid by the Managing Owner (including, but not limited to, the fees and expenses of the Trustee, legal and accounting fees and expenses, tax preparation expenses, filing fees, and printing, mailing and duplication costs), out of any remaining portion of the 0.20% of the Fund’s Net Asset Value accrued for the payment of brokerage commissions and fees.
Brokerage commissions and fees are charged against the Fund’s assets on a per transaction basis. The brokerage commissions, trading fees and routine operational, administrative, and other ordinary expenses incurred for the three months ended March 31, 2016 and 2015 were $105,332 and $125,654, respectively.
(9) Termination
The term of the Fund is perpetual, unless terminated earlier in certain circumstances as defined in the Trust Agreement.
(10) Profit and Loss Allocations and Distributions
The Managing Owner and the Shareholders share in any profits and losses of the Fund attributable to the Fund in proportion to the percentage interest owned by each. Distributions may be made at the sole discretion of the Managing Owner on a pro-rata basis in accordance with the respective capital balances of the Shareholders, but the Fund is under no obligation to make periodic distributions to Shareholders. The Fund made no distributions to its Shareholders during the three months ended March 31, 2016.
(11) Commitments and Contingencies
The Managing Owner, either in its own capacity or in its capacity as the Managing Owner and on behalf of the Fund, has entered into various service agreements that contain a variety of representations, or provide indemnification provisions related to certain risks service providers undertake in performing services which are in the best interest of the Fund. As of March 31, 2016, no claims had been received by the Fund and it was therefore not possible to estimate the Fund’s potential future exposure under such indemnification provisions.
(12) Net Asset Value and Financial Highlights
The Fund is presenting the following NAV and financial highlights related to investment performance and operations for a Share outstanding for the three months ended March 31, 2016 and 2015. The total return at NAV is based on the change in NAV of the Shares during the period and the total return at market value is based on the change in market value of the Shares on the NYSE Arca during the period. An individual investor’s return and ratios may vary based on the timing of capital transactions.
| Three Months
Ended | Three Months
Ended | |||||||
| March 31, 2016 | March 31, 2015 | |||||||
| Net Asset Value | ||||||||
| Net asset value per Limited Share, beginning of period | $ | 18.56 | $ | 22.81 | ||||
| Net realized and change in unrealized gain (loss) | 0.21 | (1.55 | ) | |||||
| Net investment loss (1) | (0.04 | ) | (0.06 | ) | ||||
| Net increase (decrease) in net assets from operations | 0.17 | (1.61 | ) | |||||
| Net asset value per Limited Share, end of period | $ | 18.73 | $ | 21.20 | ||||
| Market value per Limited Share, beginning of period | $ | 18.52 | $ | 22.86 | ||||
| Market value per Limited Share, end of period | $ | 18.70 | $ | 21.19 | ||||
| Ratio to average Net Assets(2) | ||||||||
| Net investment loss | (0.88 | )% | (1.03 | )% | ||||
| Total expenses | 1.05 | % | 1.05 | % | ||||
| Total Return, at net asset value(3) | 0.92 | % | (7.06 | )% | ||||
| Total Return, at market value(3,4) | 1.08 | % | (7.31 | )% | ||||
| (1) | Based on average shares outstanding. |
| (2) | Annualized. |
| (3) | Total return calculated for a period of less than one year is not annualized. |
| (4) | In computing the market price total returns, the inputs for dates on or after January 1,2016 reflect the midpoint of the bid/ask spread as of the close of trading on the exchange where Fund shares are listed, and the inputs for dates prior to January 1, 2016 reflect the last price as of the close of trading on the exchange where Fund shares are listed. |
| 25 |
Item 2. Management’s Discussion and Analysis of Financial Condition and Results of Operation.
Overview/Introduction
The Funds seek to track changes, whether positive or negative, in the level of the Thomson Reuters Continuous Commodity Index Total Return over time, plus the excess, if any, of the Master Fund’s interest income from its holdings of United States Treasury Obligations and other high credit-quality short-term fixed income securities over the expenses of the Funds. The Shares are designed for investors who want a cost-effective and convenient way to invest in an equal-weight portfolio of commodity futures.
The Fund pursues its investment objective by investing substantially all of its assets in the Master Fund. The Master Fund pursues its investment objective by investing in a Portfolio of exchange-traded futures contracts on the commodities comprising the Index. Through January 6, 2013, the Index Commodities were wheat, corn, soybeans, live cattle, lean hogs, gold, silver, platinum, copper, cotton, coffee, cocoa, orange juice, sugar, crude oil, heating oil, and natural gas. Following the tenth revision on January 7, 2013, orange juice was removed and soybean oil was added at an equivalent allocation.
The Index is composed of notional amounts of each of the Index Commodities. The notional amounts of each Index Commodity included
in the Index are in equal weight proportion to the Index Commodities or 1/17 weighting per index commodity rebalanced daily. The
Master Fund’s Portfolio also includes United States Treasury Obligations and other high credit-quality short-term fixed income
securities for deposit with the Master Fund’s Commodity Broker. The Commodity Broker currently applies part of the total
value of the cash and/or Treasury Obligations on deposit towards satisfying any margin requirements related to the futures contracts
in the Master Fund’s futures account. The Index Sponsor is Thompson Reuters. Thomson Reuters is not an affiliate of the Fund,
the Master Fund or the Managing Owner.
Under the Trust Agreements of each of the Fund and the Master Fund, CSC Trust, the Trustee of the Funds, has delegated to the Managing Owner the exclusive management and control of all aspects of the business of the Funds. The Trustee has no duty or liability to supervise or monitor the performance of the Managing Owner, nor does the Trustee have any liability for the acts or omissions of the Managing Owner.
The Index Sponsor obtains information for inclusion in, or for use in the calculation of, the Index from sources the Index Sponsor considers reliable. None of the Index Sponsor, the Managing Owner, the Fund, the Master Fund or any of their respective affiliates accepts responsibility for or guarantees the accuracy and/or completeness of the Index or any data included in the Index.
The Shares are intended to provide investment results that generally correspond to the changes, positive or negative, in the levels of the Index over time. The value of the Shares is expected to fluctuate in relation to changes in the value of the Master Fund’s Portfolio. The market price of the Shares may not be identical to the Net Asset Value per Share, but these two valuations are expected to be very close.
The ticker symbol of the Fund is “GCC.”
Performance Summary
There is no performance history prior to the beginning of trading on January 24, 2008. For performance history subsequent to the beginning of trading, see the “Results of Operations” section below.
Net Asset Value
The Administrator calculates a Net Asset Value per Share of the Fund daily, based on closing prices of the underlying futures contracts. The first such calculation was as of market close on January 24, 2008, the first day of trading. Values of the underlying Index are computed by Thomson Reuters America, LLC, and disseminated by NYSE Arca every 15 seconds during the trading day. Only settlement and last-sale prices are used in the Index’s calculation, bids and offers are not recognized – including limit-bid and limit-offer price quotes. Where no last-sale price exists, typically in the more deferred contract months, the previous days’ settlement price is used. This means that the underlying Index may lag its theoretical value. This tendency to lag is evident at the end of the day when the Index value is based on the settlement prices of the component commodities, and explains why the underlying Index often closes at or near the high or low for the day.
| 26 |
Critical Accounting Policies
Critical accounting policies for the Fund and Master Fund are as follows:
Preparation of the financial statements and related disclosures in conformity with U.S. generally accepted accounting principles requires the application of appropriate accounting rules and guidance, as well as the use of estimates, and requires the Managing Owner to make estimates and assumptions that affect the reported amounts of assets and liabilities, revenue and expense and related disclosure of contingent assets and liabilities during the reporting period of the consolidated financial statements and accompanying notes. Both the Fund and the Master Fund apply these policies that involve judgments and actual results may differ from the estimates used.
The Master Fund holds a significant portion of its assets in futures contracts and United States Treasury Obligations, both of which are recorded on a trade date basis and at fair value in the consolidated financial statements, with changes in fair value reported in the consolidated statements of income and expenses. The use of fair value to measure financial instruments, with related unrealized gains or losses recognized in earnings in each period is fundamental to the Fund’s consolidated financial statements. The fair value of a financial instrument is the amount that would be received to sell an asset or paid to transfer a liability in an orderly transaction between market participants at the measurement date (the exit price).
When market closing prices are not available, the Managing Owner may value an asset of the Master Fund pursuant to policies the Managing Owner has adopted, which are consistent with normal industry standards.
Interest income on United States Treasury Obligations is recognized on an accrual basis when earned. Discounts and premiums are amortized or accreted over the life of the United States Treasury Obligations.
Realized gains (losses) and changes in unrealized gain (loss) on open positions are determined on a specific identification basis and recognized in the consolidated statements of income and expenses in the period in which the contract is closed or the changes occur, respectively.
Asset Valuation
The Fund records its futures contracts and United States Treasury Obligations on a trade date basis and at fair value in the consolidated financial statements, with changes in fair value reported in the consolidated statement of income and expenses.
In determining fair value of United States Treasury Obligations and commodity futures contracts, the Fund uses unadjusted quoted market prices in active markets and a fair value hierarchy that prioritizes the inputs to valuation techniques used to measure fair value. The hierarchy gives the highest priority to unadjusted quoted prices for identical assets or liabilities (Level 1 measurements) and the lowest priority to unobservable inputs (Level 3 measurements). Assets and liabilities are classified in their entirety based on the lowest level of input that is significant to the fair value measurement. See Note 4 to the financial statements for further information regarding this accounting policy.
Market Risk
See Item 1A – Risk Factors and Item 3 – Quantitative and Qualitative Disclosures About Market Risk for a complete discussion of market risk.
Credit Risk
The Master Fund holds two types of investments. The first is long positions in futures contracts on the seventeen commodities in the Index. Since the Index allocates equally among the components and is rebalanced daily, performance risk of the futures contracts is divided equally among the components. Each of the component commodities is traded on the CME Group or ICE exchanges.
The CME Group and ICE exchanges guarantee the performance of its outstanding futures contracts. Each exchange is also publicly traded and, in management’s opinion, well-capitalized. Each uses a system of margining and daily cash settlement of unrealized gains and losses in open positions, which reduces counterparty risk for market participants. Hence, management believes that the Fund faces minimal credit or counterparty risk in its futures trading and contract positions.
The Master Fund will also hold significant cash balances representing the excess of invested funds above the margin requirements for its futures positions. To the extent practical, the Fund will hold this excess cash in short-term obligations of the United States Treasury. Hence, management assigns no counterparty risk to such holdings.
Liquidity
The Funds do not anticipate making use of borrowings or other lines of credit to meet its obligations. The Master Fund meets liquidity needs in the normal course of business from cash, cash equivalents, and/or from the sale of United States Treasury Obligations it holds. The Funds’ liquidity needs include: redeeming Shares, providing margin deposits for existing futures contracts, the purchase of additional futures contracts and paying expenses.
| 27 |
The Funds generate cash primarily from (i) the sale of creation Baskets, (ii) the sale of futures contracts, and (iii) interest earned on cash, cash equivalents and investments in collateralizing United States Treasury Obligations. Substantially all of the net assets of the Master Fund are allocated to trading in futures contracts. Most of the assets of the Master Fund are held in United States Treasury Obligations, cash and/or cash equivalents that could or are used as margin or collateral for trading in futures contracts. The percentage that such assets bear to the total net assets will vary from period to period as the market values of the futures contracts change. Interest earned on interest-bearing assets of the Master Fund is paid to the Master Fund.
The investments of the Master Fund in futures contracts could be subject to periods of illiquidity because of market conditions, regulatory considerations and other reasons. Such conditions could prevent the Master Fund from promptly liquidating a position in futures contracts.
Contractual Obligations
The Fund’s contractual obligations are with the Managing Owner and the Commodity Broker. Management Fee payments made to the Managing Owner are calculated as a fixed percentage of the Master Fund’s Net Asset Value. Commissions paid by the Fund to the Commodity Broker are on a per trade basis. As such, the Managing Owner cannot anticipate the amount of payments and commissions related to future trades.
Off-Balance Sheet Risk
In the normal course of business, the Funds are party to financial instruments with off-balance sheet risk. The term “off-balance sheet risk” refers to an unrecorded potential liability that, even though it does not appear on the balance sheet, may result in a future obligation or loss. The financial instruments used by the Fund are standardized commodity futures contracts traded on regulated exchanges and are recognized on the balance sheet at fair value pursuant to the accounting standards for derivatives and hedging activities, “Accounting for Derivative Instruments and Hedging Activities.” As of the balance sheet date, the Funds have no unrecorded liabilities relating to futures contracts. However, until these contracts are closed, they will fluctuate in value with changing commodity prices.
Results of Operations
FOR THE PERIOD FROM MARCH 31, 2011 TO MARCH 31, 2016
The Fund was launched on January 23, 2008 at $30.00 per share and listed for trading on the NYSE Arca, formerly the American Stock Exchange, on January 24, 2008.
| 28 |
PAST PERFORMANCE IS NOT NECESSARILY INDICATIVE OF FUTURE RESULTS.
| Date | NAV Per Share | Total Shares | Net Assets | 1 Month Return | 3 Month Return | Year to Date Return | Cumulative Return Since Inception | |||||||||||||||||||||||
| 4/30/2011 | $ | 36.34 | 23,800,050 | $ | 864,893,817 | 3.24 | % | 6.85 | % | 10.52 | % | 21.13 | % | |||||||||||||||||
| 5/31/2011 | $ | 34.87 | 22,000,050 | $ | 767,141,744 | -4.05 | % | -0.82 | % | 6.05 | % | 16.23 | % | |||||||||||||||||
| 6/30/2011 | $ | 33.59 | 21,850,050 | $ | 733,943,180 | -3.67 | % | -4.57 | % | 2.16 | % | 11.97 | % | |||||||||||||||||
| 7/31/2011 | $ | 34.48 | 21,000,050 | $ | 724,081,724 | 2.65 | % | -5.12 | % | 4.87 | % | 14.93 | % | |||||||||||||||||
| 8/31/2011 | $ | 35.23 | 20,700,050 | $ | 729,262,762 | 2.18 | % | 1.03 | % | 7.15 | % | 17.43 | % | |||||||||||||||||
| 9/30/2011 | $ | 30.46 | 20,600,050 | $ | 627,498,123 | -13.54 | % | -9.32 | % | -7.36 | % | 1.54 | % | |||||||||||||||||
| 10/31/2011 | $ | 32.21 | 19,200,050 | $ | 618,433,611 | 5.74 | % | -6.58 | % | -2.04 | % | 7.37 | % | |||||||||||||||||
| 11/30/2011 | $ | 31.12 | 20,300,050 | $ | 631,737,556 | -3.38 | % | -11.67 | % | -5.35 | % | 3.73 | % | |||||||||||||||||
| 12/31/2011 | $ | 29.96 | 19,400,050 | $ | 581,225,498 | -3.73 | % | -1.64 | % | -8.88 | % | -0.13 | % | |||||||||||||||||
| 1/31/2012 | $ | 31.29 | 19,550,050 | $ | 611,721,065 | 4.44 | % | -2.86 | % | 4.44 | % | 4.30 | % | |||||||||||||||||
| 2/29/2012 | $ | 31.70 | 21,350,050 | $ | 676,796,585 | 1.31 | % | 1.86 | % | 5.81 | % | 5.67 | % | |||||||||||||||||
| 3/31/2012 | $ | 30.35 | 21,250,050 | $ | 644,939,018 | -4.26 | % | 1.30 | % | 1.30 | % | 1.17 | % | |||||||||||||||||
| 4/30/2012 | $ | 29.51 | 20,550,050 | $ | 606,431,976 | -2.77 | % | -5.69 | % | -1.50 | % | -1.63 | % | |||||||||||||||||
| 5/31/2012 | $ | 26.95 | 18,300,050 | $ | 493,186,348 | -8.68 | % | -14.98 | % | -10.05 | % | -10.17 | % | |||||||||||||||||
| 6/30/2012 | $ | 28.43 | 18,000,050 | $ | 511,741,422 | 5.49 | % | -6.33 | % | -5.11 | % | -5.23 | % | |||||||||||||||||
| 7/31/2012 | $ | 29.65 | 17,100,050 | $ | 507,016,483 | 4.29 | % | 0.47 | % | -1.03 | % | -1.17 | % | |||||||||||||||||
| 8/31/2012 | $ | 30.35 | 16,650,050 | $ | 505,329,018 | 2.36 | % | 12.62 | % | 1.30 | % | 1.17 | % | |||||||||||||||||
| 9/30/2012 | $ | 30.57 | 16,900,050 | $ | 516,634,529 | 0.72 | % | 7.53 | % | 2.04 | % | 1.90 | % | |||||||||||||||||
| 10/31/2012 | $ | 29.56 | 16,600,050 | $ | 490,697,478 | -3.30 | % | -0.30 | % | -1.34 | % | -1.47 | % | |||||||||||||||||
| 11/30/2012 | $ | 29.83 | 16,750,050 | $ | 499,653,992 | 0.91 | % | -1.71 | % | -0.43 | % | -0.57 | % | |||||||||||||||||
| 12/31/2012 | $ | 28.85 | 16,450,050 | $ | 474,583,943 | -3.29 | % | -5.63 | % | -3.70 | % | -3.83 | % | |||||||||||||||||
| 1/31/2013 | $ | 29.50 | 16,450,050 | $ | 485,276,475 | 2.25 | % | -0.20 | % | 2.25 | % | -1.67 | % | |||||||||||||||||
| 2/28/2013 | $ | 28.21 | 16,500,050 | $ | 465,466,411 | -4.37 | % | -5.43 | % | -2.22 | % | -5.97 | % | |||||||||||||||||
| 3/31/2013 | $ | 28.26 | 17,000,050 | $ | 480,421,413 | 0.18 | % | -2.05 | % | -2.05 | % | -5.80 | % | |||||||||||||||||
| 4/30/2013 | $ | 27.65 | 16,800,050 | $ | 464,521,383 | -2.16 | % | -6.27 | % | -4.16 | % | -7.83 | % | |||||||||||||||||
| 5/31/2013 | $ | 26.89 | 16,200,050 | $ | 435,619,345 | -2.75 | % | -4.68 | % | -6.79 | % | -10.37 | % | |||||||||||||||||
| 6/30/2013 | $ | 25.76 | 15,700,050 | $ | 404,433,288 | -4.20 | % | -8.85 | % | -10.71 | % | -14.13 | % | |||||||||||||||||
| 7/31/2013 | $ | 26.01 | 14,900,050 | $ | 387,550,301 | 0.97 | % | -5.93 | % | -9.84 | % | -13.30 | % | |||||||||||||||||
| 8/31/2013 | $ | 26.84 | 13,550,050 | $ | 363,683,342 | 3.19 | % | -0.19 | % | -6.97 | % | -10.53 | % | |||||||||||||||||
| 9/30/2013 | $ | 26.48 | 13,400,050 | $ | 354,833,324 | -1.34 | % | 2.80 | % | -8.21 | % | -11.73 | % | |||||||||||||||||
| 10/31/2013 | $ | 26.15 | 13,300,050 | $ | 347,796,308 | -1.25 | % | 0.54 | % | -9.36 | % | -12.83 | % | |||||||||||||||||
| 11/30/2013 | $ | 25.84 | 13,300,050 | $ | 343,673,292 | -1.19 | % | -3.73 | % | -10.43 | % | -13.87 | % | |||||||||||||||||
| 12/31/2013 | $ | 25.70 | 12,450,050 | $ | 319,966,285 | -0.54 | % | -2.95 | % | -10.92 | % | -14.33 | % | |||||||||||||||||
| 1/31/2014 | $ | 25.87 | 11,900,050 | $ | 307,854,294 | 0.66 | % | -1.07 | % | 0.66 | % | -13.77 | % | |||||||||||||||||
| 2/28/2014 | $ | 27.80 | 12,350,050 | $ | 343,331,390 | 7.46 | % | 7.59 | % | 8.17 | % | -7.33 | % | |||||||||||||||||
| 3/31/2014 | $ | 28.19 | 12,350,050 | $ | 348,147,910 | 1.40 | % | 9.69 | % | 9.69 | % | -6.03 | % | |||||||||||||||||
| 4/30/2014 | $ | 28.74 | 12,500,050 | $ | 359,251,437 | 1.95 | % | 11.09 | % | 11.83 | % | -4.20 | % | |||||||||||||||||
| 5/31/2014 | $ | 27.78 | 12,800,050 | $ | 355,585,389 | -3.34 | % | -0.07 | % | 8.09 | % | -7.40 | % | |||||||||||||||||
| 6/30/2014 | $ | 27.91 | 12,900,050 | $ | 360,040,396 | 0.47 | % | -0.99 | % | 8.60 | % | -6.97 | % | |||||||||||||||||
| 7/31/2014 | $ | 26.62 | 13,150,050 | $ | 350,054,331 | -4.62 | % | -7.38 | % | 3.58 | % | -11.27 | % | |||||||||||||||||
| 8/31/2014 | $ | 26.25 | 13,150,050 | $ | 345,188,813 | -1.39 | % | -5.51 | % | 2.14 | % | -12.50 | % | |||||||||||||||||
| 9/30/2014 | $ | 24.79 | 12,950,050 | $ | 321,031,740 | -5.56 | % | -11.18 | % | -3.54 | % | -17.37 | % | |||||||||||||||||
| 10/31/2014 | $ | 24.73 | 12,750,050 | $ | 315,308,737 | -0.24 | % | -7.10 | % | -3.77 | % | -17.57 | % | |||||||||||||||||
| 11/30/2014 | $ | 23.97 | 12,250,050 | $ | 293,633,699 | -3.07 | % | -8.69 | % | -6.73 | % | -20.10 | % | |||||||||||||||||
| 12/31/2014 | $ | 22.81 | 11,700,050 | $ | 266,878,141 | -4.84 | % | -7.99 | % | -11.25 | % | -23.97 | % | |||||||||||||||||
| 1/31/2015 | $ | 21.83 | 11,600,050 | $ | 253,229,092 | -4.30 | % | -11.73 | % | -4.30 | % | -27.23 | % | |||||||||||||||||
| 2/28/2015 | $ | 22.21 | 11,400,050 | $ | 253,195,111 | 1.74 | % | -7.34 | % | -2.63 | % | -25.97 | % | |||||||||||||||||
| 3/31/2015 | $ | 21.20 | 11,500,050 | $ | 243,801,060 | -4.55 | % | -7.06 | % | -7.06 | % | -29.33 | % | |||||||||||||||||
| 4/30/2015 | $ | 21.90 | 11,450,050 | $ | 250,756,095 | 3.30 | % | 0.32 | % | -3.99 | % | -27.00 | % | |||||||||||||||||
| 5/31/2015 | $ | 21.51 | 11,550,050 | $ | 248,441,576 | -1.78 | % | -3.15 | % | -5.70 | % | -28.30 | % | |||||||||||||||||
| 6/30/2015 | $ | 22.08 | 12,650,050 | $ | 279,313,104 | 2.65 | % | 4.15 | % | -3.20 | % | -26.40 | % | |||||||||||||||||
| 7/31/2015 | $ | 20.14 | 12,350,050 | $ | 248,730,007 | -8.79 | % | -8.04 | % | -11.71 | % | -32.87 | % | |||||||||||||||||
| 8/31/2015 | $ | 19.89 | 12,250,050 | $ | 243,653,495 | -1.24 | % | -7.53 | % | -12.80 | % | -33.70 | % | |||||||||||||||||
| 9/30/2015 | $ | 19.48 | 12,350,050 | $ | 240,578,974 | -2.06 | % | -11.78 | % | -14.60 | % | -35.07 | % | |||||||||||||||||
| 10/31/2015 | $ | 19.80 | 12,450,050 | $ | 246,510,990 | 1.64 | % | -1.69 | % | -13.20 | % | -34.00 | % | |||||||||||||||||
| 11/30/2015 | $ | 18.65 | 12,600,050 | $ | 234,990,933 | -5.81 | % | -6.23 | % | -18.24 | % | -37.83 | % | |||||||||||||||||
| 12/31/2015 | $ | 18.56 | 12,100,050 | $ | 224,576,928 | -0.48 | % | -4.72 | % | -18.63 | % | -38.13 | % | |||||||||||||||||
| 1/31/2016 | $ | 18.08 | 11,800,050 | $ | 213,344,904 | -2.59 | % | -8.69 | % | -2.59 | % | -39.73 | % | |||||||||||||||||
| 2/29/2016 | $ | 17.95 | 11,500,050 | $ | 206,425,898 | -0.72 | % | -3.75 | % | -3.29 | % | -40.17 | % | |||||||||||||||||
| 3/31/2016 | $ | 18.73 | 11,350,000 | $ | 212,586,437 | 4.35 | % | 0.92 | % | 0.92 | % | -37.57 | % | |||||||||||||||||
| 29 |
PAST PERFORMANCE IS NOT NECESSARILY INDICATIVE OF FUTURE RESULTS.
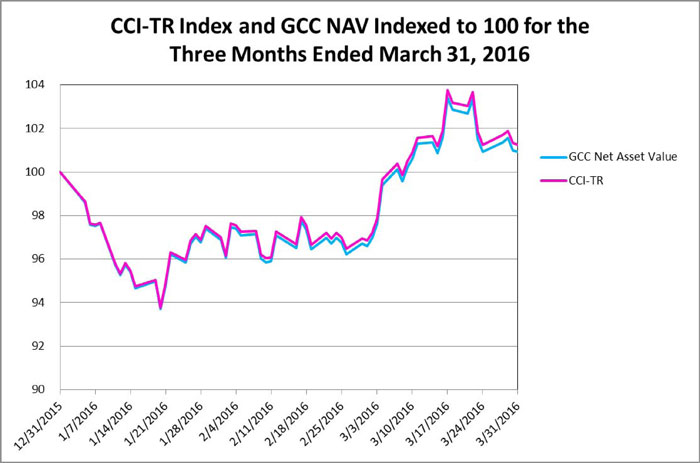
| 30 |
PAST PERFORMANCE IS NOT NECESSARILY INDICATIVE OF FUTURE RESULTS.
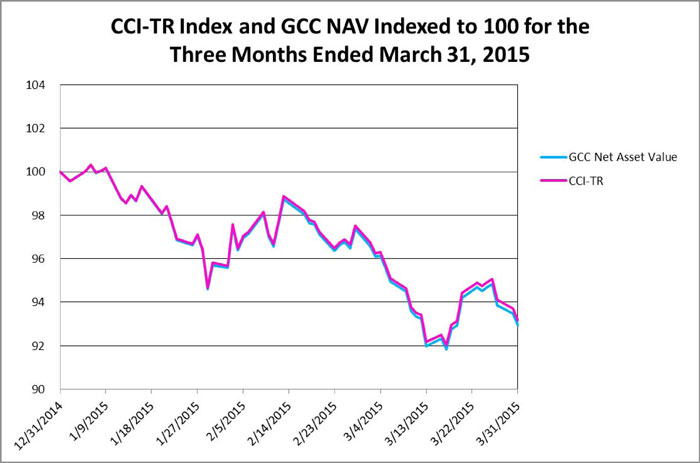
The Fund and the Master Fund seek to track changes in the Thomson Reuters Equal Weight Continuous Commodity Index-Total Return, or the “Index”, over time. For the three-months ended March 31, 2016 and March 31, 2015, the Fund’s Net Asset Value underperformed the Index by 0.33% and 0.23%, respectively.
Item 3. Quantitative and Qualitative Disclosures About Market Risk.
Introduction
The Funds are designed to replicate a commodity index. The market-sensitive instruments held by the Master Fund are subject to the risk of trading loss. Unlike an operating company, the risk of market-sensitive instruments is integral, not incidental, to the Funds’ main line of business.
Market movements can produce frequent changes in the fair market value of the Master Fund’s open positions and, consequently, in its earnings and cash flows. The Funds’ market risk is primarily influenced by changes in the price of commodities.
Qualitative Disclosures Regarding Non-Trading Risk Exposure
The Funds are unaware of any (i) anticipated known demands, commitments or capital expenditures; (ii) material trends, favorable or unfavorable, in its capital resources; or (iii) trends or uncertainties that will have a material effect on operations.
Qualitative Disclosures Regarding Means of Managing Risk Exposure
Under ordinary circumstances, the Managing Owner’s discretionary power is limited to determining whether the Fund will make a distribution. Under emergency or extraordinary circumstances, the Managing Owner’s discretionary powers increase, but remain circumscribed. These special circumstances, for example, include the unavailability of the Index or certain natural or man-made disasters. The Managing Owner does not apply risk management techniques. The Master Fund initiates positions only on the “long” side of the market and does not employ “stop-loss” techniques.
| 31 |
Accordingly, tabular presentations of Market Risk or Sensitivity or Value-at-Risk analyses thereof are not applicable.
Item 4. Controls and Procedures.
Disclosure controls and procedures
For purposes of this Item 4, references to the “Fund” and “our” include both the Fund and the Master Fund. Under the supervision and with the participation of the management of the Managing Owner, including its chief executive officer and principal financial officer, the Fund carried out an evaluation of the effectiveness of the design and operation of its disclosure controls and procedures (as defined in Rule 13a-15(f)) of the Securities Exchange Act of 1934). Based upon that evaluation, the chief executive officer and principal financial officer concluded that the Fund’s disclosure controls and procedures with respect to the Fund were effective as of the end of the period covered by this annual report.
Changes in Internal Control over Financial Reporting
The Managing Owner is responsible for establishing and maintaining adequate internal control over financial reporting. The Managing Owner’s internal control system is designed to provide reasonable assurance to the Fund’s management regarding the preparation and fair presentation of published financial statements. All internal control systems, no matter how well designed, have inherent limitations. Therefore, even those systems determined to be effective can provide only reasonable assurance with respect to financial statement preparation and presentation.
Effective January 1, 2016, in accordance with the terms of a Unit Purchase Agreement dated October 29, 2015, GreenHaven Group LLC sold to WisdomTree Investments Inc., 100% of the issued and outstanding membership interest in the Sponsor. In connection with such sale, the Sponsor appointed State Street Bank and Trust as the Fund’s Administrator. The Administrator retains certain financial books and records on behalf of the Fund, including fund accounting records and ledgers with respect to assets, liabilities, capital, income and expenses Also in connection with such sale, the Sponsor appointed new executive officers, who participate in the management of the Fund. See the Fund’s Form 8-K filed January 4, 2016. Except as noted above, Management does not believe that there have been any change in the Fund’s internal control over financial reporting during the three months ended March 31, 2016 that has materially affected, or is reasonably likely to materially affect, the Fund’s internal control over financial reporting.
Not Applicable.
We filed our Annual Report on Form 10-K for the year ended December 31, 2015, with the Securities and Exchange Commission on March 15, 2016, which sets forth certain risk factors in Part I, Item 1A therein. We have not experienced any material changes from the risk factors previously described in our Annual Report on Form 10-K for the year ended December 31, 2015.
Item 2. Unregistered Sales of Equity Securities and Use of Proceeds.
(a) None.
(b) For the three-months ended March 31, 2016, 750,000 Limited Shares were redeemed for $13,615,107 and no Limited Shares were created. On March 31, 2016, 11,350,000 Limited Shares of the Fund were outstanding for a market capitalization of $212,245,000, based on the March 31, 2016 closing price of $18.70 on the NYSE Arca.
(c) The following table shows the number of Shares redeemed (purchased back by the Fund, or “Issuer”) from Authorized Participants for each month during the quarter ended March 31, 2016:
Issuer Purchases of Equity Securities
| Period | Total
Number of | Average
Price | Total
Number of | Maximum
Number (or | |||||||||||||
| January 1, 2016 to January 31, 2016 | 300,000 | $ | 17.99 | N/A | N/A | ||||||||||||
| February 1, 2016 to February 29, 2016 | 300,000 | $ | 17.99 | N/A | N/A | ||||||||||||
| March 1, 2016 to March 31, 2016 | 150,000 | $ | 18.81 | N/A | N/A | ||||||||||||
| Total | 750,000 | $ | - | ||||||||||||||
| 32 |
Item 3. Defaults Upon Senior Securities
None.
Item 4. Mine Safety Disclosures
None.
None.
| 33 |
| Exhibit No. | Description of Document | |
| 3.1 | Certificate of Amendment to Certificate of Trust of GreenHaven Continuous Commodity Index Fund(1) | |
| 3.2 | Certificate of Amendment to Certificate of Trust of GreenHaven Continuous Commodity Index Master Fund(2) | |
| 3.3 | Amended Declaration of Trust and Trust Agreement of GreenHaven Continuous Commodity Index Fund(3) | |
| 3.4 | Amendment to the Declaration of Trust and Trust Agreement of Greenhaven Continuous Commodity Index Master Fund(4) | |
| 10.1 | Commodity Subadvisory Agreement(5) | |
| 10.2 | Master Custodian Agreement (6) | |
| 10.3 | Administration Agreement(7) | |
| 10.4 | Distribution Services Agreement(8) | |
| 10.5 | Transfer Agency and Services Agreement(9) | |
| 10.6 | Form of Participant Agreement(10) | |
| 10.7 | Amended and Restated License Agreement(11) | |
| 31.1 | Certification by Principal Executive Officer Pursuant to Rule 13a-14(a) under the Securities Exchange Act of 1934, as amended(12) | |
| 31.2 | Certification by Principal Financial Officer Pursuant to Rule 13a-14(a) under the Securities Exchange Act of 1934, as amended(12) | |
| 31.3 | Certification by Principal Executive Officer Pursuant to Rule 13a-14(a) under the Securities Exchange Act of 1934, as amended(12) | |
| 31.4 | Certification by Principal Financial Officer Pursuant to Rule 13a-14(a) under the Securities Exchange Act of 1934, as amended(12) | |
| 32.1 | Certification by Principal Executive Officer Pursuant to 18 U.S.C. Section 1350, as Adopted Pursuant to Section 906 of the Sarbanes-Oxley Act of 2002(12) | |
| 32.2 | Certification by Principal Financial Officer Pursuant to 18 U.S.C. Section 1350, as Adopted Pursuant to Section 906 of the Sarbanes-Oxley Act of 2002(12) | |
| 32.3 | Certification by Principal Executive Officer Pursuant to 18 U.S.C. Section 1350, as Adopted Pursuant to Section 906 of the Sarbanes-Oxley Act of 2002(12) | |
| 32.4 | Certification by Principal Financial Officer Pursuant to 18 U.S.C. Section 1350, as Adopted Pursuant to Section 906 of the Sarbanes-Oxley Act of 2002(12) | |
| 101.INS | XBRL Instance Document. | |
| 101.SCH | XBRL Taxonomy Extension Schema Document. | |
| 101.CAL | XBRL Taxonomy Extension Calculation Linkbase Document. | |
| 101.DEF | XBRL Taxonomy Extension Definition Linkbase Document. | |
| 101.LAB | XBRL Taxonomy Extension Label Linkbase Document. | |
| 101.PRE | XBRL Taxonomy Extension Presentation Linkbase Document. |
| (1) | Incorporated by reference to Exhibit 3.1 of the Fund’s Current Report on Form 8-K filed January 4, 2016. |
| (2) | Incorporated by reference to Exhibit 3.3 of the Fund’s Current Report on Form 8-K filed January 4, 2016. |
| (3) | Incorporated by reference to Exhibit 3.2 of the Fund’s Current Report on Form 8-K filed January 4, 2016. |
| (4) | Incorporated by reference to Exhibit 3.4 of the Fund’s Current Report on Form 8-K filed January 4, 2016. |
| (5) | Incorporated by reference to Exhibit 10.1 of the Fund’s Current Report on Form 8-K filed January 4, 2016. |
| (6) | Incorporated by reference to Exhibit 10.2 of the Fund’s Current Report on Form 8-K filed January 4, 2016. |
| (7) | Incorporated by reference to Exhibit 10.3 of the Fund’s Current Report on Form 8-K filed January 4, 2016. |
| (8) | Incorporated by reference to Exhibit 10.4 of the Fund’s Current Report on Form 8-K filed January 4, 2016. |
| (9) | Incorporated by reference to Exhibit 10.5 of the Fund’s Current Report on Form 8-K filed January 4, 2016 |
| (10) | Incorporated by reference to Exhibit 10.6 of the Fund’s Current Report on Form 8-K filed January 4, 2016. |
| (11) | Incorporated by reference to Exhibit 10.7 of the Fund’s Current Report on Form 8-K filed January 4, 2016. |
| (12) | Filed herewith. |
| 34 |
Pursuant to the requirements of the Securities Exchange Act of 1934, the registrant and co-registrant have duly caused this report to be signed on its behalf by the undersigned, thereunto duly authorized.
WisdomTree Commodity Services, LLC, | ||
Managing Owner of the WisdomTree Continuous Commodity Index Fund (registrant) | ||
| By: | /s/ Gregory Barton | |
Gregory Barton | ||
Chief Executive Officer | ||
(Principal Executive Officer) | ||
| Date: | May 10, 2016 | |
| By: | /s/ David Castano | |
David Castano | ||
Chief Financial Officer | ||
(Principal Financial Officer) | ||
| Date: | May 10, 2016 | |
WisdomTree Commodity Services, LLC, | ||
Managing Owner of the WisdomTree Continuous Commodity Index Master Fund (co-registrant) | ||
| By: | /s/ Gregory Barton | |
Gregory Barton | ||
Chief Executive Officer | ||
(Principal Executive Officer) | ||
| Date: | May 10, 2016 | |
| By: | /s/ David Castano | |
David Castano | ||
Chief Financial Officer | ||
(Principal Financial Officer) | ||
| Date: | May 10, 2016 | |
| 35 |