Attached files
| file | filename |
|---|---|
| 8-K - 8-K - SOUTH JERSEY INDUSTRIES INC | s001295x1_8k.htm |
Exhibit 99.1

American Gas Association Financial Forum May 15 - 17, 2016

Forward Looking Statements 2 Certain statements contained in this presentation may qualify as “forward - looking statements” within the meaning of Section 27A of the Securities Act of 1933 and Section 21E of the Securities Exchange Act of 1934. All statements other than statements of historical fact , including statements regarding future dividends, projected customer growth, projected growth of our businesses, planned capital expenditures and earnings targets, are forward - looking. When used in this presentation, or any other of the Company's documents or oral presentations, words such as “anticipate,” “believe,” “expect,” “estimate,” “forecast,” “goal,” “intend,” “objective,” “plan,” “potential,” “project,” “seek,” “strategy,” “target,” “will” and similar expressions are intended to identify forward - looking statements. Such forward - looking statements are subject to risks and uncertainties that could cause actual results to differ materially from those expressed or implied in the statements. These risks and uncertainties include, but are not limited to the risks set forth under “Risk Factors” under Part II, Item 1A of our Quarterly Report on Form 10 - Q for the three months ended March 31, 2016 and under Part I, Item 1A of our Annual Report on Form 10 - K incorporated by reference therein. These cautionary statements should not be construed by you to be exhaustive and they are made only as of the date of this Report. While the Company believes these forward - looking statements to be reasonable, there can be no assurance that they will approximate actual experience or that the expectations derived from them will be realized. Further, SJI undertakes no obligation to update or revise any of its forward - looking statements whether as a result of new information, future events or otherwise.

South Jersey Industries: Overview 3 South Jersey Gas SJI Midstream South Jersey Energy Solutions Regulated N atural Gas Distribution Company FERC - Regulated Gas Pipelines SJ Energy Services SJ Energy Group • Energy production portfolio (solar, CHP and landfill gas) • Meter reading, HVAC and appliance maintenance • Wholesale and retail natural gas and electric commodity marketing • Fuel management services $66.6mm Economic Earnings (1) $31.5mm Economic Earnings (1) Regulated Non - Utility (1) 2015 reported results. Excludes corporate segment results. As reported; not adjusted for one - time items . Economic Earnings is a non - GAAP measure; see Appendix for further information.
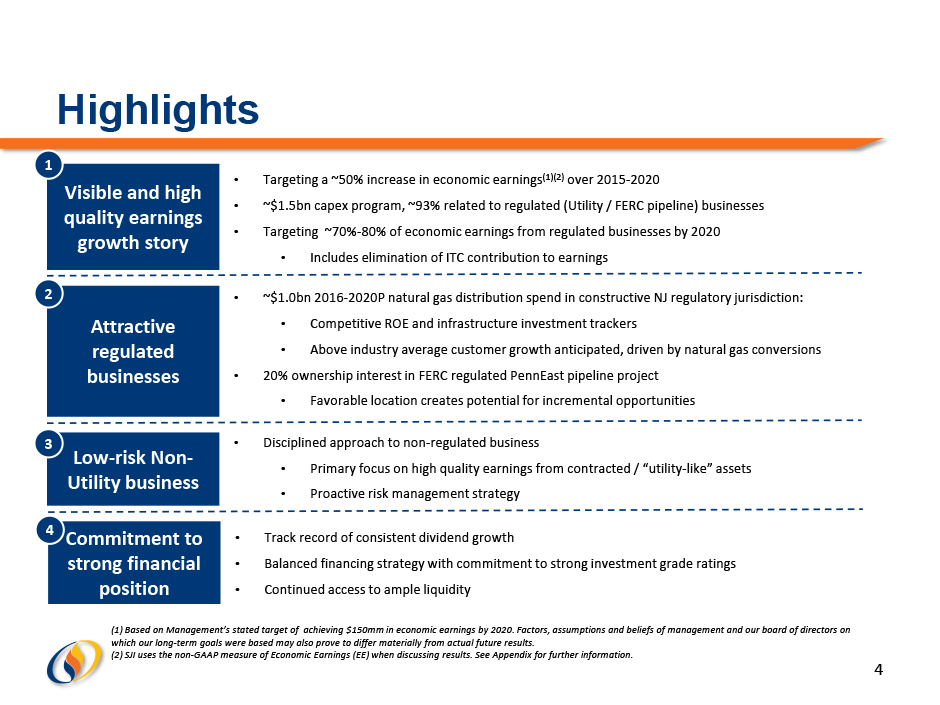
Highlights 4 Visible and high quality earnings growth story Attractive regulated businesses Low - risk Non - Utility business • Targeting a ~50% increase in economic earnings (1)(2) over 2015 - 2020 • ~$1.5bn capex program, ~93% related to regulated (Utility / FERC pipeline) businesses • Targeting ~70% - 80% of economic earnings from regulated businesses by 2020 • Includes elimination of ITC contribution to earnings • ~$1.0bn 2016 - 2020P natural gas distribution spend in constructive NJ regulatory jurisdiction: • Competitive ROE and infrastructure investment trackers • Above industry average customer growth anticipated, driven by natural gas conversions • 20% ownership interest in FERC regulated PennEast pipeline project • Favorable location creates potential for incremental opportunities 1 2 3 • Disciplined approach to non - regulated business • Primary focus on high quality earnings from contracted / “utility - like” assets • Proactive risk management strategy Commitment to strong financial position 4 • Track record of consistent dividend growth • Balanced financing strategy with commitment to strong investment grade ratings • Continued access to ample liquidity (1) Based on Management’s stated target of achieving $150mm in economic earnings by 202 0 . Factors, assumptions and beliefs of management and our board of directors on which our long - term goals were based may also prove to differ materially from actual future results. (2) SJI uses the non - GAAP measure of Economic Earnings (EE) when discussing results. See Appendix for further information.

70% 23% 7% 56% 1% 43% South Jersey Industries: Anticipated Capex 5 $mm Anticipated $1.5bn of capex 2016 - 2020¹, focused on regulated utility and FERC pipeline growth (1) Capital expenditures shown are inclusive of affiliate investments 2013A - 2015A 2016P - 2020P % Utility and FERC regulated: 57% % Utility and FERC regulated: 93% $317 $ 344 $ 354 $303 $ 388 $382 $203 $225 2013A 2014A 2015A 2016P 2017P 2018P 2019P 2020P Regulated Utility FERC regulated Non-Utility
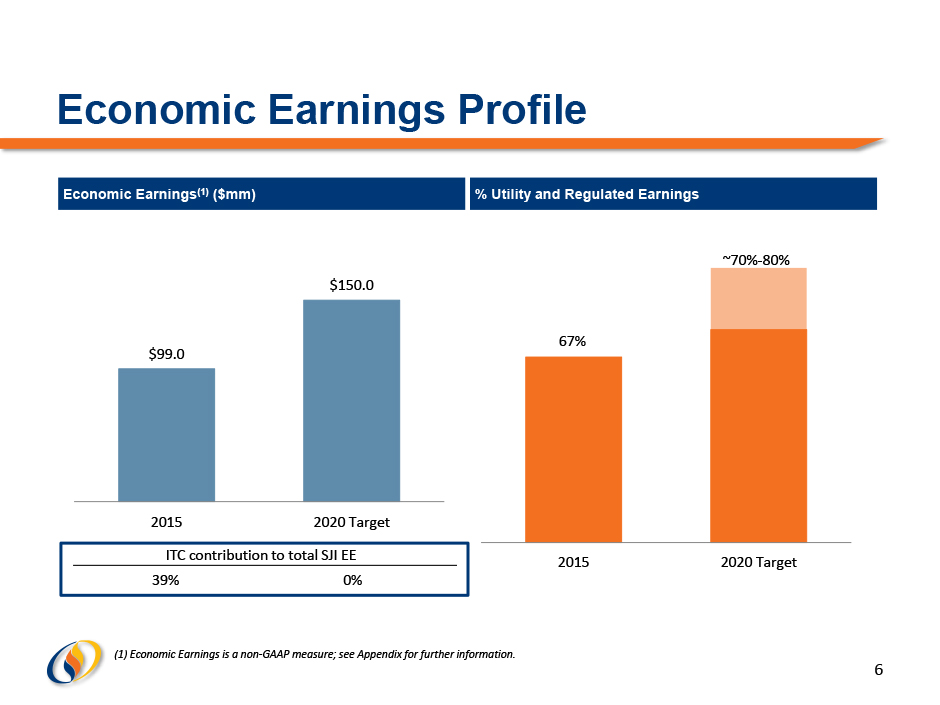
Economic Earnings Profile 6 (1) Economic Earnings is a non - GAAP measure; see Appendix for further information. $99.0 $150.0 2015 2020 Target Economic Earnings (1) ($mm) % Utility and Regulated Earnings 67% ~70% - 80% 2015 2020 Target ITC contribution to total SJI EE 39% 0%

Regulated Businesses 7

South Jersey Gas: Regulated Utility Profile 8 Base Capital AIRP SHARP Special Projects & Other Projected Utility Capex ($mm) Selected Gas Utility Statistics • 375,000+ customers served in southern New Jersey • Regulated by the NJ Board of Public Utilities • Rate base = $1.2 billion • Allowed ROE = 9.75% • Allowed equity/cap = 51.9% • 2016P - 2020P targeted PP&E growth =70% $122 $92 $93 $94 $95 $38 $35 $35 $35 $35 $28 $35 $35 $35 $35 $33 $ 44 $ 105 $19 $206 $268 $183 $169 2016P 2017P 2018P 2019P 2020P 2016P - 2020P total capex: $1,047 $221
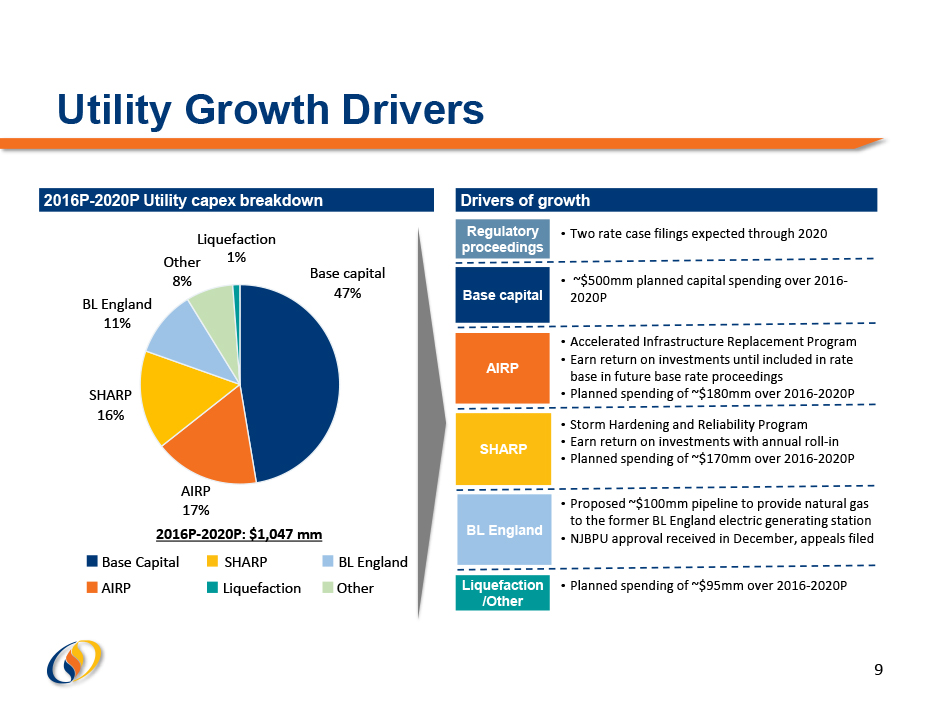
Utility Growth Drivers 9 • Accelerated Infrastructure Replacement Program • Earn return on investments until included in rate base in future base rate proceedings • Planned spending of ~$180mm over 2016 - 2020P 2016P - 2020P Utility capex breakdown • Includes estimates for depreciation, interest, O&M, etc. Regulatory proceedings Base capital 47% AIRP 17% SHARP 16% Other 8% Liquefaction 1% BL England 11% 2016P - 2020P: $1,047 mm Base Capital AIRP SHARP Liquefaction BL England Other Drivers of growth Base capital AIRP SHARP BL England Liquefaction /Other • Storm Hardening and Reliability Program • Earn return on investments with annual roll - in • Planned spending of ~$170mm over 2016 - 2020P • Proposed ~$100mm pipeline to provide natural gas to the former BL England electric generating station • NJBPU approval received in December, appeals filed • ~$500mm planned capital spending over 2016 - 2020P • Two rate case filings expected through 2020 • Planned spending of ~$95mm over 2016 - 2020P

Conversions: Commercial Conversions: Residential New construction: Commercial New construction: Residential Utility Customer Trends and Drivers 10 % net growth + 1.0 % +1.7% +1.4% +1.3% + 1.7 % Strong customer growth $808 $1,250 $2,748 $3,340 Natural Gas Oil Propane Electricity Competitive economics of natural gas vs. other fuels (1) Fuel comparison based on March 2016 EIA data Annual Commodity Cost for a Typical Residential Customer (1) Gross Customer Additions 6,030 6,060 7,431 7,484 8,393 8,751 2010 2011 2012 2013 2014 2015

FERC Pipeline Expansion: Overview PennEast Pipeline Project • 20% equity owner in $1.0bn , 1 BCF, 118 - mile interstate pipeline from Marcellus region of PA into NJ • $ 200mm investment, with FERC - level returns projected • Application submitted September 24, 2015 • FERC Notice of Schedule indicates Environmental review slated for completion December 2016 • 2H 2018 targeted in - service date • Fully subscribed pipeline with 80% of capacity under 15 - year agreements with utility/energy affiliates of project sponsors 11 Opportunities exist beyond PennEast to participate in additional FERC regulated investments including LNG projects and natural gas pipelines

Non - Utility Business 12

Non - Utility Businesses: Overview 13 South Jersey Energy Solutions LLC SJ Energy Services SJ Energy Group Net Income: $22.0 mm Note: Financial statistics are 2015 actual Net Income: $ 16.2 mm • Wholesale and retail natural gas and electric commodity marketing • Fuel management services • Energy production portfolio (solar, CHP and landfill gas) • Meter reading, HVAC and appliance maintenance

Non - Utility Growth Summary 14 Business Line % Composition of Total SJI Economic Earnings (1) 2015A 2020 Target Wholesale & Retail Commodity 13% 11% - 14% Fuel Management 3% 6% - 9% Energy Production 14% 2% - 4% Other (HVAC, Meter Reading, SJEX) 2% 1% - 2% % of Total SJI EE 32% 20% – 29% Solar ITC Contribution 39% 0% • Well defined and implemented risk management policy including volumetric and monetary limits • Matched retail book approach with minimal open positions Wholesale & Retail Commodity • Potential to serve at least 10 high quality gas - fired generators by 2020 • Contract terms range from 4 to 10 years Fuel Management • Restructured business with focus on cash production • Solar: • Improving SREC values • Active hedging program • Substantial reduction in future capital deployment and elimination of ITC contribution • Remaining landfill projects support existing PPA with Borgata • Operating CHP assets continue adding to bottom line Energy Production (1) Economic Earnings is a non - GAAP measure; see Appendix for further information.

Financial Overview 15

Consistent Earnings and Dividend Growth 16 (1) Economic Earnings is a non - GAAP measure; see Appendix for further information. (2) Adjusted to exclude the impact of two non - recurring events: a write - off associated with SJI’s energy facility at the former Revel property, and costs related to the restructuring of SJI’s joint venture Energenic. In 2015 these two events reduced Economic Earnings and EPS by $17.4 million and $ 0.25 per share, respectively. (3) Adjusted for May 2015 Stock Split (4) Based on unadjusted Economic EPS of $1.44 Economic EPS (1) $1.35 $1.45 $1.51 $1.51 $1.57 $1.44 2010A 2011A 2012A 2013A 2014A 2015A Annualized Declared Dividend ($/share) $0.73 $0.81 $0.89 $0.95 $1.01 $1.05 2010A 2011A 2012A 2013A 2014A 2015A 50.4% 51.9% 54.5% 58.4% 61.3% 70.9% (4) Dividend Payout (3) : $1.69 (2)

Prudent Financial Management 17 $4 $175 $610 ($345) $444 $0 $200 $400 $600 $800 Cash Estimated gross proceeds from equity raise Existing credit facilities Borrowings under credit facilities Available liquidity $28 $216 $39 $19 $18 $1 $17 $1 $241 $56 $0 $100 $200 $300 2016 2017 2018 2019 2020 SJG SJI Debt Maturity Profile ($mm) Available Liquidity ($mm) Issuer S&P Moody’s South Jersey Industries Inc. BBB+ (Stable) N/A South Jersey Gas Company BBB+ (Stable) A2 (Stable) March 31, 2016 Equity 44% 56% Debt Equity 46% 54% Pro forma for Equity offering (1) Debt Capital Structure Credit Ratings Balanced financing strategy with a focus on maintaining strong investment grade credit ratings Note: Balance sheet data as of 3/31/16, pro forma for offering Note: A securities rating is not a recommendation to buy, sell or hold securities and may be revised or withdrawn at any time. (1) Assumes issuance of 6.5mm shares in the offering.

Highlights 18 Visible and high quality earnings growth story Attractive regulated businesses Low - risk Non - Utility business • Targeting a ~50% increase in economic earnings (1)(2) over 2015 - 2020 • ~$1.5bn capex program, ~93% related to regulated (Utility / FERC pipeline) businesses • Targeting ~70% - 80% of economic earnings from regulated businesses by 2020 • Includes elimination of ITC contribution to earnings • ~$1.0bn 2016 - 2020P natural gas distribution spend in constructive NJ regulatory jurisdiction: • Competitive ROE and infrastructure investment trackers • Above industry average customer growth anticipated, driven by natural gas conversions • 20% ownership interest in FERC regulated PennEast pipeline project • Favorable location creates potential for incremental opportunities 1 2 3 • Disciplined approach to non - regulated business • Primary focus on high quality earnings from contracted / “utility - like” assets • Proactive risk management strategy Commitment to strong financial position 4 • Track record of consistent dividend growth • Balanced financing strategy with commitment to strong investment grade ratings • Continued access to ample liquidity (1) Based on Management’s stated target of achieving $150mm in economic earnings by 202 0 . Factors, assumptions and beliefs of management and our board of directors on which our long - term goals were based may also prove to differ materially from actual future results. (2) SJI uses the non - GAAP measure of Economic Earnings (EE) when discussing results. See Appendix for further information.

Appendix 19
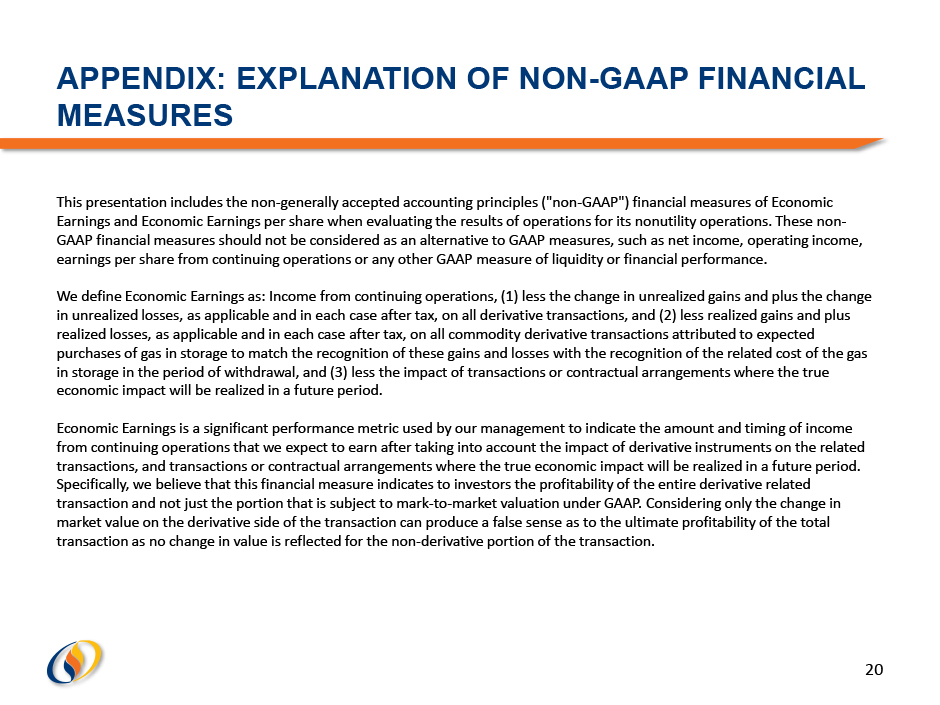
APPENDIX: EXPLANATION OF NON - GAAP FINANCIAL MEASURES 20 This presentation includes the non - generally accepted accounting principles ("non - GAAP") financial measures of Economic Earnings and Economic Earnings per share when evaluating the results of operations for its nonutility operations. These non - GAAP financial measures should not be considered as an alternative to GAAP measures, such as net income, operating income, earnings per share from continuing operations or any other GAAP measure of liquidity or financial performance. We define Economic Earnings as: Income from continuing operations, (1) less the change in unrealized gains and plus the chang e in unrealized losses, as applicable and in each case after tax, on all derivative transactions, and (2) less realized gains a nd plus realized losses, as applicable and in each case after tax, on all commodity derivative transactions attributed to expected purchases of gas in storage to match the recognition of these gains and losses with the recognition of the related cost of th e g as in storage in the period of withdrawal, and (3) less the impact of transactions or contractual arrangements where the true economic impact will be realized in a future period. Economic Earnings is a significant performance metric used by our management to indicate the amount and timing of income from continuing operations that we expect to earn after taking into account the impact of derivative instruments on the relat ed transactions, and transactions or contractual arrangements where the true economic impact will be realized in a future period . Specifically, we believe that this financial measure indicates to investors the profitability of the entire derivative relate d transaction and not just the portion that is subject to mark - to - market valuation under GAAP. Considering only the change in market value on the derivative side of the transaction can produce a false sense as to the ultimate profitability of the tota l transaction as no change in value is reflected for the non - derivative portion of the transaction.
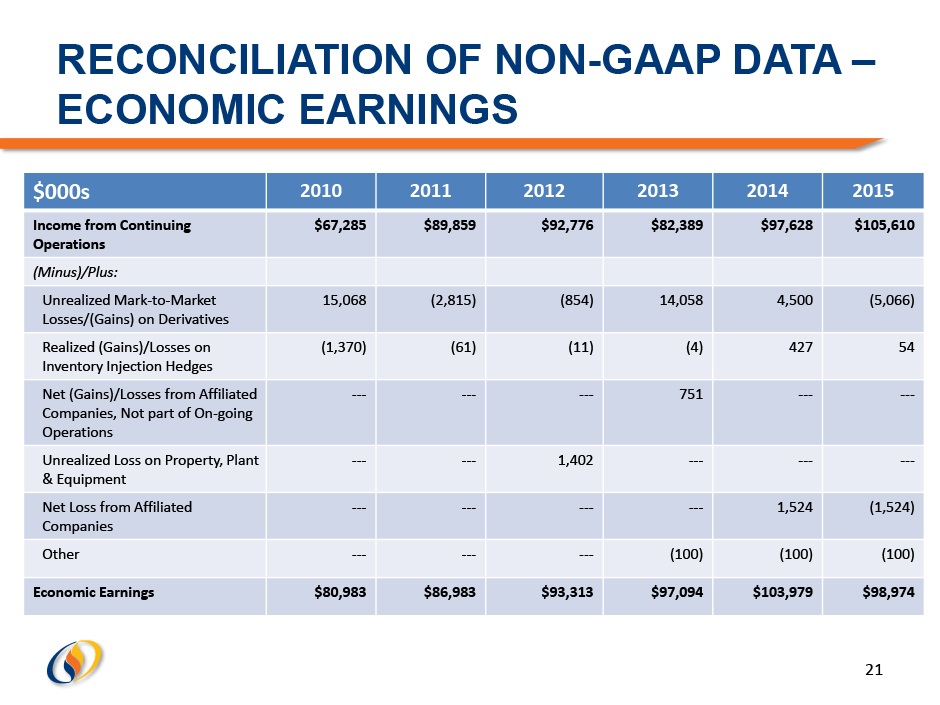
RECONCILIATION OF NON - GAAP DATA – ECONOMIC EARNINGS $000s 2010 2011 2012 2013 2014 2015 Income from Continuing Operations $67,285 $89,859 $92,776 $82,389 $97,628 $105,610 (Minus)/Plus: Unrealized Mark - to - Market Losses/(Gains) on Derivatives 15,068 (2,815) (854) 14,058 4,500 (5,066) Realized (Gains)/Losses on Inventory Injection Hedges (1,370) (61) (11) (4) 427 54 Net (Gains)/Losses from Affiliated Companies, Not part of On - going Operations --- --- --- 751 --- --- Unrealized Loss on Property, Plant & Equipment --- --- 1,402 --- --- --- Net Loss from Affiliated Companies --- --- --- --- 1,524 (1,524) Other --- --- --- (100) (100) (100) Economic Earnings $80,983 $86,983 $93,313 $97,094 $103,979 $98,974 21

RECONCILIATION OF NON - GAAP DATA – ECONOMIC EARNINGS PER SHARE 2010 2011 2012 2013 2014 2015 Earnings Per Share from Continuing Operations $1.13 $1.49 $1.50 $1.29 $1.47 $1.53 (Minus)/Plus : Unrealized Mark - to - Market Losses/(Gains) on Derivatives 0.22 (0.04) (0.02) 0.21 0.07 (0.07) Realized (Gains)/Losses on Inventory Injection Hedges --- --- --- --- --- --- Net (Gains)/Losses from Affiliated Companies, Not part of On - going Operations --- --- --- 0.01 --- --- Unrealized Loss on Property, Plant & Equipment --- --- 0.03 --- --- --- Net Loss from Affiliated Companies --- --- --- --- 0.03 (0.02) Economic EPS $1.35 $1.45 $1.51 $1.51 $1.57 $1.44 Write - offs/ Costs Associated w/ former Revel energy facility 0.23 Energenic Restructuring Transaction 0.02 2015 Adjusted Economic EPS $1.69 22

RECONCILIATION OF NON - GAAP DATA – ECONOMIC EARNINGS $000s 2015 Income from Continuing Operations $38,167 (Minus)/Plus: Unrealized Mark - to - Market Losses/(Gains) on Derivatives (5,066) Realized (Gains)/Losses on Inventory Injection Hedges 54 Net (Gains)/Losses from Affiliated Companies, Not part of On - going Operations --- Unrealized Loss on Property, Plant & Equipment --- Net Loss from Affiliated Companies (1,524) Other (100) Economic Earnings $31,531 23 South Jersey Energy Solutions