Attached files
| file | filename |
|---|---|
| 8-K - 8-K - Forestar Group Inc. | earningsq1168-k.htm |
| EX-99.1 - EXHIBIT 99.1 - Forestar Group Inc. | exh991forreleaseq116.htm |
Information on Execution of Key Initiatives and First Quarter 2016 Financial Results May 11, 2016 Exhibit 99.2
Notice to Investors This presentation contains “forward-looking statements” within the meaning of the federal securities laws. Forward-looking statements are typically identified by words or phrases such as “will,” “anticipate,” “estimate,” “expect,” “project,” “intend,” “plan,” “believe,” “target,” “forecast,” and other words and terms of similar meaning. These statements reflect management’s current views with respect to future events and are subject to risk and uncertainties. We note that a variety of factors and uncertainties could cause our actual results to differ significantly from the results discussed in the forward-looking statements, including but not limited to: general economic, market, or business conditions; market demand for our non-core assets;changes in commodity prices; opportunities (or lack thereof) that may be presented to us and that we may pursue; fluctuations in costs and expenses including development costs; demand for new housing, including impacts from mortgage credit rates or availability; lengthy and uncertain entitlement processes; cyclicality of our businesses; accuracy of accounting assumptions; competitive actions by other companies; changes in laws or regulations; and other factors, many of which are beyond our control. Except as required by law, we expressly disclaim any obligation to publicly revise any forward- looking statements contained in this presentation to reflect the occurrence of events after the date of this presentation. This presentation includes Non-GAAP financial measures. The required reconciliation to GAAP financial measures can be found as an exhibit to this presentation and on our website at www.forestargroup.com. 2
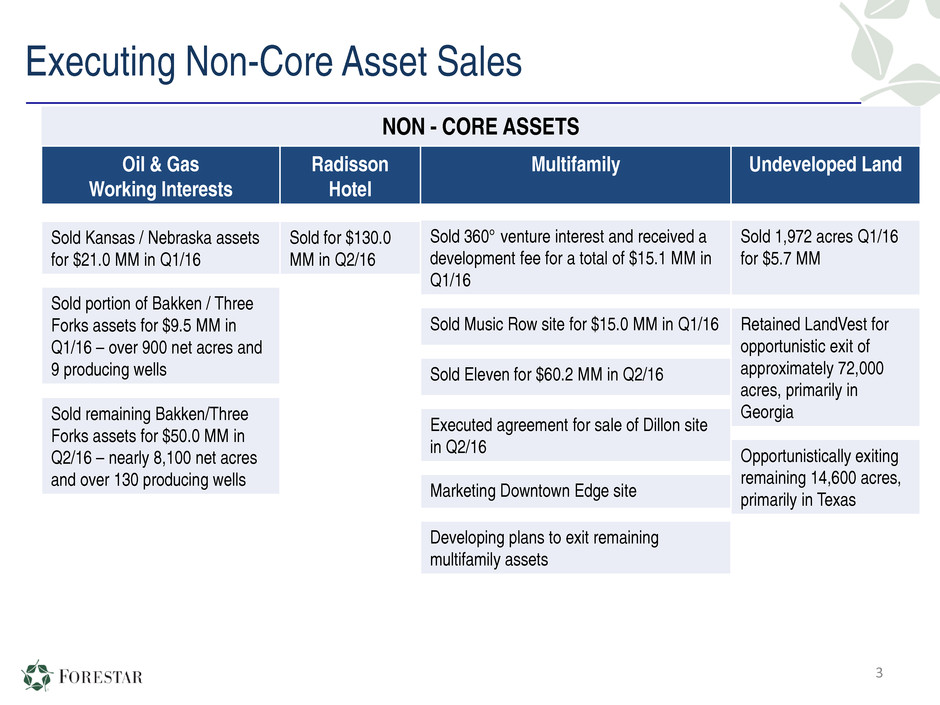
Executing Non-Core Asset Sales 3 NON - CORE ASSETS Oil & Gas Working Interests Radisson Hotel Sold Kansas / Nebraska assets for $21.0 MM in Q1/16 Sold for $130.0 MM in Q2/16 Sold portion of Bakken / Three Forks assets for $9.5 MM in Q1/16 – over 900 net acres and 9 producing wells Sold remaining Bakken/Three Forks assets for $50.0 MM in Q2/16 – nearly 8,100 net acres and over 130 producing wells Multifamily Sold 360° venture interest and received a development fee for a total of $15.1 MM in Q1/16 Sold Music Row site for $15.0 MM in Q1/16 Sold Eleven for $60.2 MM in Q2/16 Executed agreement for sale of Dillon site in Q2/16 Marketing Downtown Edge site Developing plans to exit remaining multifamily assets Undeveloped Land Sold 1,972 acres Q1/16 for $5.7 MM Retained LandVest for opportunistic exit of approximately 72,000 acres, primarily in Georgia Opportunistically exiting remaining 14,600 acres, primarily in Texas
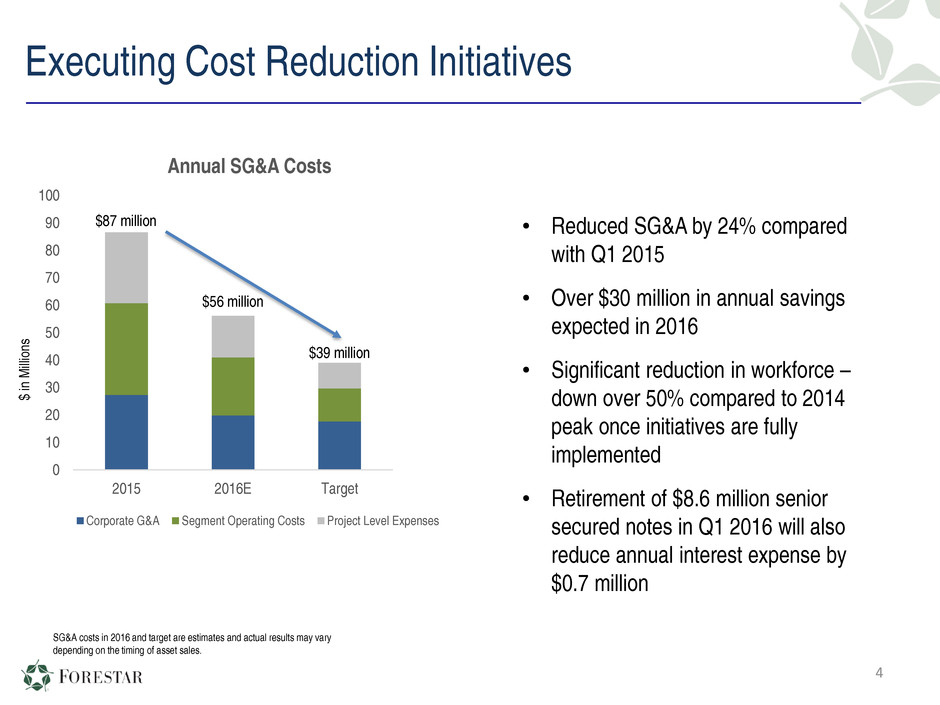
Executing Cost Reduction Initiatives 4 0 10 20 30 40 50 60 70 80 90 100 2015 2016E Target Annual SG&A Costs Corporate G&A Segment Operating Costs Project Level Expenses $39 million SG&A costs in 2016 and target are estimates and actual results may vary depending on the timing of asset sales. $87 million $ in M illi on s $56 million • Reduced SG&A by 24% compared with Q1 2015 • Over $30 million in annual savings expected in 2016 • Significant reduction in workforce – down over 50% compared to 2014 peak once initiatives are fully implemented • Retirement of $8.6 million senior secured notes in Q1 2016 will also reduce annual interest expense by $0.7 million
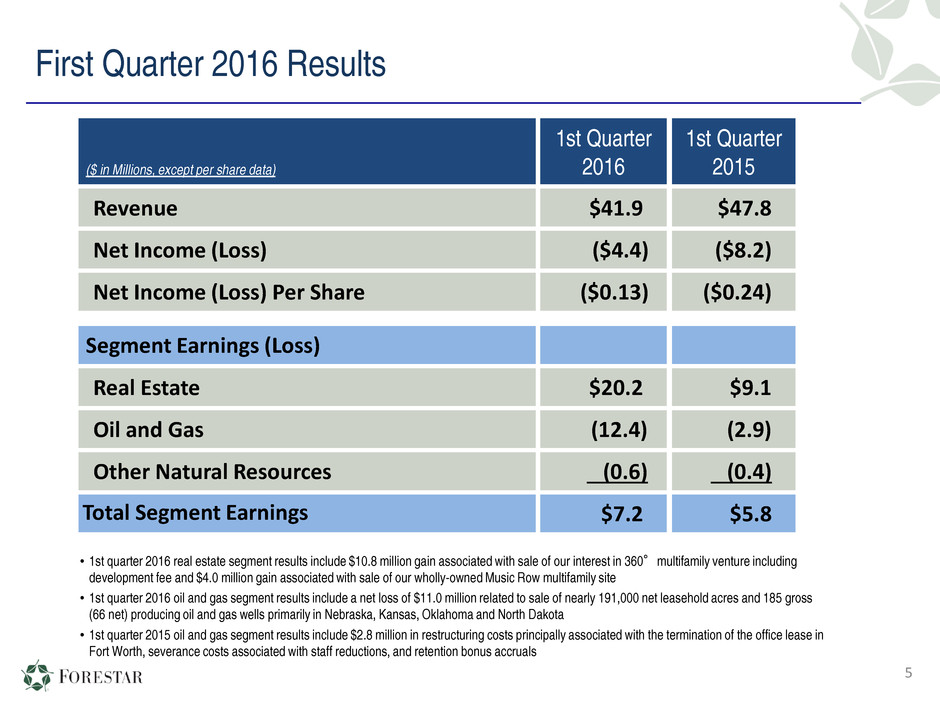
First Quarter 2016 Results • 1st quarter 2016 real estate segment results include $10.8 million gain associated with sale of our interest in 360°multifamily venture including development fee and $4.0 million gain associated with sale of our wholly-owned Music Row multifamily site • 1st quarter 2016 oil and gas segment results include a net loss of $11.0 million related to sale of nearly 191,000 net leasehold acres and 185 gross (66 net) producing oil and gas wells primarily in Nebraska, Kansas, Oklahoma and North Dakota • 1st quarter 2015 oil and gas segment results include $2.8 million in restructuring costs principally associated with the termination of the office lease in Fort Worth, severance costs associated with staff reductions, and retention bonus accruals 5 ($ in Millions, except per share data) 1st Quarter 2016 1st Quarter 2015 Revenue $41.9 $47.8 Net Income (Loss) ($4.4) ($8.2) Net Income (Loss) Per Share ($0.13) ($0.24) Segment Earnings (Loss) Real Estate $20.2 $9.1 Oil and Gas (12.4) (2.9) Other Natural Resources (0.6) (0.4) Total Segment Earnings $7.2 $5.8
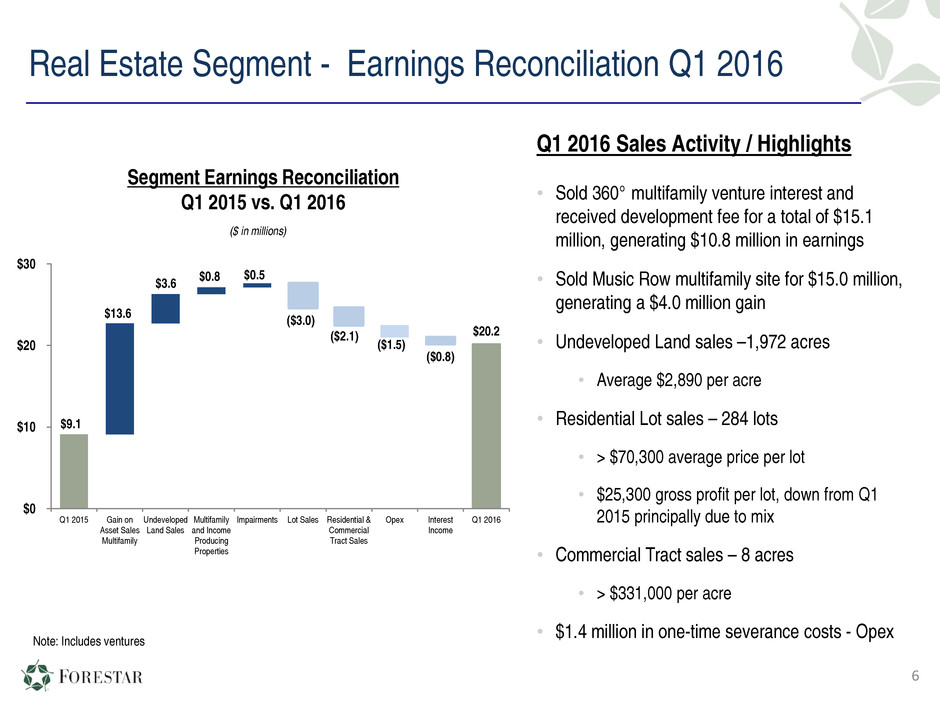
Real Estate Segment - Earnings Reconciliation Q1 2016 $0.5 ($3.0) $9.1 $13.6 $3.6 $0.8 ($2.1) ($1.5) ($0.8) $20.2 $0 $10 $20 $30 Q1 2015 Gain on Asset Sales Multifamily Undeveloped Land Sales Multifamily and Income Producing Properties Impairments Lot Sales Residential & Commercial Tract Sales Opex Interest Income Q1 2016 Segment Earnings Reconciliation Q1 2015 vs. Q1 2016 ($ in millions) Q1 2016 Sales Activity / Highlights • Sold 360° multifamily venture interest and received development fee for a total of $15.1 million, generating $10.8 million in earnings • Sold Music Row multifamily site for $15.0 million, generating a $4.0 million gain • Undeveloped Land sales –1,972 acres • Average $2,890 per acre • Residential Lot sales – 284 lots • > $70,300 average price per lot • $25,300 gross profit per lot, down from Q1 2015 principally due to mix • Commercial Tract sales – 8 acres • > $331,000 per acre • $1.4 million in one-time severance costs - Opex 6 Note: Includes ventures

Stable Market Demand in Most of our Key Markets 7Note: Includes venturesSource: Bureau of Labor Statistics March 2016 vs. March 2015 Austin 4.2% Dallas / Fort Worth 3.8% Houston 0.3% San Antonio 2.8% Atlanta 3.1% Charlotte 2.7% Nashville 3.6% U.S. Average 2.0% Job Growth vs. National Average 0 500 1,000 1,500 2,000 Q 11 2 Q 21 2 Q 31 2 Q 41 2 Q 11 3 Q 21 3 Q 31 3 Q 41 3 Q 11 4 Q 21 4 Q 31 4 Q 41 4 Q 11 5 Q 21 5 Q 31 5 Q 41 5 Q 11 6 Re sid en tia l L ot s Developed Lots Lots Under Development Forestar: > 1,380 Lots Under Option Contract • Job growth in our key markets holding well above U.S. average (excluding Houston) • Full year planned lot sales at or ahead of target in all of our markets We continue to target 2016 residential lot sales of 1,600 – 1,800 lots

8
9 Appendix
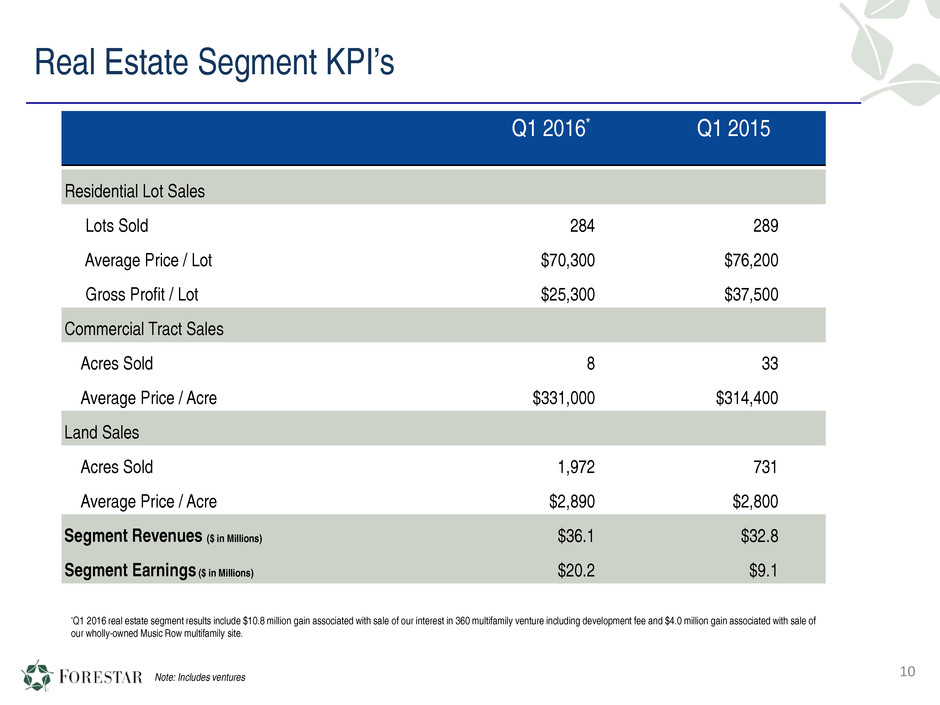
Real Estate Segment KPI’s Q1 2016* Q1 2015 Residential Lot Sales Lots Sold 284 289 Average Price / Lot $70,300 $76,200 Gross Profit / Lot $25,300 $37,500 Commercial Tract Sales Acres Sold 8 33 Average Price / Acre $331,000 $314,400 Land Sales Acres Sold 1,972 731 Average Price / Acre $2,890 $2,800 Segment Revenues ($ in Millions) $36.1 $32.8 Segment Earnings ($ in Millions) $20.2 $9.1 *Q1 2016 real estate segment results include $10.8 million gain associated with sale of our interest in 360 multifamily venture including development fee and $4.0 million gain associated with sale of our wholly-owned Music Row multifamily site. Note: Includes ventures 10
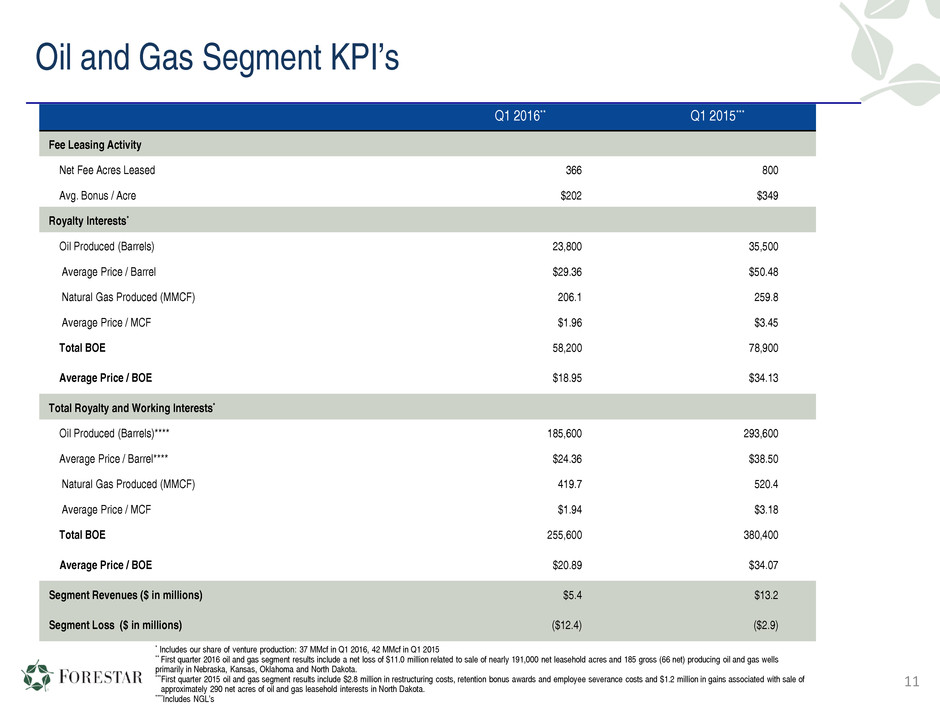
Oil and Gas Segment KPI’s Q1 2016** Q1 2015*** Fee Leasing Activity Net Fee Acres Leased 366 800 Avg. Bonus / Acre $202 $349 Royalty Interests* Oil Produced (Barrels) 23,800 35,500 Average Price / Barrel $29.36 $50.48 Natural Gas Produced (MMCF) 206.1 259.8 Average Price / MCF $1.96 $3.45 Total BOE 58,200 78,900 Average Price / BOE $18.95 $34.13 Total Royalty and Working Interests* Oil Produced (Barrels)**** 185,600 293,600 Average Price / Barrel**** $24.36 $38.50 Natural Gas Produced (MMCF) 419.7 520.4 Average Price / MCF $1.94 $3.18 Total BOE 255,600 380,400 Average Price / BOE $20.89 $34.07 Segment Revenues ($ in millions) $5.4 $13.2 Segment Loss ($ in millions) ($12.4) ($2.9) * Includes our share of venture production: 37 MMcf in Q1 2016, 42 MMcf in Q1 2015 ** First quarter 2016 oil and gas segment results include a net loss of $11.0 million related to sale of nearly 191,000 net leasehold acres and 185 gross (66 net) producing oil and gas wells primarily in Nebraska, Kansas, Oklahoma and North Dakota. ***First quarter 2015 oil and gas segment results include $2.8 million in restructuring costs, retention bonus awards and employee severance costs and $1.2 million in gains associated with sale of approximately 290 net acres of oil and gas leasehold interests in North Dakota. ****Includes NGL’s 11
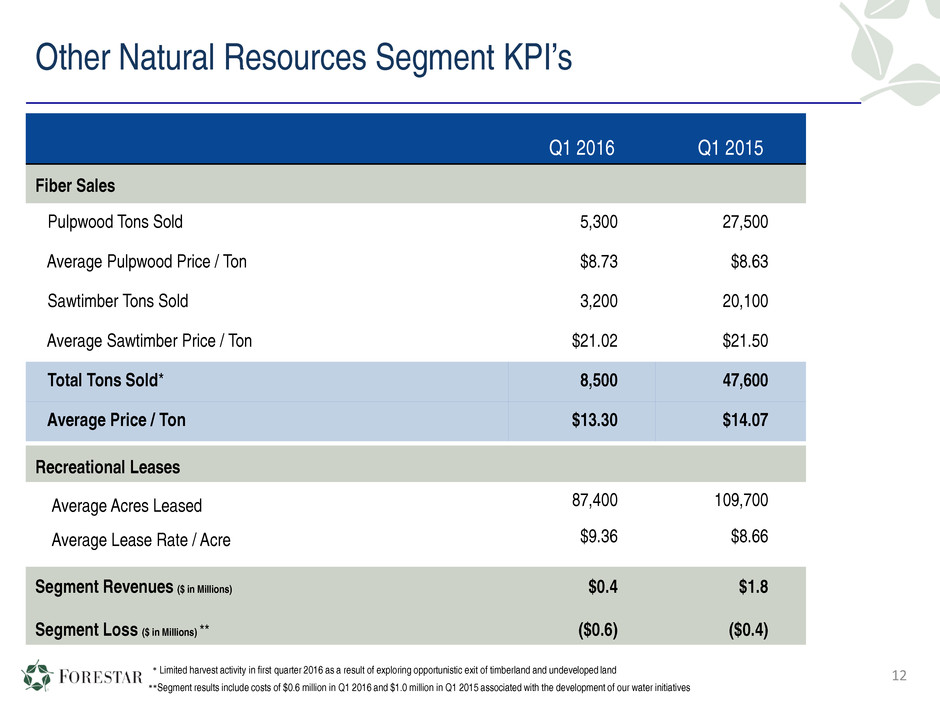
Other Natural Resources Segment KPI’s Q1 2016 Q1 2015 Fiber Sales Pulpwood Tons Sold 5,300 27,500 Average Pulpwood Price / Ton $8.73 $8.63 Sawtimber Tons Sold 3,200 20,100 Average Sawtimber Price / Ton $21.02 $21.50 Total Tons Sold* 8,500 47,600 Average Price / Ton $13.30 $14.07 Recreational Leases Average Acres Leased 87,400 109,700 Average Lease Rate / Acre $9.36 $8.66 Segment Revenues ($ in Millions) $0.4 $1.8 Segment Loss ($ in Millions) ** ($0.6) ($0.4) **Segment results include costs of $0.6 million in Q1 2016 and $1.0 million in Q1 2015 associated with the development of our water initiatives 12* Limited harvest activity in first quarter 2016 as a result of exploring opportunistic exit of timberland and undeveloped land
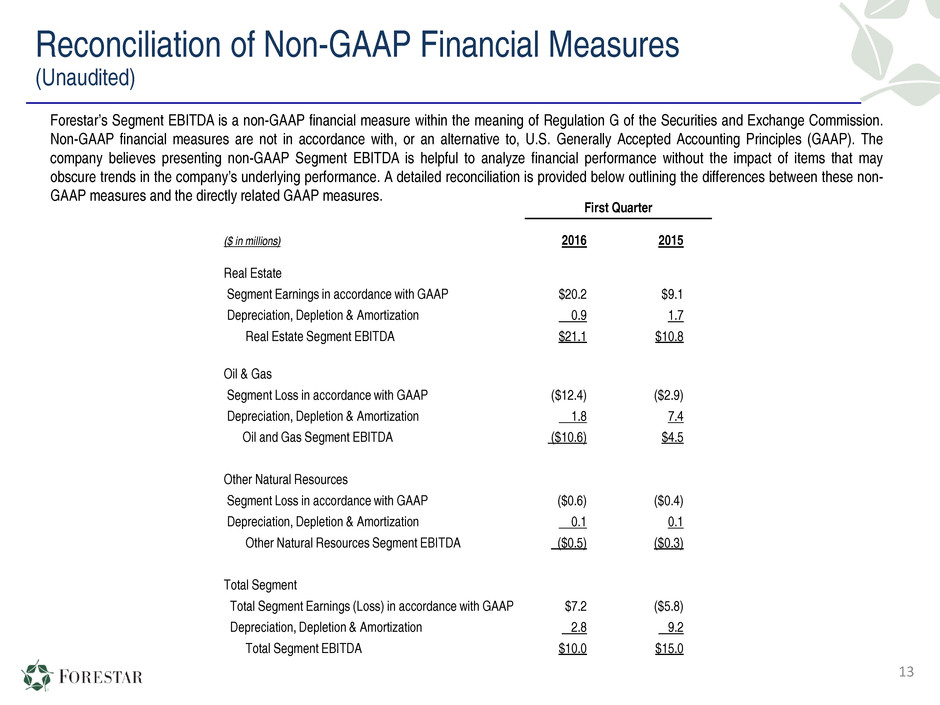
Reconciliation of Non-GAAP Financial Measures (Unaudited) Forestar’s Segment EBITDA is a non-GAAP financial measure within the meaning of Regulation G of the Securities and Exchange Commission. Non-GAAP financial measures are not in accordance with, or an alternative to, U.S. Generally Accepted Accounting Principles (GAAP). The company believes presenting non-GAAP Segment EBITDA is helpful to analyze financial performance without the impact of items that may obscure trends in the company’s underlying performance. A detailed reconciliation is provided below outlining the differences between these non- GAAP measures and the directly related GAAP measures. First Quarter ($ in millions) 2016 2015 Real Estate Segment Earnings in accordance with GAAP $20.2 $9.1 Depreciation, Depletion & Amortization 0.9 1.7 Real Estate Segment EBITDA $21.1 $10.8 Oil & Gas Segment Loss in accordance with GAAP ($12.4) ($2.9) Depreciation, Depletion & Amortization 1.8 7.4 Oil and Gas Segment EBITDA ($10.6) $4.5 Other Natural Resources Segment Loss in accordance with GAAP ($0.6) ($0.4) Depreciation, Depletion & Amortization 0.1 0.1 Other Natural Resources Segment EBITDA ($0.5) ($0.3) Total Segment Total Segment Earnings (Loss) in accordance with GAAP $7.2 ($5.8) Depreciation, Depletion & Amortization 2.8 9.2 Total Segment EBITDA $10.0 $15.0 13

14
