Attached files
| file | filename |
|---|---|
| 8-K - FORM 8-K - UMPQUA HOLDINGS CORP | umpq8-kdadcoconference4x9x.htm |

UMPQUA HOLDINGS CORPORATION DA Davidson Financial Institutions Conference May 10, 2016

Forward-looking Statements 2 This presentation includes forward-looking statements within the meaning of the “Safe-Harbor” provisions of the Private Securities Litigation Reform Act of 1995, which management believes are a benefit to shareholders. These statements are necessarily subject to risk and uncertainty and actual results could differ materially due to various risk factors, including those set forth from time to time in our filings with the SEC. You should not place undue reliance on forward-looking statements and we undertake no obligation to update any such statements. In this presentation we make forward-looking statements about credit discount accretion related to loans acquired from Sterling Financial Corporation, loan and lease growth and loan sales, and planned investments and results of new initiatives. Risks that could cause results to differ from forward-looking statements we make are set forth in our filings with the SEC and include, without limitation, prolonged low interest rate environment; unanticipated weakness in loan demand or loan pricing; deterioration in the economy; lack of strategic growth opportunities or our failure to execute on those opportunities; our inability to effectively manage problem credits; our ability to successfully develop and market new products and technology; changes in laws or regulations; and changes in general economic conditions.

The World’s Greatest Bank 3 • Headquarters: • Ticker: • Assets: • Loans & Leases: • Deposits: • Market Cap: • Footprint: Umpqua Holdings Corporation (1) > (1) As of March 31, 2016, except for market cap which is as of May 5, 2016. Portland, OR UMPQ (NASDAQ) $23.9bn $16.9bn $18.2bn $3.3bn Oregon, Wash., Calif., Nevada, Idaho

Well-positioned In Key Growth Markets on West Coast 4 > Source: SNL Financial. • MSA projected population change (2016 – 2021) of 6.69% Portland Sacramento • MSA projected population change (2016 – 2021) of 5.90% Reno Seattle San Francisco San Diego • MSA projected population change (2016 – 2021) of 5.69% • MSA Projected population change (2016 – 2021) of 5.52% • MSA Projected population change (2016 – 2021) of 4.98% • MSA projected population change (2016 – 2021) of 5.18% U.S. Aggregate • Projected population change (2016 – 2021) of 3.69%

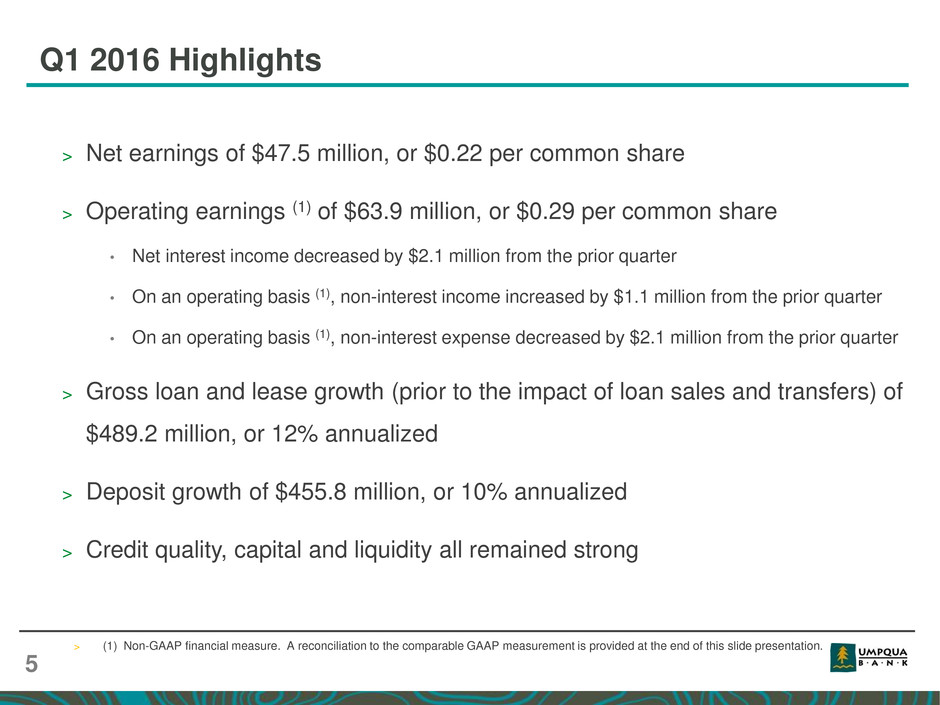
Q1 2016 Highlights 5 > Net earnings of $47.5 million, or $0.22 per common share > Operating earnings (1) of $63.9 million, or $0.29 per common share • Net interest income decreased by $2.1 million from the prior quarter • On an operating basis (1), non-interest income increased by $1.1 million from the prior quarter • On an operating basis (1), non-interest expense decreased by $2.1 million from the prior quarter > Gross loan and lease growth (prior to the impact of loan sales and transfers) of $489.2 million, or 12% annualized > Deposit growth of $455.8 million, or 10% annualized > Credit quality, capital and liquidity all remained strong > (1) Non-GAAP financial measure. A reconciliation to the comparable GAAP measurement is provided at the end of this slide presentation.

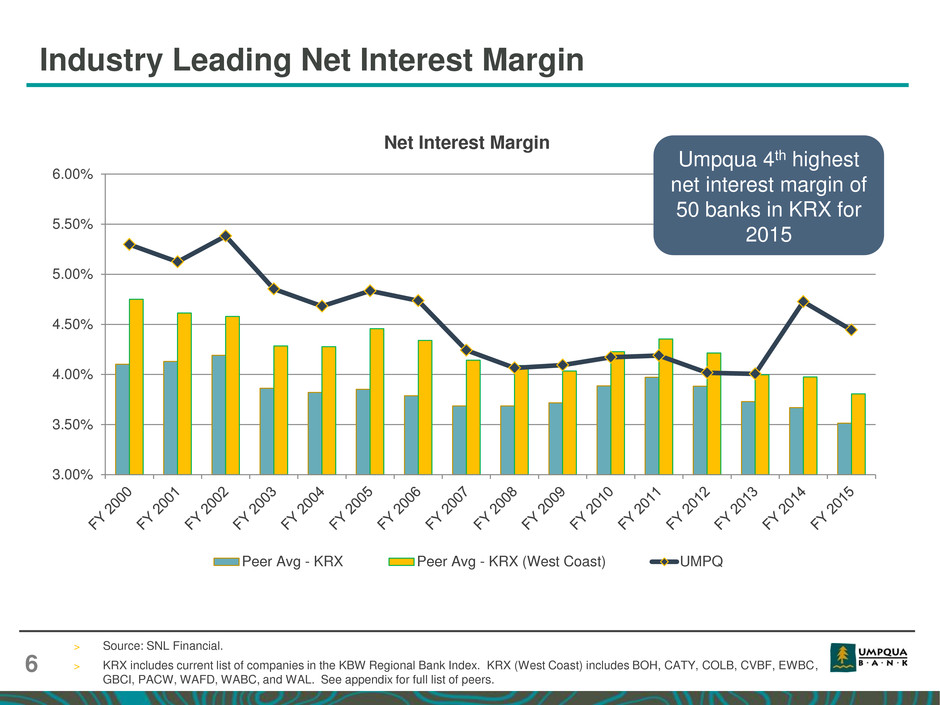
Industry Leading Net Interest Margin 6 3.00% 3.50% 4.00% 4.50% 5.00% 5.50% 6.00% Net Interest Margin Peer Avg - KRX Peer Avg - KRX (West Coast) UMPQ > Source: SNL Financial. > KRX includes current list of companies in the KBW Regional Bank Index. KRX (West Coast) includes BOH, CATY, COLB, CVBF, EWBC, GBCI, PACW, WAFD, WABC, and WAL. See appendix for full list of peers. Umpqua 4th highest net interest margin of 50 banks in KRX for 2015

Current Net Interest Income and Margin Trends 7 $215.1 $217.5 $219.2 $219.8 $217.7 4.51% 4.48% 4.42% 4.37% 4.34% 2.00% 3.00% 4.00% 5.00% 6.00% 7.00% $100 $120 $140 $160 $180 $200 $220 $240 Q1 2015 Q2 2015 Q3 2015 Q4 2015 Q1 2016 Net interest income Net interest margin (in millions) 4.15% 4.13% 4.09% 4.08% 3.98% Net interest margin, excluding interest income related to credit discount from Sterling deal and related to 310-30 covered loan PIFs

Low Cost Deposit Franchise 8 $16,323 $16,728 $16,892 $17,221 $17,131 $17,467 $17,707 $18,163 0.22% 0.22% 0.23% 0.24% 0.24% 0.24% 0.26% 0.27% 0.00% 0.10% 0.20% 0.30% 0.40% 0.50% 0.60% 0.70% 0.80% $15,000 $15,500 $16,000 $16,500 $17,000 $17,500 $18,000 $18,500 Q2 2014 Q3 2014 Q4 2014 Q1 2015 Q2 2015 Q3 2015 Q4 2015 Q1 2016 Total Deposits Cost of Interest-bearing Deposits (in millions) KRX Average Cost of Interest-bearing Deposits (1) – 0.33% Deposit Composition As of Mar 31, 2016 Demand , non- interest bearing 30% Demand , interest bearing 12% Money market 37% Savings 7% Time 14% > (1) Source: SNL Financial. > KRX includes current list of companies in the KBW Regional Bank Index. See appendix for full list of peers. Total Deposits and Cost of Interest-bearing Deposits

Consistent Loan Growth 9 Annualized Gross Loan and Lease Growth Rate (1) 5% 7% 4% 8% 12% 12% 11% 12% 0% 2% 4% 6% 8% 10% 12% 14% Q2 2014 Q3 2014 Q4 2014 Q1 2015 Q2 2015 Q3 2015 Q4 2015 Q1 2016 > (1) Annualized gross loan and lease growth prior to the impact of loan sales and loans transferred into held for sale during Q1 2016. Loan-to- Deposit Ratio 93.3% 95.1% 93.8% 90.7% 90.3% 93.2% 92.7% 91.2%

Managing Loan Concentration Over Time 10 Gross Loan and Lease Concentration (1) > (1) Investor CRE includes non-owner occupied CRE, multifamily, commercial construction and residential development. Commercial includes term, lines of credit & other, owner occupied CRE and leases. Consumer includes mortgage, HELOC, and other consumer. 50% 47% 45% 44% 43% 42% 44% 44% 45% 45% 8% 9% 11% 12% 12% 0% 10% 20% 30% 40% 50% 60% 70% 80% 90% 100% FYE 2009 FYE 2010 FYE 2011 FYE 2012 FYE 2013 Investor CRE Commercial Consumer 42% 41% 41% 41% 41% 40% 39% 39% 37% 37% 36% 36% 35% 35% 35% 35% 21% 22% 23% 23% 24% 25% 26% 26% Q2 2014 Q3 2014 Q4 2014 Q1 2015 Q2 2015 Q3 2015 Q4 2015 Q1 2016 Investor CRE Commercial Consumer Pre Sterling merger Post Sterling merger

Blended New Production Yield: 10.70% Credit Type: A (67%), B/C (33%) Average Loan Size: $27,000 60+ Delinquency Rate: 1.29% Strong Growth in Leasing Portfolio 11 Leasing & Equipment Finance Portfolio (“FinPac”) $336 $362 $388 $464 $492 $523 $570 $631 $679 $729 $792 $0 $100 $200 $300 $400 $500 $600 $700 $800 $900 Q3 2013 Q4 2013 Q1 2014 Q2 2014 Q3 2014 Q4 2014 Q1 2015 Q2 2015 Q3 2015 Q4 2015 Q1 2016 (in millions) CAGR of 37% Portfolio Details (as of March 31, 2016)

Scalable Mortgage Banking Business 12 $895 $988 $942 $1,173 $1,444 $1,290 $1,147 $1,097 3.55% 3.46% 2.95% 3.65% 3.38% 3.19% 3.19% 3.72% 0.00% 2.00% 4.00% 6.00% 8.00% $0 $200 $400 $600 $800 $1,000 $1,200 $1,400 $1,600 Q2 2014 Q3 2014 Q4 2014 Q1 2015 Q2 2015 Q3 2015 Q4 2015 Q1 2016 Mortgage Originations Gain on Sale Margin (in millions) Total Mortgage Originations and Gain On Sale Margin $20.2 $23.9 $23.0 $27.9 $32.8 $30.5 $28.6 $28.6 $0 $10 $20 $30 $40 $50 $60 Q2 2014 Q3 2014 Q4 2014 Q1 2015 Q2 2015 Q3 2015 Q4 2015 Q1 2016 Home Lending Operating Expense (in millions)

Progress in Efficiency Initiatives 13 $178.5 $180.1 $177.2 $182.2 $180.1 61.09% 59.96% 60.17% 63.00% 62.49% 55.0% 57.0% 59.0% 61.0% 63.0% 65.0% 67.0% 69.0% $105.0 $115.0 $125.0 $135.0 $145.0 $155.0 $165.0 $175.0 $185.0 $195.0 Q1 2015 Q2 2015 Q3 2015 Q4 2015 Q1 2016 Non-interest expense Efficiency ratio (operating) (1) (1) > (1) Non-GAAP financial measure. A reconciliation to the comparable GAAP measurement is provided at the end of this slide presentation. Non-Interest Expense and Efficiency Ratio (Operating Basis) (1)

Track Record of Prudent Capital Management 14 (in millions) $0 $50 $100 $150 $200 $250 FY 2010 FY 2011 FY 2012 FY 2013 FY 2014 FY 2015 Net Earnings to Common Shareholders Dividends Repurchases

Stable Credit Quality 15 0.77% 0.80% 0.79% 0.77% 0.77% 0.00% 0.50% 1.00% 1.50% 2.00% 2.50% 3.00% Q1 2015 Q2 2015 Q3 2015 Q4 2015 Q1 2016 Allowance for loan and lease losses to loans and leases 0.36% 0.31% 0.28% 0.29% 0.30% 0.00% 0.20% 0.40% 0.60% 0.80% 1.00% Q1 2015 Q2 2015 Q3 2015 Q4 2015 Q1 2016 Non-performing assets to total assets (1) 0.23% 0.11% 0.13% 0.10% 0.12% 0.00% 0.20% 0.40% 0.60% 0.80% 1.00% Q1 2015 Q2 2015 Q3 2015 Q4 2015 Q1 2016 Net charge-offs to average loans and leases (annualized) Ratio after grossing up for value of Sterling-related credit mark remaining at quarter end 1.8% 1.6% 1.7% 1.5% 1.4% > (1) Excludes non-performing mortgage loans guaranteed by Ginnie Mae, which Umpqua has the unilateral right to repurchase but has not done so.

Questions?

Appendix

Non-GAAP Reconciliation – Operating Earnings 18

Non-GAAP Reconciliation – Operating Earnings 19

Non-GAAP Reconciliation – Tangible Book Value 20

KRX Peer List 21
