Attached files
| file | filename |
|---|---|
| 8-K - FORM 8-K - OLIN Corp | form8kwellsfargopres5102016.htm |

Wells Fargo Industrial & Construction Conference New York, NY May 10, 2016 TM Exhibit 99.1

Forward-Looking Statements 2 This communication includes forward-looking statements. These statements relate to analyses and other information that are based on management’s beliefs, certain assumptions made by management, forecasts of future results, and current expectations, estimates and projections about the markets and economy in which we and our various segments operate. These statements may include statements regarding our recent acquisition of the U.S. chlor alkali and downstream derivatives businesses, the expected benefits and synergies of the transaction, and future opportunities for the combined company following the transaction. The statements contained in this communication that are not statements of historical fact may include forward-looking statements that involve a number of risks and uncertainties. We have used the words “anticipate,” “intend,” “may,” “expect,” “believe,” “should,” “plan,” “project,” “estimate,” “forecast,” “optimistic,” and variations of such words and similar expressions in this communication to identify such forward-looking statements. These statements are not guarantees of future performance and involve certain risks, uncertainties and assumptions, which are difficult to predict and many of which are beyond our control. Therefore, actual outcomes and results may differ materially from those matters expressed or implied in such forward- looking statements. Factors that could cause or contribute to such differences include, but are not limited to: factors relating to the possibility that Olin may be unable to achieve expected synergies and operating efficiencies in connection with the transaction within the expected time-frames or at all; the integration of the acquired chlorine products businesses being more difficult, time-consuming or costly than expected; the effect of any changes resulting from the transaction in customer, supplier and other business relationships; general market perception of the transaction; exposure to lawsuits and contingencies associated with the acquired chlorine products business; the ability to attract and retain key personnel; prevailing market conditions; changes in economic and financial conditions of our chlorine products business; uncertainties and matters beyond the control of management; and the other risks detailed in Olin’s Form 10-K for the fiscal year ended December 31, 2015 and Olin’s Form 10-Q for the fiscal quarter ended March 31, 2016. The forward-looking statements should be considered in light of these factors. In addition, other risks and uncertainties not presently known to Olin or that Olin considers immaterial could affect the accuracy of our forward-looking statements. The reader is cautioned not to rely unduly on these forward-looking statements. Olin undertakes no obligation to update publicly any forward-looking statements, whether as a result of future events, new information or otherwise.

Near-Term Strategic Priorities 3 TARGET: 2-3 YEARS Achieve EBITDA of $915 million to $985 million in 2016 Integrate Chlor Alkali Products and Vinyls and Epoxy businesses Deliver cost synergies of $250 million and revenue synergies of $100 million by 2019 Reduce net debt to EBITDA to 2.5x – 3.0x by 2017 Committed to shareholder remuneration via quarterly dividend

4 Key Considerations for Success 1. Portfolio Balance 3. Cost-Advantaged Position 4. Market Dynamics 5. Synergy Potential 2. Reduced Cyclicality and Expanded Product Diversity Chlor Alkali and Vinyls Epoxy Winchester • Upside from Caustic • Upside from EDC Prices • $250 Million in Cost Synergies • $100 Million in Revenue Synergies • Reduced Merchant Chlorine and Caustic Soda Exposure • Significantly Expanded Chlorine Use Diversity • Exposure to China Minimal • Europe Becoming Net Importer of Caustic • Low-Cost Energy • Low-Cost Brine • Membrane Cell Technology • Ethylene
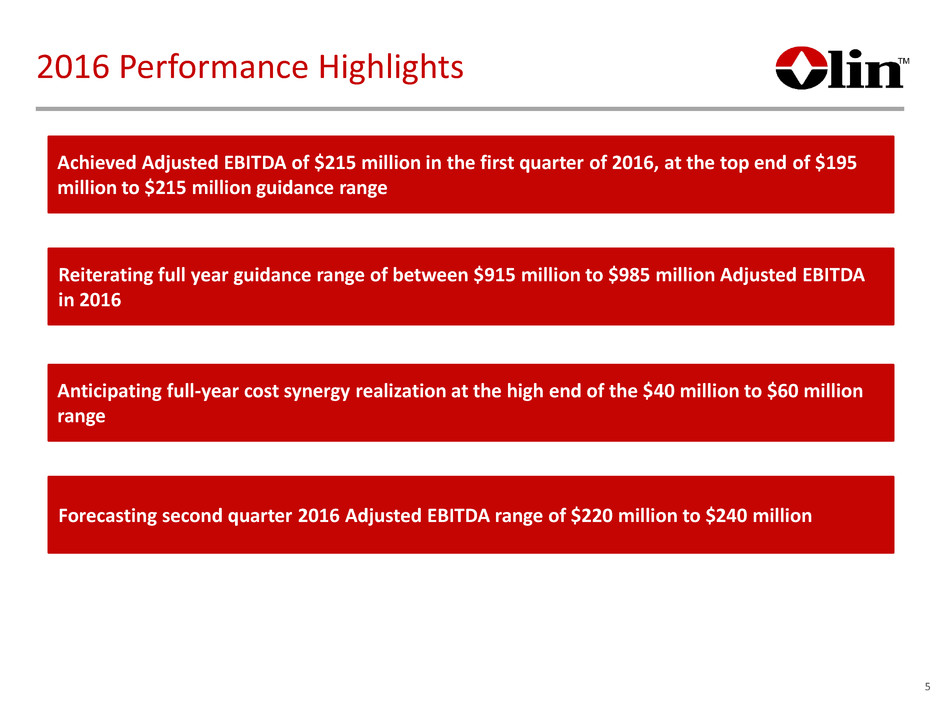
2016 Performance Highlights Achieved Adjusted EBITDA of $215 million in the first quarter of 2016, at the top end of $195 million to $215 million guidance range Reiterating full year guidance range of between $915 million to $985 million Adjusted EBITDA in 2016 Forecasting second quarter 2016 Adjusted EBITDA range of $220 million to $240 million Anticipating full-year cost synergy realization at the high end of the $40 million to $60 million range 5

Chlor Alkali and Vinyls: Unique Value Proposition LOW COST POSITIONS ACROSS INTEGRATED BUSINESS GLOBALLY AND REGIONALLY ADVANTAGED COST POSITION WITH TOP-TIER INTEGRATED PRODUCER ECONOMICS LEADING INDUSTRY POSITIONS WITH UNPARALLELED SCALE DIVERSIFIED END USE PORTFOLIO WITH UNMATCHED BREADTH OF CHLORINE OUTLETS LOGISTICS ADVANTAGE 6
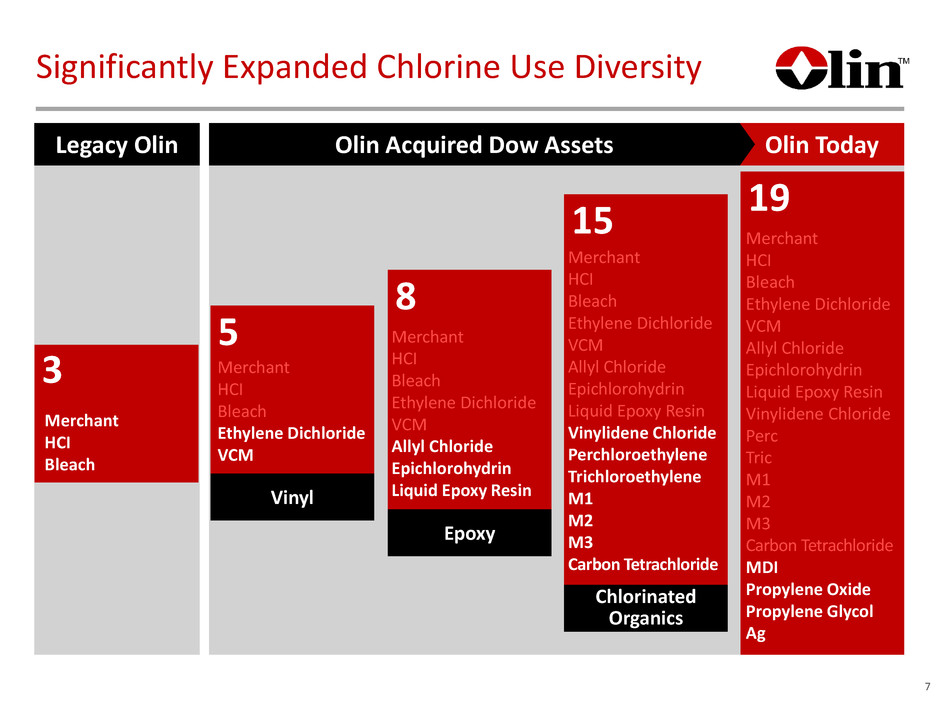
Significantly Expanded Chlorine Use Diversity 7 3 Merchant HCI Bleach 19 Merchant HCI Bleach Ethylene Dichloride VCM Allyl Chloride Epichlorohydrin Liquid Epoxy Resin Vinylidene Chloride Perc Tric M1 M2 M3 Carbon Tetrachloride MDI Propylene Oxide Propylene Glycol Ag 5 Merchant HCI Bleach Ethylene Dichloride VCM Vinyl 8 Merchant HCI Bleach Ethylene Dichloride VCM Allyl Chloride Epichlorohydrin Liquid Epoxy Resin Epoxy 15 Merchant HCI Bleach Ethylene Dichloride VCM Allyl Chloride Epichlorohydrin Liquid Epoxy Resin Vinylidene Chloride Perchloroethylene Trichloroethylene M1 M2 M3 Carbon Tetrachloride Chlorinated Organics Legacy Olin Olin Today Olin Acquired Dow Assets
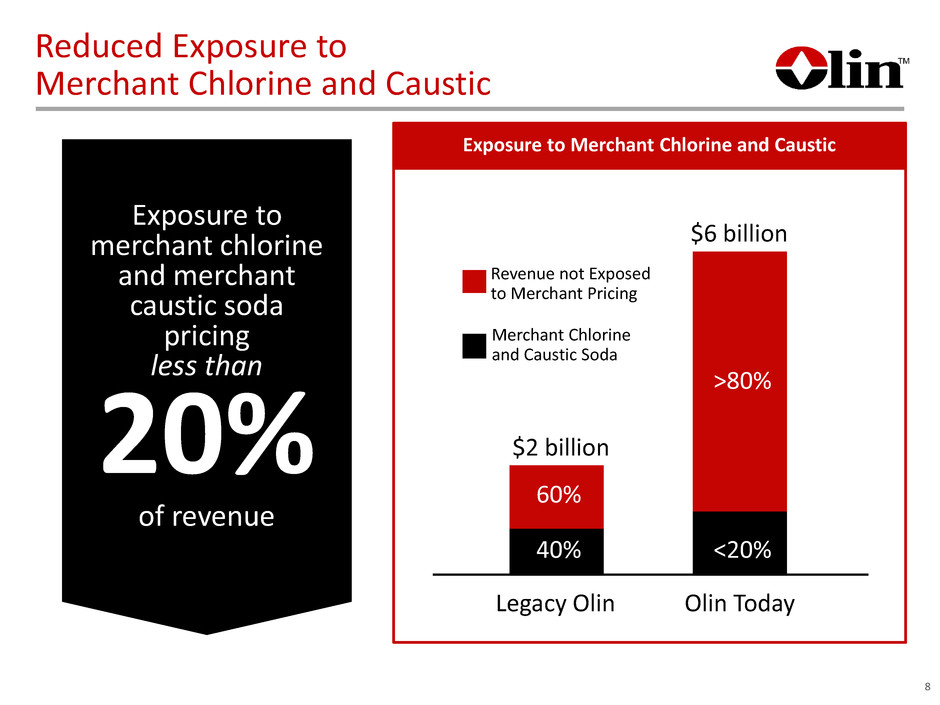
Reduced Exposure to Merchant Chlorine and Caustic Exposure to merchant chlorine and merchant caustic soda pricing less than 20% of revenue 8 Legacy Olin Merchant Chlorine and Caustic Soda Revenue not Exposed to Merchant Pricing 40% 60% $2 billion <20% >80% $6 billion Exposure to Merchant Chlorine and Caustic Olin Today

Current Industry Conditions Near Trough Levels 0 100 200 300 400 500 600 700 800 2 0 0 5 2 0 0 6 2 0 0 7 2 0 0 8 2 0 0 9 2 0 1 0 2 0 1 1 2 0 1 2 2 0 1 3 2 0 1 4 2 0 1 5 NA Caustic Soda Prices (Contract Netback, $/Dry MT) 9 Source: IHS EDC Spot Export Prices (Cents per Pound) 0 5 10 15 20 25

Long-term Views on Caustic Soda North American chlor alkali capacity reductions No major North American chlor alkali capacity additions announced Increasing North American caustic exports European mercury cell chlor alkali production sunset by the end of 2017 Growing caustic soda consumption within China 10

11 Regional Advantaged Market Dynamics Source: IHS and Euro Chlor (800) (600) (400) (200) 0 200 400 600 0 200 400 600 800 1000 1200 1400 kM T Import Export Balance Europe Caustic Import/Export Balance • 2.8 million metric tons of mercury capacity in Europe is subject to conversion or closure by year end 2017 • We expect total closures to be 1.3 million to 1.5 million metric tons, greater than 10% of European capacity • 0.8 million metric tons have been announced to close or have already closed • Cash costs (electricity, salt and fixed operating costs) are higher in China than in the U.S. • Freight costs play a major role • Chinese exports into the 12 million ton U.S. market were ~70,000 tons (<1%) 176 217 272 316 316 ME US China WE NEA Favorable Cost Position for US Producers ECU Cash Cost ($ per ton)
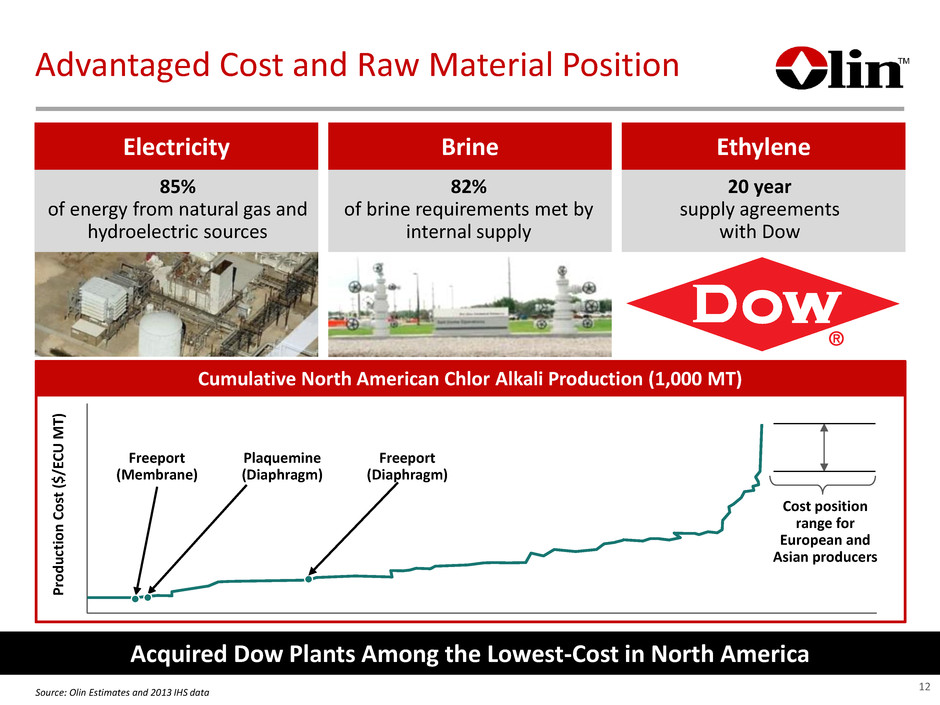
Electricity Brine Ethylene Advantaged Cost and Raw Material Position 85% of energy from natural gas and hydroelectric sources 82% of brine requirements met by internal supply 20 year supply agreements with Dow Cumulative North American Chlor Alkali Production (1,000 MT) P ro d u ct io n C o st ($/ ECU M T) Source: Olin Estimates and 2013 IHS data Cost position range for European and Asian producers Plaquemine (Diaphragm) Freeport (Diaphragm) Freeport (Membrane) 12 Acquired Dow Plants Among the Lowest-Cost in North America

EXCELLENT FLEXIBILITY TO MAXIMIZE VALUE THROUGHOUT ENTIRE EPOXY CHAIN INNOVATION CAPTURE DOWNSTREAM GROWTH APPLICATIONS LOWEST COST PRODUCER OF KEY EPOXY MATERIALS GLOBAL ASSET FOOTPRINT ALIGNED WITH TARGETED APPLICATIONS Olin is the Largest and Most Integrated Epoxy Business in the World PROVEN LEADERSHIP 13

Epoxy has Access to Attractive High Growth End Uses Around the Globe Select Epoxy End Use Growth Rates (2013-2018)2 Composites Civil Engineering, Adhesives Industrial Coatings Electrical Laminates 2016 3,200 2015 3,000 2014 2,900 2013 2,750 2012 2,550 2011 2,600 Epoxy Resin Consumption1 3% CAGR (2013-2016) 4% 5% 7% Source: IHS Chemical Epoxy Resins CEH report 1: Liquid resins and SERs 2: Only includes US, Western Europe, Japan and China (KT) 14 APAC Europe US ROW 4% 8% 5% 4%

Epoxy Priorities for Success 15 0 50 100 150 200 250 300 350 Epoxy Segment EBITDA ($M) Upstream Midstream Downstream Continue driving productivity and cost improvements Utilize advantaged cost position to outgrow the market (“Sell out”) Upgrade mix to improve margin (“Sell up”) Continued Improvement N/A 1 2 3

LEVERAGE THE WINCHESTER BRAND INTRODUCE MARKET-DRIVEN NEW PRODUCTS LEADING PRODUCT POSITIONS ACHIEVE LOW-COST STATUS Winchester is a Leading Supplier of Ammunition and Related Products 16
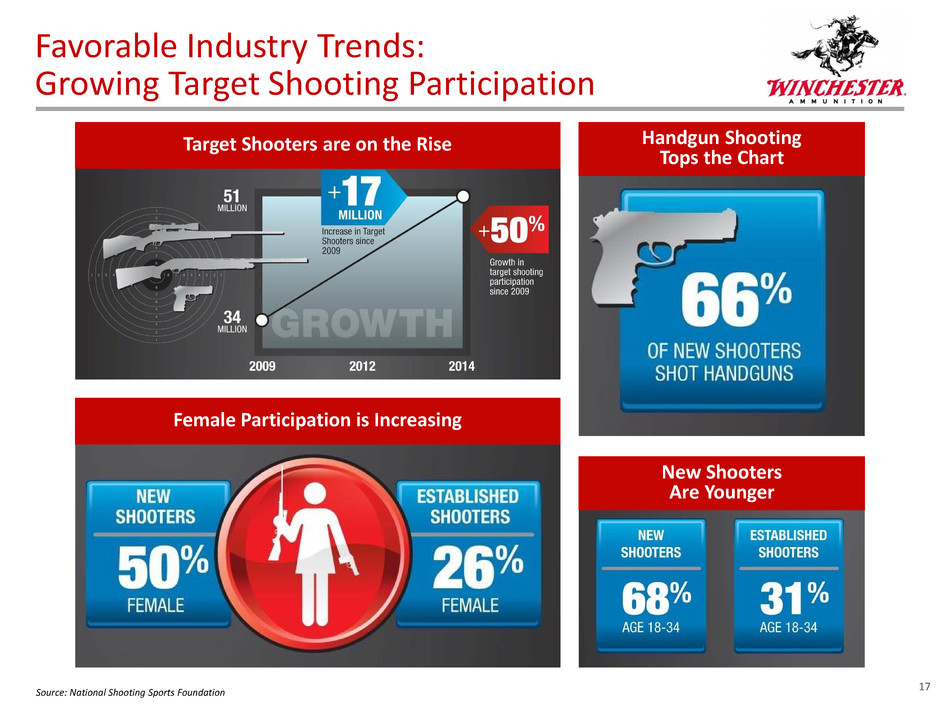
Favorable Industry Trends: Growing Target Shooting Participation Female Participation is Increasing Target Shooters are on the Rise Handgun Shooting Tops the Chart New Shooters Are Younger 17 Source: National Shooting Sports Foundation

Achieving Lower Cost Status to Drive Improved Profitability Current Oxford Centerfire Relocation Capper Assembly Area • Cost Reduction - Centerfire Relocation: – Realized $35 million of cost savings in 2015 – Expect an additional $5 million of lower annual operating costs beginning in 2016 • New Product Development: – Continue to develop new product offerings – Maintain reputation as a new product innovator – 10% of sales attributable to products developed in the past 5 years • Provide Returns in Excess of Cost of Capital 18

25 36 42 78 73 49 69 158 144 134 0 20 40 60 80 100 120 140 160 180 2006 2007 2008 2009 2010 2011 2012 2013 2014 2015 Winchester’s Strategy is Working 19 6.7% 8.3% 8.6% 13.7% 13.3% 8.6% 11.2% 20.3% 19.5% 18.9% 2006-2010 Average EBITDA margin: 10.1% 2013-2015 Average EBITDA margin: 19.6% ($M)

LONG-TERM FOCUS ON OPERATING WITH INVESTMENT GRADE METRICS FOCUS ON REDUCING NET DEBT/EBITDA TO 2.5 – 3.0X OVER THE NEXT 2 YEARS PRUDENT CAPITAL STRUCTURE AND COMMITMENT TO CONSERVATIVE FINANCIAL POLICY UNBROKEN 89 YEAR RECORD OF QUARTERLY DIVIDENDS Olin’s Financial Policies and Objectives 20 MAJOR DEBT MATURITIES STAGGERED WITH MANAGEABLE TOWERS OF DEBT TM
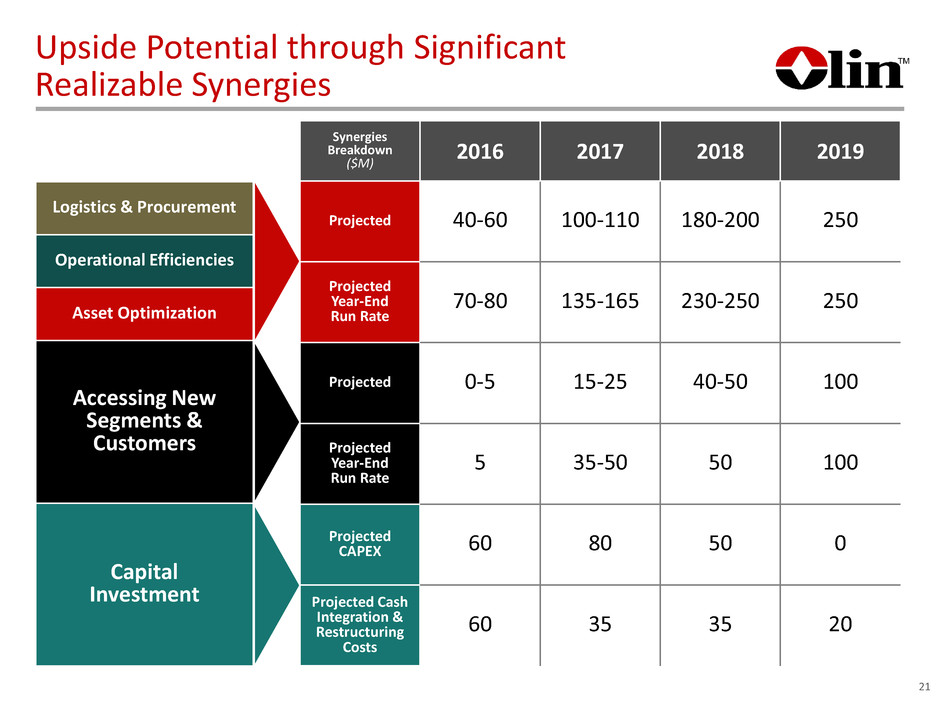
Upside Potential through Significant Realizable Synergies $250 Logistics & Procurement Operational Efficiencies Asset Optimization Accessing New Segments & Customers Capital Investment Synergies Breakdown ($M) 2016 2017 2018 2019 Projected 40-60 100-110 180-200 250 Projected Year-End Run Rate 70-80 135-165 230-250 250 Projected 0-5 15-25 40-50 100 Projected Year-End Run Rate 5 35-50 50 100 Projected CAPEX 60 80 50 0 Projected Cash Integration & Restructuring Costs 60 35 35 20 21

2Q $220 – $240 • Reduced Maintenance turnaround costs • Improved epoxy volumes • Increased synergy realization $215 $220 - $240 $435 - $455 $480 - $530 2016 Adjusted EBITDA Outlook 1Q16 2Q16 1H16 2H16 FY16 $915 - $985 2H $480 – $530 1Q $215 • Improving volumes from Q1 • Chlor alkali products pricing flat with Q1 Improved chlor alkali products pricing represents an upside to our Adjusted EBITDA forecast ($ in millions) 22
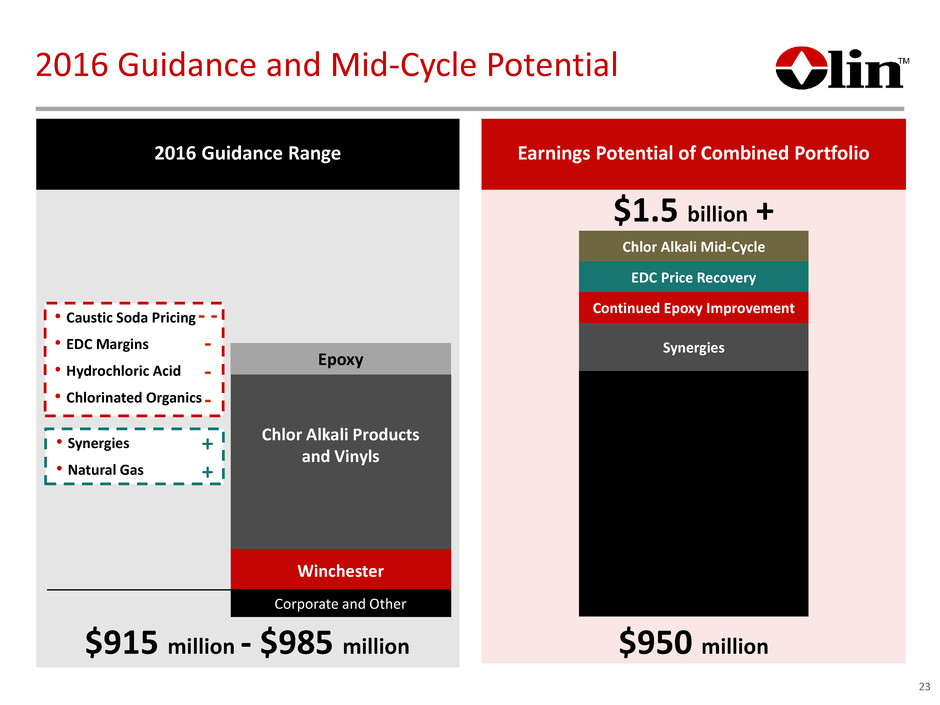
2016 Guidance Range Earnings Potential of Combined Portfolio 23 2016 Guidance and Mid-Cycle Potential $915 million - $985 million $1.5 billion + $950 million Chlor Alkali Mid-Cycle EDC Price Recovery Continued Epoxy Improvement Synergies Corporate and Other Epoxy Winchester Chlor Alkali Products and Vinyls • Synergies • Natural Gas • Caustic Soda Pricing • EDC Margins • Hydrochloric Acid • Chlorinated Organics - - - - - + +

APPENDIX

The Chlorine Envelope 25 Epoxy Brine (NaCl) Power Phenol Acetone Caustic Soda (NaOH) Chlorine (CI2) Bisphenol-A GCO (Perc/Tric/CMP/VDC) Epichlorohydrin Allyl Chloride EDC / VCM Chlor-Alkali Cumene Bleach HCl Merchant
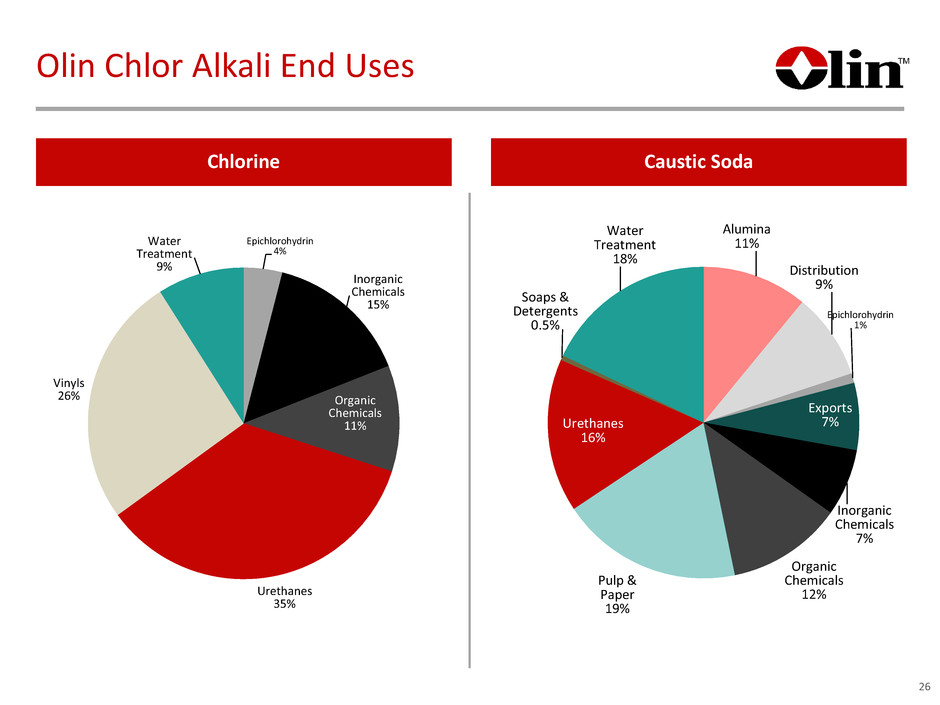
Olin Chlor Alkali End Uses Caustic Soda Chlorine Epichlorohydrin 4% Inorganic Chemicals 15% Organic Chemicals 11% Urethanes 35% Vinyls 26% Water Treatment 9% Alumina 11% Distribution 9% Epichlorohydrin 1% Exports 7% Inorganic Chemicals 7% Organic Chemicals 12% Pulp & Paper 19% Urethanes 16% Soaps & Detergents 0.5% Water Treatment 18% 26

Non-GAAP Financial Measures(a) Olin's definition of Adjusted EBITDA (Earnings before interest, taxes, depreciation, and amortization) is net (loss) income plus an add-back for depreciation and amortization, interest expense (income), income tax expense (benefit), other expense (income), restructuring charges, acquisition-related costs, fair value inventory purchase accounting adjustment and other certain non-recurring items. Adjusted EBITDA is a non-GAAP financial measure. Management believes that this measure is meaningful to investors as a supplemental financial measure to assess the financial performance of our assets without regard to financing methods, capital structures, taxes, or historical cost basis. The use of non-GAAP financial measures is not intended to replace any measures of performance determined in accordance with GAAP and Adjusted EBITDA presented may not be comparable to similarly titled measures of other companies. March 31, December 31, (In millions) 2016 2015 Reconciliation of Net Loss to Adjusted EBITDA: Net Loss (37.9)$ (62.7)$ Add Back: Interest Expense (b) 48.5 57.3 Interest Income (0.3) (0.2) Income Tax Benefit (17.5) (23.2) Depreciation and Amortization 129.7 124.0 EBITDA 122.5 95.2 A d Ba k: Restr c uring Charges (c) 92.8 0.5 Acquisition-related Costs (d) 10.2 88.0 Fair Value Inventory Purchase Accounting Adjustment (e) - 24.0 Certain non-recurring items (f) (11.0) (3.7) Other Income - (0.2) Adjusted EBITDA 214.5$ 203.8$ Three Months Ended (a) Unaudited. (b) Interest expense for the three months ended December 31, 2015 included acquisition financing expenses of $10.8 million primarily for the bridge financing associated with our acquisition of the Acquired Business. (c) Restructuring charges for the three months ended March 31, 2016 were primarily associated with the closure of 433,000 tons of chlor alkali capacity across three separate locations, of which $76.6 million was non-cash impairment charges for equipment and facilities. (d) Acquisition-related costs for the three months ended March 31, 2016 and December 31, 2015 were associated with our acquisition and integration of the Acquired Business. (e) Fair value inventory purchase accounting adjustment for the three months ended December 31, 2015 was associated with non-recurring expenses included within costs of goods sold of $24.0 million due to the increase of inventory to fair value at the acquisition date related to the purchase accounting of the Acquired Business. (f) Certain non-recurring items for the three months ended March 31, 2016 included an $11.0 million insurance recovery for property damage and business interruption related to a 2008 chlor alkali facility incident. Certain non-recurring items for the three months ended December 31, 2015 included $3.7 million of insurance recoveries for property damage and business interruption related to the McIntosh, AL chlor alkali facility. 27

Non-GAAP Financial Measures by Segment (In millions) Income (loss) before Taxes Depreciation and Amortization Other Adjusted EBITDA Chlor Alkali Products and Vinyls 68.1$ 101.9$ -$ 170.0$ Epoxy 8.2 21.7 - 29.9 Winchester 28.7 4.6 - 33.3 (In millions) Income (loss) before Taxes Depreciation and Amortization Other (1) Adjusted EBITDA Chlor Alkali Products and Vinyls 46.6$ 97.3$ 6.7$ 150.6$ Epoxy (7.5) 20.9 17.3 30.7 Winchester 21.8 4.9 - 26.7 Three Months Ended March 31, 2016 Three Months Ended December 31, 2015 (1) Other for the three months ended December 31, 2015 included the fair value inventory purchase accounting adjustment associated with non-recurring expenses included within costs of goods sold of $24.0 million due to the increase of inventory to fair value at the acquisition date related to the purchase accounting of the Acquired Business. 28

1Q16 4Q15 ∆ Q/Q Sales $704.3 $681.1 3.4% Adjusted EBITDA $170.0 $150.6 12.9% Sales growth driven by higher volumes Adjusted EBITDA improvement driven by higher volumes and lower electricity costs Closed a combined total of 433,000 tons of chlor alkali capacity across Henderson, NV, Niagara Falls, NY and Freeport, TX locations during the quarter 2Q16 outlook – sequential improvement from 1Q16 Improved volumes with flat chlor alkali products pricing Slight improvement in vinyls pricing with improved volumes ($ in millions) Chlor Alkali Products and Vinyls Segment Performance 29

Chlor Alkali Products and Vinyls Pricing and Volume Comparisons 1Q16 versus 1Q15 4Q15 Chlorine Caustic Soda N/A EDC N/A Bleach HCI 1Q16 versus 1Q15 4Q15 Chlorine Caustic Soda EDC N/A Bleach HCI Volume Comparison Pricing Comparison 30

31 Product Price Change EBITDA Impact Chlorine $10/ton $10 million Caustic $10/ton $30 million EDC $.01/pound $20 million Annual EBITDA Sensitivity

1Q16 4Q15 ∆ Q/Q Sales $460.2 $429.6 7.1% Adjusted EBITDA $29.9 $30.7 (2.6)% Sales growth driven by higher volumes partially offset by lower prices Adjusted EBITDA slightly lower as improved volumes were offset by lower pricing Epoxy business to continue to improve during 2016 driven by volume growth and strength in 2H16 versus 1H16 2Q16 outlook – sequentially lower than 1Q16 Timing of higher maintenance-related outage costs Continued improvement in volumes ($ in millions) Epoxy Segment Performance 32

Sales growth driven by increased shipments to commercial customers in the seasonally stronger first quarter Adjusted EBITDA improvement reflects higher commercial volumes and lower commodity and other material costs Operating efficiency initiatives to continue to materialize throughout 2016 Favorable trends in NICS background checks 2Q16 outlook – modest sequential improvement from 1Q16 Winchester Segment Performance 1Q16 4Q15 ∆ Q/Q Sales $183.7 $156.7 17.2% Adjusted EBITDA $33.3 $26.7 24.7% ($ in millions) 33
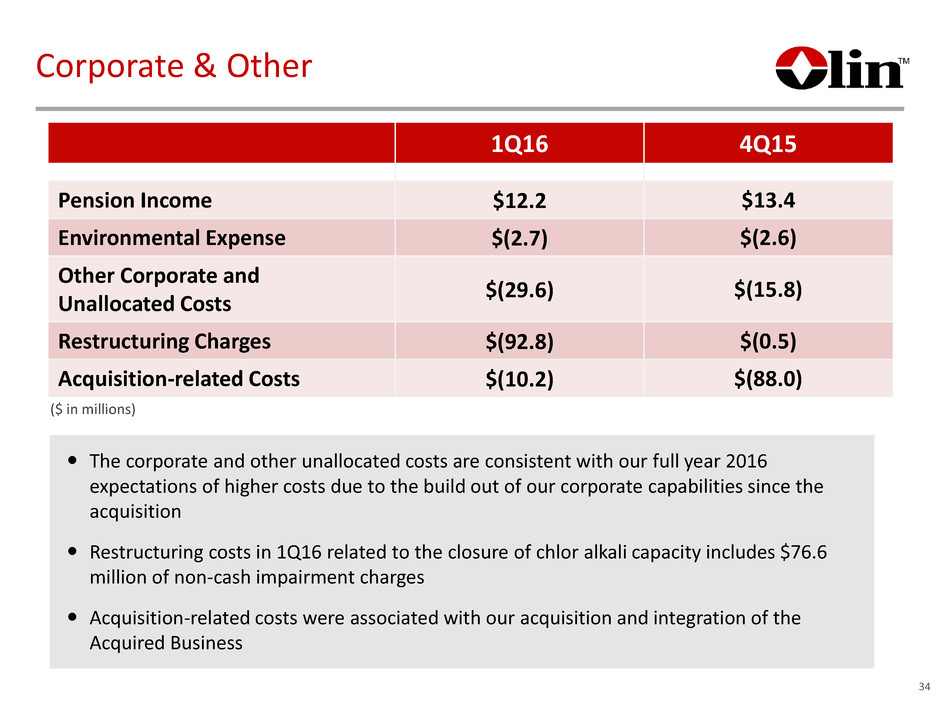
1Q16 4Q15 Pension Income $12.2 $13.4 Environmental Expense $(2.7) $(2.6) Other Corporate and Unallocated Costs $(29.6) $(15.8) Restructuring Charges $(92.8) $(0.5) Acquisition-related Costs $(10.2) $(88.0) The corporate and other unallocated costs are consistent with our full year 2016 expectations of higher costs due to the build out of our corporate capabilities since the acquisition Restructuring costs in 1Q16 related to the closure of chlor alkali capacity includes $76.6 million of non-cash impairment charges Acquisition-related costs were associated with our acquisition and integration of the Acquired Business ($ in millions) Corporate & Other 34

Full Year 2016 Forecast Key Elements Capital Spending $240 to $280 Maintenance level of capital spending of $225M to $275M annually Synergy Capital $60 Synergy projects include chlorine loading, bleach capacity and caustic soda evaporation Total $300 to $340 Depreciation & Amortization $345 to $355 Fair Value Step up of D&A $145 Property, plant and equipment fair value step up of approximately $1.5B – final valuation not yet complete Total $490 to $500 Book Effective Tax Rate 35% to 38% Reverse Morris Trust Acquisition; step up D&A not deductible for income tax Cash Tax Rate 2016 +/-0% Normalized 25% to 30% 2016 cash tax rate utilizes the benefits of NOL carry forwards from 2015 Guidance Assumptions ($ in millions) 35

Debt and Interest Expense 36 • Year end net debt of approximately $3.5 billion • $205 million debt maturing in 2016 expect to repay with available cash • $2.2 billion of pre-payable term loans • Targeting reduction of net debt/EBITDA to 2.5x - 3.0x in the next two years • Approximately 60% variable rate debt • 5% blended interest rate for the second quarter 2016 Debt Maturity Schedule ($M) - 200,000 400,000 600,000 800,000 1,000,000 1,200,000 2016 2017 2018 2019 2020 2021 2022 2023 2024 2025 2033 2035 Sunbelt Second Term loan Term Loan Bonds
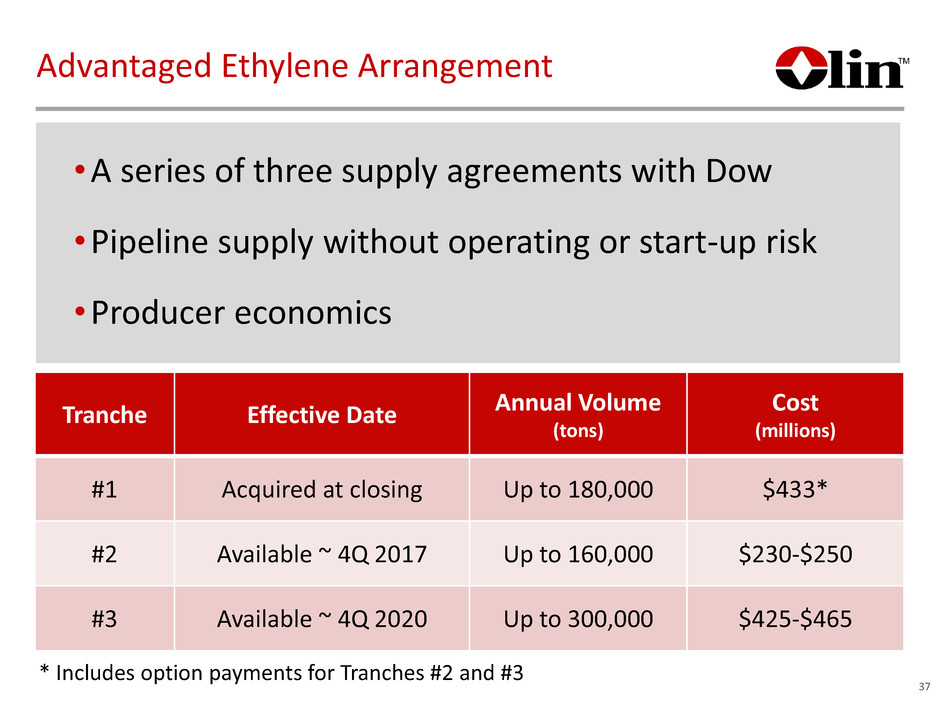
Advantaged Ethylene Arrangement •A series of three supply agreements with Dow •Pipeline supply without operating or start-up risk •Producer economics Tranche Effective Date Annual Volume (tons) Cost (millions) #1 Acquired at closing Up to 180,000 $433* #2 Available ~ 4Q 2017 Up to 160,000 $230-$250 #3 Available ~ 4Q 2020 Up to 300,000 $425-$465 37 * Includes option payments for Tranches #2 and #3

38 Low Cost Energy and Brine Sources Facility Capacity Energy Sources Brine Source Freeport, TX 3,030 Natural Gas Owned Plaquemine, LA 1,070 Natural Gas Owned McIntosh, AL 778 Coal & Nuclear Owned Niagara Falls, NY 240 Hydro Brine by Pipeline St. Gabriel, LA 246 Natural Gas Brine by Pipeline Charleston, TN 218 Coal, Hydro & Nuclear Purchase Salt Becancour, QC 175 Hydro Purchase Salt Henderson, NV 0 Natural Gas & Hydro Purchase Salt Total 5,757 85% Natural Gas & Hydro 82% Owned Closed C/A Capacity Q1 2016

Adjusted EBITDA1 One-time Items Interest Dividend Free Cash Flow After Dividend Cash Taxes2 Capital Spending3 Free Cash Flow $950 ($0) ($6) ($320) ($49) ($180) $401 ($132) $269 (M) 1: Mid-point of Olin’s estimated Adjusted EBITDA range of $915 to $985 million for full year 2016 2: Estimated using the mid-point of the cash tax rate of 25% to 30% and the benefits from the 2015 NOL carryforward and 2015 tax refunds 3: Represents the mid-point of management’s annual capital spending estimate range of $300 to $340 million, which includes $60 million of synergy capital 4: One-time items include integration expenses and cash restructuring charges partially offset by insurance recovery 5: Calculated based on Olin’s capital structure, mandatory debt repayments and assuming current interest rates 6: Calculated based on 165 million shares outstanding and an annual dividend rate of $0.80 per share 2016 Cash Flow Waterfall 39 4 6 5

End slide TM
