Attached files
| file | filename |
|---|---|
| 8-K - 8-K - Starwood Waypoint Homes | sfr-8k_20160509.htm |
Exhibit 99.1
|
Section I: Section II: Section III: Section IV: Section V: Section VI: Section VII: Appendix: |
|
Earnings Release Q1 Highlights Consolidated Financials Selected Additional Information Same Store Information NPL Portfolio Earnings Guidance Definitions and Reconciliations |
|
2 8 10 16 21 29 32 34 |
|
|
|
|
||||
|
|
|
||||
|
|
|
||||
|
|
|
||||
|
|
|
||||
|
|
|
||||
|
|
|
|
|
|
1 |

I. Earnings Release
|
|
|
2 |
COLONY STARWOOD HOMES ANNOUNCES
FIRST QUARTER 2016 FINANCIAL AND OPERATING RESULTS
Scottsdale, Arizona (May 9, 2016) – Colony Starwood Homes (NYSE: SFR) (the “Company”), a leading single-family rental real estate investment trust (“REIT”), today announced operating and financial results for the three months ended March 31, 2016.
First Quarter 2016 Highlights
|
|
• |
Same Store portfolio of 22,806 homes produced revenue growth of 6.1%, expense reduction of (0.6%) and Core NOI growth of 10.5% |
|
|
• |
Same Store portfolio achieved a Core NOI margin of 65.5% |
|
|
• |
Total Homes Occupancy reached 95.0% as of March 31, 2016 |
|
|
• |
Completed Merger integration and achieved approximately 85% of the estimated $50 million in annualized run-rate synergies as of March 31, 2016, and approximately 95% as of today |
|
|
• |
Core FFO of $0.40 per common share produced by the single-family rental home portfolio |
|
|
• |
Company estimates Net Asset Value of $32.63 per share as of March 31, 2016 |
|
|
• |
Company accelerates timeline of non-performing loan (“NPL”) portfolio sale and anticipates exit from the NPL business in 2016 |
|
|
• |
Company re-affirms full year 2016 guidance |
“We are pleased with our first quarter 2016 operating results, our first as the newly combined Colony Starwood Homes,” said Fred Tuomi, Chief Executive Officer. “Our people and platform performed extremely well throughout the integration process, which is now complete and delivering on the strategic and financial advantages we anticipated with the merger. Total portfolio occupancy reached 95%, an important milestone as our business matures and a reflection of continued strong demand for high quality rental homes in high growth markets. Our sizable same store portfolio of over 22,000 homes produced robust revenue growth, which combined with expense decreases led to NOI growth of 10.5% and a core operating margin of 65.5%. This strong performance positions us well to achieve our stated Core FFO guidance for the year. In addition, the intrinsic value of our homes is further validated by our internal NAV estimate of $32.63 per share.”
The first quarter 2016 financial results of the Company (other than Same Store results) include the historical financial results of Starwood Waypoint Residential Trust (“SWAY”) beginning on January 5, 2016, which was the date of the merger between Colony American Homes (“CAH”) and SWAY (the “Merger”). Historical financial results (other than Same Store results) as of dates or for periods prior to January 5, 2016 represent only the pre-Merger financial results of CAH and do not reflect what the financial results would have been had the Merger been complete during such periods.
First Quarter 2016 Operating Results
Core FFO was $43.7 million for the three months ended March 31, 2016, or $0.40 per share. The Company’s Core FFO measure excludes any gains or losses from its non-performing loan business, which the Company intends to exit.
Total revenues were $139.4 million for the three months ended March 31, 2016, and net loss attributable to common shareholders was approximately $44.2 million, or $0.43 per share, driven by depreciation and amortization and transaction costs associated with the Merger.
|
|
|
3 |
Earnings Release Continued
For the Company’s Same Store portfolio of 22,806 homes, revenues for the three months ended March 31, 2016 were $100.0 million, a 6.1% increase as compared to the three months ended March 31, 2015. Same Store rental revenue for the three months ended March 31, 2016 was $95.5 million, a 5.9% increase from $90.2 million for the three months ended March 31, 2015. Same Store property operating expenses decreased by 0.6% over the same comparative period, producing a 10.5% increase in Same Store Core NOI for the three months ended March 31, 2016 as compared to the three months ended March 31, 2015. Same Store Core NOI margin for the three months ended March 31, 2016 was 65.5%. The Same Store portfolio is defined as homes stabilized longer than 90 days prior to the beginning of the earliest period presented under the comparison, excluding homes subsequently sold.
|
Same Store Property Results |
|
|||
|
Homes as of March 31, 2016 |
|
|
22,806 |
|
|
Occupancy as of March 31, 2016 |
|
|
95.8 |
% |
|
Quarter-over-Quarter Revenue Growth (three months ended March 31, 2016 as compared to three months ended March 31, 2015) |
|
|
6.1 |
% |
|
Quarter-over-Quarter Operating Expense Growth (three months ended March 31, 2016 as compared to three months ended March 31, 2015) |
|
|
-0.6 |
% |
|
Quarter-over-Quarter NOI Growth (three months ended March 31, 2016 as compared to three months ended March 31, 2015) |
|
|
10.5 |
% |
|
Core NOI Margin for the three months ended March 31, 2016 |
|
|
65.5 |
% |
Investment Activity
The Company sold 351 homes during the first quarter, including 124 single-family rental homes and 227 real estate owned (“REO”) homes. The single-family rental homes were sold for gross sales proceeds of $24.0 million, and the Company recorded a gain of approximately $1.4 million on these sales. The REO homes were sold for gross sales proceeds of $29.9 million, and the Company recorded no gain, as the gain associated with these sales was muted due to the Merger related purchase accounting. During the three months ended March 31, 2016, the Company acquired 12 homes for an aggregate estimated total investment of $1.8 million, or approximately $151,000 per home, including estimated investment costs for renovation.
NPL Business
On May 4th, 2016, the Company’s Board of Trustees (the “Board”) authorized the sale of the NPL portfolio. The Company intends to commence marketing activities and assess disposition options immediately, and anticipates the business will be treated as a discontinued operation in subsequent periods.
As of March 31, 2016, the Company owned 2,308 first lien NPLs compared to 2,539 first lien NPLs owned as of December 31, 2015, and held 738 REO homes as of first quarter end. The aggregate purchase price of $344.6 million for these 2,308 NPLs represents 61.6% of their collateral property broker price opinion (“BPO”) value. The reduction in first lien NPLs is primarily due to resolution activity during the three months ended March 31, 2016. From inception to date, the Company has resolved 71% of all NPLs acquired.
As a result of Merger related purchase accounting, all of the Company’s NPL and REO assets were recorded at fair value as of the Merger transaction date based upon the Company’s decision to exit that business, which muted GAAP accounting gains from resolution and sale of these assets during the quarter. NPL resolutions and REO sales produced $36.3 million of gross cash proceeds during the quarter producing net proceeds of $29.4 million after associated debt pay down of $6.9 million. As of March 31, 2016 there was $267.5 million of outstanding debt associated with the NPL business, which the Company intends to pay down in connection with the wind down of the NPL business.
|
|
|
4 |
Earnings Release Continued
Balance Sheet and Capital Markets Activities
As of March 31, 2016, the Company had $4.1 billion of debt outstanding. As of March 31, 2016, the Company had a total of approximately $541.2 million of undrawn balance on its credit facilities.
In February 2016, the Company entered into interest rate swap contracts effectively fixing the interest rate on approximately $1.6 billion of its variable-rate debt for three years. These swap contracts are structured as step-up swaps, which lock in the forward LIBOR curve with fixed rates of 2.52%, 2.74%, and 2.99%, in years one, two and three, respectively, averaging 2.75% over the three year term.
The Board previously approved and subsequently revised a share repurchase program, under which the Company is authorized to repurchase up to $250 million of its outstanding common shares through May 6, 2017. Under this revised program, the Company purchased approximately 2.0 million common shares during the three months ended March 31, 2016 for an aggregate purchase price of $44.6 million at an average of $21.74 per share, and has purchased a total of 2.4 million shares under the program to date for an aggregate purchase price of $52.8 million at an average of $22.19 per share.
On May 4, 2016, the Board declared a dividend of $0.22 per common share for the second quarter of 2016, which will be paid on July 15, 2016 to shareholders of record on June 30, 2016.
Full Year 2016 Financial Guidance
Earlier this year the Company provided Core FFO per share guidance related to the single-family rental business only, as the Company is winding down the NPL business. The Company re-affirms that it expects single-family rental Core FFO per share for the full year ending December 31, 2016 for the combined Company to be in the range of $1.55 to $1.65, and re-affirms the occupancy, rent growth and NOI margin assumptions previously provided.
The following presents a summary of the combined Company’s expected financial outlook for the year ending December 31, 2016:
|
Full Year 2016 Guidance |
||
|
|
|
Range |
|
Core FFO per share |
|
$1.55 - $1.65 |
|
Stabilized Occupancy |
|
94% - 95% |
|
Blended Rent Growth |
|
4% - 5% |
|
Core NOI margin (Stabilized) |
|
62% - 64% |
This outlook is based on a number of assumptions, many of which are outside the Company’s control and all of which are subject to change. This outlook reflects the Company’s expectations on (1) existing investments and (2) yield on incremental investments inclusive of the Company’s existing pipeline. All guidance is based on current expectations of future economic conditions and the judgment of the Company’s management team.
First Quarter 2016 Conference Call
A conference call is scheduled on Monday, May 9, 2016, at 10:00 a.m. Eastern Time to discuss the Company’s financial results for the three months and year ended March 31, 2016. The domestic dial-in number is 1-877-407-4018 (for U.S. and Canada) and the international dial-in number is 1-201-689-8471 (passcode not required). An audio webcast may be accessed at www.colonystarwood.com, in the investor relations section. A replay of the call will be available through June 9, 2016, and can be accessed by calling 1-877-870-5176 (U.S. and Canada) or 1-858-384-5517 (international), replay pin number 13634768, or by using the link at www.colonystarwood.com, in the investor relations section.
About Colony Starwood Homes
Colony Starwood Homes (NYSE: SFR) is one of the largest publicly traded owners and operators of single-family rental homes in the United States. Colony Starwood Homes acquires, renovates, leases, maintains and manages single- family homes in markets that exhibit favorable demographics and long-term economic trends, as well as strengthening demand for rental properties. Colony Starwood Homes is building its business upon a foundation of respect for its residents and the communities in which it operates. Additional information can be found at www.colonystarwood.com.
|
|
|
5 |
Earnings Release Continued
A copy of the First Quarter 2016 Supplemental Information Package (“Q1 2016 Supplement”) and this press release are available on the Company’s website at www.colonystarwood.com.
Notice Regarding Non-GAAP Financial Measures
This press release and the Q1 2016 Supplement contain and may refer to certain Non-GAAP financial measures and terms that management believes are helpful in understanding our business, as further set forth in the definitions, explanations and reconciliations of the non-GAAP financial measure to their most comparable GAAP financial measures included in Appendix. These measures and terms are in addition to, not a substitute for or superior to measures of financial performance prepared in accordance with GAAP, and should be read together with the most comparable GAAP measures.
|
|
|
6 |
Earnings Release Continued
The statements herein that are not historical facts, and the assumptions upon which those statements are based, are forward-looking statements within the meaning of the Private Securities Litigation Reform Act of 1995, Section 27A of the Securities Act of 1933, as amended, and Section 21E of the Securities Exchange Act of 1934, as amended. These forward-looking statements involve significant risks and uncertainties, which are difficult to predict, and are not guarantees of future performance. Such statements can generally be identified by words such as “guidance,” “outlook,” “projects,” “forecast,” “anticipates,” “expects,” “intends,” “will,” “could,” “believes,” “estimates,” “continue,” and similar expressions. Forward-looking statements are based on certain assumptions and discuss future expectations, describe future plans and strategies, and contain financial and operating projections or state other forward-looking information. The Company’s ability to predict results or the actual effect of future events, actions, plans or strategies is inherently uncertain. Although the Company believes that the expectations reflected in such forward-looking statements are based on reasonable assumptions, the Company’s actual results and performance could differ materially from those set forth in, or implied by, the forward-looking statements. Factors that could materially and adversely affect the Company’s business, financial condition, liquidity, results of operations and prospects, as well as the Company’s ability to make distributions to its shareholders, include, but are not limited to: failure to plan and manage the Internalization or the Merger effectively and efficiently; the possibility that the anticipated benefits from the Internalization or the Merger may not be realized or may take longer to realize than expected; unexpected costs or unexpected liabilities that may arise from the Internalization or the Merger; the outcome of any legal proceedings that have been or may be instituted against the Company, CAH or others following the announcement or the completion of the Internalization or the Merger; expectations regarding the timing of generating additional revenues; changes in the Company’s business and growth strategies; volatility in the real estate industry, interest rates and spreads, the debt or equity markets, the economy generally or the rental home market specifically, whether the result of market events or otherwise; events or circumstances that undermine confidence in the financial markets or otherwise have a broad impact on financial markets, such as the sudden instability or collapse of large financial institutions or other significant corporations, terrorist attacks, natural or man-made disasters, or threatened or actual armed conflicts; declines in the value of homes, and macroeconomic shifts in demand for, and competition in the supply of, rental homes; the availability of attractive investment opportunities in homes that satisfy the Company’s investment objective and business and growth strategies; the impact of changes to the supply of, value of and the returns on NPLs; the Company’s ability to convert the homes and NPLs it acquires into rental homes generating attractive returns; the Company’s ability to successfully modify or otherwise resolve NPLs; the Company’s ability to wind-down its NPL business in the anticipated time period and to re-deploy net cash proceeds therefrom; the Company’s ability to lease or re-lease its rental homes to qualified residents on attractive terms or at all; the failure of residents to pay rent when due or otherwise perform their lease obligations; the Company’s ability to effectively manage its portfolio of rental homes; the concentration of credit risks to which the Company is exposed; the rates of default or decreased recovery rates on the Company’s target assets; the availability, terms and deployment of short-term and long-term capital; the adequacy of the Company’s cash reserves and working capital; potential conflicts of interest with Starwood Capital Group Global, L.P., Colony Capital, Inc. and their affiliates; the timing of cash flows, if any, from the Company’s investments; unanticipated increases in financing and other costs, including a rise in interest rates; the Company’s expected leverage; effects of derivative and hedging transactions; the Company’s ability to maintain its exemption from registration as an investment company under the Investment Company Act of 1940, as amended; actions and initiatives of the U.S. government and changes to U.S. government policies that impact the economy generally and, more specifically, the housing and rental markets; changes in governmental regulations, tax laws and rates, and similar matters; limitations imposed on the Company’s business and its ability to satisfy complex rules in order for the Company and, if applicable, certain of the Company’s subsidiaries to qualify as a REIT for U.S. federal income tax purposes and the ability of certain of the Company’s subsidiaries to qualify as taxable REIT subsidiaries for U.S. federal income tax purposes, and the Company’s ability and the ability of its subsidiaries to operate effectively within the limitations imposed by these rules; and estimates relating to the Company’s ability to make distributions to its shareholders in the future. You should not place undue reliance on any forward-looking statement and should consider all of the uncertainties and risks described above, as well as those more fully discussed in reports and other documents filed by the Company with the Securities and Exchange Commission from time to time. Furthermore, except as required by law, the Company is under no duty to, and the Company does not intend to, update any of its forward-looking statements appearing herein, whether as a result of new information, future events or otherwise.
|
Contacts: |
|
|
|
|
|
Investor Relations |
Media Relations |
|
John Christie Phone: 510-982-5470 |
Jason Chudoba Phone: 646-277-1249 |
|
Email: IR@colonystarwood.com |
Email: Jason.chudoba@icrinc.com |
|
|
|
7 |
II. Q1 Highlights
|
|
|
8 |
|
Q1 Highlights
|
|
· |
Achieved full integration of CAH and SWAY organizations at corporate and field levels with~85% of targeted $50MM synergies achieved by March 2016. |
|
|
· |
Announced Estimated Net Asset Value (“NAV”) of $32.63 per share. |
|
|
|
· |
Company re-affirms full-year 2016 Core FFO guidance of $1.55-$1.65/share. |
|
|
|
|
|
|
|
Operations |
|
· |
Same Store Occupancy of 95.8% and Total Home Occupancy of 95.0%. |
|
|
· |
Same Store Total Revenue Growth of 6.1%; 5.9% Same Store Rental Income Growth. |
|
|
|
· |
Same Store Resident Retention rate of 76.2%. |
|
|
|
· |
Same Store YTD Annualized Turnover Rate of 27.2%. |
|
|
|
|
|
|
|
Financial Results |
|
· |
Core FFO was $43.7MM, or $0.40 per share, excluding NPL and merger and integration costs. |
|
|
· |
Same Store NOI Margin was 62.8%, an increase of 250 basis points year-over-year. |
|
|
|
· |
Same Store Core NOI Margin was 65.5%, an increase of 300 basis points year-over-year. |
|
|
|
|
|
|
|
Liquidity & Capital Markets |
|
· |
Entered swap transaction to fix $1.6Bn of variable-rate securitization debt at an average rate of 2.75% during three-year term. |
|
|
· |
Repurchased ~2MM shares year to-date for ~$44.6MM. |
|
|
|
· |
Increased quarterly dividend to $0.22 per share. |
|
|
|
|
|
|
|
NPL |
|
· |
Company accelerates timeline of NPL portfolio sale and anticipates exit from the NPL business in 2016. |
|
|
· |
Company now owns 2,308 first lien NPL’s and 738 REO homes. |
|
|
|
· · |
As of March 31, 2016, 71% of all NPL’s acquired since inception have been resolved. Resolutions and REO sales produced $36.3M gross proceeds, net proceeds of $29.4M after associated debt pay down.
|
Please see the Appendix at the back of this presentation for certain definitions, explanations and reconciliations of Non-GAAP financial measures. All information is as of March 31, 2016 unless otherwise indicated.
|
|
|
9 |
III. Consolidated Financials
|
|
|
10 |
As of March 31, 2016
Dollars in thousands
|
Assets |
|
|
|
|
|
Liabilities |
|
|
|
|
|
Investments in real estate properties: |
|
|
|
|
|
Secured credit facilities |
|
$ |
1,258,920 |
|
|
Land and land improvements |
|
$ |
1,522,564 |
|
|
Mortgage loans, net |
|
|
2,218,953 |
|
|
Buildings and building improvements |
|
|
4,322,350 |
|
|
Non-performing loans warehouse facility |
|
|
267,547 |
|
|
Furniture, fixtures and equipment |
|
|
109,424 |
|
|
Convertible senior notes, net |
|
|
341,712 |
|
|
Total investments in properties |
|
|
5,954,338 |
|
|
Accounts payable and accrued expenses |
|
|
96,963 |
|
|
(Less) accumulated depreciation |
|
|
(248,823 |
) |
|
Resident prepaid rent and security deposits |
|
|
55,332 |
|
|
Investments in real estate properties, net |
|
|
5,705,515 |
|
|
Other liabilities |
|
|
1,987 |
|
|
Real estate held for sale, net |
|
|
114,399 |
|
|
Total liabilities |
|
|
4,241,414 |
|
|
Total investments in real estate, net |
|
|
5,819,914 |
|
|
Equity |
|
|
|
|
|
|
|
|
|
|
|
Common shares, at par |
|
|
1,015 |
|
|
|
|
|
|
|
|
Additional paid-in capital |
|
|
2,730,163 |
|
|
Cash and cash equivalents |
|
|
199,099 |
|
|
Accumulated deficit |
|
|
(211,227 |
) |
|
Restricted cash |
|
|
158,519 |
|
|
Accumulated other comprehensive loss |
|
|
(4,068 |
) |
|
Asset-backed securitization certificates |
|
|
60,242 |
|
|
Total shareholders' equity |
|
|
2,515,883 |
|
|
Non-performing loans |
|
|
364,930 |
|
|
Non-controlling interests |
|
|
211,048 |
|
|
Goodwill |
|
|
264,037 |
|
|
Total equity |
|
|
2,726,931 |
|
|
Other assets, net |
|
|
101,604 |
|
|
|
|
|
|
|
|
Total assets |
|
$ |
6,968,345 |
|
|
Total liabilities and equity |
|
$ |
6,968,345 |
|
Please see the Appendix at the back of this presentation for certain definitions, explanations and reconciliations of Non-GAAP financial measures. All information is as of March 31, 2016 unless otherwise indicated.
|
|
|
11 |
Dollars in thousands
|
|
|
Three Months Ended March 31, |
|
|||||
|
|
|
2016 |
|
|
2015 |
|
||
|
Revenues |
|
|
|
|
|
|
|
|
|
Rental income |
|
$ |
130,452 |
|
|
$ |
64,218 |
|
|
Fee, chargeback and asset management income |
|
|
8,934 |
|
|
|
9,605 |
|
|
Total revenues |
|
|
139,386 |
|
|
|
73,823 |
|
|
Expenses |
|
|
|
|
|
|
|
|
|
Property and maintenance |
|
|
18,518 |
|
|
|
13,494 |
|
|
Real estate taxes, insurance, HOA costs |
|
|
27,282 |
|
|
|
14,040 |
|
|
Property management |
|
|
8,751 |
|
|
|
4,790 |
|
|
Depreciation and amortization |
|
|
43,630 |
|
|
|
26,012 |
|
|
General and administrative |
|
|
17,725 |
|
|
|
11,741 |
|
|
Merger and transaction related expenses |
|
|
23,482 |
|
|
|
— |
|
|
Interest expense |
|
|
39,360 |
|
|
|
17,876 |
|
|
Interest (income) and other (income)/expense |
|
|
425 |
|
|
|
3,768 |
|
|
Total expenses |
|
|
179,173 |
|
|
|
91,721 |
|
|
Income before income and other taxes, income (loss) from investments in unconsolidated entities, net gain (loss) on sales of real estate and discontinued operations |
|
|
(39,787 |
) |
|
|
(17,898 |
) |
|
Income tax (expense) benefit |
|
|
(245 |
) |
|
|
11 |
|
|
Income (loss) from investments in unconsolidated entities (1) |
|
|
(8,401 |
) |
|
|
93 |
|
|
Net gain on sale of real estate owned |
|
|
1,384 |
|
|
|
401 |
|
|
Net loss |
|
|
(47,049 |
) |
|
|
(17,393 |
) |
|
Net loss attributable to noncontrolling interests |
|
|
2,850 |
|
|
|
6,472 |
|
|
Net loss attributable to Colony Starwood Homes |
|
|
(44,199 |
) |
|
|
(10,921 |
) |
|
Net income attributable to preferred shareholders |
|
|
— |
|
|
|
(4 |
) |
|
Net loss available to common shareholders |
|
$ |
(44,199 |
) |
|
$ |
(10,925 |
) |
Please see the Appendix at the back of this presentation for certain definitions, explanations and reconciliations of Non-GAAP financial measures. All information is as of March 31, 2016 unless otherwise indicated.
|
(1) |
Includes results from NPL business and Fannie Mae Joint Venture. |
|
|
|
12 |
Reconciliation to FFO and Core FFO
Dollars in thousands, except share and per share data
|
|
|
Three Months Ended March 31, 2016 |
|
|
|
Reconciliation of net loss to NAREIT FFO |
|
|
|
|
|
Net loss attributable to common shareholders |
|
$ |
(44,199 |
) |
|
Adjustments: |
|
|
|
|
|
Depreciation and amortization on real estate assets |
|
|
43,384 |
|
|
Impairment of real estate assets |
|
|
30 |
|
|
Net gain on sale of depreciable property |
|
|
(1,384 |
) |
|
Non-controlling interests |
|
|
(2,850 |
) |
|
NAREIT FFO |
|
$ |
(5,019 |
) |
|
|
|
|
|
|
|
NAREIT FFO per share (1) |
|
$ |
(0.05 |
) |
|
|
|
|
|
|
|
Adjustments for Core FFO |
|
|
|
|
|
NAREIT FFO |
|
$ |
(5,019 |
) |
|
Amortization of deferred financing costs and debt premium discounts |
|
|
8,430 |
|
|
Merger and transaction related expenses |
|
|
23,482 |
|
|
Integration costs |
|
|
5,630 |
|
|
Share-based compensation |
|
|
387 |
|
|
Adjustments for derivative instruments |
|
|
300 |
|
|
Loss on NPLs, net |
|
|
10,501 |
|
|
Core FFO |
|
$ |
43,711 |
|
|
|
|
|
|
|
|
Core FFO per share (1) |
|
$ |
0.40 |
|
Please see the Appendix at the back of this presentation for certain definitions, explanations and reconciliations of Non-GAAP financial measures. All information is as of March 31, 2016 unless otherwise indicated.
|
(1) |
Common shares total 108,466,754 comprised of 102,066,754 weighted average shares and outstanding OP units exchangeable for 6,400,000 common shares. |
|
|
|
13 |
Normalizations for transaction, merger, integration and NPL costs
Dollars in thousands
|
|
|
Three Months Ended March 31, 2016 |
|
|||||||||||||||||||||||||||||||||
|
|
|
(+) |
|
|
(-) |
|
|
(-) |
|
|
(-) |
|
|
(=) |
|
|
Single Family Rental |
|
||||||||||||||||||
|
|
|
Consolidated Results |
|
|
Merger and Transaction Related Expenses |
|
|
Integration Costs |
|
|
NPL |
|
|
Total Single Family Rental |
|
|
Same Store Homes |
|
|
Stabilized Homes |
|
|
Development Homes |
|
|
Other Homes |
|
|||||||||
|
Revenues |
|
|
|
|
|
|
|
|
|
|
|
|
|
|
|
|
|
|
|
|
|
|
|
|
|
|
|
|
|
|
|
|
|
|
|
|
|
Rents from single-family properties |
|
$ |
130,452 |
|
|
|
|
|
|
|
|
|
|
|
|
|
|
$ |
130,452 |
|
|
$ |
95,532 |
|
|
$ |
34,458 |
|
|
$ |
2 |
|
|
$ |
460 |
|
|
Fees from single-family properties |
|
|
2,756 |
|
|
|
|
|
|
|
|
|
|
|
|
|
|
|
2,756 |
|
|
|
1,991 |
|
|
|
748 |
|
|
|
— |
|
|
|
17 |
|
|
Tenant chargebacks |
|
|
3,288 |
|
|
|
|
|
|
|
|
|
|
|
|
|
|
|
3,288 |
|
|
|
2,452 |
|
|
|
778 |
|
|
|
— |
|
|
|
58 |
|
|
Asset Management Fees |
|
|
2,890 |
|
|
|
|
|
|
|
|
|
|
|
|
|
|
|
2,890 |
|
|
|
— |
|
|
|
— |
|
|
|
— |
|
|
|
2,890 |
|
|
Total revenues |
|
|
139,386 |
|
|
|
— |
|
|
|
— |
|
|
|
— |
|
|
|
139,386 |
|
|
|
99,975 |
|
|
|
35,984 |
|
|
|
2 |
|
|
|
3,425 |
|
|
|
|
|
|
|
|
|
|
|
|
|
|
|
|
|
|
|
|
|
|
|
|
|
|
|
|
|
|
|
|
|
|
|
|
|
|
|
|
Operating Expenses |
|
|
|
|
|
|
|
|
|
|
|
|
|
|
|
|
|
|
|
|
|
|
|
|
|
|
|
|
|
|
|
|
|
|
|
|
|
Property and maintenance costs |
|
|
18,518 |
|
|
|
|
|
|
|
|
|
|
|
|
|
|
|
18,518 |
|
|
|
12,903 |
|
|
|
4,847 |
|
|
|
172 |
|
|
|
596 |
|
|
Real estate taxes, insurance, HOA costs |
|
|
27,282 |
|
|
|
|
|
|
|
|
|
|
|
|
|
|
|
27,282 |
|
|
|
19,564 |
|
|
|
6,972 |
|
|
|
45 |
|
|
|
701 |
|
|
Property management |
|
|
8,751 |
|
|
|
|
|
|
|
1,259 |
|
|
|
|
|
|
|
7,492 |
|
|
|
4,748 |
|
|
|
1,350 |
|
|
|
45 |
|
|
|
1,349 |
|
|
Total Operating Expenses |
|
|
54,551 |
|
|
|
— |
|
|
|
1,259 |
|
|
|
— |
|
|
|
53,292 |
|
|
$ |
37,215 |
|
|
$ |
13,169 |
|
|
$ |
262 |
|
|
$ |
2,646 |
|
|
|
|
|
|
|
|
|
|
|
|
|
|
|
|
|
|
|
|
|
|
|
|
|
|
|
|
|
|
|
|
|
|
|
|
|
|
|
|
Net Operating Income |
|
|
84,835 |
|
|
|
— |
|
|
|
(1,259 |
) |
|
|
— |
|
|
|
86,094 |
|
|
|
62,760 |
|
|
|
22,815 |
|
|
|
(260 |
) |
|
|
779 |
|
|
|
|
|
|
|
|
|
|
|
|
|
|
|
|
|
|
|
|
|
|
|
|
|
|
|
|
|
|
|
|
|
|
|
|
|
|
|
|
Non-Operating Expenses |
|
|
|
|
|
|
|
|
|
|
|
|
|
|
|
|
|
|
|
|
|
|
|
|
|
|
|
|
|
|
|
|
|
|
|
|
|
General and administrative |
|
|
17,725 |
|
|
|
|
|
|
|
4,371 |
|
|
|
|
|
|
|
13,354 |
|
|
|
|
|
|
|
|
|
|
|
|
|
|
|
|
|
|
Merger and transaction related expenses |
|
|
23,482 |
|
|
|
23,482 |
|
|
|
|
|
|
|
|
|
|
|
— |
|
|
|
|
|
|
|
|
|
|
|
|
|
|
|
|
|
|
Depreciation and amortization |
|
|
43,630 |
|
|
|
|
|
|
|
|
|
|
|
|
|
|
|
43,630 |
|
|
|
|
|
|
|
|
|
|
|
|
|
|
|
|
|
|
Interest Expense |
|
|
39,360 |
|
|
|
|
|
|
|
|
|
|
|
1,903 |
|
|
|
37,457 |
|
|
|
|
|
|
|
|
|
|
|
|
|
|
|
|
|
|
Other Expense / (Income) |
|
|
7,687 |
|
|
|
|
|
|
|
|
|
|
|
8,599 |
|
|
|
(912 |
) |
|
|
|
|
|
|
|
|
|
|
|
|
|
|
|
|
|
Total Non-Operating Expenses |
|
|
131,884 |
|
|
|
23,482 |
|
|
|
4,371 |
|
|
|
10,502 |
|
|
|
93,529 |
|
|
|
|
|
|
|
|
|
|
|
|
|
|
|
|
|
|
|
|
|
|
|
|
|
|
|
|
|
|
|
|
|
|
|
|
|
|
|
|
|
|
|
|
|
|
|
|
|
|
|
|
|
|
|
|
Net (Loss) |
|
|
(47,049 |
) |
|
|
(23,482 |
) |
|
|
(5,630 |
) |
|
|
(10,502 |
) |
|
|
(7,435 |
) |
|
|
|
|
|
|
|
|
|
|
|
|
|
|
|
|
|
Net loss attributable to non- controlling interests |
|
|
2,850 |
|
|
|
|
|
|
|
|
|
|
|
|
|
|
|
2,850 |
|
|
|
|
|
|
|
|
|
|
|
|
|
|
|
|
|
|
Net (loss) available to common shareholders |
|
$ |
(44,199 |
) |
|
$ |
(23,482 |
) |
|
$ |
(5,630 |
) |
|
$ |
(10,502 |
) |
|
$ |
(4,585 |
) |
|
|
|
|
|
|
|
|
|
|
|
|
|
|
|
|
Please see the Appendix at the back of this presentation for certain definitions, explanations and reconciliations of Non-GAAP financial measures. All information is as of March 31, 2016 unless otherwise indicated.
|
|
|
14 |
Quarter-over-quarter change
Dollars in thousands
|
|
|
Q1 16 |
|
|
|
Q1 15 |
|
|
Change % |
|
|||
|
Rental and other property revenues: |
|
|
|
|
|
|
|
|
|
|
|
|
|
|
Same-Store Homes |
|
$ |
99,975 |
|
|
|
$ |
94,246 |
|
|
|
6.1 |
% |
|
Stabilized Homes |
|
|
35,984 |
|
|
|
|
13,817 |
|
|
|
160.4 |
% |
|
Development Homes |
|
|
2 |
|
|
|
|
— |
|
|
N/A |
|
|
|
Other Homes |
|
|
3,425 |
|
|
|
|
3,672 |
|
|
|
-6.7 |
% |
|
Total rental and other property revenues |
|
$ |
139,386 |
|
|
|
$ |
111,735 |
|
|
|
24.7 |
% |
|
|
|
|
|
|
|
|
|
|
|
|
|
|
|
|
Property operating expenses: |
|
|
|
|
|
|
|
|
|
|
|
|
|
|
Same-Store Homes |
|
$ |
37,215 |
|
|
|
$ |
37,454 |
|
|
|
-0.6 |
% |
|
Stabilized Homes |
|
|
13,169 |
|
|
|
|
8,349 |
|
|
|
57.7 |
% |
|
Development Homes |
|
|
262 |
|
|
|
|
112 |
|
|
|
134.8 |
% |
|
Other Homes |
|
|
2,646 |
|
|
|
|
3,148 |
|
|
|
-15.9 |
% |
|
Total property operating expenses |
|
$ |
53,292 |
|
|
|
$ |
49,062 |
|
|
|
8.6 |
% |
|
|
|
|
|
|
|
|
|
|
|
|
|
|
|
|
Net Operating Income: |
|
|
|
|
|
|
|
|
|
|
|
|
|
|
Same-Store Homes |
|
$ |
62,760 |
|
|
|
$ |
56,792 |
|
|
|
10.5 |
% |
|
Stabilized Homes |
|
|
22,815 |
|
|
|
|
5,468 |
|
|
|
317.3 |
% |
|
Development Homes |
|
|
(260 |
) |
|
|
|
(112 |
) |
|
|
133.0 |
% |
|
Other Homes |
|
|
779 |
|
|
|
|
524 |
|
|
|
48.5 |
% |
|
Total property NOI |
|
$ |
86,094 |
|
|
|
$ |
62,673 |
|
|
|
37.4 |
% |
|
Same Store operating metrics: |
|
Q1 16 |
|
|
|
Q1 15 |
|
|
||
|
NOI margin |
|
|
62.8 |
% |
|
|
|
60.3 |
% |
|
|
Core NOI margin |
|
|
65.5 |
% |
|
|
|
62.5 |
% |
|
|
Occupancy % |
|
|
95.8 |
% |
|
|
|
94.8 |
% |
|
|
Annualized turnover rate |
|
|
27.2 |
% |
|
|
N/A |
|
|
|
|
Blended rent growth |
|
|
3.9 |
% |
|
|
N/A |
|
|
|
Please see the Appendix at the back of this presentation for certain definitions, explanations and reconciliations of Non-GAAP financial measures. All information is as of March 31, 2016 unless otherwise indicated.
|
|
|
15 |
IV. Selected Additional Information
|
|
|
16 |
Owned and Non-Owned, Managed Homes as of March 31, 2016
|
Market: |
|
Same Store Homes |
|
|
Stabilized Homes |
|
|
Development Homes |
|
|
|
|
Other Homes |
|
|
Owned Homes (1) |
|
|
Owned Homes Occupied % (2) |
|
|
Non-Owned, Managed Homes |
|
|
Total Homes |
|
||||||||
|
Atlanta |
|
|
4,987 |
|
|
|
658 |
|
|
|
14 |
|
|
|
|
|
141 |
|
|
|
5,800 |
|
|
|
96.1% |
|
|
|
314 |
|
|
|
6,114 |
|
|
Miami |
|
|
2,139 |
|
|
|
1,548 |
|
|
|
59 |
|
|
|
|
|
116 |
|
|
|
3,862 |
|
|
|
93.6% |
|
|
|
146 |
|
|
|
4,008 |
|
|
Tampa |
|
|
2,308 |
|
|
|
942 |
|
|
|
9 |
|
|
|
|
|
27 |
|
|
|
3,286 |
|
|
|
93.6% |
|
|
|
199 |
|
|
|
3,485 |
|
|
Houston |
|
|
2,283 |
|
|
|
483 |
|
|
|
8 |
|
|
|
|
|
115 |
|
|
|
2,889 |
|
|
|
94.6% |
|
|
|
— |
|
|
|
2,889 |
|
|
Southern California |
|
|
2,611 |
|
|
|
193 |
|
|
|
5 |
|
|
|
|
|
30 |
|
|
|
2,839 |
|
|
|
96.9% |
|
|
|
1,504 |
|
|
|
4,343 |
|
|
Orlando |
|
|
1,765 |
|
|
|
635 |
|
|
|
16 |
|
|
|
|
|
21 |
|
|
|
2,437 |
|
|
|
94.5% |
|
|
|
15 |
|
|
|
2,452 |
|
|
Dallas |
|
|
1,178 |
|
|
|
901 |
|
|
|
32 |
|
|
|
|
|
114 |
|
|
|
2,225 |
|
|
|
94.4% |
|
|
|
— |
|
|
|
2,225 |
|
|
Denver |
|
|
1,088 |
|
|
|
832 |
|
|
|
33 |
|
|
|
|
|
4 |
|
|
|
1,957 |
|
|
|
94.1% |
|
|
|
— |
|
|
|
1,957 |
|
|
Las Vegas |
|
|
1,629 |
|
|
|
94 |
|
|
|
— |
|
|
|
|
|
2 |
|
|
|
1,725 |
|
|
|
95.4% |
|
|
|
190 |
|
|
|
1,915 |
|
|
Phoenix |
|
|
1,320 |
|
|
|
26 |
|
|
|
— |
|
|
|
|
|
1 |
|
|
|
1,347 |
|
|
|
96.9% |
|
|
|
454 |
|
|
|
1,801 |
|
|
Top 10 Markets |
|
|
21,308 |
|
|
|
6,312 |
|
|
|
176 |
|
|
|
|
|
571 |
|
|
|
28,367 |
|
|
|
95.0% |
|
|
|
2,822 |
|
|
|
31,189 |
|
|
Northern California |
|
|
734 |
|
|
|
47 |
|
|
|
— |
|
|
|
|
|
6 |
|
|
|
787 |
|
|
|
97.8% |
|
|
|
1,164 |
|
|
|
1,951 |
|
|
Charlotte - Raleigh |
|
|
161 |
|
|
|
593 |
|
|
|
— |
|
|
|
|
|
— |
|
|
|
754 |
|
|
|
98.1% |
|
|
|
— |
|
|
|
754 |
|
|
Nashville |
|
|
— |
|
|
|
191 |
|
|
|
2 |
|
|
|
|
|
— |
|
|
|
193 |
|
|
|
94.8% |
|
|
|
— |
|
|
|
193 |
|
|
Other Markets |
|
|
603 |
|
|
|
369 |
|
|
|
11 |
|
|
|
|
|
32 |
|
|
|
1,015 |
|
|
|
91.6% |
|
|
|
402 |
|
|
|
1,417 |
|
|
Total |
|
|
22,806 |
|
|
|
7,512 |
|
|
|
189 |
|
|
|
|
|
609 |
|
|
|
31,116 |
|
|
|
95.0% |
|
|
|
4,388 |
|
|
|
35,504 |
|
|
|
|
|
|
|
|
|
|
|
|
|
|
|
|
|
|
|
|
|
|
|
|
|
|
|
|
|
|
|
|
|
|
|
|
|
Please see the Appendix at the back of this presentation for certain definitions, explanations and reconciliations of Non-GAAP financial measures. All information is as of March 31, 2016 unless otherwise indicated.
|
(1) |
Excludes REO properties. |
|
(2) |
Calculation excludes "Other Homes" in the denominator of the calculation. |
|
|
|
17 |
First quarter 2016 acquisition and disposition activity summary
|
Market: |
|
Properties as of 12/31/15 (1) |
|
|
Acquisitions |
|
|
Dispositions |
|
|
Properties as of 3/31/16 |
|
||||
|
Atlanta |
|
|
5,822 |
|
|
|
— |
|
|
|
(22 |
) |
|
|
5,800 |
|
|
Miami |
|
|
3,880 |
|
|
|
— |
|
|
|
(18 |
) |
|
|
3,862 |
|
|
Tampa |
|
|
3,292 |
|
|
|
8 |
|
|
|
(14 |
) |
|
|
3,286 |
|
|
Houston |
|
|
2,899 |
|
|
|
— |
|
|
|
(10 |
) |
|
|
2,889 |
|
|
Southern California |
|
|
2,857 |
|
|
|
— |
|
|
|
(18 |
) |
|
|
2,839 |
|
|
Orlando |
|
|
2,440 |
|
|
|
— |
|
|
|
(3 |
) |
|
|
2,437 |
|
|
Dallas |
|
|
2,249 |
|
|
|
4 |
|
|
|
(28 |
) |
|
|
2,225 |
|
|
Denver |
|
|
1,958 |
|
|
|
— |
|
|
|
(1 |
) |
|
|
1,957 |
|
|
Las Vegas |
|
|
1,728 |
|
|
|
— |
|
|
|
(3 |
) |
|
|
1,725 |
|
|
Phoenix |
|
|
1,348 |
|
|
|
— |
|
|
|
(1 |
) |
|
|
1,347 |
|
|
Top 10 Markets |
|
|
28,473 |
|
|
|
12 |
|
|
|
(118 |
) |
|
|
28,367 |
|
|
Northern California |
|
|
788 |
|
|
|
— |
|
|
|
(1 |
) |
|
|
787 |
|
|
Charlotte - Raleigh |
|
|
755 |
|
|
|
— |
|
|
|
(1 |
) |
|
|
754 |
|
|
Nashville |
|
|
193 |
|
|
|
— |
|
|
|
— |
|
|
|
193 |
|
|
Other Markets |
|
|
1,019 |
|
|
|
— |
|
|
|
(4 |
) |
|
|
1,015 |
|
|
Total Owned Homes |
|
|
31,228 |
|
|
|
12 |
|
|
|
(124 |
) |
|
|
31,116 |
|
|
|
|
|
|
|
|
|
|
|
|
|
|
|
|
|
|
|
|
Non-owned, Managed Homes |
|
|
4,449 |
|
|
|
7 |
|
|
|
(68 |
) |
|
|
4,388 |
|
|
|
|
|
|
|
|
|
|
|
|
|
|
|
|
|
|
|
|
Total Homes |
|
|
35,677 |
|
|
|
19 |
|
|
|
(192 |
) |
|
|
35,504 |
|
Please see the Appendix at the back of this presentation for certain definitions, explanations and reconciliations of Non-GAAP financial measures. All information is as of March 31, 2016 unless otherwise indicated.
|
(1) |
Total owned homes as of December 31, 2015 are pro forma for the merger. |
|
|
|
18 |
$4.1Bn of outstanding debt with 48% fixed rate inclusive of interest rate swap
Dollars in millions
|
|
|
Amount outstanding |
|
|
Interest rate |
|
Initial maturity |
|
Extensions |
|
Full maturity |
|
|
Securitizations: (1) |
|
|
|
|
|
|
|
|
|
|
|
|
|
CAH 2014-1 Securitization |
|
$ |
502 |
|
|
L+178bps |
|
Apr-17 |
|
Two, one-year |
|
May-19 |
|
CAH 2014-2 Securitization |
|
$ |
554 |
|
|
L+173bps |
|
Jun-16 |
|
Three, one-year |
|
Jul-19 |
|
CAH 2015-1 Securitization, net (2) |
|
$ |
639 |
|
|
L+197bps |
|
Jun-17 |
|
Three, one-year |
|
Jul-20 |
|
SWAY 2014-1 Securitization, net (2) |
|
$ |
500 |
|
|
L+236bps |
|
Jan-17 |
|
Three, one-year |
|
Jan-20 |
|
Total Securitizations |
|
$ |
2,195 |
|
|
|
|
|
|
|
|
|
|
|
|
|
|
|
|
|
|
|
|
|
|
|
|
Secured Credit Facilities: |
|
|
|
|
|
|
|
|
|
|
|
|
|
CAH Credit Facility |
|
$ |
508 |
|
|
L+300bps |
|
Jul-17 |
|
None |
|
Jul-17 |
|
SWAY Credit Facility |
|
$ |
751 |
|
|
L+295bps |
|
Feb-17 |
|
One-year |
|
Feb-18 |
|
Total Secured Credit Facilities |
|
$ |
1,259 |
|
|
|
|
|
|
|
|
|
|
|
|
|
|
|
|
|
|
|
|
|
|
|
|
Convertible Debt: |
|
|
|
|
|
|
|
|
|
|
|
|
|
Convertible Notes (due 2017) |
|
$ |
173 |
|
|
450bps |
|
Oct-17 |
|
None |
|
Oct-17 |
|
Convertible Notes (due 2019) |
|
$ |
230 |
|
|
300bps |
|
Jul-19 |
|
None |
|
Jul-19 |
|
Total Convertible Debt |
|
$ |
403 |
|
|
|
|
|
|
|
|
|
|
|
|
|
|
|
|
|
|
|
|
|
|
|
|
Total Single-Family REIT Debt (2) |
|
$ |
3,857 |
|
|
|
|
|
|
|
|
|
|
|
|
|
|
|
|
|
|
|
|
|
|
|
|
Non-performing loans warehouse facility |
|
$ |
268 |
|
|
L+238bps |
|
Mar-17 |
|
6-months |
|
Sep-17 |
|
|
|
|
|
|
|
|
|
|
|
|
|
|
|
Total Debt Outstanding (2) |
|
$ |
4,125 |
|
|
|
|
|
|
|
|
|
Please see the Appendix at the back of this presentation for certain definitions, explanations and reconciliations of Non-GAAP financial measures. All information is as of March 31, 2016 unless otherwise indicated.
|
(1) |
Colony Starwood Homes entered into an interest rate swap structure in February 2016 with a notional amount of $1.6B at 2.75%. |
|
(2) |
Securitization net of Class G certificate, CAH 2015-1 in the amount of $33.6M and SWAY 2014-1 in the amount of $26.6. |
|
|
|
19 |
As of March 31, 2016
Dollars in thousands, except per share data
|
Fair value of real estate |
|
|
|
|
|
Total investment in real estate properties, net (1) |
|
$ |
5,819,914 |
|
|
Real estate fair value adjustment |
|
|
1,165,119 |
|
|
Total fair value of real estate properties |
|
|
6,985,033 |
|
|
Other assets |
|
|
|
|
|
Cash, cash equivalents, and restricted cash |
|
|
357,618 |
|
|
Asset-back securitization certificates |
|
|
60,242 |
|
|
Non-performing loans fair value |
|
|
364,930 |
|
|
Other assets (2) |
|
|
92,008 |
|
|
Total Tangible Assets at FMV |
|
$ |
7,859,831 |
|
|
|
|
|
|
|
|
Secured credit facilities |
|
$ |
1,258,920 |
|
|
Mortgage loans, net (3) |
|
|
2,255,947 |
|
|
Non-performing loan warehouse facility |
|
|
267,547 |
|
|
Convertible senior notes (4) |
|
|
402,500 |
|
|
Other liabilities |
|
|
154,282 |
|
|
Total liabilities as adjusted |
|
$ |
4,339,196 |
|
|
NAV |
|
$ |
3,520,635 |
|
|
Shares (5) |
|
|
107,887 |
|
|
NAV/Share |
|
$ |
32.63 |
|
|
· |
Net asset value build up based on asset-by-asset valuation of single family home portfolio primarily using third-party prepared AVMs and BPOs. |
|
· |
NPL assets’ fair value based on estimated portfolio sale value; the Company intends to treat the NPL business as a discontinued operation in future financial statements. |
|
· |
See Appendix for additional details on valuation methodology and process. |
Please see the Appendix at the back of this presentation for certain definitions, explanations and reconciliations of Non-GAAP financial measures. All information is as of March 31, 2016 unless otherwise indicated.
|
(1) |
Includes $114.4 million of Real Estate Assets Held for Sale and $112.1 million of REO assets at Book Value. |
|
(2) |
Other assets is adjusted to remove deferred financing costs, net of $6,083 and deferred leasing costs, net of $3,513 in arriving at Estimated NAV. |
|
(3) |
In our GAAP basis financial statements, Mortgage loans, net include $36,994 of unamortized deferred financing costs as a reduction to the net liability balance. In arriving at Estimated NAV, these deferred financing costs are added back to the liability balance. |
|
(4) |
Convertible senior notes are adjusted to reflect the face value of this debt in arriving at Estimated NAV. |
|
(5) |
Represents total common shares of 101,486,814 as of April 29th, 2016 plus 6.4 million OP units. Excludes unvested Restricted Share Units. |
|
|
|
20 |
V. Same Store Information
|
|
|
21 |
As of March 31, 2016
|
Market: |
|
Same Store Homes |
|
|
Occupancy % |
|
|
Average Acquisition Cost per Home |
|
|
Average Investment |
|
|
Average Home Size (sq. ft.) |
|
|
Weighted Average Home Age (years) |
|
|
Average Monthly Rent per Occupied Home |
|
|||||||
|
Atlanta |
|
|
4,987 |
|
|
|
96.5% |
|
|
$ |
123,125 |
|
|
$ |
140,660 |
|
|
|
1,974 |
|
|
|
23 |
|
|
$ |
1,242 |
|
|
Southern California |
|
|
2,611 |
|
|
|
97.2% |
|
|
|
267,142 |
|
|
|
299,204 |
|
|
|
1,713 |
|
|
|
40 |
|
|
|
1,951 |
|
|
Tampa |
|
|
2,308 |
|
|
|
93.4% |
|
|
|
158,351 |
|
|
|
180,300 |
|
|
|
1,712 |
|
|
|
29 |
|
|
|
1,452 |
|
|
Houston |
|
|
2,283 |
|
|
|
95.1% |
|
|
|
147,335 |
|
|
|
149,765 |
|
|
|
1,919 |
|
|
|
18 |
|
|
|
1,449 |
|
|
Miami |
|
|
2,139 |
|
|
|
95.2% |
|
|
|
198,293 |
|
|
|
208,762 |
|
|
|
1,673 |
|
|
|
41 |
|
|
|
1,700 |
|
|
Orlando |
|
|
1,765 |
|
|
|
95.1% |
|
|
|
128,914 |
|
|
|
155,777 |
|
|
|
1,714 |
|
|
|
27 |
|
|
|
1,292 |
|
|
Las Vegas |
|
|
1,629 |
|
|
|
95.6% |
|
|
|
186,217 |
|
|
|
201,973 |
|
|
|
2,029 |
|
|
|
17 |
|
|
|
1,372 |
|
|
Phoenix |
|
|
1,320 |
|
|
|
96.8% |
|
|
|
136,440 |
|
|
|
151,017 |
|
|
|
1,696 |
|
|
|
26 |
|
|
|
1,120 |
|
|
Dallas |
|
|
1,178 |
|
|
|
96.9% |
|
|
|
157,810 |
|
|
|
161,595 |
|
|
|
1,948 |
|
|
|
24 |
|
|
|
1,470 |
|
|
Denver |
|
|
1,088 |
|
|
|
96.4% |
|
|
|
178,521 |
|
|
|
198,398 |
|
|
|
1,658 |
|
|
|
37 |
|
|
|
1,606 |
|
|
Top 10 Markets |
|
|
21,308 |
|
|
|
95.8% |
|
|
|
165,480 |
|
|
|
182,880 |
|
|
|
1,825 |
|
|
|
28 |
|
|
|
1,458 |
|
|
Northern California |
|
|
734 |
|
|
|
97.7% |
|
|
|
226,619 |
|
|
|
249,991 |
|
|
|
1,428 |
|
|
|
47 |
|
|
|
1,692 |
|
|
Charlotte - Raleigh |
|
|
161 |
|
|
|
99.4% |
|
|
|
151,884 |
|
|
|
170,810 |
|
|
|
2,074 |
|
|
|
14 |
|
|
|
1,442 |
|
|
Other Markets |
|
|
603 |
|
|
|
90.9% |
|
|
|
149,690 |
|
|
|
155,840 |
|
|
|
1,596 |
|
|
|
39 |
|
|
|
1,526 |
|
|
Total |
|
|
22,806 |
|
|
|
95.8% |
|
|
$ |
166,934 |
|
|
$ |
184,239 |
|
|
|
1,808 |
|
|
|
29 |
|
|
$ |
1,467 |
|
Please see the Appendix at the back of this presentation for certain definitions, explanations and reconciliations of Non-GAAP financial measures. All information is as of March 31, 2016 unless otherwise indicated.
|
|
|
22 |
Same Store Quarter-Over-Quarter Results
Dollars in thousands
|
|
|
Q1 16 (1) |
|
|
Q1 15 |
|
|
% Change |
|
|||
|
Revenues: |
|
|
|
|
|
|
|
|
|
|
|
|
|
Rental income |
|
$ |
95,532 |
|
|
$ |
90,204 |
|
|
|
6.0 |
% |
|
Fee income |
|
|
1,991 |
|
|
|
1,689 |
|
|
|
17.8 |
% |
|
Resident chargebacks |
|
|
2,452 |
|
|
|
2,353 |
|
|
|
4.2 |
% |
|
Total rental and other property revenue |
|
$ |
99,975 |
|
|
$ |
94,246 |
|
|
|
6.1 |
% |
|
|
|
|
|
|
|
|
|
|
|
|
|
|
|
Expenses: |
|
|
|
|
|
|
|
|
|
|
|
|
|
Repairs, maintenance and turn costs |
|
$ |
8,309 |
|
|
$ |
9,863 |
|
|
|
-15.8 |
% |
|
Real estate taxes, insurance and HOA costs |
|
|
19,564 |
|
|
|
18,295 |
|
|
|
6.9 |
% |
|
Property management costs |
|
|
4,748 |
|
|
|
5,075 |
|
|
|
-6.4 |
% |
|
Bad debt expense (2) |
|
|
1,650 |
|
|
|
1,045 |
|
|
|
57.8 |
% |
|
Other operating expenses |
|
|
2,944 |
|
|
|
3,175 |
|
|
|
-7.3 |
% |
|
Total property operating expenses |
|
$ |
37,215 |
|
|
$ |
37,453 |
|
|
|
-0.6 |
% |
|
|
|
|
|
|
|
|
|
|
|
|
|
|
|
Net Operating Income |
|
$ |
62,760 |
|
|
$ |
56,793 |
|
|
|
10.5 |
% |
|
Net Operating Income margin |
|
|
62.8 |
% |
|
|
60.3 |
% |
|
|
|
|
Please see the Appendix at the back of this presentation for certain definitions, explanations and reconciliations of Non-GAAP financial measures. All information is as of March 31, 2016 unless otherwise indicated.
|
(1) |
Q1 16 is adjusted for transitions costs, please see Income Statement Bridge slide. |
|
(2) |
In Q4 14 CAH recorded a large, non-recurring, bad debt allowance during their transition away from third-party property managers. This event reduced the allowance necessary in Q1 15. |
|
|
|
23 |
Same Store Core Quarter-Over-Quarter Results
Dollars in thousands
|
|
|
Q1 16 |
|
|
Q1 15 |
|
|
% Change |
|
|||
|
Revenues: |
|
|
|
|
|
|
|
|
|
|
|
|
|
Rental income |
|
$ |
95,532 |
|
|
$ |
90,204 |
|
|
|
5.9 |
% |
|
Fee income |
|
|
1,991 |
|
|
|
1,689 |
|
|
|
17.8 |
% |
|
Bad debt expense (1) |
|
|
(1,650 |
) |
|
|
(1,045 |
) |
|
|
57.8 |
% |
|
Core rental revenue |
|
$ |
95,873 |
|
|
$ |
90,848 |
|
|
|
5.5 |
% |
|
|
|
|
|
|
|
|
|
|
|
|
|
|
|
Expenses: |
|
|
|
|
|
|
|
|
|
|
|
|
|
Total property operating expenses |
|
$ |
37,215 |
|
|
$ |
37,453 |
|
|
|
-0.6 |
% |
|
Resident chargebacks |
|
|
(2,452 |
) |
|
|
(2,353 |
) |
|
|
4.2 |
% |
|
Bad debt expense (1) |
|
|
(1,650 |
) |
|
|
(1,045 |
) |
|
|
57.8 |
% |
|
Core property operating expenses |
|
$ |
33,113 |
|
|
$ |
34,055 |
|
|
|
-2.8 |
% |
|
|
|
|
|
|
|
|
|
|
|
|
|
|
|
Core Net Operating Income |
|
$ |
62,760 |
|
|
$ |
56,793 |
|
|
|
10.5 |
% |
|
Core Net Operating Income margin |
|
|
65.5 |
% |
|
|
62.5 |
% |
|
|
|
|
Please see the Appendix at the back of this presentation for certain definitions, explanations and reconciliations of Non-GAAP financial measures. All information is as of March 31, 2016 unless otherwise indicated.
|
(1) |
In Q4 14 CAH recorded a large, non-recurring, bad debt allowance during their transition away from third-party property managers. This event reduced the allowance necessary in Q1 15. |
|
|
|
24 |
Three months ended March 31, 2016
Dollars in thousands
|
Market: |
|
Same Store Homes |
|
|
Revenues |
|
|
Expenses |
|
|
Net Operating Income |
|
|
Core Operating Margin |
|
|||||
|
Atlanta |
|
|
4,987 |
|
|
$ |
18,809 |
|
|
$ |
6,641 |
|
|
$ |
12,168 |
|
|
|
68.2 |
% |
|
Southern California |
|
|
2,611 |
|
|
|
15,331 |
|
|
|
4,886 |
|
|
|
10,445 |
|
|
|
70.6 |
% |
|
Tampa |
|
|
2,308 |
|
|
|
9,823 |
|
|
|
4,184 |
|
|
|
5,639 |
|
|
|
59.5 |
% |
|
Houston |
|
|
2,283 |
|
|
|
9,664 |
|
|
|
4,678 |
|
|
|
4,986 |
|
|
|
53.2 |
% |
|
Miami |
|
|
2,139 |
|
|
|
10,528 |
|
|
|
4,889 |
|
|
|
5,639 |
|
|
|
55.6 |
% |
|
Orlando |
|
|
1,765 |
|
|
|
6,808 |
|
|
|
2,769 |
|
|
|
4,039 |
|
|
|
62.2 |
% |
|
Las Vegas |
|
|
1,629 |
|
|
|
6,824 |
|
|
|
1,871 |
|
|
|
4,953 |
|
|
|
75.3 |
% |
|
Phoenix |
|
|
1,320 |
|
|
|
4,555 |
|
|
|
1,309 |
|
|
|
3,246 |
|
|
|
75.0 |
% |
|
Dallas |
|
|
1,178 |
|
|
|
5,177 |
|
|
|
1,920 |
|
|
|
3,257 |
|
|
|
65.0 |
% |
|
Denver |
|
|
1,088 |
|
|
|
5,256 |
|
|
|
1,420 |
|
|
|
3,836 |
|
|
|
76.4 |
% |
|
Top 10 Markets |
|
|
21,308 |
|
|
|
92,775 |
|
|
|
34,567 |
|
|
|
58,208 |
|
|
|
65.4 |
% |
|
Northern California |
|
|
734 |
|
|
|
3,841 |
|
|
|
1,188 |
|
|
|
2,653 |
|
|
|
73.1 |
% |
|
Charlotte - Raleigh |
|
|
161 |
|
|
|
727 |
|
|
|
227 |
|
|
|
500 |
|
|
|
71.6 |
% |
|
Other Markets |
|
|
603 |
|
|
|
2,632 |
|
|
|
1,233 |
|
|
|
1,399 |
|
|
|
56.1 |
% |
|
Total |
|
|
22,806 |
|
|
$ |
99,975 |
|
|
$ |
37,215 |
|
|
$ |
62,760 |
|
|
|
65.5 |
% |
|
|
|
|
|
|
|
|
|
|
|
|
|
|
|
|
|
|
|
|
|
|
Please see the Appendix at the back of this presentation for certain definitions, explanations and reconciliations of Non-GAAP financial measures. All information is as of March 31, 2016 unless otherwise indicated.
|
|
|
25 |
Three months ended March 31, 2016
|
|
|
Expiration Outcome (1) |
|
|
Turnover (4) |
|
||||||||||||||||||||||
|
Market: |
|
Expiration Count |
|
|
Renewed (2) |
|
|
Retained (3) |
|
|
Renewal Rate |
|
|
Retention Rate |
|
|
Q1 Turnover Rate (5) |
|
|
YTD Annualized Turnover Rate (6) |
|
|||||||
|
Atlanta |
|
|
756 |
|
|
|
501 |
|
|
|
609 |
|
|
|
66.3 |
% |
|
|
80.6 |
% |
|
|
6.5 |
% |
|
|
25.9 |
% |
|
Tampa |
|
|
430 |
|
|
|
273 |
|
|
|
305 |
|
|
|
63.5 |
% |
|
|
70.9 |
% |
|
|
8.8 |
% |
|
|
35.1 |
% |
|
Southern California |
|
|
420 |
|
|
|
309 |
|
|
|
346 |
|
|
|
73.6 |
% |
|
|
82.4 |
% |
|
|
5.8 |
% |
|
|
23.3 |
% |
|
Orlando |
|
|
362 |
|
|
|
243 |
|
|
|
262 |
|
|
|
67.1 |
% |
|
|
72.4 |
% |
|
|
7.7 |
% |
|
|
30.7 |
% |
|
Miami |
|
|
337 |
|
|
|
217 |
|
|
|
264 |
|
|
|
64.4 |
% |
|
|
78.3 |
% |
|
|
6.7 |
% |
|
|
26.9 |
% |
|
Las Vegas |
|
|
240 |
|
|
|
143 |
|
|
|
165 |
|
|
|
59.6 |
% |
|
|
68.8 |
% |
|
|
6.9 |
% |
|
|
27.7 |
% |
|
Phoenix |
|
|
218 |
|
|
|
140 |
|
|
|
162 |
|
|
|
64.2 |
% |
|
|
74.3 |
% |
|
|
7.4 |
% |
|
|
29.7 |
% |
|
Houston |
|
|
195 |
|
|
|
103 |
|
|
|
131 |
|
|
|
52.8 |
% |
|
|
67.2 |
% |
|
|
6.3 |
% |
|
|
25.2 |
% |
|
Dallas |
|
|
129 |
|
|
|
83 |
|
|
|
98 |
|
|
|
64.3 |
% |
|
|
76.0 |
% |
|
|
6.0 |
% |
|
|
24.2 |
% |
|
Denver |
|
|
115 |
|
|
|
65 |
|
|
|
81 |
|
|
|
56.5 |
% |
|
|
70.4 |
% |
|
|
5.5 |
% |
|
|
22.1 |
% |
|
Top 10 Markets |
|
|
3,202 |
|
|
|
2,077 |
|
|
|
2,423 |
|
|
|
64.9 |
% |
|
|
75.7 |
% |
|
|
6.8 |
% |
|
|
27.1 |
% |
|
Northern California |
|
|
123 |
|
|
|
83 |
|
|
|
102 |
|
|
|
67.5 |
% |
|
|
82.9 |
% |
|
|
6.9 |
% |
|
|
27.8 |
% |
|
Charlotte - Raleigh |
|
|
12 |
|
|
|
7 |
|
|
|
8 |
|
|
|
58.3 |
% |
|
|
66.7 |
% |
|
|
8.1 |
% |
|
|
32.3 |
% |
|
Other markets |
|
|
103 |
|
|
|
68 |
|
|
|
87 |
|
|
|
66.0 |
% |
|
|
84.5 |
% |
|
|
7.0 |
% |
|
|
27.9 |
% |
|
Total |
|
|
3,440 |
|
|
|
2,235 |
|
|
|
2,620 |
|
|
|
65.0 |
% |
|
|
76.2 |
% |
|
|
6.8 |
% |
|
|
27.2 |
% |
Please see the Appendix at the back of this presentation for certain definitions, explanations and reconciliations of Non-GAAP financial measures. All information is as of March 31, 2016 unless otherwise indicated.
|
(1) |
Represents the number of leases that expired within the quarter, less early terminations. |
|
(2) |
Lease expirations where the lease was renewed (excludes month-to-month leases). |
|
(3) |
Lease expirations where the resident did not "move out". Retention results are final as of April 30th, 2016. |
|
(4) |
Population limited to assets that realized resident turnover within the subject period, including out of period lease expirations where the lease was terminated early and month-to-month leases. |
|
(5) |
The number of assets that become unoccupied during the subject period as a percentage of homes with an initial move-in ready status. |
|
(6) |
The number of assets that become unoccupied during the subject period as an annualized percentage of homes with an initial move-in ready status. |
|
|
|
26 |
Three months ended March 31, 2016
|
|
|
Renewals |
|
|
Replacement Rent |
|
|
|
|
|
|
Escalations on Multi-Year Leases |
|
|
Total Rent Growth |
|
||||||||||||||||||||
|
Market: |
|
Total Leases |
|
|
Renewal Rent Growth |
|
|
Total Leases |
|
|
Replacement Rent Growth |
|
|
Blended Rent Growth |
|
|
Total Leases |
|
|
Average Rent Change (1) |
|
|
Total Leases |
|
|
Average Rent Change (2) |
|
|||||||||
|
Atlanta |
|
|
503 |
|
|
|
5.2 |
% |
|
|
363 |
|
|
|
3.4 |
% |
|
|
4.4 |
% |
|
|
128 |
|
|
|
3.0 |
% |
|
|
994 |
|
|
|
4.2 |
% |
|
Southern California |
|
|
370 |
|
|
|
5.1 |
% |
|
|
173 |
|
|
|
3.0 |
% |
|
|
4.4 |
% |
|
|
26 |
|
|
|
3.0 |
% |
|
|
569 |
|
|
|
4.3 |
% |
|
Tampa |
|
|
301 |
|
|
|
3.7 |
% |
|
|
157 |
|
|
|
2.0 |
% |
|
|
3.1 |
% |
|
|
51 |
|
|
|
3.0 |
% |
|
|
509 |
|
|
|
3.1 |
% |
|
Orlando |
|
|
269 |
|
|
|
5.1 |
% |
|
|
165 |
|
|
|
2.6 |
% |
|
|
4.1 |
% |
|
|
16 |
|
|
|
3.0 |
% |
|
|
450 |
|
|
|
4.1 |
% |
|
Miami |
|
|
227 |
|
|
|
4.1 |
% |
|
|
145 |
|
|
|
2.5 |
% |
|
|
3.4 |
% |
|
|
116 |
|
|
|
3.0 |
% |
|
|
488 |
|
|
|
3.3 |
% |
|
Houston |
|
|
183 |
|
|
|
4.3 |
% |
|
|
192 |
|
|
|
-1.5 |
% |
|
|
1.2 |
% |
|
|
43 |
|
|
|
3.0 |
% |
|
|
418 |
|
|
|
1.4 |
% |
|
Phoenix |
|
|
170 |
|
|
|
5.7 |
% |
|
|
102 |
|
|
|
8.8 |
% |
|
|
6.9 |
% |
|
|
3 |
|
|
|
3.0 |
% |
|
|
275 |
|
|
|
6.9 |
% |
|
Las Vegas |
|
|
162 |
|
|
|
4.5 |
% |
|
|
126 |
|
|
|
0.6 |
% |
|
|
2.8 |
% |
|
|
3 |
|
|
|
3.0 |
% |
|
|
291 |
|
|
|
2.8 |
% |
|
Dallas |
|
|
95 |
|
|
|
4.2 |
% |
|
|
81 |
|
|
|
2.8 |
% |
|
|
3.6 |
% |
|
|
26 |
|
|
|
3.0 |
% |
|
|
202 |
|
|
|
3.5 |
% |
|
Denver |
|
|
72 |
|
|
|
8.3 |
% |
|
|
71 |
|
|
|
5.0 |
% |
|
|
6.6 |
% |
|
|
10 |
|
|
|
3.0 |
% |
|
|
153 |
|
|
|
6.3 |
% |
|
Top 10 Markets |
|
|
2,352 |
|
|
|
4.8 |
% |
|
|
1,575 |
|
|
|
2.5 |
% |
|
|
3.9 |
% |
|
|
422 |
|
|
|
3.0 |
% |
|
|
4,349 |
|
|
|
3.8 |
% |
|
Northern California |
|
|
93 |
|
|
|
5.1 |
% |
|
|
47 |
|
|
|
8.5 |
% |
|
|
6.3 |
% |
|
|
16 |
|
|
|
3.0 |
% |
|
|
156 |
|
|
|
5.9 |
% |
|
Charlotte - Raleigh |
|
|
6 |
|
|
|
2.3 |
% |
|
|
13 |
|
|
|
3.4 |
% |
|
|
3.0 |
% |
|
|
- |
|
|
|
0.0 |
% |
|
|
19 |
|
|
|
3.0 |
% |
|
Other Markets |
|
|
56 |
|
|
|
3.6 |
% |
|
|
52 |
|
|
|
-1.2 |
% |
|
|
1.2 |
% |
|
|
14 |
|
|
|
3.0 |
% |
|
|
122 |
|
|
|
1.4 |
% |
|
Total |
|
|
2,507 |
|
|
|
4.8 |
% |
|
|
1,687 |
|
|
|
2.6 |
% |
|
|
3.9 |
% |
|
|
452 |
|
|
|
3.0 |
% |
|
|
4,646 |
|
|
|
3.8 |
% |
|
|
|
|
|
|
|
|
|
|
|
|
|
|
|
|
|
|
|
|
|
|
|
|
|
|
|
|
|
|
|
|
|
|
|
|
|
|
Please see the Appendix at the back of this presentation for certain definitions, explanations and reconciliations of Non-GAAP financial measures. All information is as of March 31, 2016 unless otherwise indicated.
|
(1) |
Represents average rent growth on the population of escalating multi-year leases taking effect for the three months ended March, 31, 2016, defined as average of the percentage change in rental rate for all multi-year leases in the period. |
|
(2) |
Represents weighted average rent growth on all replacement, renewals and escalating multi-year leases for the three months ended March, 31, 2016. |
|
|
|
27 |
Same Store Repairs and Maintenance and Capital Expenditures
Three months ended March 31, 2016
Dollars in thousands, except per home amounts
|
Category |
|
Total Cost |
|
|
Q1 Cost per Home |
|
||
|
Repairs, maintenance and turnover expenses (1) |
|
|
|
|
|
|
|
|
|
Repairs and maintenance |
|
$ |
4,085 |
|
|
$ |
179 |
|
|
Turnover related costs |
|
|
2,681 |
|
|
|
118 |
|
|
Landscaping and pool services |
|
|
749 |
|
|
|
33 |
|
|
Total repairs, maintenance and turnover expenses |
|
$ |
7,515 |
|
|
$ |
330 |
|
|
Recurring capital expenditures (2) (3) |
|
|
|
|
|
|
|
|
|
Repairs and maintenance |
|
$ |
4,962 |
|
|
$ |
218 |
|
|
Turnover related costs |
|
|
2,620 |
|
|
|
115 |
|
|
Total recurring capital expenditures |
|
|
7,582 |
|
|
|
333 |
|
|
Total repairs and maintenance and recurring capital expenditures |
|
$ |
15,097 |
|
|
$ |
663 |
|
|
Revenue enhancing capital expenditures (4) |
|
|
|
|
|
|
|
|
|
Total revenue enhancing capital expenditures |
|
$ |
841 |
|
|
|
|
|
Please see the Appendix at the back of this presentation for certain definitions, explanations and reconciliations of Non-GAAP financial measures. All information is as of March 31, 2016 unless otherwise indicated.
|
(1) |
Net of resident chargebacks. |
|
(2) |
Excludes Initial Renovation and Re-Development expenditures. |
|
(3) |
General replacements and expenditures necessary to preserve and maintain the value and functionality of the home and its systems. |
|
(4) |
Capital improvements and additions intended to increase the revenue potential for a given property. |
|
|
|
28 |
VI. NPL Portfolio
|
|
|
29 |
As of March 31, 2016
Dollars in millions
|
State |
|
Loan Count (1)(2) |
|
|
Total Purchase Price |
|
|
Total UPB |
|
|
Total BPO |
|
|
Purchase Price as % of UPB |
|
|
Purchase Price as % of BPO |
|
|
Weighted Average LTV (3) |
|
|||||||
|
Florida |
|
415 |
|
|
$ |
55.1 |
|
|
$ |
100.9 |
|
|
$ |
98.4 |
|
|
|
54.6 |
% |
|
|
55.9 |
% |
|
|
102.5 |
% |
|
|
Illinois |
|
196 |
|
|
|
27.9 |
|
|
|
44.1 |
|
|
|
43.6 |
|
|
|
63.3 |
% |
|
|
64.1 |
% |
|
|
101.1 |
% |
|
|
California |
|
176 |
|
|
|
56.7 |
|
|
|
76.4 |
|
|
|
94.5 |
|
|
|
74.2 |
% |
|
|
60.0 |
% |
|
|
80.9 |
% |
|
|
New York |
|
176 |
|
|
|
36.5 |
|
|
|
58.1 |
|
|
|
68.9 |
|
|
|
62.9 |
% |
|
|
53.0 |
% |
|
|
84.3 |
% |
|
|
Indiana |
|
120 |
|
|
|
8.6 |
|
|
|
11.6 |
|
|
|
12.2 |
|
|
|
73.9 |
% |
|
|
70.2 |
% |
|
|
95.0 |
% |
|
|
New Jersey |
|
118 |
|
|
|
18.8 |
|
|
|
31.2 |
|
|
|
29.4 |
|
|
|
60.2 |
% |
|
|
63.8 |
% |
|
|
106.1 |
% |
|
|
Maryland |
|
106 |
|
|
|
21.0 |
|
|
|
30.6 |
|
|
|
27.3 |
|
|
|
68.9 |
% |
|
|
76.9 |
% |
|
|
111.7 |
% |
|
|
Wisconsin |
|
104 |
|
|
|
9.8 |
|
|
|
12.9 |
|
|
|
16.1 |
|
|
|
75.4 |
% |
|
|
60.5 |
% |
|
|
80.3 |
% |
|
|
Pennsylvania |
|
71 |
|
|
|
6.7 |
|
|
|
9.6 |
|
|
|
9.9 |
|
|
|
69.6 |
% |
|
|
67.6 |
% |
|
|
97.1 |
% |
|
|
Georgia |
|
53 |
|
|
|
5.3 |
|
|
|
8.4 |
|
|
|
8.4 |
|
|
|
62.8 |
% |
|
|
62.3 |
% |
|
|
99.3 |
% |
|
|
Arizona |
|
51 |
|
|
|
6.7 |
|
|
|
9.8 |
|
|
|
9.4 |
|
|
|
68.7 |
% |
|
|
71.3 |
% |
|
|
103.9 |
% |
|
|
Other |
|
|
722 |
|
|
|
91.7 |
|
|
|
130.7 |
|
|
|
141.0 |
|
|
|
70.1 |
% |
|
|
65.0 |
% |
|
|
92.7 |
% |
|
Total |
|
|
2,308 |
|
|
$ |
344.6 |
|
|
$ |
524.2 |
|
|
$ |
559.1 |
|
|
|
65.7 |
% |
|
|
61.6 |
% |
|
|
93.7 |
% |
|
Status |
|
Loan Count (1) |
|
|
Total Purchase Price |
|
|
Total UPB |
|
|
Total BPO |
|
|
Purchase Price as % of UPB (3) |
|
|
Purchase Price as % of BPO |
|
|
Weighted Average LTV (3) |
|
|||||||
|
Foreclosure |
|
1617 |
|
|
$ |
250.7 |
|
|
$ |
390.8 |
|
|
$ |
402.6 |
|
|
|
64.1 |
% |
|
|
62.3 |
% |
|
|
97.1 |
% |
|
|
Performing |
|
619 |
|
|
|
85.0 |
|
|
|
120.5 |
|
|
|
143.0 |
|
|
|
70.6 |
% |
|
|
59.5 |
% |
|
|
84.2 |
% |
|
|
Delinquent |
|
|
72 |
|
|
|
8.9 |
|
|
|
12.9 |
|
|
|
13.5 |
|
|
|
69.1 |
% |
|
|
65.8 |
% |
|
|
95.2 |
% |
|
Total/Average |
|
|
2,308 |
|
|
$ |
344.6 |
|
|
$ |
524.2 |
|
|
$ |
559.1 |
|
|
|
65.7 |
% |
|
|
61.6 |
% |
|
|
93.7 |
% |
Please see the Appendix at the back of this presentation for certain definitions, explanations and reconciliations of Non-GAAP financial measures. All information is as of March 31, 2016 unless otherwise indicated.
|
(1) |
Represents first liens on 2,252 homes and 56 parcels of land. |
|
(2) |
Excludes 189 unsecured, second, and third liens with an aggregate purchase price of $1.4 million. |
|
(3) |
LTV is based on the ratio of UPB to BPO. |
|
|
|
30 |
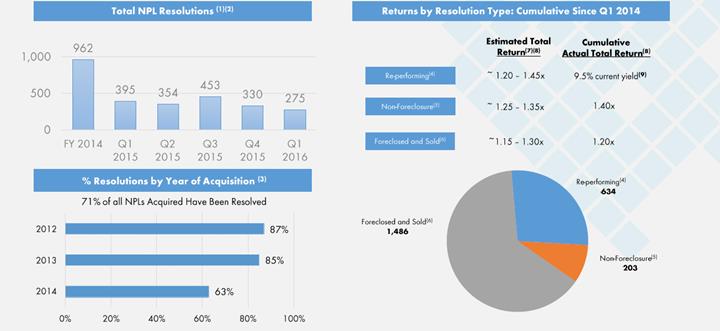
|
(1) |
Does not include repurchases, resolutions initiated prior to closing, or trailing deeds. Resolutions also exclude Q1 2015 bulk sale of 171 loans and one individual loan sale, and Q3 2015 excludes sale of 461 RPLs. |
|
(2) |
Of the 5,758 total NPLs acquired since 2012, 2,494 were resolved during the period Q1 2014 through Q1 2016 which are broken out by quarter in the left graph above. An additional 1,283 NPLs were resolved prior to Q1 2014. |
|
(3) |
A total of 3,735 NPLs, 1,538 NPLs, and 485 NPLs were acquired in 2014, 2013, and 2012, respectively. No NPLs have been acquired since 2014. |
|
(4) |
Defined as NPLs that were either modified or reinstated and were re-performing as of the end of March 31, 2016. All resolutions included in this category have either been sold as RPLs or remain held in our portfolio and were less than 60 days past due as of March 31, 2016. |
|
(5) |
Includes paid-in-full, short payoff, sold notes and short sales. |
|
(6) |
Includes foreclosure auction sales and REO assets (including rental conversions). |
|
(7) |
Estimated return multiples are meant to illustrate an estimated return for a standard NPL resolution of a single asset. Ranges are affected by the equity percentage of each asset as well as other factors. |
|
(8) |
Defined as proceeds (net of selling costs but before conversion costs) divided by purchase price. Conversion costs vary by state but have averaged 10.5% (unlevered) for REO that has been sold. |
|
(9) |
As of March 31, 2016, no re-performing loans had been sold. Yield is defined as principal and interest payment as a percentage of purchase price. |
Please see the Appendix at the back of this presentation for certain definitions, explanations and reconciliations of Non-GAAP financial measures. All information is as of March 31, 2016 unless otherwise indicated.
|
|
|
31 |
VII. Guidance
|
|
|
32 |
Management re-affirms full-year 2016 guidance
|
2016 Guidance (1) |
||
|
|
|
Range |
|
Core FFO/Share |
|
$1.55 - $1.65 |
|
Stabilized Occupancy |
|
94% - 95% |
|
Blended Rent Growth |
|
4% - 5% |
|
Core NOI Margin (Stabilized) |
|
62% - 64% |
|
· |
Core FFO guidance excludes NPL results as Colony Starwood Homes winds-down the business |
|
· |
Management expects to generate $150 - $250MM of net proceeds from NPL loan pool sales and REO sales throughout 2016/2017(2) |
Please see the Appendix at the back of this presentation for certain definitions, explanations and reconciliations of Non-GAAP financial measures. All information is as of March 31, 2016 unless otherwise indicated.
|
(1) |
This outlook is based on a number of assumptions, many of which are outside of the Colony Starwood Homes’ control, and all of which are subject to change. This outlook reflects Colony Starwood Homes’ expectations on (a) existing investments and (b) yield on incremental investments inclusive of Colony Starwood Homes’ existing pipeline. All guidance is based on current expectations of future economic conditions and the judgment of the Colony Starwood Homes’ management team. |
|
(2) |
Net Proceeds after associated debt pay down and carrying costs. |
|
|
|
33 |

VIII. Appendix
|
|
|
34 |
Definitions and Reconciliations
Annualized Turnover Rate. Is calculated by dividing a) the number of homes that become unoccupied during a period of time by b) the number of homes that had completed initial renovation/rehabilitation and were leasable during the specified period, expressed as an annualized percentage by multiplying the period of measurement to reach a 12 month period (e.g., multiplying a three month turnover measurement by four). Management believes this operational measure is useful in understanding tenant satisfaction, pricing effectiveness and assessing associated property repairs and maintenance expenses.
Average Acquisition Cost per Home. Is calculated by dividing a) the total acquisition cost for each home in an identified population (such acquisition costs including purchase price and closing costs, but excluding renovation/rehabilitation costs incurred prior to leasing) by b) the number of homes in the respective population. Total acquisition cost for assets owned by SWAY prior to the Merger includes the purchase accounting fair market value step-up applied to those assets as of the close of Merger on January 5, 2016.
Average Investment. Is calculated by dividing the sum of a) the total acquisition cost for each home in an identified population b) all property related capitalized expenditures incurred in the renovation/rehabilitation of a property prior to leasing by c) the number of homes in the respective population. Total acquisition cost for assets owned by SWAY prior to the Merger includes the purchase accounting fair market value step-up applied to those assets as of the close of Merger on January 5, 2016.
Average Monthly Rent per Occupied Home. Is calculated by dividing a) the aggregate monthly contractual cash rent (excluding rent concessions and incentives) for an identified population of occupied rental units by b) the number of rental units in the identified population. To date, rent concessions and incentives have been utilized on a limited basis and have not had a significant impact on the Colony Starwood Homes portfolio’s average monthly rent.
Blended Rent Growth. Represents the weighted average rent growth on all new leases (replacement leases) and renewals during a measured period, and is calculated by dividing a) the aggregate contractual first month rent on all new leases and lease renewals executed during the three months ended March 31, 2016 for an identified population of occupied rental units by b) the aggregate contractual last month rent for such identified population of rental units before renewal or new lease. This calculation does not include lease escalations / step-ups for multi-year leases.
Core FFO. Core FFO is a non-GAAP financial measure of operating performance that we believe assists investors in assessing the results of the Company’s single family rental business, which is our core operating business. Core FFO adjusts FFO to eliminate the impact of certain items that we believe are not indicative of our core operating performance, including the results of the NPL business, which we intend to exit, as well as certain non-cash items so that period-over-period measurements are more consistent. Our Core FFO begins with NAREIT FFO and is adjusted for revenues and expenses directly related to our NPL business, for amortization of deferred financing costs and debt premium discounts, share-based compensation, loss on derivative financial instruments, amortization of derivative financial instruments, non-cash interest expense, merger and transaction-related expenses. Please see the reconciliation to Net Income/Loss and NAREIT FFO on page 14. Core FFO does not represent cash generated from operating activities determined in accordance with GAAP, and is not necessarily indicative of cash available to fund cash needs and should not be considered as an alternative to net income (determined in accordance with GAAP) as a performance measure.
Core Net Operating Income or Core NOI. We calculate Core NOI by subtracting Core Property Operating Costs from Core Rental Revenue, as defined, which eliminates (a) revenues and expenses that we believe are not directly related to the operating performance of the homes themselves and (b) GAAP presentations of resident chargeback fees and bad debt expense to provide a clearer presentation of rental and fee income streams as well as associated expenses. Please refer to the definition of NOI below for an explanation of how that measure is calculated separate from Core NOI. Core NOI is a non-GAAP measure of operating performance that we believe assists investors in assessing the performance of our portfolio of single family homes, which is our core operating business.
The Core NOI measures included in this presentation should not be considered alternatives to net loss or net cash flows from operating activities, as determined in accordance with GAAP, as indications of our performance or as measures of liquidity. Although we use these non-GAAP measures for comparability in assessing their performance against other REITs, not all REITs compute the same non-GAAP measures. Accordingly, there can be no assurance that our basis for computing these non-GAAP measures are comparable with that of other REITs.
|
|
|
35 |
Definitions and Reconciliations
Core Property Operating Expenses. Is calculated by adjusting operating costs for the properties in the relevant sample by eliminating the impact of resident chargebacks bad debt expense.
Core Rental Revenue. Is calculated by rental and fee income for the properties in the relevant sample adjusted to eliminate the impact of bad debt expense.
Development Homes. Homes that a) are awaiting initial rehabilitation, b) are currently undergoing initial rehabilitation, or c) have completed initial rehabilitation but have not yet been marketed for initial occupancy.
Estimated Net Asset Value or NAV. Estimated NAV is the estimated value of all tangible assets net of liabilities at current fair market values. The Company believes that Estimated NAV provides investors with useful information to facilitate their understanding of the approximate current market value of our real estate assets, and their value in excess of our obligations to third parties, which we do not believe are immediately apparent from our GAAP balance sheet. Since values for well-maintained real estate assets have historically increased or decreased based upon prevailing market conditions as opposed to depreciating over a useful life presumed by GAAP, the Company believes that Estimated NAV enhances investors’ ability to assess the Company’s approximate franchise value and evaluate our balance sheet risk. Estimated NAV is not meant to represent the liquidation value of our assets, and neither Estimated NAV, nor any of the metrics or methodologies described below in its development and calculation should be viewed as a substitute for book value, net investments in real estate, equity, net income or cash flows from operations prepared in accordance with GAAP, or as measures of profitability or liquidity. Estimated NAV does not consider potential changes in the value of the assets since the last date of valuation, the collectability of rents from our tenants or the value associated with our operating platform. Further, not all real estate investment trusts (“REITs”) compute this same non-GAAP measure or valuation methodologies, therefore, there can be no assurance that our basis for computing this non-GAAP measure is comparable with that of other REITs.
We estimate the fair value of our investments in single-family rentals using a progressive method that incorporates three value sources:
|
1) |
automated valuation model values (“AVMs”), |
|
2) |
broker price opinions (“BPOs”) and |
|
3) |
internal desktop evaluations |
AVM values are value estimates provided by service providers based on their proprietary mathematical modeling platforms utilizing historical sales and public records data of comparable homes with adjustments based on characteristics specific to the relevant home being valued. The AVMs we receive are accompanied with a confidence index which provides a measure of perceived reliability of the AVM value. The AVM confidence index is prepared by a third-party AVM service provider and includes a confidence score, which is a statistically based measurement of how similar or dissimilar the results of the third-party AVM service provider’s multiple proprietary valuation models are to each other. We accept AVMs with confidence scores that equate to a statistical error margin of approximately 5% or less. When a home’s AVM confidence index falls below our acceptable score, we will rely on a current BPO, which is a value estimate provided by a local broker based on comparable sales data and adjusted based on characteristics specific to the relevant home being valued. If a current BPO is not available, an internal evaluation is performed by a licensed appraiser using the market approach as defined by the Appraisal Institute to estimate the fair value.
The fair value of investments in NPLs is estimated using the net present values of the BPOs of the underlying homes discounted at a then current market discount rate. The net present values of the BPOs of the underlying homes are determined using estimates of the length of time service providers as adjusted from time to time based on our experience. The fair value of investments in REO properties is based on current BPO values.
The costs of selling properties in the portfolio, including commissions and other related costs are not deducted for the purpose of calculating the Estimated NAV, with the exception of homes held for sale. Further, future promoted interests on the NPL portfolio are not deducted for the purpose of calculating Estimated NAV. We consider Estimated NAV to be an appropriate supplemental measure as it illustrates the estimated imbedded value in our SFR portfolio and NPL and REO portfolio that is carried on our balance sheet at historical cost. The Estimated SFR Value, Estimated NPL and REO Value and Estimated NAV are non-GAAP financial measures. However, they are provided for informational purposes to be used
|
|
|
36 |
Definitions and Reconciliations
by investors in assessing the value of our assets. A reconciliation of total shareholders’ equity to Estimated NAV is provided below.
The use of AVMs in preparing the estimated NAV is subject to certain inherent limitations, including potentially imperfect and/or incomplete information regarding the properties being valued and comparable properties used in the AVM model. SFR, NPL and REO values used in the calculation of estimated NAV are not subject to audit procedures by our independent auditors. These metrics should be considered along with other available information in valuing and assessing us, including our GAAP financial measures and other cash flow and yield metrics.
Estimated Net Asset Value or NAV Continued. These metrics should not be viewed as a substitute for book value, net investments in real estate, equity, net income or cash flows from operations prepared in accordance with GAAP, or as measures of profitability or liquidity. Further, not all real estate investment trusts (“REITs”) compute this same non-GAAP measure, therefore, there can be no assurance that our basis for computing this non-GAAP measure is comparable with that of other REITs.
|
Estimated NAV |
|
|
|
|
|
($ in thousands, except per share data) |
|
|
|
|
|
|
|
|
|
|
|
Total assets |
|
$ |
6,968,345 |
|
|
Add: fair value adjustment of SFR assets |
|
|
1,165,119 |
|
|
Less: deferred financing costs, net |
|
|
(6,083 |
) |
|
Less: deferred leasing costs, net |
|
|
(3,513 |
) |
|
Less: goodwill |
|
|
(264,037 |
) |
|
Total Tangible Assets at FMV |
|
$ |
7,859,831 |
|
|
|
|
|
|
|
|
Total liabilities |
|
$ |
4,241,414 |
|
|
Add: adjust convertible debt to face value |
|
|
60,788 |
|
|
Add: unamortized deferred financing costs |
|
|
36,994 |
|
|
Total liabilities as adjusted |
|
$ |
4,339,196 |
|
|
NAV |
|
$ |
3,520,635 |
|
|
Shares(1) |
|
|
107,887 |
|
|
NAV/Share |
|
$ |
32.63 |
|
|
(1) |
Represents total common shares of 101,486,814 as of April 29th, 2016 plus 6.4 million OP units |
Integration Costs. Costs and charges incurred during the integration of the Starwood Waypoint Residential Trust and Colony American Homes operations in the three months ended March 31, 2016 that are not reflective of our core operating performance and that we do not expect to incur subsequent to the completion of the Merger integration, but which do not qualify for Merger and transaction related expenses under GAAP. The majority of Integration Costs consist of base salaries, benefits, and payroll taxes of employees separated or scheduled for separation as a result of the Merger. Below is a summary of Integration Costs through the three months ended March 31, 2016:
|
Category |
|
Amount (000s) |
|
|
|
Employee related costs |
|
$ |
4,208 |
|
|
Accounting |
|
|
775 |
|
|
Office rents |
|
|
360 |
|
|
IT |
|
|
223 |
|
|
Other |
|
|
64 |
|
|
Total |
|
$ |
5,630 |
|
|
|
|
37 |
Definitions and Reconciliations
Merger and Transaction Related Expenses. Direct costs incurred as a result of the Merger closing or costs required to ensure the Merger was completed successfully. These costs include legal fees, advisory services (accounting, tax, and entity filings), success fees, employee retention plans and severance costs, and property tax / transfer costs. A summary of costs for the three months ended March 31, 2016 is summarized below:
|
Category |
|
Amount (000s) |
|
|
|
Closing and Success Fees |
|
$ |
13,717 |
|
|
Legal |
|
|
4,280 |
|
|
Employee Related Costs |
|
|
4,078 |
|
|
Other |
|
|
1,407 |
|
|
Total |
|
$ |
23,482 |
|
NAREIT FFO. Funds from operations is defined by the National Association of Real Estate Investment Trusts (“NAREIT”) as net income or loss (in accordance with GAAP) excluding gains or losses from sale of previously depreciated real estate assets, plus depreciation and amortization of real estate assets and adjustments for unconsolidated partnerships and joint ventures. See page 14 for reconciliation to Income Statement Net Loss. Consistent with real estate industry and investment community preferences, we use FFO as a supplemental measure of operating performance for a REIT. We consider FFO useful to investors as a complement to GAAP measures because it facilitates an understanding of the operating performance of the Company’s properties. FFO does not give effect to real estate depreciation and amortization since these amounts are computed to allocate the cost of a property over its useful life. Since values for well-maintained real estate assets have historically increased or decreased based upon prevailing market conditions, the Company believes that FFO provides investors with a clearer view of the Company’s operating performance.
Net Operating Income or NOI. We define NOI as rental and other property revenues less property operating expenses. We have presented NOI for various segments of our portfolio, including Same Store Homes, Stabilized Homes, Development Homes, and Other Homes as we believe these NOI measures to be appropriate supplemental measures of operating performance to net income attributable to common shareholders because they reflect the operating performance of our homes without allocation of corporate level overhead or general and administrative costs and reflect the operations of the segments and sub-segments of our business. Refer to the table below for a reconciliation of net loss attributable to common shareholders to NOI. Please refer to the definition of Core NOI above for an explanation of how that measure is calculated separate from NOI.
These NOI measures included in this presentation should not be considered alternatives to net loss or net cash flows from operating activities, as determined in accordance with GAAP, as indications of our performance or as measures of liquidity. Although we use these non-GAAP measures for comparability in assessing their performance against other REITs, not all REITs compute the same non-GAAP measures. Accordingly, there can be no assurance that our basis for computing these non-GAAP measures are comparable with that of other REITs.
|
|
|
38 |
Definitions and Reconciliations
|
|
|
Three months ended March 31, 2016 |
|
|||||
|
(Dollars in thousands) |
|
Same Store Homes |
|
|
Stabilized Homes (2) |
|
||
|
Reconciliation of net loss to NOI |
|
|
|
|
|
|
|
|
|
Net loss available to Colony Starwood Homes shareholders |
|
$ |
(44,199 |
) |
|
$ |
(44,199 |
) |
|
|
|
|
|
|
|
|
|
|
|
Add (deduct) adjustments to get to total NOI |
|
|
|
|
|
|
|
|
|
Expense on non-performing loans, net |
|
|
8,598 |
|
|
|
8,598 |
|
|
General and administrative |
|
|
17,338 |
|
|
|
17,338 |
|
|
Share-based compensation |
|
|
387 |
|
|
|
387 |
|
|
Interest expense |
|
|
39,360 |
|
|
|
39,360 |
|
|
Depreciation and amortization |
|
|
43,630 |
|
|
|
43,630 |
|
|
Transaction-related expense |
|
|
23,482 |
|
|
|
23,482 |
|
|
Impairment of real estate |
|
|
30 |
|
|
|
30 |
|
|
Realized (gain) loss on sales of investments in real estate, net |
|
|
(1,384 |
) |
|
|
(1,384 |
) |
|
Equity in income from unconsolidated joint ventures |
|
|
(197 |
) |
|
|
(197 |
) |
|
Other (expense) income, net |
|
|
395 |
|
|
|
395 |
|
|
Income tax expense |
|
|
245 |
|
|
|
245 |
|
|
Net income attributable to non-controlling interests |
|
|
(2,850 |
) |
|
|
(2,850 |
) |
|
Total NOI |
|
|
84,835 |
|
|
|
84,835 |
|
|
Add (deduct) adjustments to get to total same store portfolio NOI |
|
|
|
|
|
|
|
|
|
Property management integration costs (1) |
|
|
1,259 |
|
|
|
1,259 |
|
|
Non-same store portfolio NOI components: |
|
|
|
|
|
|
|
|
|
Property operating revenues on non-same store homes (1) |
|
|
(39,411 |
) |
|
|
(3,428 |
) |
|
Property operating expenses on non-same store homes (1) |
|
|
16,077 |
|
|
|
2,908 |
|
|
Add Total Non-stabilized portfolio NOI |
|
|
(23,334 |
) |
|
|
(520 |
) |
|
|
|
|
|
|
|
|
|
|
|
Total same store portfolio NOI |
|
$ |
62,760 |
|
|
$ |
85,574 |
|
|
|
|
|
|
|
|
|
|
|
|
Calculation of same store portfolio NOI margin: |
|
|
|
|
|
|
|
|
|
Rental income |
|
$ |
95,532 |
|
|
$ |
129,990 |
|
|
Fee income |
|
|
1,991 |
|
|
|
2,739 |
|
|
Less bad debt expense |
|
|
(1,650 |
) |
|
|
(2,195 |
) |
|
Total rental revenues |
|
$ |
95,873 |
|
|
$ |
130,534 |
|
|
Same store portfolio NOI margin |
|
|
65.5 |
% |
|
|
65.6 |
% |
|
|
|
|
|
|
|
|
|
|
|
(1) See Income Statement Bridge page |
|
|||||||
|
(2) Stabilized is the summation of Same Store Homes and Stabilized Homes as defined in the Appendix. |
|
|||||||
|
|
|
|
|
|
|
|
|
|
Non-Owned, Managed Homes. Colony Starwood Homes currently provides its property and asset management services to third parties and/or joint venture partners as a fee service. The non-owned properties are all managed within the same platform from which Colony Starwood Homes services its Owned homes.
Occupancy %. Is calculated by dividing a) the number of occupied homes as of the last day of the period by b) the comparative home set (Same Store, Stabilized, Owned, etc.).
|
|
|
39 |
Definitions and Reconciliations
|
Description |
|
Amount (000s) |
|
|
|
Fannie Mae joint venture |
|
$ |
35,380 |
|
|
Accounts receivable, net of allowance |
|
|
24,201 |
|
|
Prepaids |
|
|
17,120 |
|
|
Deferred finance costs, net |
|
|
6,083 |
|
|
Deposits |
|
|
4,477 |
|
|
Deferred leasing costs and lease intangibles, net |
|
|
3,513 |
|
|
Related-party receivable |
|
|
238 |
|
|
Other |
|
|
9,902 |
|
|
Total |
|
$ |
100,914 |
|
Other Homes. Includes 609 Owned Homes as of March 31, 2016 that were not intended to be held for the long-term and not in service. The 609 Other Homes excludes the 738 REO homes held as of March 31, 2016.
Other Markets.
|
|
|
|
|
|
|
|
|
|
|
|
|
|
|
|
|
|
|
|
|
|
|
|
Market: |
|
Same-Store Homes |
|
|
Stabilized Homes |
|
|
Development Homes |
|
|
Other Homes |
|
|
Owned Homes (1) |
|
|
|||||
|
Chicago |
|
|
406 |
|
|
|
362 |
|
|
|
11 |
|
|
|
16 |
|
|
|
795 |
|
|
|
Other (2) |
|
|
197 |
|
|
|
7 |
|
|
|
— |
|
|
|
16 |
|
|
|
220 |
|
|
|
Total |
|
|
603 |
|
|
|
369 |
|
|
|
11 |
|
|
|
32 |
|
|
|
1,015 |
|
|
|
|
|
|
|
|
|
|
|
|
|
|
|
|
|
|
|
|
|
|
|
|
|
|
(1) |
Excludes REO properties. |
|
(2) |
Other Market includes Tucson, Delaware, Pennsylvania, New York, Maryland and Central Texas markets. |
Owned Homes. Represents wholly-owned single family rental properties, and is measured by the number of total rental units. This takes into account investments in multi-unit properties which Management believes provides a more meaningful measure to investors. Owned Homes excludes the 738 REO homes held as of March 31, 2016.
Recurring Capital Expenditures. General replacements and expenditures required to preserve and maintain the value and functionality of a home and its systems as a single family rental.
Renewal Rate. Is calculated by dividing a) the number of renewed residents with current period lease expirations by b) the total lease expirations during the period.
Renewal Rent Growth. Is calculated as the percentage change in monthly contractual rent for all lease renewals during the period.
Replacement Rent Growth. Is calculated as the percentage of rent growth from the new lease rate (new resident) relative to the prior lease rate (prior resident) on the population of replacement leases occurring during the period.
Retention Rate. Is calculated by dividing a) the number of retained residents with current period lease expirations by b) the total lease expirations during the period.
Revenue Enhancing Capital Expenditures. Capital improvements and additions intended to increase the revenue potential for a given property.
Same Store Homes. Homes which have been stabilized for at least fifteen (15) months prior to the start of the current measurement period, excluding any homes that have been disposed of, removed from service or returned to the development period for significant renovation.
|
|
|
40 |
Definitions and Reconciliations
Stabilized Homes. Homes that are currently occupied or have been previously leased and occupied that do not meet the criteria to be a Same Store Home. For the three months ended March 31, 2016 the Stabilized Home count excludes 609 homes not intended to be held for the long term.
Top 10 Markets. Refers to Colony Starwood Homes ten markets with the greatest number of homes as of March 31, 2016.
Total Homes. Includes both Owned Homes and Non-Owned, Managed Homes. Represents all homes Colony Starwood Homes manages.
Total Rent Growth. Represents the weighted average rent growth on replacement rents, renewals, and escalating multi-year leases for the period.
UPB. Unpaid principal balance.
Weighted Average Home Age (years). Rounded number of years between when a home was built and the last day of the current measurement period with each market being weighted by its area asset count.
Weighted Average Shares:
|
Description |
|
Number of Shares |
|
|
|
Weighted-average shares - basic and diluted |
|
|
102,066,754 |
|
|
OP units |
|
|
6,400,000 |
|
|
Total |
|
|
108,466,754 |
|
|
|
|
41 |