Attached files
| file | filename |
|---|---|
| 8-K - 8-K - ARMSTRONG WORLD INDUSTRIES INC | d176079d8k.htm |
| EX-99.1 - EX-99.1 - ARMSTRONG WORLD INDUSTRIES INC | d176079dex991.htm |
 Earnings Call Presentation 1 st Quarter 2016 May 9, 2016 Exhibit 99.2 |
 2 Our disclosures in this presentation, including without limitation, those relating to future financial results
guidance and the separation of our flooring business from our building products
business, and in our other public documents and comments contain
forward-looking statements within the meaning of the Private
Securities Litigation Reform Act. Those statements provide our future
expectations or forecasts and can be identified by our use of words such
as "anticipate," "estimate," "expect," "project," "intend," "plan," "believe," "outlook," "target," "predict," "may," "will," "would," "could," "should,"
"seek," and other words or phrases of similar meaning in
connection with any discussion of future operating or financial performance or the separation of our businesses. Forward-looking statements, by their nature, address matters that are
uncertain and involve risks because they relate to events and depend on circumstances
that may or may not occur in the future. As a result, our actual
results may differ materially from our expected results and from those
expressed in our forward-looking statements. A more detailed discussion of the risks and uncertainties that may affect our ability to achieve the projected performance is included in the “Risk Factors” and
“Management’s Discussion and Analysis” sections of our reports on Forms
10-K and 10-Q filed with the SEC. Forward-looking statements
speak only as of the date they are made. We undertake no obligation to update any forward-looking statements beyond what is required under applicable securities law.
In addition, we will be referring to non-GAAP financial measures within the meaning
of SEC Regulation G. A reconciliation of the differences
between these measures with the most directly comparable financial
measures calculated in accordance with GAAP are included within this presentation and
available on the Investor Relations page of our website at
www.armstrongceilings.com. The guidance in this presentation is only effective as of the date given, May 9, 2016, and will not be updated
or affirmed unless and until we publicly announce updated or affirmed guidance.
Safe Harbor Statement |
 3 All figures throughout the presentation are in $ millions unless otherwise noted. Figures may not add due to rounding.
When reporting our financial results within this presentation, we make
several adjustments. Management uses the non-GAAP measures below in
managing the business and believes the adjustments provide meaningful
comparisons of operating performance between periods. As reported
results will be footnoted throughout the presentation.
Basis of Presentation Explanation
• We report in comparable dollars to remove the effects of currency translation on the P&L. The budgeted exchange rate for 2016 is used for all currency translations in 2016 and prior years. Guidance is presented using the 2016 budgeted exchange rate for the year. • We remove the impact of discrete expenses and income. Examples include plant closures, restructuring actions, separation costs and other large unusual items. We also remove the non-cash impact of our U.S. Pension Plan. • Taxes for normalized Net Income and EPS are calculated using a constant 39% for 2016 guidance, and 2016 and 2015 results, which are based on the expected full year historical tax rate. • Results for the ceilings business on slides 6 and 7 have been adjusted to reflect the allocation of corporate costs to the business in preparation of the separation. Corporate costs of $17M were allocated to the ceilings business in 2016; 70% to SG&A, 30% to COGS and held constant in 2015 for comparability purposes What Items Are Adjusted Comparable Dollars Other Adjustments Net Sales Yes No Gross Profit Yes Yes SG&A Expense Yes Yes Equity Earnings Yes Yes Operating Income Yes Yes Net Income Yes Yes Cash Flow No Yes Return on Capital Yes Yes EBITDA Yes Yes |
 4 Consolidated Company Key Metrics - First Quarter 2016 2016 2015 Variance Net Sales (1) $577 $545 5.8% EBITDA 81 72 12.5% % of Sales 14.1% 13.3% 90 bps Earnings Per Share (2) $0.47 $0.35 34.1% Free Cash Flow (75) (42) (78.4%) Net Debt 828 903 (75) (1) As reported Net Sales: $572 million in 2016 and $551 million in 2015 (2) As reported EPS: ($0.21) in 2016 and $0.07 in 2015 (7) 4 (2) 14 6% 18% 1% (20%) (15%) (10%) (5%) 0% 5% 10% 15% 20% (20) (15) (10) (5) - 5 10 15 20 Resilient Flooring Wood Flooring Building Products Corporate EBITDA Change (Left-hand scale) % Change in Sales (Right-hand scale) |
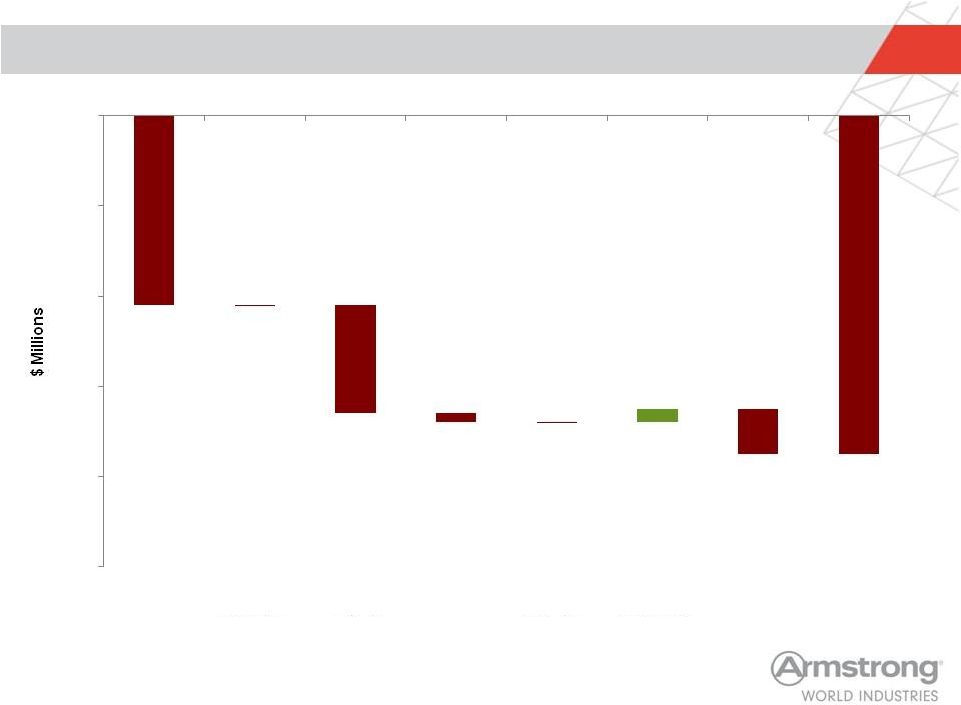 5 Consolidated Free Cash Flow – First Quarter 2016 vs. Prior Year $0 ($24) ($2) $0 ($10) ($75) ($42) ($100) ($80) ($60) ($40) ($20) $0 2015 Cash Earnings Working Capital Capex Interest Expense WAVE Dividends Other 2016 $3 |
 6 Building Products Key Metrics – First Quarter 2016 2016 2015* Variance Net Sales (1) $292 $288 1.2% Operating Income (2) 54 46 18.1% % of Sales 18.6% 15.9% 270 bps EBITDA 73 65 13.2% % of Sales 25.1% 22.4% 270 bps (1) As reported Net Sales: $287 million in 2016 and $292 million in 2015 (2) As reported Operating Income: $51 million in 2016 and $60 million in 2015 * Corporate costs of $17 million were allocated to the ceilings business in 2016 in preparation of the separation; 70% to SG&A, 30% to COGS
including $3
million of depreciation and held constant in 2015 for comparability
purposes 2016
2015* V EBITDA – Adjusted $73 $65 $8 Depreciation and Amortization (19) (19) - Operating Income – Adjusted $54 $46 $8 Non-cash Impact of U.S. Pension 3 3 - Corporate allocations - (17) 17 Operating Income – As Reported $51 $60 ($9) |
 7 • Excluding the unfavorable impact of foreign exchange of $8 million, net sales increased 1% as volume declines in EMEA and the Pacific Rim were offset by mid single digit volume growth in the Americas and continued improvement in average unit value. • Driven by unfavorable country mix in EMEA, volume strength at the low end of the product portfolio in the Americas and the one-time impact from the release of merchandising funds associated with a large retail customer • Strong volume growth in the Americas was offset by lower volumes in EMEA and the Pacific Rim • Driven by lower input costs and productivity • Prudent SG&A spending and prior cost reduction actions in international regions aided margins • WAVE delivered a record earnings quarter Building Products First Quarter Results Margins improved 270 bps driven by continued expansion in Americas margins Key Highlights Q1 2015 Adjusted EBITDA* $ 65M AUV (6) Volume 1 Manufacturing & Input Costs 5 SG&A 3 WAVE 5 Q1 2016 Adjusted EBITDA $ 73M * Corporate costs of $17M were allocated to the ceilings business in 2016 in preparation of the separation; 70% to SG&A, 30% to COGS
including $3M of depreciation and held constant in 2015 for comparability
purposes $201
$190 $63 $69 $28 $29 Q1 2016 Q1 2015 Net Sales Americas EMEA Pacific Rim $292 $288 |
 2016E
Guidance - Reaffirmed
$2.15 – $2.32 6% – 15% YoY Growth $2.09 $2.02 Adjusted EBITDA (2) Adjusted EPS (3) Free Cash Flow Revenue (1) 1% – 3% North America volume growth 2% – 4% International volume growth 1% – 3% average unit value increase $42 million of standalone corporate costs 1% – 2% cost savings over inflation Increased sales and marketing investments to expand total solutions selling capabilities $30 – $35 million of interest expense Normalized 39% effective tax rate 57 million average diluted shares outstanding Cash tax rate 35% – 39% $190 million cash flow from operations $100 million of total capital expenditures 2015 Normalized at 2015 FX $1,285 $303 2015 Normalized at 2016 FX $1,224 $296 $1,260 – $1,310 3% – 7% YoY Growth $310 – $330 5% – 12% YoY Growth $80 – $100 2016E Normalized at 2016 FX $86 (4) $86 (4) 8 (1) As-reported revenue of $1,231 million in 2015. 2016 As-reported will have (3%) - (5%) FX headwind (2) Includes pro forma standalone corporate expense of $42 million; excludes pension, separation costs and other extraordinary expenses (3) Excludes pension, separation costs and other extraordinary expenses. As reported earnings per share of $1.15 - $1.30 impacted by $34
million of separation expenses and an as reported effective tax rate of
~60% (4) No FX adjustment. Pro forma standalone free cash flow for AWI in 2015, excludes separation costs and other extraordinary expenses Note: Dollars in millions except per share values
|
 9 Appendix |
 10 First Quarter 2016 vs. PY – Adjusted EBITDA to Reported Net Income 2016 2015 V EBITDA – Adjusted $81 $72 $9 Depreciation and Amortization (30) (28) (2) Operating Income – Adjusted $51 $44 $7 Non-cash Impact of U.S. Pension 5 6 (1) Separation Expenses 27 4 23 Cost Reduction Initiatives - (2) 2 Foreign Exchange Movements 1 - 1 Operating Income – As Reported $18 $36 ($18) Interest/Other (Expense) (18) (12) (6) EBT ($0) $24 ($24) Tax (Expense) (12) (20) 8 Net (Loss) Income ($12) $4 ($16) |
 11 Consolidated Results First Quarter 2016 Reported Comparability (1) Adjustments FX (2) Adj 2016 Adjusted 2015 Reported Comparability (1) Adjustments FX (2) Adj 2015 Adjusted Net Sales 572 - 5 577 551 - (6) 545 Operating Income 18 32 1 51 36 8 - 44 EPS ($0.21) $0.67 $0.01 $0.47 $0.07 $0.28 $- $0.35 (1) See earnings press release and 10-Q for additional detail on comparability adjustments
(2) Eliminates impact of foreign exchange movements |
 12 Segment Operating Income (Loss) First Quarter 2016 Reported Comparability (1) Adjustments 2016 Adjusted 2015 Reported Comparability (1) Adjustments 2015 Adjusted Building Products 51 3 54 60 (1) 59 Resilient Flooring (5) 1 (4) 6 (2) 4 Wood Flooring 1 1 2 (1) (1) (2) Unallocated Corporate (Expense) Income (28) 27 (1) (29) 12 (17) (1) Eliminates impact of foreign exchange movements and non-recurring items; see earnings press release and 10-Q for additional
detail. |
 13 Cash Flow First Quarter ($ millions) 2016 2015 Net cash (used for) operations ($65) ($34) Net cash (used for) investing (10) (8) Free Cash Flow ($75) ($42) |