Attached files
| file | filename |
|---|---|
| 8-K - CURRENT REPORT - PNMAC Holdings, Inc. | pfsi_8k.htm |
| EX-99.1 - PRESS RELEASE - PNMAC Holdings, Inc. | pfsi_8k-ex9901.htm |
Exhibit 99.2

First Quarter 2016 Earnings Report
Forward - Looking Statements 2 This presentation contains forward - looking statements within the meaning of Section 21 E of the Securities Exchange Act of 1934 , as amended, regarding management’s beliefs, estimates, projections and assumptions with respect to, among other things, the Company’s financial results, future operations, business plans and investment strategies, as well as industry and market conditions, all of which are subject to change . Words like “believe,” “expect,” “anticipate,” “promise,” “plan,” and other expressions or words of similar meanings, as well as future or conditional verbs such as “will,” “would,” “should,” “could,” or “may” are generally intended to identify forward - looking statements . Actual results and operations for any future period may vary materially from those projected herein, from past results discussed herein, or from illustrative examples provided herein . Factors which could cause actual results to differ materially from historical results or those anticipated include, but are not limited to : changes in federal, state and local laws and regulations applicable to the highly regulated industry in which we operate ; lawsuits or governmental actions if we do not comply with the laws and regulations applicable to our businesses ; the creation of the Consumer Financial Protection Bureau, or CFPB, and enforcement of its rules ; changes in existing U . S . government - sponsored entities, their current roles or their guarantees or guidelines ; changes to government mortgage modification programs ; the licensing and operational requirements of states and other jurisdictions applicable to our businesses, to which our bank competitors are not subject ; foreclosure delays and changes in foreclosure practices ; certain banking regulations that may limit our business activities ; changes in macroeconomic and U . S . residential real estate market conditions ; difficulties in growing loan production volume ; changes in prevailing interest rates ; increases in loan delinquencies and defaults ; our reliance on PennyMac Mortgage Investment Trust as a significant source of financing for, and revenue related to, our correspondent lending business and purchased mortgage servicing rights ; availability of required additional capital and liquidity to support business growth ; our obligation to indemnify third - party purchasers or repurchase loans that we originate, acquire or assist in with fulfillment ; our obligation to indemnify advised entities or investment funds to meet certain criteria or characteristics or under other circumstances ; decreases in the historical returns on the assets that we select and manage for our clients, and our resulting management and incentive fees ; regulation applicable to our investment management segment ; conflicts of interest in allocating our services and investment opportunities among ourselves and our advised entities ; the potential damage to our reputation and adverse impact to our business resulting from ongoing negative publicity ; and our rapid growth . You should not place undue reliance on any forward - looking statement and should consider all of the uncertainties and risks described above, as well as those more fully discussed in reports and other documents filed by the Company with the Securities and Exchange Commission from time to time . The Company undertakes no obligation to publicly update or revise any forward - looking statements or any other information contained herein, and the statements made in this presentation are current as of the date of this presentation only .
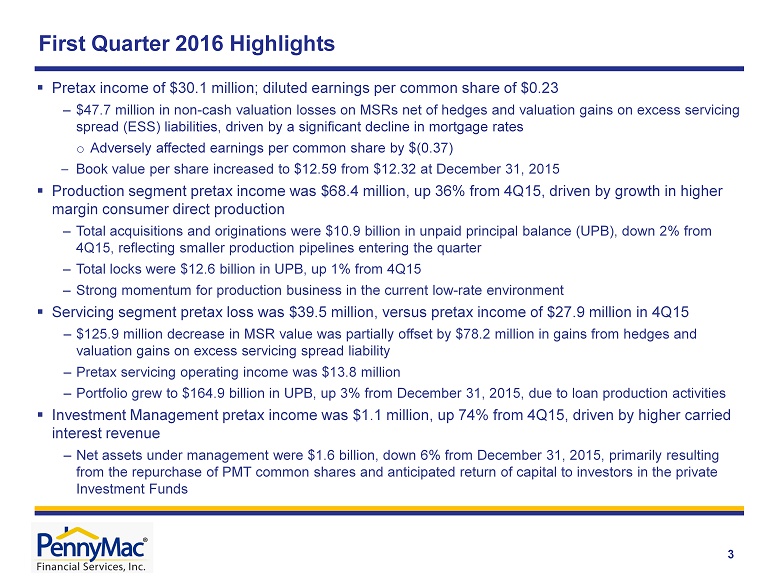
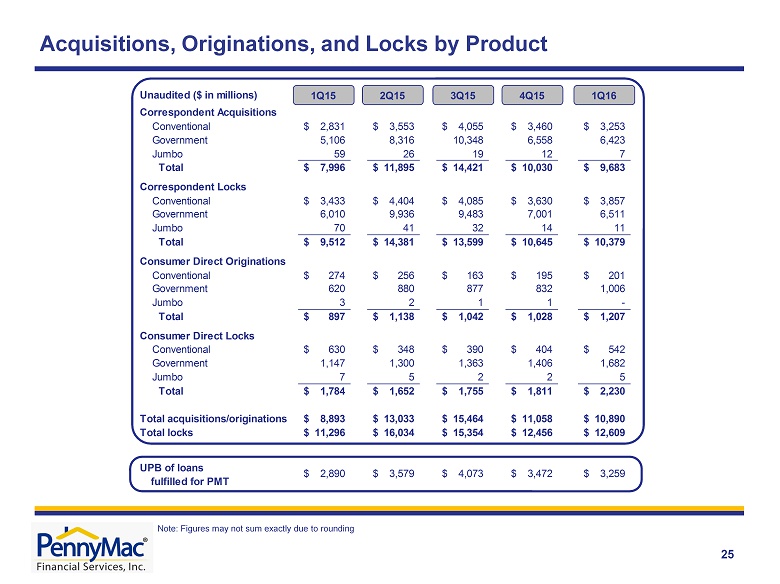
First Quarter 2016 Highlights 3 ▪ Pretax income of $30.1 million ; diluted earnings per common share of $0.23 – $ 47.7 million in non - cash valuation losses on MSRs net of hedges and valuation gains on excess servicing spread (ESS) liabilities, driven by a significant decline in mortgage rates o Adversely affected earnings per common share by $(0.37) – Book value per share increased to $12.59 from $ 12.32 at December 31, 2015 ▪ Production segment pretax income was $68.4 million, up 36% from 4Q15, driven by growth in higher margin consumer direct production – Total acquisitions and originations were $10.9 billion in unpaid principal balance (UPB), down 2% from 4Q15, reflecting smaller production pipelines entering the quarter – Total locks were $12.6 billion in UPB, up 1% from 4Q15 – Strong momentum for production business in the current low - rate environment ▪ Servicing segment pretax loss was $39.5 million, versus pretax income of $27.9 million in 4Q15 – $125.9 million decrease in MSR value was partially offset by $78.2 million in gains from hedges and valuation gains on excess servicing spread liability – Pretax servicing operating income was $13.8 million – Portfolio grew to $ 164.9 billion in UPB, up 3% from December 31, 2015, due to loan production activities ▪ Investment Management pretax income was $1.1 million, up 74% from 4Q15, driven by higher carried interest revenue – Net assets under management were $1.6 billion, down 6% from December 31, 2015, primarily resulting from the repurchase of PMT common shares and anticipated return of capital to investors in the private Investment Funds
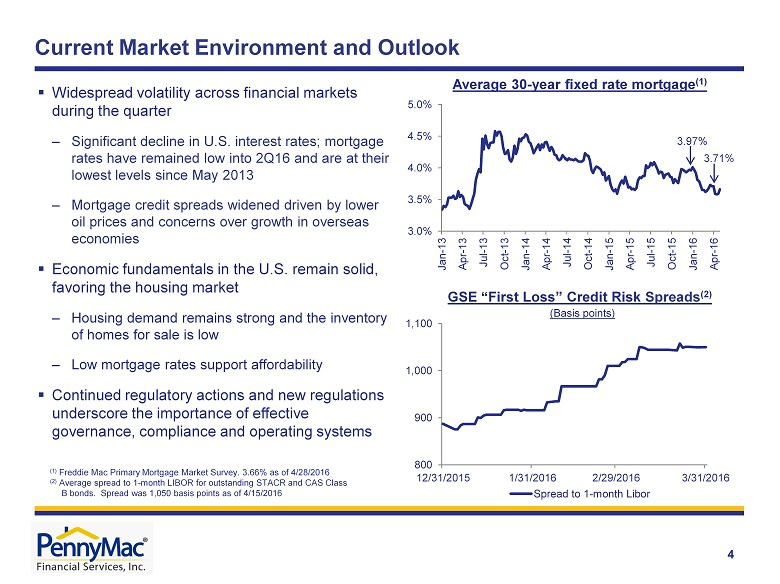
Current Market Environment and Outlook 4 3.0% 3.5% 4.0% 4.5% 5.0% Jan - 13 Apr - 13 Jul - 13 Oct - 13 Jan - 14 Apr - 14 Jul - 14 Oct - 14 Jan - 15 Apr - 15 Jul - 15 Oct - 15 Jan - 16 Apr - 16 Average 30 - year fixed rate mortgage (1) GSE “First Loss” Credit Risk Spreads (2) ▪ Widespread volatility across financial markets during the quarter – Significant decline in U.S. interest rates; mortgage rates have remained low into 2Q16 and are at their lowest levels since May 2013 – Mortgage credit spreads widened driven by lower oil prices and concerns over growth in overseas economies ▪ Economic fundamentals in the U.S. remain solid, favoring the housing market – Housing demand remains strong and the inventory of homes for sale is low – Low mortgage rates support affordability ▪ Continued regulatory actions and new regulations underscore the importance of effective governance, compliance and operating systems 3.97% 3.71% (1) Freddie Mac Primary Mortgage Market Survey. 3.66% as of 4/28/2016 (2) Average spread to 1 - month LIBOR for outstanding STACR and CAS Class B bonds. Spread was 1,050 basis points as of 4/15/2016 (Basis points) 800 900 1,000 1,100 12/31/2015 1/31/2016 2/29/2016 3/31/2016 Spread to 1 - month Libor
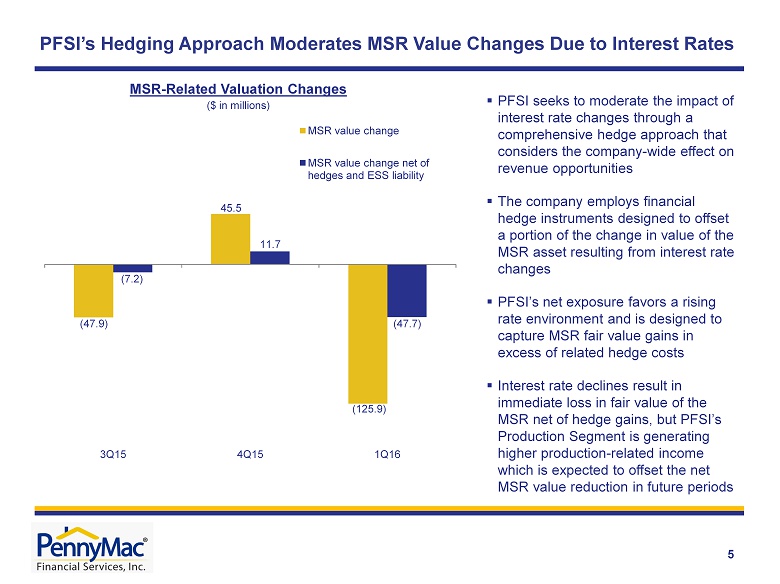
PFSI’s Hedging Approach Moderates MSR Value Changes Due to Interest Rates 5 (47.9) 45.5 (125.9) (7.2) 11.7 (47.7) 3Q15 4Q15 1Q16 MSR value change MSR value change net of hedges and ESS liability ($ in millions) ▪ PFSI seeks to moderate the impact of interest rate changes through a comprehensive hedge approach that considers the company - wide effect on revenue opportunities ▪ The company employs financial hedge instruments designed to offset a portion of the change in value of the MSR asset resulting from interest rate changes ▪ PFSI’s net exposure favors a rising rate environment and is designed to capture MSR fair value gains in excess of related hedge costs ▪ Interest rate declines result in immediate loss in fair value of the MSR net of hedge gains, but PFSI’s Production Segment is generating higher production - related income which is expected to offset the net MSR value reduction in future periods MSR - Related Valuation Changes
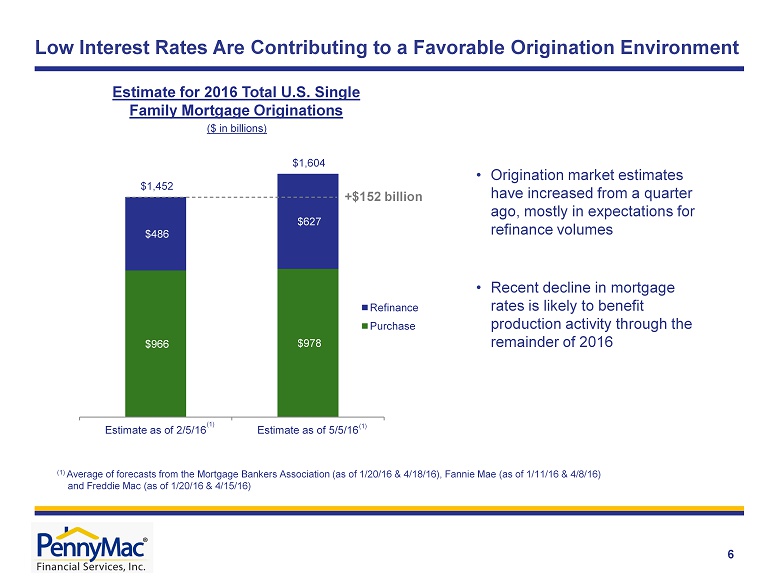
$966 $978 $486 $627 $1,452 $1,604 Estimate as of 2/5/16 Estimate as of 5/5/16 Refinance Purchase Low Interest Rates Are Contributing to a Favorable Origination Environment 6 (1) Estimate for 2016 Total U.S. Single Family Mortgage Originations • Origination market estimates have increased from a quarter ago, mostly in expectations for refinance volumes • Recent decline in mortgage rates is likely to benefit production activity through the remainder of 2016 ($ in billions) +$152 billion (1) Average of forecasts from the Mortgage Bankers Association (as of 1/20/16 & 4/18/16), Fannie Mae (as of 1/11/16 & 4/8/16) and Freddie Mac (as of 1/20/16 & 4/15/16) (1)
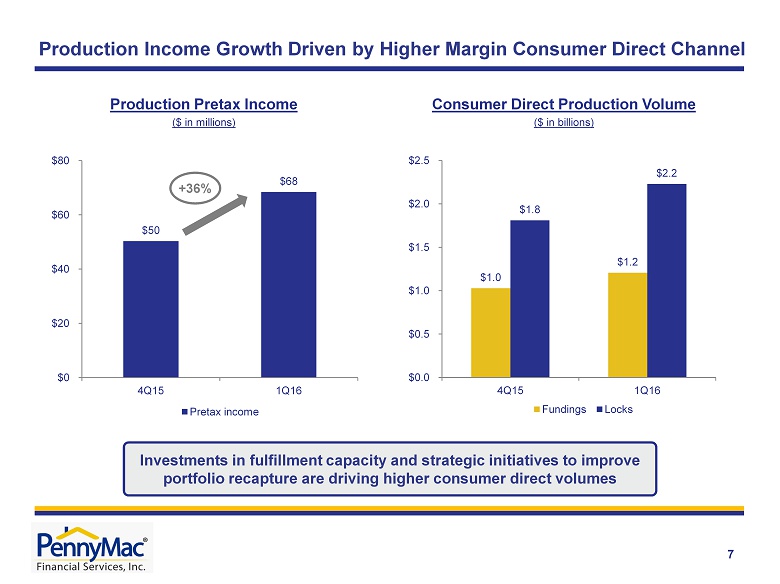
Production Income Growth Driven by Higher Margin Consumer Direct Channel 7 Consumer Direct Production Volume Production Pretax Income $ 1.0 $ 1.2 $ 1.8 $ 2.2 $0.0 $0.5 $1.0 $1.5 $2.0 $2.5 4Q15 1Q16 Fundings Locks ($ in billions) $50 $68 $0 $20 $40 $60 $80 4Q15 1Q16 Pretax income ($ in millions) +36% Investments in fulfillment capacity and strategic initiatives to improve portfolio recapture are driving higher consumer direct volumes
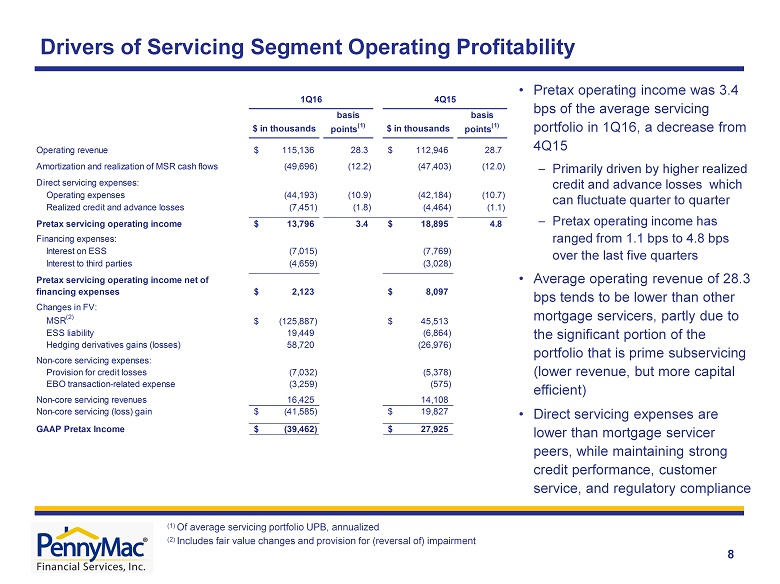
Drivers of Servicing Segment Operating Profitability 8 (1) Of average servicing portfolio UPB, annualized (2) Includes fair value changes and provision for (reversal of) impairment • Pretax operating income was 3.4 bps of the average servicing portfolio in 1Q16, a decrease from 4Q15 – Primarily driven by higher realized credit and advance losses which can fluctuate quarter to quarter – Pretax operating income has ranged from 1.1 bps to 4.8 bps over the last five quarters • Average operating revenue of 28.3 bps tends to be lower than other mortgage servicers, partly due to the significant portion of the portfolio that is prime subservicing (lower revenue, but more capital efficient) • Direct servicing expenses are lower than mortgage servicer peers, while maintaining strong credit performance, customer service, and regulatory compliance $ in thousands basis points (1) $ in thousands basis points (1) Operating revenue 115,136$ 28.3 112,946$ 28.7 Amortization and realization of MSR cash flows (49,696) (12.2) (47,403) (12.0) Direct servicing expenses: Operating expenses (44,193) (10.9) (42,184) (10.7) Realized credit and advance losses (7,451) (1.8) (4,464) (1.1) Pretax servicing operating income 13,796$ 3.4 18,895$ 4.8 Financing expenses: Interest on ESS (7,015) (7,769) Interest to third parties (4,659) (3,028) Pretax servicing operating income net of financing expenses 2,123$ 8,097$ Changes in FV: MSR (2) (125,887)$ 45,513$ ESS liability 19,449 (6,864) Hedging derivatives gains (losses) 58,720 (26,976) Non-core servicing expenses: Provision for credit losses (7,032) (5,378) EBO transaction-related expense (3,259) (575) Non-core servicing revenues 16,425 14,108 Non-core servicing (loss) gain (41,585)$ 19,827$ GAAP Pretax Income (39,462)$ 27,925$ 4Q151Q16
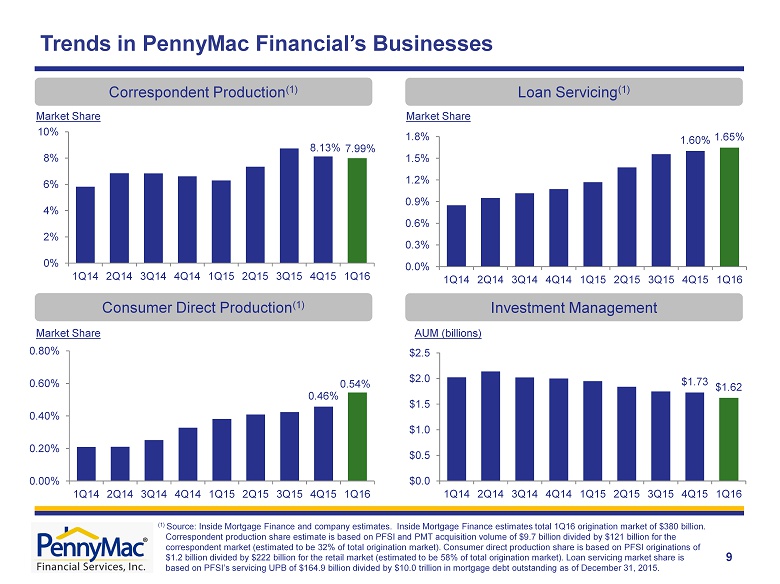
8.13% 7.99% 0% 2% 4% 6% 8% 10% 1Q14 2Q14 3Q14 4Q14 1Q15 2Q15 3Q15 4Q15 1Q16 Trends in PennyMac Financial’s Businesses Correspondent Production (1) Market Share 0.46% 0.54% 0.00% 0.20% 0.40% 0.60% 0.80% 1Q14 2Q14 3Q14 4Q14 1Q15 2Q15 3Q15 4Q15 1Q16 Market Share Consumer Direct Production (1 ) $1.73 $1.62 $0.0 $0.5 $1.0 $1.5 $2.0 $2.5 1Q14 2Q14 3Q14 4Q14 1Q15 2Q15 3Q15 4Q15 1Q16 1.60% 1.65% 0.0% 0.3% 0.6% 0.9% 1.2% 1.5% 1.8% 1Q14 2Q14 3Q14 4Q14 1Q15 2Q15 3Q15 4Q15 1Q16 Loan Servicing (1) Market Share Investment Management AUM (billions) 9 (1) Source : Inside Mortgage Finance and company estimates. Inside Mortgage Finance estimates total 1Q16 origination market of $380 billion. Correspondent production share estimate is based on PFSI and PMT acquisition volume of $9.7 billion divided by $121 billion f or the correspondent market (estimated to be 32% of total origination market). Consumer direct production share is based on PFSI originations of $1.2 billion divided by $222 billion for the retail market (estimated to be 58% of total origination market). Loan servicing mar ket share is based on PFSI’s servicing UPB of $164.9 billion divided by $10.0 trillion in mortgage debt outstanding as of December 31, 201 5.
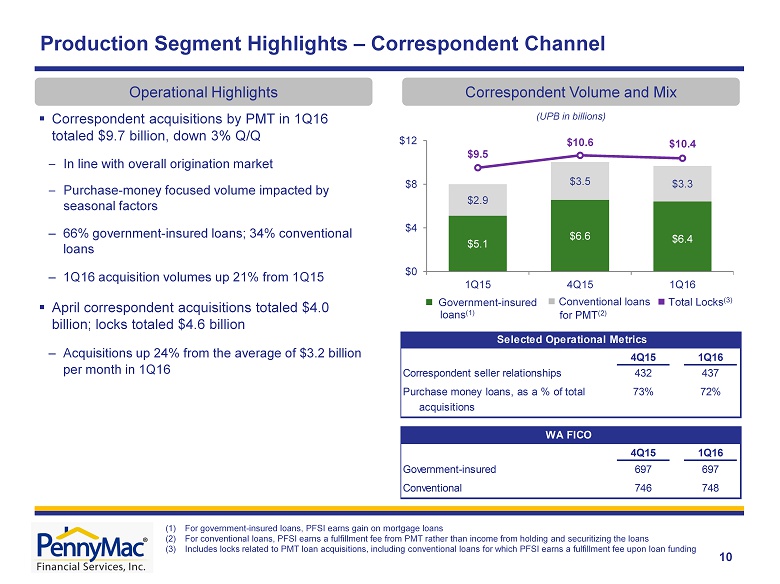
10 (UPB in billions) Production Segment Highlights – Correspondent Channel (1) For government - insured loans, PFSI earns gain on mortgage loans (2) For conventional loans, PFSI earns a fulfillment fee from PMT rather than income from holding and securitizing the loans (3) Includes locks related to PMT loan acquisitions, including conventional loans for which PFSI earns a fulfillment fee upon loa n f unding Correspondent Volume and Mix Operational Highlights Ŷ Government - insured loans (1) ▪ Correspondent acquisitions by PMT in 1Q16 totaled $9.7 billion, down 3% Q/Q – In line with overall origination market – Purchase - money focused volume impacted by seasonal factors – 66% government - insured loans; 34% conventional loans – 1Q16 acquisition volumes up 21% from 1Q15 ▪ April correspondent acquisitions totaled $4.0 billion; locks totaled $4.6 billion – Acquisitions up 24% from the average of $3.2 billion per month in 1Q16 4Q15 1Q16 Correspondent seller relationships 432 437 Purchase money loans, as a % of total 73% 72% acquisitions 4Q15 1Q16 Government-insured 697 697 Conventional 746 748 Selected Operational Metrics WA FICO Ŷ Total Locks (3) Ŷ Conventional loans for PMT (2) $5.1 $6.6 $6.4 $2.9 $3.5 $3.3 $9.5 $10.6 $10.4 $0 $4 $8 $12 1Q15 4Q15 1Q16
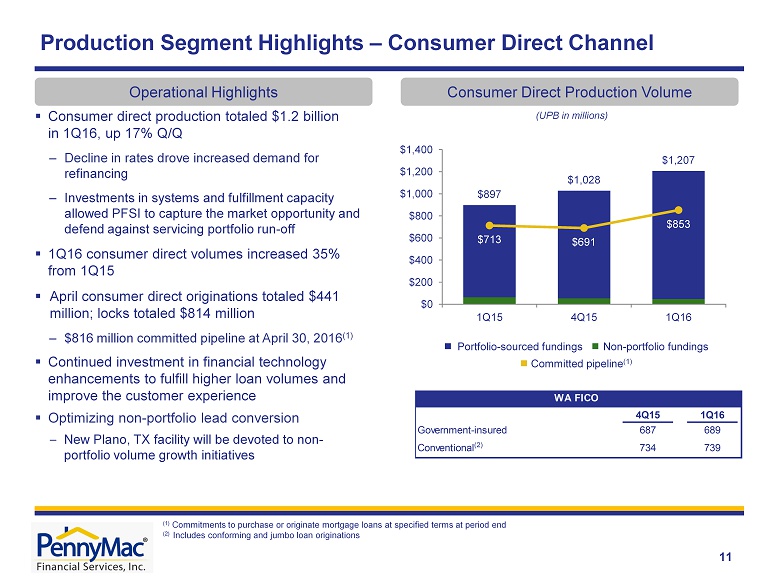
(UPB in millions ) ▪ Consumer direct production totaled $1.2 billion in 1Q16, up 17% Q/Q – Decline in rates drove increased demand for refinancing – Investments in systems and fulfillment capacity allowed PFSI to capture the market opportunity and defend against servicing portfolio run - off ▪ 1Q16 consumer direct volumes increased 35% from 1Q15 ▪ April consumer direct originations totaled $441 million ; locks totaled $814 million – $816 million committed pipeline at April 30, 2016 (1) ▪ Continued investment in financial technology enhancements to fulfill higher loan volumes and improve the customer experience ▪ Optimizing non - portfolio lead conversion – New Plano, TX facility will be devoted to non - portfolio volume growth initiatives Production Segment Highlights – Consumer Direct Channel Consumer Direct Production Volume Operational Highlights Ŷ Portfolio - sourced fundings Ŷ Non - portfolio fundings Ŷ Committed pipeline (1) (1) C ommitments to purchase or originate mortgage loans at specified terms at period end (2 ) Includes conforming and jumbo loan originations 11 4Q15 1Q16 Government-insured 687 689 Conventional (2) 734 739 WA FICO $897 $1,028 $1,207 $713 $691 $853 $0 $200 $400 $600 $800 $1,000 $1,200 $1,400 1Q15 4Q15 1Q16
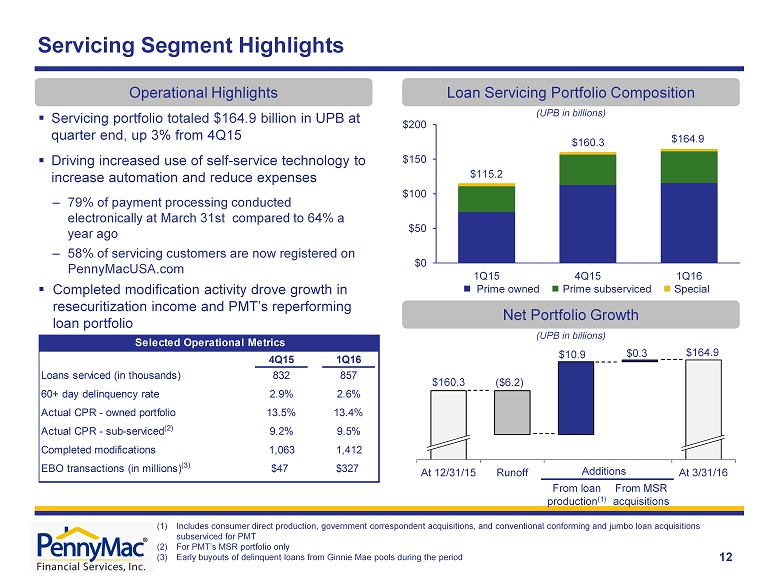
$160.3 $164.9 At 12/31/15 Runoff Additions from loan production MSR acquisitions At 3/31/16 (UPB in billions ) ▪ Servicing portfolio totaled $164.9 billion in UPB at quarter end, up 3% from 4Q15 ▪ Driving increased use of self - service technology to increase automation and reduce expenses – 79% of payment processing conducted electronically at March 31st compared to 64% a year ago – 58% of servicing customers are now registered on PennyMacUSA.com ▪ Completed modification activity drove growth in resecuritization income and PMT’s reperforming loan portfolio Servicing Segment Highlights Loan Servicing Portfolio Composition Operational Highlights Net Portfolio Growth ($6.2) $10.9 $0.3 (UPB in billions ) (1) 12 (1) Includes consumer direct production, government correspondent acquisitions, and conventional conforming and jumbo loan acquisitions subserviced for PMT (2) For PMT’s MSR portfolio only (3) Early buyouts of delinquent loans from Ginnie Mae pools during the period Additions From loan p roduction (1) From MSR acquisitions 4Q15 1Q16 Loans serviced (in thousands) 832 857 60+ day delinquency rate 2.9% 2.6% Actual CPR - owned portfolio 13.5% 13.4% Actual CPR - sub-serviced (2) 9.2% 9.5% Completed modifications 1,063 1,412 EBO transactions (in millions) (3) $47 $327 Selected Operational Metrics Ŷ Prime owned Ŷ Prime subserviced Ŷ Special $115.2 $160.3 $164.9 $0 $50 $100 $150 $200 1Q15 4Q15 1Q16
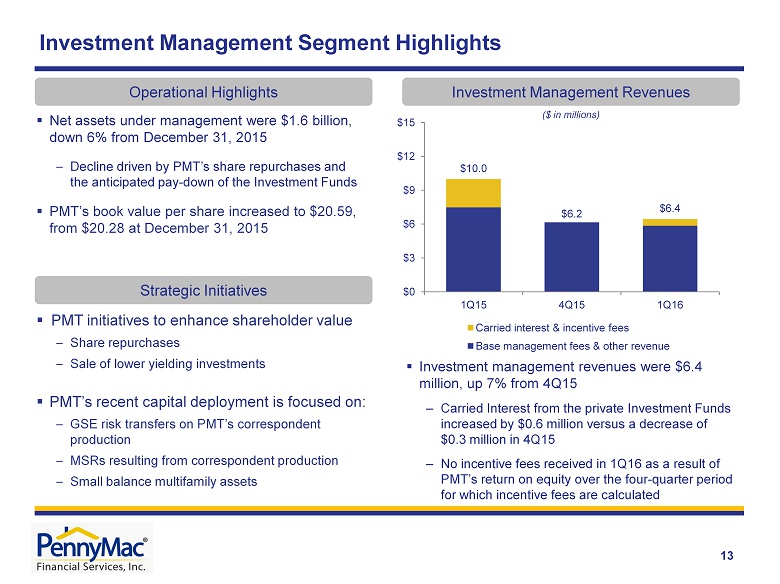
$10.0 $6.2 $6.4 $0 $3 $6 $9 $12 $15 1Q15 4Q15 1Q16 Carried interest & incentive fees Base management fees & other revenue 13 ($ in millions) ▪ Net assets under management were $1.6 billion, down 6% from December 31, 2015 – Decline driven by PMT’s share repurchases and the anticipated pay - down of the Investment Funds ▪ PMT’s book value per share increased to $20.59, from $20.28 at December 31, 2015 Investment Management Segment Highlights Investment Management Revenues Operational Highlights Strategic Initiatives ▪ PMT initiatives to enhance shareholder value – Share repurchases – Sale of lower yielding investments ▪ PMT’s recent capital deployment is focused on: – GSE risk transfers on PMT’s correspondent production – MSRs resulting from correspondent production – Small balance multifamily assets ▪ Investment management revenues were $6.4 million, up 7% from 4Q15 – Carried Interest from the private Investment F unds increased by $0.6 million versus a decrease of $0.3 million in 4Q15 – No incentive fees received in 1Q16 as a result of PMT’s return on equity over the four - quarter period for which incentive fees are calculated
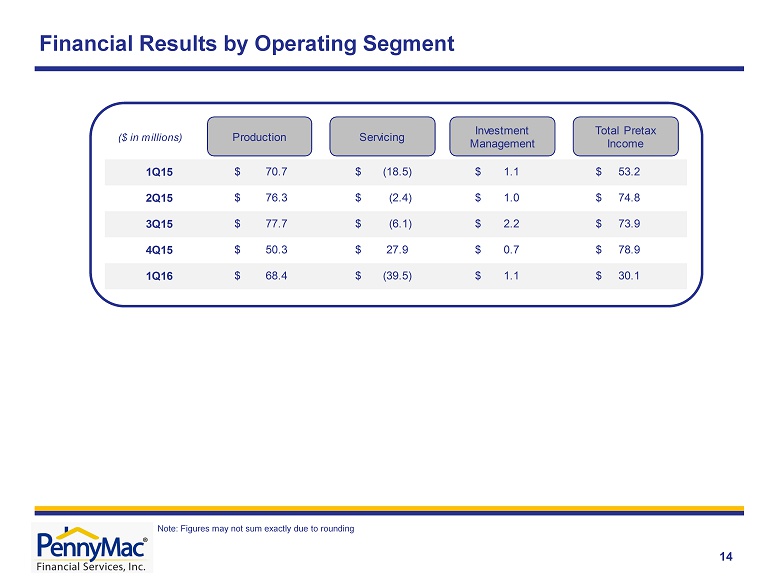
1Q15 70.7$ (18.5)$ 1.1$ 53.2$ 2Q15 76.3$ (2.4)$ 1.0$ 74.8$ 3Q15 77.7$ (6.1)$ 2.2$ 73.9$ 4Q15 50.3$ 27.9$ 0.7$ 78.9$ 1Q16 68.4$ (39.5)$ 1.1$ 30.1$ ($ in millions) Production Servicing Investment Management Total Pretax Income Financial Results by Operating Segment 14 Note: Figures may not sum exactly due to rounding
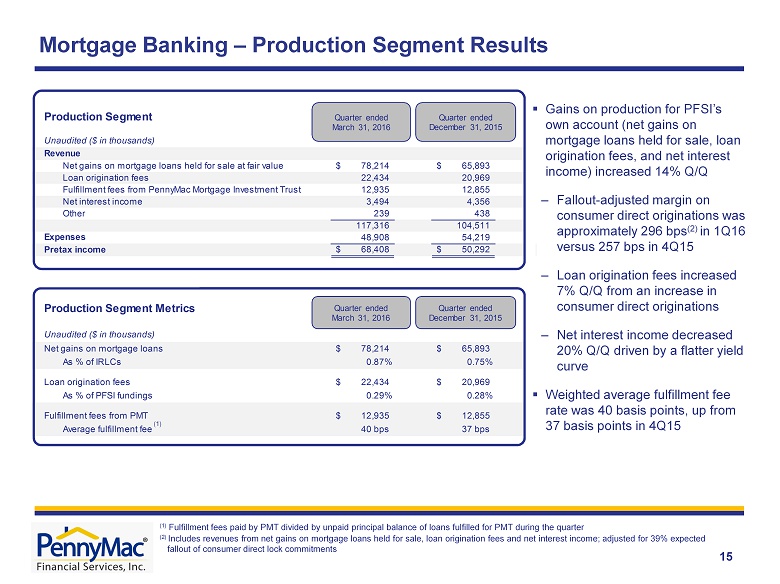
Net gains on mortgage loans held for sale at fair value 78,214$ 65,893$ Loan origination fees 22,434 20,969 Fulfillment fees from PennyMac Mortgage Investment Trust 12,935 12,855 Net interest income 3,494 4,356 Other 239 438 117,316 104,511 48,908 54,219 Pretax income 68,408$ 50,292$ Net gains on mortgage loans 78,214$ 65,893$ As % of IRLCs 0.87% 0.75% Loan origination fees 22,434$ 20,969$ As % of PFSI fundings 0.29% 0.28% Fulfillment fees from PMT 12,935$ 12,855$ Average fulfillment fee 40 bps 37 bps Production Segment Metrics Unaudited ($ in thousands) Expenses Production Segment Unaudited ($ in thousands) Revenue Quarter ended September 30 , 2015 Quarter ended June 30 , 2015 Quarter ended September 30, 2015 Quarter ended June 30 , 2015 Quarter ended March 31, 2016 Quarter ended December 31, 2015 Quarter ended March 31, 2016 Quarter ended December 31, 2015 15 Mortgage Banking – Production Segment Results ( 1 ) Fulfillment fees paid by PMT divided by unpaid principal balance of loans fulfilled for PMT during the quarter (2) Includes revenues from net gains on mortgage loans held for sale, loan origination fees and net interest income; adjusted for 39% expected fallout of consumer direct lock commitments ▪ Gains on production for PFSI’s own account (net gains on mortgage loans held for sale, loan origination fees, and net interest income) increased 14% Q/Q – Fallout - adjusted margin on consumer direct originations was approximately 296 bps (2) in 1Q16 versus 257 bps in 4Q15 – Loan origination fees increased 7% Q/Q from an increase in consumer direct originations – Net interest income decreased 20% Q/Q driven by a flatter yield curve ▪ Weighted average fulfillment fee rate was 40 basis points, up from 37 basis points in 4Q15 (1)
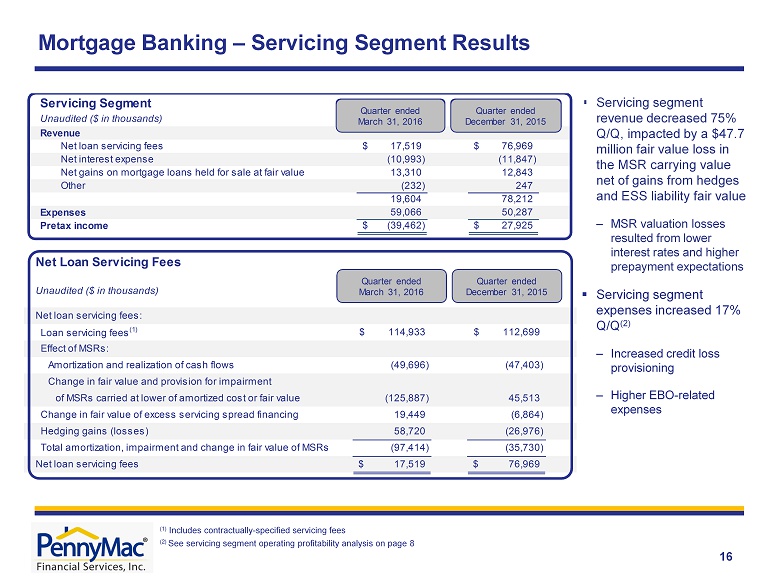
Mortgage Banking – Servicing Segment Results (1) Includes contractually - specified servicing fees (2) See servicing segment operating profitability analysis on page 8 16 Unaudited ($ in thousands) Net loan servicing fees: Loan servicing fees (1) 114,933$ 112,699$ Effect of MSRs: Amortization and realization of cash flows (49,696) (47,403) Change in fair value and provision for impairment of MSRs carried at lower of amortized cost or fair value (125,887) 45,513 Change in fair value of excess servicing spread financing 19,449 (6,864) Hedging gains (losses) 58,720 (26,976) Total amortization, impairment and change in fair value of MSRs (97,414) (35,730) Net loan servicing fees 17,519$ 76,969$ Net Loan Servicing Fees Quarter ended March 31, 2016 Quarter ended December 31, 2015 ▪ Servicing segment revenue decreased 75% Q/Q, impacted by a $47.7 million fair value loss in the MSR carrying value net of gains from hedges and ESS liability fair value – MSR valuation losses resulted from lower interest rates and higher prepayment expectations ▪ Servicing segment expenses increased 17% Q/Q (2) – Increased credit loss provisioning – Higher EBO - related expenses Revenue Net loan servicing fees 17,519$ 76,969$ Net interest expense (10,993) (11,847) Net gains on mortgage loans held for sale at fair value 13,310 12,843 Other (232) 247 19,604 78,212 Expenses 59,066 50,287 Pretax income (39,462)$ 27,925$ Servicing Segment Unaudited ($ in thousands) Quarter ended Quarter ended Quarter ended March 31, 2016 Quarter ended December 31, 2015
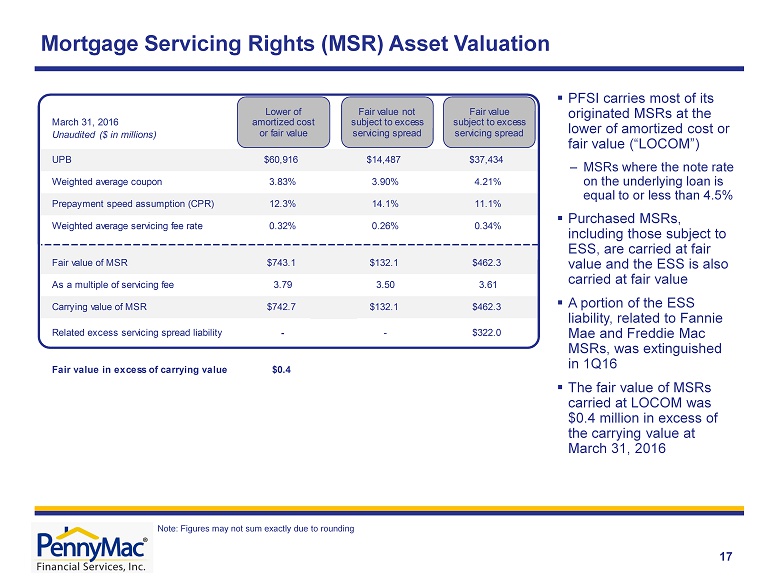
Mortgage Servicing Rights (MSR) Asset Valuation 17 ▪ PFSI carries most of its originated MSRs at the lower of amortized cost or fair value (“LOCOM”) – MSRs where the note rate on the underlying loan is equal to or less than 4.5 % ▪ Purchased MSRs, including those subject to ESS, are carried at fair value and the ESS is also carried at fair value ▪ A portion of the ESS liability, related to Fannie Mae and Freddie Mac MSRs, was extinguished in 1Q16 ▪ The fair value of MSRs carried at LOCOM was $0.4 million in excess of the carrying value at March 31, 2016 Note: Figures may not sum exactly due to rounding UPB $60,916 $14,487 $37,434 Weighted average coupon 3.83% 3.90% 4.21% Prepayment speed assumption (CPR) 12.3% 14.1% 11.1% Weighted average servicing fee rate 0.32% 0.26% 0.34% Fair value of MSR $743.1 $132.1 $462.3 As a multiple of servicing fee 3.79 3.50 3.61 Carrying value of MSR $742.7 $132.1 $462.3 Related excess servicing spread liability - - $322.0 Fair value in excess of carrying value $0.4 March 31, 2016 Unaudited ($ in millions) Lower of amortized cost or fair value Fair value not subject to excess servicing spread Fair value subject to excess servicing spread
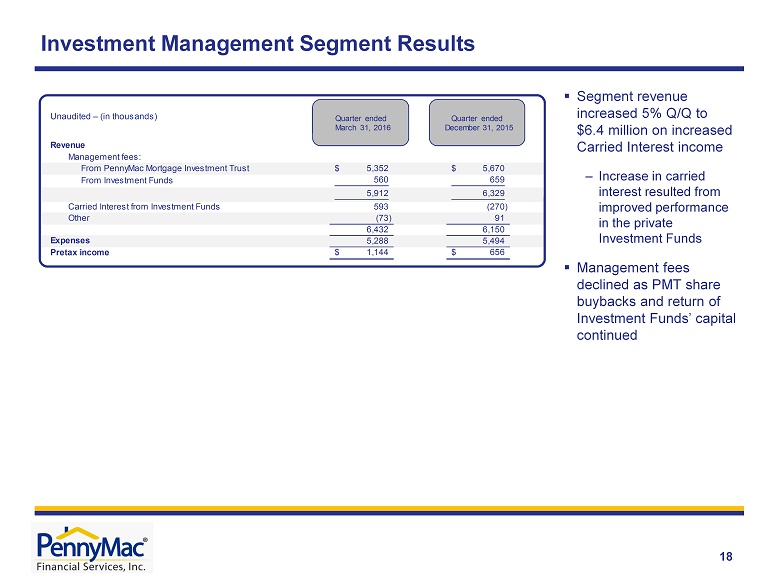
Investment Management Segment Results 18 ▪ Segment revenue increased 5% Q/Q to $6.4 million on increased Carried Interest income – Increase in carried interest resulted from improved performance in the private Investment Funds ▪ Management fees declined as PMT share buybacks and return of Investment Funds’ capital continued Management fees: From PennyMac Mortgage Investment Trust 5,352$ 5,670$ From Investment Funds 560 659 5,912 6,329 Carried Interest from Investment Funds 593 (270) Other (73) 91 6,432 6,150 5,288 5,494 Pretax income 1,144$ 656$ Revenue Expenses Unaudited – (in thousands) Quarter ended December Quarter ended December 31, 2015 Quarter ended March 31, 2016

Appendix
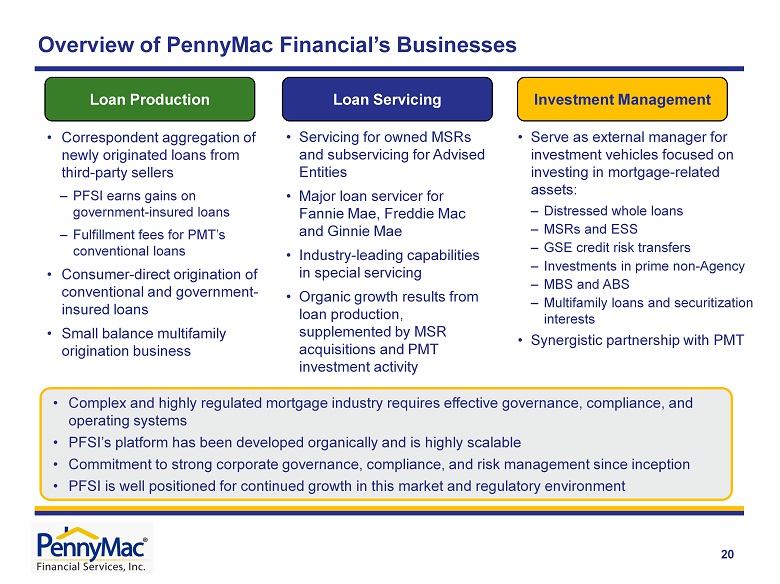
Overview of PennyMac Financial’s Businesses • Complex and highly regulated mortgage industry requires effective governance, compliance, and operating systems • PFSI’s platform has been developed organically and is highly scalable • Commitment to strong corporate governance, compliance, and risk management since inception • PFSI is well positioned for continued growth in this market and regulatory environment Loan Production Loan Servicing Investment Management • Servicing for owned MSRs and subservicing for Advised Entities • Major loan servicer for Fannie Mae, Freddie Mac and Ginnie Mae • Industry - leading capabilities in special servicing • Organic growth results from loan production, supplemented by MSR acquisitions and PMT investment activity • Serve as external manager for investment vehicles focused on investing in mortgage - related assets: – Distressed whole loans – MSRs and ESS – GSE credit risk transfers – Investments in prime non - Agency – MBS and ABS – Multifamily loans and securitization interests • Synergistic partnership with PMT • Correspondent aggregation of newly originated loans from third - party sellers – PFSI earns gains on government - insured loans – Fulfillment fees for PMT’s conventional loans • Consumer - direct origination of conventional and government - insured loans • Small balance multifamily origination business 20
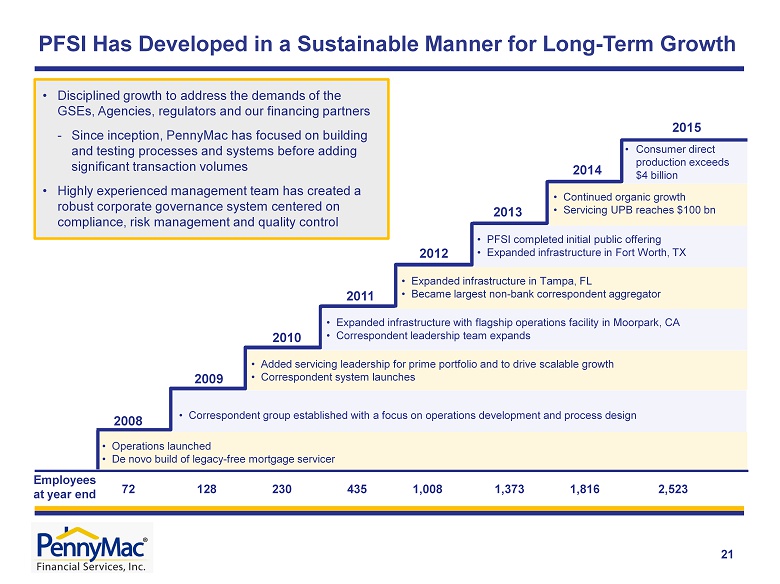
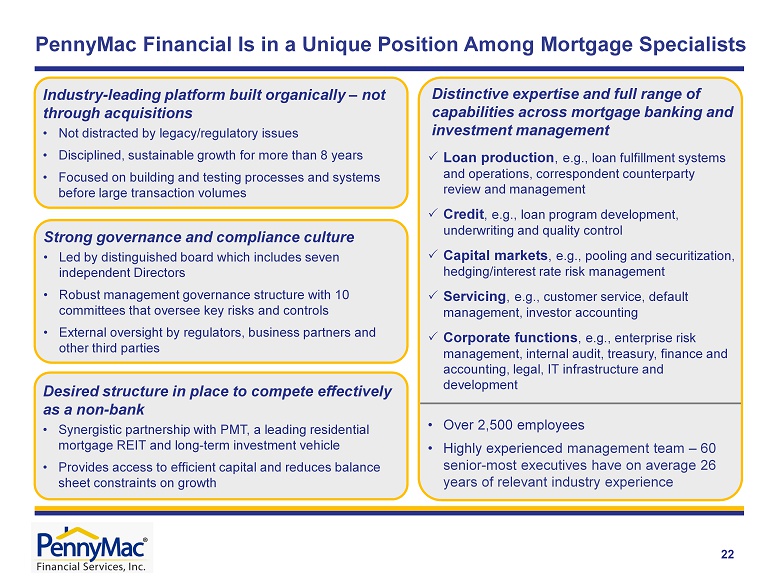
PFSI Has Developed in a Sustainable Manner for Long - Term Growth 72 128 230 435 1,008 1, 373 1,816 2,523 • Operations launched • De novo build of legacy - free mortgage servicer 2008 E mployees at year end 21 2009 2010 2011 2012 2013 2014 2015 • Correspondent group established with a focus on operations development and process design • Added servicing leadership for prime portfolio and to drive scalable growth • Correspondent system launches • Expanded infrastructure with flagship operations facility in Moorpark, CA • Correspondent leadership team expands • Expanded infrastructure in Tampa, FL • Became largest non - bank correspondent aggregator • PFSI completed initial public offering • Expanded infrastructure in Fort Worth, TX • Continued organic growth • Servicing UPB reaches $100 bn • Consumer direct production exceeds $4 billion • Disciplined growth to address the demands of the GSEs, Agencies, regulators and our financing partners - Since inception, PennyMac has focused on building and testing processes and systems before adding significant transaction volumes • Highly experienced management team has created a robust corporate governance system centered on compliance, risk management and quality control
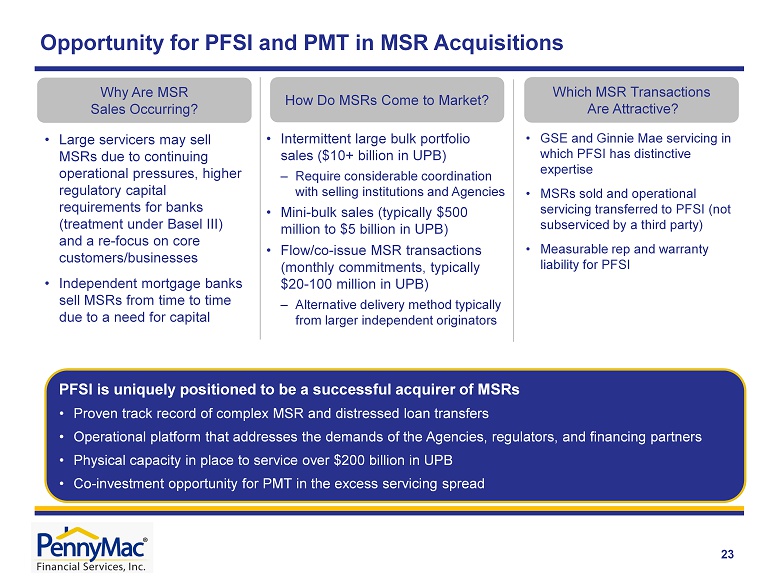
Opportunity for PFSI and PMT in MSR Acquisitions 23 Why Are MSR Sales Occurring? How Do MSRs Come to Market? • Large servicers may sell MSRs due to continuing operational pressures, higher regulatory capital requirements for banks (treatment under Basel III) and a re - focus on core customers/businesses • Independent mortgage banks sell MSRs from time to time due to a need for capital • Intermittent large bulk portfolio sales ($10+ billion in UPB) – Require considerable coordination with selling institutions and Agencies • Mini - bulk sales (typically $500 million to $5 billion in UPB) • Flow/co - issue MSR transactions (monthly commitments, typically $20 - 100 million in UPB) – Alternative delivery method typically from larger independent originators Which MSR Transactions Are Attractive? • GSE and Ginnie Mae servicing in which PFSI has distinctive expertise • MSRs sold and operational servicing transferred to PFSI (not subserviced by a third party) • Measurable rep and warranty liability for PFSI PFSI is uniquely positioned to be a successful acquirer of MSRs • Proven track record of complex MSR and distressed loan transfers • Operational platform that addresses the demands of the Agencies, regulators, and financing partners • Physical capacity in place to service over $200 billion in UPB • Co - investment opportunity for PMT in the excess servicing spread