Attached files
| file | filename |
|---|---|
| EX-32.1 - EXHIBIT 32.1 - On Deck Capital, Inc. | ondk-2016331x10qxexh321.htm |
| EX-32.2 - EXHIBIT 32.2 - On Deck Capital, Inc. | ondk-2016331x10qxexh322.htm |
| EX-31.1 - EXHIBIT 31.1 - On Deck Capital, Inc. | ondk-2016331x10qxexh311.htm |
| EX-10.1 - EXHIBIT 10.1 - On Deck Capital, Inc. | ondk-2016331x10qxexh101.htm |
| EX-31.2 - EXHIBIT 31.2 - On Deck Capital, Inc. | ondk-2016331x10qxexh312.htm |
UNITED STATES
SECURITIES AND EXCHANGE COMMISSION
Washington, D.C. 20549
FORM 10-Q
(MARK ONE)
ý | QUARTERLY REPORT PURSUANT TO SECTION 13 OR 15(d) OF THE SECURITIES EXCHANGE ACT OF 1934 |
FOR THE QUARTERLY PERIOD ENDED MARCH 31, 2016
OR
¨ | TRANSITION REPORT PURSUANT TO SECTION 13 OR 15(d) OF THE SECURITIES EXCHANGE ACT OF 1934 |
FOR THE TRANSITION PERIOD FROM TO
Commission File Number 001-36779
On Deck Capital, Inc.
(Exact name of registrant as specified in its charter)
Delaware | 42-1709682 | |
(State or other jurisdiction of incorporation or organization) | (I.R.S. Employer Identification No.) | |
1400 Broadway, 25th Floor, New York, New York | 10018 | |
(Address of principal executive offices) | (Zip Code) | |
(888) 269-4246
(Registrant’s telephone number, including area code)
Indicate by check mark whether the registrant (1) has filed all reports required to be filed by Section 13 or 15(d) of the Securities Exchange Act of 1934 during the preceding 12 months (or for such shorter period that the registrant was required to file such reports), and (2) has been subject to such filing requirements for the past 90 days. YES ý NO ¨
Indicate by check mark whether the registrant has submitted electronically and posted on its corporate Web site, if any, every Interactive Data file required to be submitted and posted pursuant to Rule 405 of Regulation S-T (§232.405 of this chapter) during the preceding 12 months (or for such shorter period that the registrant was required to submit and post such files). YES ý NO ¨
Indicate by check mark whether the registrant is a large accelerated filer, an accelerated filer, a non-accelerated filer, or a smaller reporting company. See the definitions of “large accelerated filer,” “accelerated filer,” and “smaller reporting company” in Rule 12b-2 of the Exchange Act. (Check one):
Large accelerated filer | ¨ | Accelerated filer | x | |||
Non-accelerated filer | ¨ (Do not check if a smaller reporting company) | Smaller reporting company | ¨ | |||
Indicate by check mark whether the registrant is a shell company (as defined in Rule 12b-2 of the Exchange Act). YES ¨ NO ý
The number of shares of the registrant’s common stock outstanding as of April 30, 2016 was 70,717,327.
On Deck Capital, Inc.
Table of Contents
Page | ||
PART I - FINANCIAL INFORMATION | ||
Item 1. | ||
Item 2. | ||
Item 3. | ||
Item 4. | ||
Item 1. | ||
Item 1A. | ||
Item 2. | ||
Item 3. | ||
Item 4. | ||
Item 5. | ||
Item 6 | ||
PART I
Item 1. | Financial Statements (Unaudited) |
ON DECK CAPITAL, INC. AND SUBSIDIARIES
Unaudited Condensed Consolidated Balance Sheets
(in thousands, except share and per share data)
March 31, | December 31, | ||||||
2016 | 2015 | ||||||
Assets | |||||||
Cash and cash equivalents | $ | 136,843 | $ | 159,822 | |||
Restricted cash | 32,691 | 38,463 | |||||
Loans held for investment | 663,389 | 552,742 | |||||
Less: Allowance for loan losses | (61,707 | ) | (53,311 | ) | |||
Loans held for investment, net | 601,682 | 499,431 | |||||
Loans held for sale | 4,507 | 706 | |||||
Property, equipment and software, net | 30,482 | 26,187 | |||||
Other assets | 22,643 | 20,416 | |||||
Total assets | $ | 828,848 | $ | 745,025 | |||
Liabilities and equity | |||||||
Liabilities: | |||||||
Accounts payable | $ | 5,523 | $ | 2,701 | |||
Interest payable | 945 | 757 | |||||
Funding debt | 465,628 | 375,890 | |||||
Corporate debt | 2,697 | 2,695 | |||||
Accrued expenses and other liabilities | 31,311 | 33,560 | |||||
Total liabilities | 506,104 | 415,603 | |||||
Commitments and contingencies (Note 9) | |||||||
Stockholders’ equity (deficit): | |||||||
Common stock—$0.005 par value, 1,000,000,000 shares authorized and 73,745,625 and 73,107,848 shares issued and 70,697,985 and 70,060,208 outstanding at March 31, 2016 and December 31, 2015, respectively | 369 | 366 | |||||
Treasury stock—at cost | (5,843 | ) | (5,843 | ) | |||
Additional paid-in capital | 462,945 | 457,003 | |||||
Accumulated deficit | (140,914 | ) | (128,341 | ) | |||
Accumulated other comprehensive loss | (86 | ) | (372 | ) | |||
Total On Deck Capital, Inc. stockholders' equity | 316,471 | 322,813 | |||||
Noncontrolling interest | 6,273 | 6,609 | |||||
Total equity | 322,744 | 329,422 | |||||
Total liabilities and equity | $ | 828,848 | $ | 745,025 | |||
The accompanying notes are an integral part of these unaudited condensed consolidated financial statements.
3
ON DECK CAPITAL, INC. AND SUBSIDIARIES
Unaudited Condensed Consolidated Statements of Operations and Comprehensive Income
(in thousands, except share and per share data)
Three Months Ended March 31, | |||||||
2016 | 2015 | ||||||
Revenue: | |||||||
Interest income | $ | 53,479 | $ | 48,699 | |||
Gain on sales of loans | 7,111 | 6,679 | |||||
Other revenue | 2,025 | 1,080 | |||||
Gross revenue | 62,615 | 56,458 | |||||
Cost of revenue: | |||||||
Provision for loan losses | 25,437 | 23,101 | |||||
Funding costs | 5,722 | 5,045 | |||||
Total cost of revenue | 31,159 | 28,146 | |||||
Net revenue | 31,456 | 28,312 | |||||
Operating expense: | |||||||
Sales and marketing | 16,548 | 12,675 | |||||
Technology and analytics | 14,087 | 8,587 | |||||
Processing and servicing | 4,215 | 2,703 | |||||
General and administrative | 9,709 | 9,584 | |||||
Total operating expense | 44,559 | 33,549 | |||||
Loss from operations | (13,103 | ) | (5,237 | ) | |||
Other expense: | |||||||
Interest expense | (38 | ) | (106 | ) | |||
Total other expense | (38 | ) | (106 | ) | |||
Loss before provision for income taxes | (13,141 | ) | (5,343 | ) | |||
Provision for income taxes | — | — | |||||
Net loss | (13,141 | ) | (5,343 | ) | |||
Net loss attributable to noncontrolling interest | 568 | — | |||||
Net loss attributable to On Deck Capital, Inc. common stockholders | $ | (12,573 | ) | $ | (5,343 | ) | |
Net loss per share attributable to On Deck Capital, Inc. common stockholders: | |||||||
Basic and diluted | $ | (0.18 | ) | $ | (0.08 | ) | |
Weighted-average common shares outstanding: | |||||||
Basic and diluted | 70,366,877 | 69,249,462 | |||||
Comprehensive loss: | |||||||
Net loss | $ | (13,141 | ) | $ | (5,343 | ) | |
Other comprehensive loss: | |||||||
Foreign currency translation adjustment | 519 | — | |||||
Comprehensive loss | (12,622 | ) | (5,343 | ) | |||
Comprehensive loss attributable to noncontrolling interests | (232 | ) | — | ||||
Net loss attributable to noncontrolling interest | 568 | — | |||||
Comprehensive loss attributable to On Deck Capital, Inc. common stockholders | $ | (12,286 | ) | $ | (5,343 | ) | |
The accompanying notes are an integral part of these unaudited condensed consolidated financial statements.
4
ON DECK CAPITAL, INC. AND SUBSIDIARIES
Unaudited Condensed Consolidated Statements of Cash Flows
(in thousands)
Three Months Ended March 31, | |||||||
2016 | 2015 | ||||||
Cash flows from operating activities | |||||||
Net loss | $ | (13,141 | ) | $ | (5,343 | ) | |
Adjustments to reconcile net loss to net cash provided by operating activities: | |||||||
Provision for loan losses | 25,437 | 23,101 | |||||
Depreciation and amortization | 2,078 | 1,378 | |||||
Amortization of debt issuance costs | 693 | 688 | |||||
Stock-based compensation | 3,752 | 2,042 | |||||
Amortization of net deferred origination costs | 7,381 | 9,275 | |||||
Changes in servicing rights, at fair value | 1,775 | — | |||||
Gain on sales of loans | (7,111 | ) | (6,679 | ) | |||
Unfunded loan commitment reserve | (1,073 | ) | 438 | ||||
Gain on extinguishment of debt | (300 | ) | — | ||||
Changes in operating assets and liabilities: | |||||||
Other assets | (2,994 | ) | (4,483 | ) | |||
Accounts payable | 2,822 | 2,172 | |||||
Interest payable | 188 | (38 | ) | ||||
Accrued expenses and other liabilities | (877 | ) | 117 | ||||
Originations of loans held for sale | (111,878 | ) | (93,926 | ) | |||
Payments of net deferred origination costs of loans held for sale | (3,585 | ) | (2,830 | ) | |||
Proceeds from sale of loans held for sale | 112,859 | 101,568 | |||||
Principal repayments of loans held for sale | 3,823 | 693 | |||||
Net cash provided by operating activities | 19,849 | 28,173 | |||||
Cash flows from investing activities | |||||||
Change in restricted cash | 5,772 | 3,396 | |||||
Purchases of property, equipment and software | (4,846 | ) | (1,606 | ) | |||
Capitalized internal-use software | (1,270 | ) | (1,069 | ) | |||
Originations of term loans and lines of credit, excluding rollovers into new originations | (390,149 | ) | (262,622 | ) | |||
Proceeds from sale of loans held for investment | 17,049 | — | |||||
Payments of net deferred origination costs | (9,845 | ) | (9,246 | ) | |||
Principal repayments of term loans and lines of credit | 249,237 | 194,167 | |||||
Other | (201 | ) | — | ||||
Net cash used in investing activities | (134,253 | ) | (76,980 | ) | |||
Cash flows from financing activities | |||||||
Proceeds from exercise of stock options and warrants | 125 | 150 | |||||
Payments of initial public offering costs | — | (1,845 | ) | ||||
Redemption of common stock and warrants | — | (184 | ) | ||||
Issuance of common stock under employee stock purchase plan | 1,487 | — | |||||
Proceeds from the issuance of funding debt | 110,950 | 36,865 | |||||
Payments of debt issuance costs | (184 | ) | (7 | ) | |||
Repayments of funding debt principal | (21,419 | ) | (26,403 | ) | |||
Repayments of corporate debt principal | — | (12,000 | ) | ||||
Net cash provided by (used in) financing activities | 90,959 | (3,424 | ) | ||||
5
Three Months Ended March 31, | |||||||
2016 | 2015 | ||||||
Effect of exchange rate changes on cash and cash equivalents | 466 | — | |||||
Net decrease in cash and cash equivalents | (22,979 | ) | (52,231 | ) | |||
Cash and cash equivalents at beginning of period | 159,822 | 220,433 | |||||
Cash and cash equivalents at end of period | $ | 136,843 | $ | 168,202 | |||
Supplemental disclosure of other cash flow information | |||||||
Cash paid for interest | $ | 4,109 | $ | 4,234 | |||
Supplemental disclosures of non-cash investing and financing activities | |||||||
Stock-based compensation included in capitalized internal-use software | $ | 334 | $ | 160 | |||
Unpaid principal balance of term loans rolled into new originations | $ | 67,636 | $ | 59,488 | |||
The accompanying notes are an integral part of these unaudited condensed consolidated financial statements.
6
ON DECK CAPITAL, INC. AND SUBSIDIARIES
Notes to Consolidated Financial Statements
1. Organization and Summary of Significant Accounting Policies
On Deck Capital, Inc.’s principal activity is providing financing products to small businesses located throughout the United States as well as Canada and Australia, through term loans and lines of credit. We use technology and analytics to aggregate data about a business and then quickly and efficiently analyze the creditworthiness of the business using our proprietary credit-scoring model. We originate most of the loans in our portfolio and also purchase loans from issuing bank partners. We subsequently transfer most loans into one of our wholly-owned subsidiaries or sell them through OnDeck Marketplace®.
Basis of Presentation and Principles of Consolidation
The accompanying unaudited condensed consolidated financial statements and footnotes have been prepared in accordance with accounting principles generally accepted in the United States of America ("GAAP") as contained in the Financial Accounting Standards Board (‘‘FASB’’) Accounting Standards Codification (“ASC”) for interim financial information. All intercompany transactions and accounts have been eliminated in consolidation. The results of operations for the periods presented are not necessarily indicative of the results for the full year or the results for any future periods. These unaudited condensed consolidated financial statements should be read in conjunction with our audited consolidated financial statements, including the related notes, and the other information contained in our Annual Report on Form 10-K for the year ended December 31, 2015. When used in these notes to condensed consolidated financial statements, the terms "we," "us," "our" or similar terms refers to On Deck Capital, Inc. and its consolidated subsidiaries.
In the second quarter of 2015, we acquired a 55% interest in On Deck Capital Australia PTY LTD ("OnDeck Australia") with the remaining 45% owned by non-affiliated parties. In the third quarter of 2015, we acquired a 67% interest in Lancelot QBFOD LLC with the remaining 33% owned by Intuit Inc. ("Intuit"). We entered into the transaction involving OnDeck Australia with local partners to facilitate providing financing products to small businesses in Australia. We and Intuit jointly invested in Lancelot QBFOD LLC to provide integrated access to line of credit financing to Intuit customers utilizing Intuit's customer data. We consolidate the financial position and results of operations of OnDeck Australia and Lancelot QBFOD LLC. The noncontrolling interest, which is presented as a separate component of our consolidated equity, represents the minority owners' proportionate share of the equity of the jointly owned entities. The noncontrolling interest is adjusted for the minority owners' share of the earnings, losses, investments and distributions.
Other than as described below in Recently Adopted Accounting Standards, during the three months ended March 31, 2016 there were no material changes to our significant accounting policies as disclosed under Part II, Item 8 of our Annual Report on Form 10-K for the year ended December 31, 2015.
Reclassifications
Certain reclassifications have been made to the prior period amounts to conform to the current period presentation. We reclassified gain on sales of loans, payments of net deferred origination costs of loans held for sale and proceeds from sale of loans held for sale to be included as operating activities in the consolidated statement of cash flows. Previously, such amounts were presented as a component of net income and sales of loans held for sale.
Use of Estimates
The preparation of financial statements in conformity with GAAP requires us to make estimates and assumptions that affect the reported amounts in the condensed consolidated financial statements and accompanying notes. Significant estimates include allowance for loan losses, valuation of warrants, stock-based compensation expense, servicing assets/liabilities, capitalized software development costs, the useful lives of long-lived assets and valuation allowance for deferred tax assets. We base our estimates on historical experience, current events and other factors we believe to be reasonable under the circumstances. These estimates and assumptions are inherently subjective in nature; actual results may differ from these estimates and assumptions.
Recently Adopted Accounting Standards
In April 2015, the FASB issued Accounting Standards Update ("ASU") 2015-03, Interest—Imputation of Interest (Subtopic 835-30): Simplifying the Presentation of Debt Issuance Costs. The ASU simplifies the presentation of debt issuance costs by requiring that unamortized debt issuance costs be presented as a reduction of the applicable liability rather than an asset. The guidance is effective beginning on January 1, 2016 and is required to be applied retrospectively. Accordingly, $4.2 million of deferred debt issuance costs on the consolidated balance sheet at December 31, 2015 have been reclassified to be presented as a reduction of the carrying value of the associated debt to conform with the current period presentation.
7
Recent Accounting Pronouncements Not Yet Adopted
In May 2014, the FASB issued ASU 2014-09, Revenue Recognition, which creates ASC 606, Revenue from Contracts with Customers, and supersedes ASC 605, Revenue Recognition. ASU 2014-09 requires revenue to be recognized in an amount that reflects the consideration to which the entity expects to be entitled in exchange for goods or services and also requires additional disclosure about the nature, amount, timing, and uncertainty of revenue and cash flows from customer contracts. The new guidance will be effective for annual reporting periods beginning after December 15, 2017, including interim periods within that reporting period. Early adoption is permitted, but not before the original effective date of December 15, 2016. We are currently in the process of assessing the impact that the adoption of this guidance will have on our consolidated financial statements.
In February 2016, the FASB issued ASU 2016-02, Leases, which creates ASC 842, Leases, and supersedes ASC 840, Leases. ASU 2016-02 requires lessees to recognize a right-of-use asset and lease liability for all leases with terms of more than 12 months. Recognition, measurement and presentation of expenses will depend on classification as a finance or operating lease. The new guidance will be effective for annual reporting periods beginning after December 15, 2018, including interim periods within that reporting period and is applied retrospectively. Early adoption is permitted. We are currently in the process of assessing the impact the adoption of this guidance will have on our consolidated financial statements.
In March 2016, the FASB issued ASU 2016-09, Improvements to Employee Share-Based Payment Accounting. ASU 2016-09 will simplify several aspects of accounting for share-based payment award transactions which include the income tax consequences, classification of awards as either equity or liabilities, classification on the statement of cash flows and forfeiture rate calculations. The new guidance will become effective for annual periods beginning after December 15, 2016. Early adoption is permitted in any interim or annual period. We are currently evaluating the impact of this guidance on our consolidated financial statements.
2. Net Loss Per Common Share
Basic and diluted net loss per common share is calculated as follows (in thousands, except share and per share data):
Three Months Ended March 31, | |||||||
2016 | 2015 | ||||||
Numerator: | |||||||
Net loss | $ | (13,141 | ) | $ | (5,343 | ) | |
Less: net loss attributable to noncontrolling interest | 568 | — | |||||
Net loss attributable to On Deck Capital, Inc. common stockholders | $ | (12,573 | ) | $ | (5,343 | ) | |
Denominator: | |||||||
Weighted-average common shares outstanding, basic and diluted | 70,366,877 | 69,249,462 | |||||
Net loss per common share, basic and diluted | $ | (0.18 | ) | $ | (0.08 | ) | |
Diluted loss per common share is the same as basic loss per common share for all periods presented because the effects of potentially dilutive items were anti-dilutive given our net losses. The following common share equivalent securities have been excluded from the calculation of weighted-average common shares outstanding because the effect is anti-dilutive for the periods presented:
Three Months Ended March 31, | |||||
2016 | 2015 | ||||
Anti-Dilutive Common Share Equivalents | |||||
Warrants to purchase common stock | 22,000 | 309,792 | |||
Restricted stock units | 3,029,299 | 418,778 | |||
Stock options | 10,714,645 | 10,105,177 | |||
Total anti-dilutive common share equivalents | 13,765,944 | 10,833,747 | |||
The weighted-average exercise price for warrants to purchase 2,228,496 shares of common stock was $10.70 as of March 31, 2016. For the period ended March 31, 2016 a warrant to purchase 2,206,496 shares of common stock was excluded from anti-dilutive common share equivalents as performance conditions had not been met.
3. Loans Held for Investment and Allowance for Loan Losses
8
Loans Held for Investment and Allowance for Loan Losses
Loans held for investment consisted of the following as of March 31, 2016 and December 31, 2015 (in thousands):
March 31, | December 31, | ||||||
2016 | 2015 | ||||||
Term loans | $ | 573,076 | $ | 482,596 | |||
Lines of credit | 78,894 | 61,194 | |||||
Total unpaid principal balance | 651,970 | 543,790 | |||||
Net deferred origination costs | 11,419 | 8,952 | |||||
Total loans held for investment | $ | 663,389 | $ | 552,742 | |||
The activity in the allowance for loan losses for the three months ended March 31, 2016 and 2015 consisted of the following (in thousands):
Three Months Ended March 31, | |||||||
2016 | 2015 | ||||||
Balance at beginning of period | $ | 53,311 | $ | 49,804 | |||
Provision for loan losses | 25,437 | 23,101 | |||||
Loans charged off | (18,518 | ) | (17,864 | ) | |||
Recoveries of loans previously charged off | 1,477 | 1,754 | |||||
Allowance for loan losses at end of period | $ | 61,707 | $ | 56,795 | |||
We include both loans we originate and loans funded by our issuing bank partners and later purchased by us as part of our originations. During the three months ended March 31, 2016 and 2015, we purchased such loans in the amount of $103.6 million and $54.6 million, respectively.
We typically sell certain previously charged-off loans to a third-party debt collector. The proceeds from these sales are recorded as a component of the recoveries of loans previously charged off. For the three months ended March 31, 2016 and 2015, previously charged-off loans sold accounted for $1.0 million and $1.5 million, respectively, of recoveries of loans previously charged off.
As of March 31, 2016 and December 31, 2015, our off-balance sheet credit exposure related to the undrawn line of credit balances was $104.7 million and $89.1 million, respectively. The related accrual for unfunded loan commitments was $3.1 million and $4.2 million as of March 31, 2016 and December 31, 2015, respectively. Net adjustments to the accrual for unfunded loan commitments are included in general and administrative expenses.
The following table illustrates the unpaid principal balance related to non-delinquent, paying and non-paying delinquent loans as of March 31, 2016 and December 31, 2015 (in thousands):
March 31, 2016 | December 31, 2015 | ||||||
Non-delinquent loans | $ | 596,791 | $ | 486,729 | |||
Delinquent: paying (accrual status) | 29,388 | 28,192 | |||||
Delinquent: non-paying (non-accrual status) | 25,791 | 28,869 | |||||
Total | $ | 651,970 | $ | 543,790 | |||
The portion of the allowance for loan losses attributable to non-delinquent loans was $33.6 million and $27.0 million, as of March 31, 2016 and December 31, 2015, respectively, while the portion of the allowance for loan losses attributable to delinquent loans was $28.1 million and $26.3 million as of March 31, 2016 and December 31, 2015, respectively.
9
The following table shows an aging analysis of the unpaid principal balance related to loans held for investment by delinquency status as of March 31, 2016 and December 31, 2015 (in thousands):
March 31, 2016 | December 31, 2015 | ||||||
By delinquency status: | |||||||
Non-delinquent loans | $ | 596,791 | $ | 486,729 | |||
1-14 calendar days past due | 17,698 | 21,360 | |||||
15-29 calendar days past due | 10,574 | 8,703 | |||||
30-59 calendar days past due | 10,765 | 10,347 | |||||
60-89 calendar days past due | 8,621 | 7,443 | |||||
90 + calendar days past due | 7,521 | 9,208 | |||||
Total unpaid principal balance | $ | 651,970 | $ | 543,790 | |||
4. Servicing Rights
As of March 31, 2016 and December 31, 2015, we serviced term loans we sold with a remaining unpaid principal balance of $325.2 million and $345.9 million, respectively. During the three months ended March 31, 2016 and 2015, we sold through OnDeck Marketplace loans with an unpaid principal balance of $120.2 million and $92.1 million, respectively.
For the three months ended March 31, 2016 and 2015, we earned $0.4 million, and $0.5 million of servicing revenue, respectively.
The following table summarizes the activity related to the fair value of our servicing assets for the three months ended March 31, 2016:
March 31, 2016 | ||||
Fair value at the beginning of period | $ | 3,489 | ||
Addition: | ||||
Servicing resulting from transfers of financial assets | 933 | |||
Changes in fair value: | ||||
Changes in fair value (1) | (1,775 | ) | ||
Fair value at the end of period (Level 3) | $ | 2,647 | ||
___________
(1) Represents changes due to collection of expected cash flows through March 31, 2016.
10
5. Debt
The following table summarizes our outstanding debt as of March 31, 2016 and December 31, 2015 (in thousands):
Description | Type | Maturity Date | Weighted Average Interest Rate at March 31, 2016 | March 31, 2016 | December 31, 2015 | ||||||||
Funding Debt: | |||||||||||||
ODAST Agreement | Securitization Facility | May 2018 (1) | 3.4% | $ | 174,982 | $ | 174,980 | ||||||
PORT Agreement | Revolving | June 2017 | 2.7% | 78,289 | 59,415 | ||||||||
RAOD Agreement | Revolving | May 2017 | 3.4% | 78,968 | 47,465 | ||||||||
ODART Agreement | Revolving | September 2017 | 2.7% | 33,462 | 42,090 | ||||||||
ODAC Agreement | Revolving | May 2017 | 8.7% | 35,133 | 27,699 | ||||||||
SBAF Agreement | Revolving | Various(2) | 6.7% | 9,708 | 12,783 | ||||||||
ODAP Agreement | Revolving | August 2017 (3) | 5.0% | 52,095 | 8,819 | ||||||||
Partner Synthetic Participations | Term | Various(4) | Various | 6,707 | 6,861 | ||||||||
469,344 | 380,112 | ||||||||||||
Deferred Debt Issuance Cost | (3,716 | ) | (4,222 | ) | |||||||||
Total Funding Debt | 465,628 | 375,890 | |||||||||||
Corporate Debt: | |||||||||||||
Square 1 Agreement | Revolving | October 2016 | 4.5% | 2,700 | 2,700 | ||||||||
Deferred Debt Issuance Cost | (3 | ) | (5 | ) | |||||||||
Total Corporate Debt | 2,697 | 2,695 | |||||||||||
(1) | The period during which remaining cash flow can be used to purchase additional loans expires April 30, 2016 |
(2) | Maturity dates range from April 2016 through August 2017 |
(3) | The period during which new borrowings may be made under this facility expires in August 2016 |
(4) | Maturity dates range from April 2016 through February 2018 |
On April 28, 2016, we amended the ODAC Agreement to increase the revolving commitment from an aggregate amount of $50 million to $75 million, increase the interest rate from LIBOR plus 8.25% to LIBOR plus 9.25% and make certain other related changes.
6. Fair Value of Financial Instruments
Assets and Liabilities Measured at Fair Value on a Recurring Basis Using Significant Unobservable Inputs (Level 3)
We evaluate our financial assets and liabilities subject to fair value measurements on a recurring basis to determine the appropriate level at which to classify them for each reporting period. Due to the lack of transparency and quantity of transactions related to trades of servicing rights of comparable loans, we utilize an income valuation technique to estimate fair value. We utilize industry-standard modeling, such as discounted cash flow models, to arrive at an estimate of fair value and may utilize third-party service providers to assist in the valuation process. This determination requires significant judgments to be made.
The following tables present information about our assets and liabilities that are measured at fair value on a recurring basis as of March 31, 2016 and December 31, 2015 (in thousands):
March 31, 2016 | |||||||||||||||
Description | Level 1 | Level 2 | Level 3 | Total | |||||||||||
Assets: | |||||||||||||||
Servicing assets | $ | — | $ | — | $ | 2,647 | $ | 2,647 | |||||||
Total assets | $ | — | $ | — | $ | 2,647 | $ | 2,647 | |||||||
11
December 31, 2015 | |||||||||||||||
Description | Level 1 | Level 2 | Level 3 | Total | |||||||||||
Assets: | |||||||||||||||
Servicing assets | $ | — | $ | — | $ | 3,489 | $ | 3,489 | |||||||
Total assets | $ | — | $ | — | $ | 3,489 | $ | 3,489 | |||||||
There were no transfers between levels during the three months ended March 31, 2016 or the year ended December 31, 2015.
The following tables present quantitative information about the significant unobservable inputs used for certain of our Level 3 fair value measurement as of March 31, 2016 and December 31, 2015:
March 31, 2016 | ||||||||
Unobservable input | Minimum | Maximum | Weighted-Average | |||||
Servicing Assets | Discount rate | 30.00 | % | 30.00 | % | 30.00 | % | |
Cost of service (1) | 0.08 | % | 0.10 | % | 0.09 | % | ||
Renewal rate | 37.47 | % | 56.90 | % | 52.23 | % | ||
Default rate | 10.21 | % | 10.79 | % | 10.56 | % | ||
December 31, 2015 | ||||||||
Unobservable input | Minimum | Maximum | Weighted-Average | |||||
Servicing Assets | Discount rate | 30.00 | % | 30.00 | % | 30.00 | % | |
Cost of service (1) | 0.09 | % | 0.09 | % | 0.09 | % | ||
Renewal rate | 31.78 | % | 53.21 | % | 53.21 | % | ||
Default rate | 6.43 | % | 10.36 | % | 10.00 | % | ||
(1) Estimated cost of servicing a loan as a percentage of unpaid principal balance | ||||||||
Changes in certain of the unobservable inputs noted above may have a significant impact on the fair value of our servicing asset. The following table summarizes the effect adverse changes in estimate would have on the fair value of the servicing asset as of March 31, 2016 and December 31, 2015 given hypothetical changes in default rate and cost to service (in thousands):
March 31, 2016 | December 31, 2015 | ||||||
Servicing Assets | |||||||
Default rate assumption: | |||||||
Default rate increase of 25% | $ | (145 | ) | $ | (145 | ) | |
Default rate increase of 50% | $ | (280 | ) | $ | (282 | ) | |
Cost to service assumption: | |||||||
Cost to service increase by 25% | $ | (79 | ) | $ | (79 | ) | |
Cost to service increase by 50% | $ | (158 | ) | $ | (159 | ) | |
Assets and Liabilities Disclosed at Fair Value
Because our loans held for investment, loans held for sale and fixed-rate debt are not measured at fair value, we are required to disclose their fair value in accordance with ASC 825. We utilize industry-standard modeling, such as discounted cash flow models, to arrive at an estimate of fair value and may utilize third-party service providers to assist in the valuation process. This determination requires significant judgments to be made.
12
March 31, 2016 | |||||||||||||||||||
Description | Carrying Value | Fair Value | Level 1 | Level 2 | Level 3 | ||||||||||||||
Assets: | |||||||||||||||||||
Loans held for investment | $ | 601,682 | $ | 660,240 | $ | — | $ | — | $ | 660,240 | |||||||||
Loans held for sale | 4,507 | 4,913 | — | — | 4,913 | ||||||||||||||
Total assets | $ | 606,189 | $ | 665,153 | $ | — | $ | — | $ | 665,153 | |||||||||
Description | |||||||||||||||||||
Liabilities: | |||||||||||||||||||
Fixed-rate debt | $ | 191,397 | $ | 185,156 | $ | — | $ | — | $ | 185,156 | |||||||||
Total fixed-rate debt | $ | 191,397 | $ | 185,156 | $ | — | $ | — | $ | 185,156 | |||||||||
December 31, 2015 | |||||||||||||||||||
Description | Carrying Value | Fair Value | Level 1 | Level 2 | Level 3 | ||||||||||||||
Assets: | |||||||||||||||||||
Loans held for investment | $ | 499,431 | $ | 545,740 | $ | — | $ | — | $ | 545,740 | |||||||||
Loans held for sale | 706 | 763 | — | — | 763 | ||||||||||||||
Total assets | $ | 500,137 | $ | 546,503 | $ | — | $ | — | $ | 546,503 | |||||||||
Description | |||||||||||||||||||
Liabilities: | |||||||||||||||||||
Fixed-rate debt | $ | 194,624 | $ | 190,411 | $ | — | $ | — | $ | 190,411 | |||||||||
Total fixed-rate debt | $ | 194,624 | $ | 190,411 | $ | — | $ | — | $ | 190,411 | |||||||||
The following techniques and assumptions are used in estimating fair value:
Loans held for investment and loans held for sale - Fair value is based on discounted cash flow models which contain certain unobservable inputs such as discount rate, renewal rate and default rate.
Fixed-rate debt - Our ODAST Agreement, SBAF Agreement and Partner Synthetic Participations are considered fixed-rate debt. Fair value of our fixed-rate debt is based on a discounted cash flow model with an unobservable input of a discount rate.
13
7. Noncontrolling Interest
The following table summarizes changes in equity, including the equity attributable to noncontrolling interests, for the three months ended March 31, 2016:
Three Months Ended March 31, 2016 | ||||||||||||
On Deck Capital, Inc.'s stockholders' equity | Noncontrolling interest | Total | ||||||||||
Balance as of January 1, 2016 | $ | 322,813 | $ | 6,609 | $ | 329,422 | ||||||
Net income (loss) | (12,573 | ) | (568 | ) | (13,141 | ) | ||||||
Stock based compensation | 3,752 | — | 3,752 | |||||||||
Exercise of options and warrants | 129 | — | 129 | |||||||||
Employee stock purchase plan | 2,063 | — | 2,063 | |||||||||
Cumulative translation adjustment | 287 | 232 | 519 | |||||||||
Balance at March 31, 2016 | 316,471 | 6,273 | 322,744 | |||||||||
Comprehensive loss: | ||||||||||||
Net loss | (12,573 | ) | (568 | ) | (13,141 | ) | ||||||
Other comprehensive income (loss): | ||||||||||||
Foreign currency translation adjustment | 287 | 232 | 519 | |||||||||
Comprehensive income (loss): | $ | (12,286 | ) | $ | (336 | ) | $ | (12,622 | ) | |||
8. Stock-Based Compensation
Options
The following table summarizes option activity for the three months ended March 31, 2016:
Number of Options | Weighted- Average Exercise Price | Weighted- Average Remaining Contractual Term (in years) | Aggregate Intrinsic Value (in thousands) | |||||||||
Outstanding at January 1, 2016 | 10,711,321 | $ | 6.16 | |||||||||
Granted | 233,123 | $ | 7.57 | |||||||||
Exercised | (128,969 | ) | $ | 0.56 | ||||||||
Forfeited | (88,022 | ) | $ | 10.87 | ||||||||
Expired | (12,808 | ) | $ | 10.64 | ||||||||
Outstanding at March 31, 2016 | 10,714,645 | $ | 6.21 | 7.6 | $ | 37,652 | ||||||
Exerciseable at March 31, 2016 | 5,581,014 | $ | 3.51 | 6.9 | $ | 29,147 | ||||||
Vested or expected to vest as of March 31, 2016 | 10,475,409 | $ | 6.10 | 7.6 | $ | 37,509 | ||||||
Total compensation cost related to unvested option awards not yet recognized as of March 31, 2016 was $19.1 million and will be recognized over a weighted-average period of approximately 2.6 years. The aggregate intrinsic value of employee options exercised during the three months ended March 31, 2016 and 2015 was $0.9 million and $6.1 million, respectively.
Restricted Stock Units
The following table summarizes activity in our restricted stock units ("RSUs") during the three months ended March 31, 2016:
14
Number of RSUs | Weighted-Average Grant Date Fair Value | |||||
Unvested at January 1, 2016 | 1,853,452 | $ | 12.85 | |||
RSUs granted | 1,239,210 | $ | 7.55 | |||
RSUs vested | — | — | ||||
RSUs forfeited/expired | (63,363 | ) | $ | 11.95 | ||
Unvested at March 31, 2016 | 3,029,299 | $ | 10.70 | |||
Expected to vest after March 31, 2016 | 2,226,867 | $ | 11.00 | |||
As of March 31, 2016, there was $28.6 million of unrecognized compensation cost related to unvested RSUs, which is expected to be recognized over the next 3.5 years.
Stock-based compensation expense related to stock options, RSUs and 2014 Employee Stock Purchase Plan are included in the following line items in our accompanying consolidated statements of operations for the three months ended March 31, 2016 and 2015 (in thousands):
Three Months Ended March 31, | |||||||
2016 | 2015 | ||||||
Sales and marketing | $ | 888 | $ | 575 | |||
Technology and analytics | 757 | 436 | |||||
Processing and servicing | 343 | 147 | |||||
General and administrative | 1,764 | 884 | |||||
Total | $ | 3,752 | $ | 2,042 | |||
15
9. Commitments and Contingencies
Concentrations of Credit Risk
Financial instruments that potentially subject us to significant concentrations of credit risk consist principally of cash, cash equivalents, restricted cash and loans. We hold cash, cash equivalents and restricted cash in accounts at regulated domestic financial institutions in amounts that exceed or may exceed FDIC insured amounts and at non-U.S. financial institutions where deposited amounts may be uninsured. We believe these institutions to be of acceptable credit quality and we have not experienced any related losses to date.
Contingencies
Two separate putative class actions were filed in August 2015 in the United States District Court for the Southern District of New York against us, certain of our executive officers, our directors and certain or all of the underwriters of our initial public offering. The suits allege that the registration statement and prospectus for our initial public offering contained materially false and misleading statements regarding, or failed to disclose, certain information in violation of the Securities Act of 1933, as amended. The suits seek a determination that the case is a proper class action and/or certification of the plaintiff as a class representative, rescission or a rescissory measure of damages and/or unspecified damages, interest, attorneys’ fees and other fees and costs. On February 18, 2016, the court issued an order (1) consolidating the two cases, (2) selecting the lead plaintiff and (3) appointing lead class counsel. On March 18, 2016, the lead plaintiff filed an amended complaint. On April 14, 2016, the court approved a schedule allowing the defendants 60 days to file a motion to dismiss, allowing the plaintiff to file any opposition within 60 days of the filing of the motion to dismiss and allowing the defendants to file a reply within 30 days after the filing of plaintiff’s opposition. We intend to defend ourselves vigorously in these consolidated matters, although at this time we cannot predict the outcome.
From time to time we are subject to other legal proceedings and claims in the ordinary course of business. The results of such matters cannot be predicted with certainty. However, we believe that the final outcome of any such current matters will not result in a material adverse effect on our consolidated financial condition, consolidated results of operations or consolidated cash flows.
16
Item 2. | Management’s Discussion and Analysis of Financial Condition and Results of Operations |
You should read the following discussion and analysis of our financial condition and results of operations together with our condensed consolidated financial statements and the related notes and other financial information included elsewhere in this report and in conjunction with our Annual Report on Form 10-K for the year ended December 31, 2015, as filed with the Securities and Exchange Commission, or SEC, on March 3, 2016. Some of the information contained in this discussion and analysis, including information with respect to our plans and strategy for our business, includes forward-looking statements that involve risks and uncertainties. You should review the “Cautionary Note Regarding Forward-Looking Statements” below for a discussion of important factors that could cause actual results to differ materially from the results described in or implied by the forward-looking statements contained in the following discussion and analysis.
CAUTIONARY NOTE REGARDING FORWARD-LOOKING STATEMENTS
This report contains forward-looking statements within the meaning of the Private Securities Litigation Reform Act of 1995 and other legal authority. These forward-looking statements concern our operations, economic performance, financial condition, goals, beliefs, future growth strategies, objectives, plans and current expectations.
Forward-looking statements appear throughout this report, including in Item 2. Management’s Discussion and Analysis of Financial Condition and Results of Operations. Forward-looking statements can generally be identified by words such as “will,” “enables,” “expects,” “allows,” "plans," “continues,” “believes,” “anticipates,” “estimates” or similar expressions.
Forward-looking statements are neither historical facts nor assurances of future performance. They are based only on our current beliefs, expectations and assumptions regarding the future of our business, anticipated events and trends, the economy and other future conditions. As such, they are subject to inherent uncertainties, risks and changes in circumstances that are difficult to predict and in many cases outside our control. Therefore, you should not rely on any of these forward-looking statements. Our expected results may not be achieved, and actual results may differ materially from our expectations.
Important factors that could cause or contribute to such differences include risks relating to: our ability to attract potential customers to our platform; the degree to which potential customers apply for loans, are approved and borrow from us; anticipated trends, growth rates and challenges in our business and in the markets in which we operate; the ability of our customers to repay loans and our ability to accurately assess credit worthiness; our ability to adequately reserve for loan losses; our continuing compliance measures related to our funding advisor channel and their impact; changes in our product distribution channel mix or our funding mix; our ability to anticipate market needs and develop new and enhanced offerings to meet those needs; interest rates and origination fees on loans; maintaining and expanding our customer base; the impact of competition in our industry and innovation by our competitors; our anticipated growth and growth strategies, including the possible introduction of new products and possible expansion into new international markets, and our ability to effectively manage that growth; our reputation and possible adverse publicity about us or our industry; the availability and cost of our funding; our failure to anticipate or adapt to future changes in our industry; our ability to hire and retain necessary qualified employees; the lack of customer acceptance or failure of our products; our ability to offer loans to our small business customers that have terms that are competitive with alternatives; our reliance on our third-party service providers; our ability to issue new loans to existing customers that seek additional capital; the evolution of technology affecting our offerings and our markets; our compliance with applicable local, state and federal and non-U.S. laws, rules and regulations and their application and interpretation, whether existing, modified or new; our ability to adequately protect our intellectual property; the effect of litigation or other disputes to which we are or may be a party; the increased expenses and administrative workload associated with being a public company; failure to maintain an effective system of internal controls necessary to accurately report our financial results and prevent fraud; our liquidity and working capital requirements; the estimates and estimate methodologies used in preparing our consolidated financial statements; the future trading prices of our common stock, the impact of securities analysts’ reports and shares eligible for future sale on these prices; our ability to prevent or discover security breaks, disruption in service and comparable events that could compromise the personal and confidential information held in our data systems, reduce the attractiveness of our platform or adversely impact our ability to service our loans; and other risks, including those described in "Item 1A. Risk Factors" in our Annual Report on Form 10-K and other documents that we file with the SEC from time to time which are available on the SEC website at www.sec.gov.
Except as required by law, we undertake no duty to update any forward-looking statements. Readers are also urged to carefully review and consider all of the information in this report, as well as the other documents we make available through the SEC’s website.
17
When we use the terms “OnDeck,” the “Company,” “we,” “us” or “our” in this report, we are referring to On Deck Capital, Inc. and its consolidated subsidiaries unless the context requires otherwise.
OnDeck, the OnDeck logo, OnDeck Score, OnDeck Marketplace and other trademarks or service marks of OnDeck appearing in this report are the property of OnDeck. Trade names, trademarks and service marks of other companies appearing in this report are the property of their respective holders. We have generally omitted the ®, ™ and other designations, as applicable, in this report.
18
Overview
We are a leading online platform for small business lending. We are seeking to transform small business lending by making it efficient and convenient for small businesses to access capital. Enabled by our proprietary technology and analytics, we aggregate and analyze thousands of data points from dynamic, disparate data sources to assess the creditworthiness of small businesses rapidly and accurately. Small businesses can apply for a term loan or line of credit on our website in minutes and, using our proprietary OnDeck Score®, we can make a funding decision immediately and transfer funds as fast as the same day. We have originated more than $4 billion of loans since we made our first loan in 2007. Our loan originations have increased at a compound annual growth rate of 60% from 2013 to 2015 and had a year-over-year growth rate of 37% for the first quarter of 2016.
We generate the majority of our revenue through interest income and fees earned on the term loans we retain. Our term loans are obligations of small businesses with fixed dollar repayments, which we offer in principal amounts ranging from $5,000 to $500,000 and with maturities of 3 to 36 months. Our lines of credit range from $6,000 to $100,000, and are repayable within six months of the date of the latest funds draw. We earn interest on the balance outstanding and lines of credit are subject to a monthly fee unless the customer makes a qualifying minimum draw, in which case it is waived for the first six months. In September 2015, in response to what we believe to be the unmet demand of larger, higher credit quality businesses, we began offering term loans up to $500,000 with terms as long as 36 months as compared to our previous limits of $250,000 and 24 months. We also increased the maximum size of our line of credit from $25,000 to $100,000. In October 2013, we began generating revenue by selling some of our term loans to third-party institutional investors through our OnDeck Marketplace®. The balance of our revenue comes from our servicing and other fee income, which primarily consists of fees we receive for servicing loans we have sold to third-party institutional investors and marketing fees from issuing bank partners.
We rely on a diversified set of funding sources for the capital we lend to our customers. Our primary source of this capital has historically been debt facilities with various financial institutions. As of March 31, 2016, we had $469.3 million of funding debt principal outstanding and $691.4 million total borrowing capacity under such debt facilities. During the first quarter of 2016 and 2015, we sold approximately $123.7 million and $94.9 million, respectively, of loans to OnDeck Marketplace investors. We completed our first securitization transaction in May 2014, pursuant to which we issued debt that is secured by a revolving pool of OnDeck small business loans. We raised approximately $175.0 million from this securitization transaction. In April 2016, we priced $250 million initial principal amount of asset-backed notes as part of our second securitization transaction which we expect to close in May 2016. We have also used proceeds from our stock financings and operating cash flow to fund loans in the past and continue to finance a portion of our outstanding loans with these funds. Of the total principal outstanding as of March 31, 2016, including our loans held for investment and loans held for sale, plus loans sold to OnDeck Marketplace investors which had a balance remaining as of March 31, 2016, 34% were funded via OnDeck Marketplace investors, 35% were funded via our debt warehouse facilities, 19% were financed via proceeds raised from our securitization transaction and 12% were funded via our own equity.
We originate loans throughout the United States, Canada and Australia, although, to date, substantially all of our revenue has been generated in the United States. These loans are originated through our direct marketing, including direct mail, social media and other online marketing channels. We also originate loans through our outbound sales team, referrals from our strategic partners, including banks, payment processors and small business-focused service providers, and through funding advisors who advise small businesses on available funding options.
Key Financial and Operating Metrics
We regularly monitor a number of metrics in order to measure our current performance and project our future performance. These metrics aid us in developing and refining our growth strategies and making strategic decisions. Beginning with the three months ended March 31, 2016, we refined the calculation of Effective Interest Yield, or EIY, and certain related definitions to reflect the substantial growth and impact of OnDeck Marketplace and to present EIY on a business day adjusted basis. In addition, effective January 1, 2016, we adopted a new requirement in accordance with accounting principles generally accepted in the United States of America, or GAAP, regarding the presentation of debt issuance costs. All revisions have been applied retrospectively.
19
As of or for the Three Months Ended March 31, | |||||||
2016 | 2015 | ||||||
(dollars in thousands) | |||||||
Originations | $ | 569,663 | $ | 415,977 | |||
Unpaid Principal Balance | $ | 651,970 | $ | 542,908 | |||
Average Loans | $ | 630,613 | $ | 534,506 | |||
Loans Under Management | $ | 981,627 | $ | 675,426 | |||
Effective Interest Yield | 34.5 | % | 37.6 | % | |||
Marketplace Gain on Sale Rate | 5.7 | % | 7.0 | % | |||
Average Funding Debt Outstanding | $ | 419,286 | $ | 385,611 | |||
Cost of Funds Rate | 5.5 | % | 5.2 | % | |||
Provision Rate | 5.8 | % | 7.2 | % | |||
Reserve Ratio | 9.5 | % | 10.5 | % | |||
15+ Day Delinquency Ratio | 5.7 | % | 8.4 | % | |||
Adjusted EBITDA | $ | (7,273 | ) | $ | (1,817 | ) | |
Adjusted Net Loss | $ | (8,821 | ) | $ | (3,301 | ) | |
Originations
Originations represent the total principal amount of the term loans we made during the period, plus the total amount drawn on lines of credit during the period. Many of our repeat customers renew their loans before their existing loan is fully repaid. In accordance with industry practice, originations of such repeat loans are presented as the full renewal loan principal, rather than the net funded amount, which would be the renewal loan’s principal net of the unpaid principal balance on the existing loan. Loans referred to, and funded by, our issuing bank partners and later purchased by us are included as part of our originations.
Unpaid Principal Balance
Unpaid Principal Balance represents the total amount of principal outstanding of term loans held for investment and amounts outstanding under lines of credit at the end of the period. It excludes net deferred origination costs, allowance for loan losses and any loans sold or held for sale at the end of the period.
Average Loans
Average Loans for the period is the average of the sum of loans held for investment and loans held for sale as of the beginning of the period and as of the end of each month in the period.
Loans Under Management
Loans Under Management represents the Unpaid Principal Balance plus the amount of principal outstanding of loans held for sale, excluding net deferred origination costs, plus the amount of principal outstanding of term loans we serviced for others at the end of the period.
Effective Interest Yield
Effective Interest Yield is the rate of return we achieve on loans outstanding during a period. It is calculated as our business day adjusted annualized interest income divided by Average Loans. Annualization is based on 252 business days per year, which is weekdays per year less U.S. Federal Reserve Bank holidays.
Net deferred origination costs in loans held for investment and loans held for sale consist of deferred origination fees and costs. Deferred origination fees include fees paid up front to us by customers when loans are funded and decrease the carrying value of loans, thereby increasing the Effective Interest Yield earned. Deferred origination costs are limited to costs directly attributable to originating loans such as commissions, vendor costs and personnel costs directly related to the time spent by the personnel performing activities related to loan origination and increase the carrying value of loans, thereby decreasing the Effective Interest Yield earned.
Recent pricing trends are discussed under the subheading "Key Factors Affecting Our Performance - Pricing."
Marketplace Gain on Sale Rate
Marketplace Gain on Sale Rate equals our gain on sale revenue from loans sold through OnDeck Marketplace divided by the carrying value of loans sold, which includes both unpaid principal balance sold and the remaining carrying value of the net
20
deferred origination costs. A portion of loans regularly sold through OnDeck Marketplace are or may be loans which were initially designated as held for investment upon origination. The portion of such loans sold in a given period may vary materially dependent upon market conditions and other circumstances.
Average Funding Debt Outstanding
Funding debt outstanding is the debt that we incur to support our lending activities and does not include our corporate debt. Average Funding Debt Outstanding for the period is the average of the funding debt outstanding as of the beginning of the period and as of the end of each month in the period. Additionally, in accordance with Financial Accounting Standards Board’s update to ASC 835-30, which was effective January 2016 and applied retrospectively, deferred debt issuance costs are presented as a direct deduction from the carrying value of the associated debt.
Cost of Funds Rate
Cost of Funds Rate is our funding cost, which is the interest expense, fees, and amortization of deferred debt issuance costs we incur in connection with our lending activities across all of our debt facilities, divided by Average Funding Debt Outstanding. For full years, it is calculated as our funding cost divided by Average Funding Debt Outstanding and for interim periods it is calculated as our annualized funding cost for the period divided by Average Funding Debt Outstanding.
Provision Rate
Provision Rate equals the provision for loan losses divided by the new originations volume of loans held for investment, net of originations of sales of such loans within the period. Because we reserve for probable credit losses inherent in the portfolio upon origination, this rate is significantly impacted by the expectation of credit losses for the period’s originations volume. This rate may also be impacted by changes in loss expectations for loans originated prior to the commencement of the period.
The denominator of the Provision Rate formula includes the new originations volume of loans held for investment, net of originations of sales of such loans within the period. However, the numerator reflects only the additional provision required to provide for loan losses on the net funded amount during such period. Therefore, all other things equal, an increased volume of loan rollovers and line of credit repayments and re-borrowings in a period will reduce the Provision Rate.
A portion of loans regularly sold through OnDeck Marketplace are or may be loans which were initially designated as held for investment upon origination. The portion of such loans sold in a given period may vary materially depending upon market conditions and other circumstances.
The Provision Rate is not directly comparable to the net cumulative lifetime charge-off ratio because (i) the Provision Rate reflects estimated losses at the time of origination while the net cumulative lifetime charge-off ratio reflects actual charge-offs, (ii) the Provision Rate includes provisions for losses on both term loans and lines of credit while the net cumulative lifetime charge-off ratio reflects only charge-offs related to term loans and (iii) the Provision Rate for a period reflects the provision for losses related to all loans held for investment while the net cumulative lifetime charge-off ratio reflects lifetime charge-offs of term loans related to a particular cohort of term loans.
Reserve Ratio
Reserve Ratio is our allowance for loan losses as of the end of the period divided by the Unpaid Principal Balance as of the end of the period.
15+ Day Delinquency Ratio
15+ Day Delinquency Ratio equals the aggregate Unpaid Principal Balance for our loans that are 15 or more calendar days past due as of the end of the period as a percentage of the Unpaid Principal Balance. The Unpaid Principal Balance for our loans that are 15 or more calendar days past due includes loans that are paying and non-paying. The majority of our loans require daily repayments, excluding weekends and holidays, and therefore may be deemed delinquent more quickly than loans from traditional lenders that require only monthly payments.
15+ Day Delinquency Ratio is not annualized, but reflects balances as of the end of the period.
Non-GAAP Financial Measures
We believe that the provision of non-GAAP metrics in this report can provide a useful measure for period-to-period comparisons of our core business and useful information to investors and others in understanding and evaluating our operating results. However, non-GAAP metrics are not calculated in accordance with GAAP, and should not be considered an alternative to any measures of financial performance calculated and presented in accordance with GAAP. Other companies may calculate these non-GAAP metrics differently than we do.
Adjusted EBITDA
21
Adjusted EBITDA represents our net (loss) income, adjusted to exclude interest expense associated with debt used for corporate purposes (rather than funding costs associated with lending activities), income tax expense, depreciation and amortization and stock-based compensation expense. Stock based compensation includes employee compensation as well as compensation to third-party service providers.
Our use of Adjusted EBITDA has limitations as an analytical tool, and you should not consider it in isolation or as a substitute for analysis of our results as reported under GAAP. Some of these limitations are:
• | although depreciation and amortization are non-cash charges, the assets being depreciated and amortized may have to be replaced in the future, and Adjusted EBITDA does not reflect cash capital expenditure requirements for such replacements or for new capital expenditure requirements; |
• | Adjusted EBITDA does not reflect changes in, or cash requirements for, our working capital needs; |
• | Adjusted EBITDA does not reflect the potentially dilutive impact of equity-based compensation; |
• | Adjusted EBITDA does not reflect interest associated with debt used for corporate purposes or tax payments that may represent a reduction in cash available to us; |
The following table presents a reconciliation of net loss to Adjusted EBITDA for each of the periods indicated:
Three Months Ended March 31, | |||||||
2016 | 2015 | ||||||
(in thousands) | |||||||
Adjusted EBITDA | |||||||
Net loss | $ | (13,141 | ) | $ | (5,343 | ) | |
Adjustments: | |||||||
Interest expense | 38 | 106 | |||||
Income tax expense | — | — | |||||
Depreciation and amortization | 2,078 | 1,378 | |||||
Stock-based compensation expense | 3,752 | 2,042 | |||||
Adjusted EBITDA | $ | (7,273 | ) | $ | (1,817 | ) | |
Adjusted Net Loss
Adjusted Net Loss represents our net loss adjusted to exclude stock-based compensation expense, each on the same basis and with the same limitations as described above for Adjusted EBITDA, and net loss attributable to noncontrolling interest.
The following table presents a reconciliation of net loss to Adjusted Net Loss for each of the periods indicated:
Three Months Ended March 31, | |||||||
2016 | 2015 | ||||||
(in thousands) | |||||||
Adjusted Net Loss | |||||||
Net loss | $ | (13,141 | ) | $ | (5,343 | ) | |
Adjustments: | |||||||
Net loss attributable to noncontrolling interest | 568 | — | |||||
Stock-based compensation expense | 3,752 | 2,042 | |||||
Adjusted Net Loss | $ | (8,821 | ) | $ | (3,301 | ) | |
22
Key Factors Affecting Our Performance
Originations
For the three months ended March 31, 2016, as compared to the three months ended March 31, 2015, the growth in originations was driven by business from existing and previous customers, increasing average loan size and the addition of new customers. During the first quarter of 2016 total originations grew 37%, as compared to the prior year period, to $569.7 million. In addition, during the first quarter of 2016 the outstanding balance of our lines of credit increased, and we expect them to drive a larger percentage of our originations as adoption and use of the lines of credit continues to grow. Line of credit originations made up 12.9% and 7.5% of total dollar originations in the first quarter of 2016 and 2015, respectively.
The number of weekends and holidays in a period can impact our business. Many small businesses tend to apply for loans on weekdays, and such businesses may be closed at least part of a weekend and on holidays. In addition, our loan fundings and automated customer loan repayments only occur on weekdays (excluding bank holidays).
We anticipate that our future growth will continue to depend, in part, on attracting new customers. We plan to continue our sales and marketing spending to attract these customers, while controlling for cost per customer acquisition, and we also plan to increase our analytics spending to better identify potential customers. We have historically relied on all three of our channels for customer acquisition but have become increasingly focused on growing our direct and strategic partner channels. Collective originations through our direct and strategic partner channels made up 73% and 68% of total originations from all customers for the three months ended March 31, 2016 and 2015, respectively. We plan to continue investing in direct marketing and sales, increasing our brand awareness and growing our strategic partnerships.
The following tables summarize the percentage of loans made to all customers originated by our three distribution channels for the periods indicated. From time to time, management is required to make judgments to determine customers' appropriate channel distribution.
Three Months Ended March 31, | |||||
Percentage of Originations (Number of Loans) | 2016 | 2015 | |||
Direct and Strategic Partner | 80.0 | % | 77.1 | % | |
Funding Advisor | 20.0 | % | 22.9 | % | |
Three Months Ended March 31, | |||||
Percentage of Originations (Dollars) | 2016 | 2015 | |||
Direct and Strategic Partner | 72.6 | % | 67.7 | % | |
Funding Advisor | 27.4 | % | 32.3 | % | |
We originate term loans and lines of credit to customers who are new to OnDeck as well as to repeat customers. We believe our ability to increase adoption of our offerings within our existing customer base will be important to our future growth. A component of our future growth will include increasing the length of our customer life cycle by expanding our offerings. We believe our significant number of repeat customers is primarily due to our high levels of customer service, our loyalty program (as further described below under the subheading "- Pricing") and continued improvement in products and services. Repeat customers generally comprise our highest quality loans, given that successful repayment of an initial loan is a positive indicator of future credit performance, and OnDeck has more data about a repeat loan applicant than a new loan applicant. From our 2013 customer cohort, customers who took at least three loans grew their revenue and bank balance, respectively, on average by 28% and 49% from their initial loan to their third loan. Similarly, from our 2014 customer cohort, customers who took at least three loans grew their revenue and bank balance, respectively, on average by 29% and 54%. In the first quarter of 2016, 21.3% percent of our origination volume from repeat customers was due to unpaid principal balance rolled from existing loans directly into such repeat originations. In order for a current customer to qualify for a new term loan while a term loan payment obligation remains outstanding, the customer must pass the following standards:
• | the business must be approximately 50% paid down on its existing loan; |
• | the business must be current on its outstanding OnDeck loan with no material delinquency history; and |
• | the business must be fully re-underwritten and determined to be of adequate credit quality. |
The extent to which we generate repeat business from our customers will be an important factor in our continued revenue growth and our visibility into future revenue. In conjunction with repeat borrowing activity, our customers also tend to increase their subsequent loan size compared to their initial loan size. In the fourth quarter of 2014, we introduced the ability for our customers to carry a term loan and line of credit concurrently, which we believe will continue to enhance our ability to generate repeat business going forward.
23
Pricing
Customer pricing is determined primarily based on the customer’s OnDeck Score, the loan term, the customer type (new or repeat) and origination channel. Loans originated through the direct and strategic partner channels are generally priced lower than loans originated through the funding advisor channel due to the higher commissions paid to funding advisors.
Our customers generally pay between $0.003 and $0.04 per month in interest for every dollar they borrow under one of our term loans, with the actual amount typically driven by the length of term of the particular loan. In general, our term loans have been primarily quoted in “Cents on Dollar,” or COD, and lines of credit are quoted in annual percentage rate, or APR. Given the use case and payback period associated with our shorter term offerings, we believe many of our customers prefer to understand pricing on a “dollars in, dollars out” basis and are primarily focused on total payback cost.
We believe that our pricing has historically fallen between traditional bank loans to small businesses and certain non-bank small business financing alternatives such as merchant cash advances. The weighted average pricing on our originations has declined over time as measured by both average “Cents on Dollar” borrowed per month and APR as shown in the table below.
Q1 2016 | Q4 2015 | Q3 2015 | Q2 2015 | Q1 2015 | 2014 | 2013 | |
Weighted Average Term Loan "Cents on Dollar" Borrowed, per Month | 1.78¢ | 1.82¢ | 1.86¢ | 2.04¢ | 2.15¢ | 2.32¢ | 2.65¢ |
Weighted Average APR - Term Loans and Lines of Credit | 40.6% | 41.4% | 42.7% | 46.5% | 49.3% | 54.4% | 63.4% |
The weighted average APR for term loans and lines of credit has declined over the past years. For the three months ended March 31, 2016 and 2015, the weighted average APR for term loans and lines of credit was 40.6% and 49.3%, respectively. We attribute this pricing shift to longer average loan term lengths, increased originations from our lower cost direct and strategic partner channels as a percentage of total originations, the growth of our line of credit offering which is generally priced at lower APR levels than our term loans, and the introduction of our customer loyalty program in the first half of 2015. Our customer loyalty program reduces interest rates for qualifying repeat customers, who historically have exhibited stronger credit characteristics than new customers, demonstrated successful loan history by paying down previous loans and generated stronger unit economics in part due to the lower customer acquisition cost, or CAC, of a repeat customer. This aligns with our goal of building long-term relationships with our customers.
"Cents on Dollar" borrowed reflects the total interest to be paid by a customer to us for each dollar of principal borrowed, and does not include the loan origination fee. As of March 31, 2016, the APRs of our term loans outstanding ranged from 6.0% to 98.3% and the APRs of our lines of credit outstanding ranged from 11.0% to 36.0%. Because many of our loans are short term in nature and APR is calculated on an annualized basis, we believe that small business customers tend to understand and evaluate term loans, especially those of a year or less, primarily on a COD borrowed basis rather than APR. While annualized rates like APR may help a borrower compare loans of similar duration, an annualized rate may be less useful, especially for loans of 12 months or less, because it is sensitive to duration. For loans of 12 months or less, small differences in loan term can yield large changes in the associated APR, which makes comparisons and understanding of total interest cost more difficult. We believe that for such short-term loans, COD, or similar cost measures that provide total interest expense, give a borrower important information to understand and compare loans, and make an educated decision. Despite these limitations, we are pursuing an initiative to increase disclosure standardization of pricing and comparison terms in our industry, including through inclusion of an APR metric, in order to help small business customers assess and compare their credit options. We are also providing APRs for prior periods as supplemental information for comparative purposes. Historically, we have not used APR as an internal metric to evaluate performance of our business or as a basis to compensate our employees or to measure their performance. The interest on commercial business loans is also tax deductible as permitted by law compared to typical personal loans which do not provide a tax deduction. APR does not give effect to the small business customer’s possible tax deductions and cash savings associated with business related interest expenses.
We consider EIY as a key pricing metric. EIY is the rate of return we achieve on loans outstanding during a period. Our EIY differs from APR in that it takes into account deferred origination fees and deferred origination costs. Deferred origination fees include fees paid up front to us by customers when loans are funded and decrease the carrying value of loans, thereby increasing the EIY. Deferred origination costs are limited to costs directly attributable to originating loans such as commissions, vendor costs and personnel costs directly related to the time spent by the personnel performing activities related to loan origination and increase the carrying value of loans, thereby decreasing the EIY.
In addition to individual loan pricing and the number of days in a period, there are many other factors that can affect EIY, including:
24
• | Channel Mix - In general, loans originated from the direct and strategic partner channels have lower EIYs than loans from the funding advisor channel primarily due to their lower rates, lower acquisition costs and lower loss rates. The direct and strategic partner channels have, in the aggregate, made up 73% and 68% of total originations during the three months ended March 31, 2016 and 2015, respectively. We expect the direct and strategic partner channels to continue to grow as a percentage of the overall channel mix as we continue to focus on growing these historically higher-quality originations. |
• | Term Mix - In general, term loans with longer durations have lower annualized interest rates. Despite lower EIYs, total revenues from customers with longer loan durations are typically higher than the revenue of customers with shorter-term, higher EIY loans because total payback is typically higher compared to a shorter length term for the same principal loan amount. Since the introduction of our 24-month and 36-month term loans, the average length of term loan originations has increased to 13.2 from 11.9 months for the three months ended March 31, 2016 and March 31, 2015, respectively. |
• | Customer Type Mix - In general, loans originated from repeat customers have lower EIYs than loans from new customers. This is primarily due to the fact that repeat customers typically have a higher OnDeck Score and are therefore deemed to be lower risk. In addition, repeat customers are more likely to be approved for longer terms than new customers given their established payment history and lower risk profiles. Finally, origination fees are generally reduced or waived and rates are lower for repeat customers due to our loyalty program, contributing to lower EIYs. Our level of repeat customer originations in the first quarter of 2016 remains comparable to those seen in 2015. |
• | Product Mix - In general, loans originated from line of credit customers have lower EIYs than loans from term loan customers. This is primarily due to the fact that lines of credit are expected to have longer lifetime usage than term loans, enabling more time to recoup upfront acquisition costs. For the first quarter of 2016, the average line of credit APR was 30.7%, compared to the average term loan APR which was 41.1%. Further, draws from line of credit customers have increased to 12.9% from 7.5% of total originations in the first quarter of 2016 and 2015, respectively. |
• | Competition - As new online and alternative lenders have entered the market, there has been an increased volume of direct marketing to potential borrowers and increased competition for responses to those direct marketing efforts. Competitors may attempt to obtain new customers by pricing term loans and lines of credit below prevailing market rates. This could cause downward pricing pressure as these new entrants attempt to win new customers even at the cost of pricing loans below market rates, or even at rates resulting in net losses to them. While we recognize that there has been increased competition in the market of small business loans, we believe only a small portion of our period over period EIY decline is a result of increased competition. |
Since 2013, as part of our continuing initiative to reduce pricing while controlling risk, our EIY has generally declined. More recently, our EIY has stabilized over the past three quarters, as demonstrated below.
Effective Interest Yield | |||||||||||||
Q1 2016 | Q4 2015 | Q3 2015 | Q2 2015 | Q1 2015 | |||||||||
34.5 | % | 34.2 | % | 34.8 | % | 35.9 | % | 37.6 | % | ||||
Although we have seen an increase in EIY from the three months ended December 31, 2015 to the three months ended March 31, 2016, we expect EIY to continue to decline as our originations continue to shift towards our direct and strategic partner channels and lines of credit continue to grow as a percentage of total originations. Over the longer term, we expect the decline to be at a more gradual pace than has occurred historically.
Sale of Whole Loans through OnDeck Marketplace
We sell whole loans to institutional investors through OnDeck Marketplace. Marketplace originations are defined as loans that are sold through OnDeck Marketplace in the period or are held for sale at the end of the period. For the three months ended March 31, 2016 and 2015, approximately 25.9% and 24.4%, respectively, of total term loan originations were designated as Marketplace originations, which resulted in $123.7 million and $94.9 million of loans sold, respectively. We have the ability to fund our originations through a variety of funding sources, including OnDeck Marketplace. Due to the flexibility of our hybrid funding model, management has the ability to exercise judgment to adjust the percentage of term loans originated through OnDeck Marketplace considering numerous factors including the premiums available to us. During the three months ended March 31, 2016, premiums available to us decreased. Our model's flexibility allowed us to reduce the volume of Marketplace originations to 25.9% for the three months ended March 31, 2016 compared to 39.8% for the three months ended December 31, 2015. The lower premiums available during the three months ended March 31, 2016 resulted in a Marketplace Gain on Sale Rate of 5.7% compared to 9.0% for the three months ended December 31, 2015 and 7.0% for the three months ended March 31, 2015.
The degree to which we sell loans through OnDeck Marketplace largely depends on the premiums available to us. To the extent our use of OnDeck Marketplace as a funding source increases or decreases in the future, our gross revenue and net revenue co
25
uld be materially affected. The sale of whole loans generates gain on sales of loans which is recognized in the period the loan is sold. In contrast, holding loans on balance sheet generates interest income and funding costs over the term of the loans and generally generates a provision for loan loss expense in the period of origination.
Our Marketplace originations come from one of the following two origination sources:
• | New loans which are designated at origination to be sold, referred to as "Originations of loans held for sale;" and |
• | Loans which were originally designated as held for investment that are subsequently designated to be sold at the time of their renewal and which are considered modified loans, referred to as "Originations of loans held for investment, modified;" |
The following table summarizes the initial principal of originations of the aforementioned two sources as it relates to the statement of cash flows during the first quarter of 2016 and 2015:
Three Months Ended March 31, | |||||||
(in thousands) | |||||||
2016 | 2015 | ||||||
Originations of loans held for sale | $ | 111,878 | $ | 93,926 | |||
Originations of loans held for investment, modified | 16,364 | — | |||||
Marketplace originations | $ | 128,242 | $ | 93,926 | |||
Customer Acquisition Costs
Our CACs differ depending upon the acquisition channel. CACs in our direct channel include the commissions paid to our internal salesforce and expenses associated with items such as direct mail, social media and other online marketing activities. CACs in our strategic partner channel include commissions paid to our internal salesforce and strategic partners. CACs in our funding advisor channel include commissions paid to our internal salesforce and funding advisors. CACs in all channels include new originations as well as renewals. Compared to 2015, our CACs in the strategic partner channel and funding advisor channel in the first quarter of 2016 have declined as a percentage of total originations from the respective channels. The improvement in these channels is attributable to the reduction in external commissions paid. Our direct channel CACs have also declined as a percentage of originations as a result of the increasing scale of our operations, improvements in customer targeting, introduction of our line of credit product, the addition of pre-qualifications to our marketing outreach and increased renewal activity. Increased competition for customer response could require us to incur higher customer acquisition costs and make it more difficult for us to grow our loan originations in both unit and volume for both new as well as repeat customers.
Customer Lifetime Value
The ongoing lifetime value of our customers will be an important component of our future performance. We analyze customer lifetime value not only by tracking the “contribution” of customers over their lifetime with us, but also by comparing this contribution to the acquisition costs incurred in connection with originating such customers’ initial loans. We define the contribution to include the interest income and fees collected on a cohort of customers’ initial and repeat loans less acquisition costs for their repeat loans, estimated third party processing and servicing expenses for their initial and repeat loans, estimated funding costs (excluding any cost of equity capital) for their initial and repeat loans, and charge-offs of their initial and repeat loans. Comparing the customer lifetime value for cohorts in 2013 and 2014 against like periods, we have observed later cohorts generally exhibit improved return on investment due to economies of scale and improved efficiencies in marketing, cost of funds and processing and servicing costs, as well as credit improvements which resulted in larger average loan sizes.
In the future, we may incur greater marketing expenses to acquire new customers, we may decide to offer term loans with lower interest rates, our charge-offs may increase and our customers’ repeat purchase behavior may change, any of which could adversely impact our customers’ lifetime values to us and our operating results.
Historical Charge-Offs
We illustrate below our historical loan losses by providing information regarding our net lifetime charge-off ratios by cohort. Net lifetime charge-offs are the unpaid principal balances charged off less recoveries of loans previously charged off. A given cohort’s net lifetime charge-off ratio equals the cohort’s net lifetime charge-offs through March 31, 2016 divided by the cohort’s total original loan volume. Repeat loans in both the numerator and denominator include the full renewal loan principal amount, rather than the net funded amount, which is the renewal loan’s principal amount net of the unpaid principal balance on the existing loan. Loans are typically charged off after 90 days of nonpayment. The chart below includes all term loan originations, regardless of funding source, including loans sold through our OnDeck Marketplace or held for sale on our balance sheet.
26
Net Charge-off Ratios by Cohort Through March 31, 2016

2012 | 2013 | 2014 | Q1 2015 | Q2 2015 | Q3 2015 | Q4 2015 | Q1 2016 | |
Principal Outstanding as of March 31, 2016 | —% | —% | 0.5% | 4.0% | 9.9% | 28.0% | 60.4% | 87.7% |
The following charts display the historical lifetime cumulative net charge-off ratios, by origination year. The charts reflect all term loan originations, regardless of funding source, including loans sold through our OnDeck Marketplace or held for sale on our balance sheet. The data is shown as a static pool for annual cohorts, illustrating how the cohort has performed given equivalent months of seasoning.
Further, given our loans are typically charged off after 90 days of nonpayment, all cohorts reflect approximately 0% for the first four months in the below charts.
27
Net Cumulative Lifetime Charge-off Ratios
All Loans
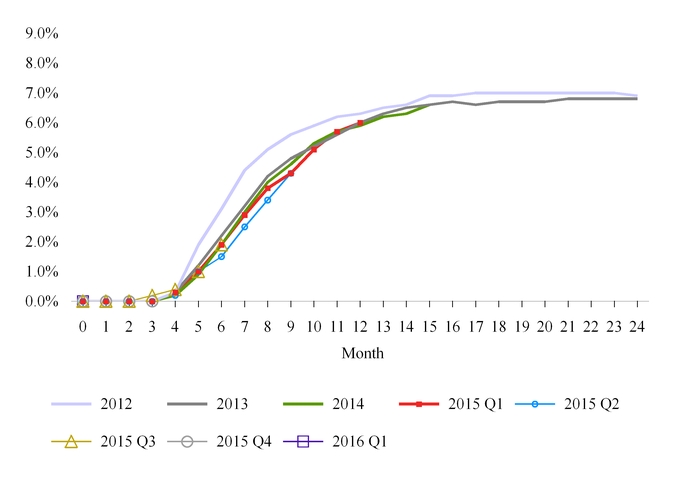
Originations | 2012 | 2013 | 2014 | Q1 2015 | Q2 2015 | Q3 2015 | Q4 2015 | Q1 2016 | ||||||||||||||||
All term loans (in thousands) | $ | 173,246 | $ | 455,931 | $ | 1,100,957 | $ | 384,703 | $ | 381,490 | $ | 438,017 | $ | 499,407 | $ | 495,956 | ||||||||
Weighted average term (months) | 9.2 | 10.0 | 11.2 | 11.9 | 11.9 | 12.3 | 13.2 | 13.2 | ||||||||||||||||
Economic Conditions
Changes in the overall economy may impact our business in several ways, including demand for our loans, credit performance, and funding costs.
• | Demand for Our Loans. In a strong economic climate, demand for our loans may increase as consumer spending increases and small businesses seek to expand. In addition, more potential customers may meet our underwriting requirements to qualify for a loan. At the same time, small businesses may experience improved cash flow and liquidity resulting in fewer customers requiring loans to manage their cash flows. In that climate, traditional lenders may also approve loans for a higher percentage of our potential customers. In a weakening economic climate or recession, the opposite may occur. |
• | Credit Performance. In a strong economic climate, our customers may experience improved cash flow and liquidity, which may result in lower loan losses. In a weakening economic climate or recession, the opposite may occur. We factor economic conditions into our loan underwriting analysis and reserves for loan losses, but changes in economic conditions, particularly sudden changes, may affect our actual loan losses. These effects may be partially mitigated by the short-term nature and repayment structure of our loans, which should allow us to react more quickly than if the terms of our loans were longer. |
• | Loan Losses. Our underwriting process is designed to limit our loan losses to levels compatible with our business strategy and financial model. Our aggregate loan loss rates from 2012 through the first quarter of 2016 have been consistent with our financial targets. Our overall loan losses are affected by a variety of factors, including external factors such as prevailing |
28
economic conditions, general small business sentiment and unusual events such as natural disasters, as well as internal factors such as the accuracy of the OnDeck Score, the effectiveness of our underwriting process and the introduction of new offerings, such as our line of credit, with which we have less experience to draw upon when forecasting their loss rates. Our loan loss rates may vary in the future.
• | Funding Costs. Changes in macroeconomic conditions may affect generally prevailing interest rates, and such effects may be amplified or reduced by other factors such as fiscal and monetary policies, economic conditions in other markets and other factors. Interest rates may also change for reasons unrelated to economic conditions. To the extent that interest rates rise, our funding costs will increase and the spread between our EIY and our Cost of Funds Rate may narrow to the extent we cannot correspondingly increase the payback rates we charge our customers. Given the current credit environment and increases in interest rate benchmarks, we believe that our Cost of Funds Rate may increase in future periods. |
Components of Our Results of Operations
Revenue
Interest Income. We generate revenue primarily through interest and origination fees earned on the term loans we originate and, to a lesser extent, interest earned on lines of credit. Interest income also includes interest income earned on loans held for sale from the time the loan is originated to when it is ultimately sold as well as other miscellaneous interest income. Our interest and origination fee revenue is amortized over the term of the loan using the effective interest method. Origination fees collected but not yet recognized as revenue are netted with direct origination costs and recorded as a component of loans held for investment or loans held for sale, as appropriate, on our consolidated balance sheets and recognized over the term of the loan. Direct origination costs include costs directly attributable to originating a loan, including commissions, vendor costs and personnel costs directly related to the time spent by those individuals performing activities related to loan origination.
Gain on Sales of Loans. We sell term loans to third-party institutional investors through OnDeck Marketplace. We recognize a gain or loss on the sale of such loans as the difference between the proceeds received, adjusted for initial recognition of servicing assets or liabilities obtained at the date of sale, and the outstanding principal and net deferred origination costs.
Other Revenue. Other revenue includes servicing revenue related to loans previously sold, fair value adjustments to servicing rights, monthly fees charged to customers for our line of credit, and marketing fees earned from our issuing bank partners, which are recognized as the related services are provided.
Cost of Revenue
Provision for Loan Losses. Provision for loan losses consists of amounts charged to income during the period to maintain an allowance for loan losses, or ALLL, estimated to be adequate to provide for probable credit losses inherent in our existing loan portfolio. Our ALLL represents our estimate of the expected credit losses inherent in our portfolio of term loans and lines of credit and is based on a variety of factors, including the composition and quality of the portfolio, loan specific information gathered through our collection efforts, delinquency levels, our historical charge-off and loss experience and general economic conditions. We expect our aggregate provision for loan losses to increase in absolute dollars as the amount of term loans and lines of credit we originate and hold for investment increases.
Funding Costs. Funding costs consist of the interest expense we pay on the debt we incur to fund our lending activities, certain fees and the amortization of deferred debt issuance costs incurred in connection with obtaining this debt, such as banker fees, origination fees and legal fees. Such costs are expensed immediately upon early extinguishment of the related debt. Our Cost of Funds Rate will vary based on a variety of external factors, such as credit market conditions, general interest levels and interest rate spreads, as well OnDeck-specific factors, such as the increased volume and variation in our originations. We expect that our funding costs will continue to increase in absolute dollars in the near future as we incur additional debt to support future term loan and line of credit originations, and we currently expect our Cost of Funds Rate will also increase in future periods.
Operating Expense
Operating expense consists of sales and marketing, technology and analytics, processing and servicing, and general and administrative expenses. Salaries and personnel-related costs, including benefits, bonuses and stock-based compensation expense, comprise a significant component of each of these expense categories. We expect our stock-based compensation expense to increase in the future. The number of employees was 684 and 638 at March 31, 2016 and December 31, 2015, respectively. We expect to continue to hire new employees in order to support our growth strategy, however, we expect the rate of employee growth to decline compared to prior periods. All operating expense categories also include an allocation of overhead, such as rent and other overhead, which is based on employee headcount.
29
Sales and Marketing. Sales and marketing expense consists of salaries and personnel-related costs of our sales and marketing and business development employees, as well as direct marketing and advertising costs, online and offline CACs (such as direct mail, paid search and search engine optimization costs), public relations, radio and television advertising, promotional event programs and sponsorships, corporate communications and allocated overhead. We expect our sales and marketing expense to increase in absolute dollars in the foreseeable future as we further increase the number of sales and marketing professionals and increase our marketing activities in order to continue to expand our direct customer acquisition efforts and build our brand. Future sales and marketing expense may include the expense associated with warrants issued to a strategic partner if performance conditions are met as described in Note 9 of Notes to Consolidated Financial Statements contained in our Annual Report on Form 10-K for the year ended December 31, 2015.
Technology and Analytics. Technology and analytics expense consists primarily of the salaries and personnel-related costs of our engineering and product employees as well as our credit and analytics employees who develop our proprietary credit-scoring models. Additional expenses include third-party data acquisition expenses, professional services, consulting costs, expenses related to the development of new products and technologies and maintenance of existing technology assets, amortization of capitalized internal-use software costs related to our technology platform and allocated overhead. We believe continuing to invest in technology is essential to maintaining our competitive position, and we expect these costs to rise in the near term on an absolute dollar basis.
Processing and Servicing. Processing and servicing expense consists primarily of salaries and personnel related costs of our credit analysis, underwriting, funding, fraud detection, customer service and collections employees. Additional expenses include vendor costs associated with third-party credit checks, lien filing fees and other costs to evaluate, close and fund loans and overhead costs. We anticipate that our processing and servicing expense will rise in absolute dollars as we grow originations.
General and Administrative. General and administrative expense consists primarily of salary and personnel-related costs for our executive, finance and accounting, legal and people operations employees. Additional expenses include a provision for the unfunded portion of our lines of credit, consulting and professional fees, insurance, legal, occupancy, travel, gain or loss on foreign exchange and other corporate expenses. Subsequent to our initial public offering, these expenses also include costs associated with compliance with the Sarbanes-Oxley Act and other regulations governing public companies, directors’ and officers’ liability insurance and increased accounting costs. We anticipate that our general and administrative expense will increase in absolute dollars as we continue to grow and expand our operations but will decline as a percentage of gross revenue over the longer term.
Other (Expense) Income
Interest Expense. Interest expense consists of interest expense and amortization of deferred debt issuance costs incurred on debt associated with our corporate activities. It does not include interest expense incurred on debt associated with our lending activities.
Provision for Income Taxes
Provision for income taxes consists of U.S. federal, state and foreign income taxes, if any. Through December 31, 2015, we have not been required to pay U.S. federal or state income taxes nor any foreign taxes because of our current and accumulated net operating losses. As of December 31, 2015, we had $50.6 million of federal net operating loss carryforwards and $49.8 million of state net operating loss carryforwards available to reduce future taxable income, unless limited due to historical or future ownership changes. The federal net operating loss carryforwards will begin to expire at various dates beginning in 2027.
The Internal Revenue Code of 1986, as amended, or the Code, imposes substantial restrictions on the utilization of net operating losses and other tax attributes in the event of an “ownership change” of a corporation. Events which may cause limitation in the amount of the net operating losses and other tax attributes that are able to be utilized in any one year include, but are not limited to, a cumulative ownership change of more than 50% over a three-year period, which has occurred as a result of historical ownership changes. Accordingly, our ability to use pre-change net operating loss and certain other attributes are limited as prescribed under Sections 382 and 383 of the Code. Therefore, if we earn net taxable income in the future, our ability to reduce our federal income tax liability with our existing net operating losses is subject to limitation. Future offerings, as well as other future ownership changes that may be outside our control could potentially result in further limitations on our ability to utilize our net operating loss and tax attributes. Accordingly, achieving profitability may not result in a full release of the valuation allowance.
As of December 31, 2015, a full valuation allowance of $32.0 million was recorded against our net deferred tax assets.
Results of Operations
The following table summarizes our results of operations for the periods presented and as a percentage of our total revenue for those periods. The period-to-period comparison of results is not necessarily indicative of results for future periods. Unless
30
expressly stated otherwise, all comparisons and variance explanations are related to the first quarter of 2016 as compared to the first quarter of 2015.
Comparison of Years Ended March 31, 2016 and 2015
Three Months Ended March 31, | ||||||||||||||||||||
Period-to-Period | ||||||||||||||||||||
2016 | 2015 | Change | ||||||||||||||||||
Amount | Percentage of Gross Revenue | Amount | Percentage of Gross Revenue | Amount | Percentage | |||||||||||||||
(dollars in thousands) | ||||||||||||||||||||
Revenue: | ||||||||||||||||||||
Interest income | $ | 53,479 | 85.4 | % | $ | 48,699 | 86.3 | % | $ | 4,780 | 9.8 | % | ||||||||
Gain on sales of loans | 7,111 | 11.4 | 6,679 | 11.8 | 432 | 6.5 | ||||||||||||||
Other revenue | 2,025 | 3.2 | 1,080 | 1.9 | 945 | 87.5 | ||||||||||||||
Gross revenue | 62,615 | 100.0 | 56,458 | 100.0 | 6,157 | 10.9 | ||||||||||||||
Cost of revenue: | ||||||||||||||||||||
Provision for loan losses | 25,437 | 40.6 | 23,101 | 40.9 | 2,336 | 10.1 | ||||||||||||||
Funding costs | 5,722 | 9.1 | 5,045 | 8.9 | 677 | 13.4 | ||||||||||||||
Total cost of revenue | 31,159 | 49.8 | 28,146 | 49.9 | 3,013 | 10.7 | ||||||||||||||
Net revenue | 31,456 | 50.2 | 28,312 | 50.1 | 3,144 | 11.1 | ||||||||||||||
Operating expenses: | ||||||||||||||||||||
Sales and marketing | 16,548 | 26.4 | 12,675 | 22.5 | 3,873 | 30.6 | ||||||||||||||
Technology and analytics | 14,087 | 22.5 | 8,587 | 15.2 | 5,500 | 64.1 | ||||||||||||||
Processing and servicing | 4,215 | 6.7 | 2,703 | 4.8 | 1,512 | 55.9 | ||||||||||||||
General and administrative | 9,709 | 15.5 | 9,584 | 17.0 | 125 | 1.3 | ||||||||||||||
Total operating expenses | 44,559 | 71.2 | 33,549 | 59.4 | 11,010 | 32.8 | ||||||||||||||
Loss from operations | (13,103 | ) | (20.9 | ) | (5,237 | ) | (9.3 | ) | (7,866 | ) | (150.2 | ) | ||||||||
Other (expense) income: | ||||||||||||||||||||
Interest expense | (38 | ) | (0.1 | ) | (106 | ) | (0.2 | ) | 68 | (64.2 | ) | |||||||||
Total other (expense) income: | (38 | ) | (0.1 | ) | (106 | ) | (0.2 | ) | 68 | (64.2 | ) | |||||||||
Loss before provision for income taxes | (13,141 | ) | (21.0 | ) | (5,343 | ) | (9.5 | ) | (7,798 | ) | 145.9 | |||||||||
Provision for income taxes | — | — | — | — | — | — | ||||||||||||||
Net loss | $ | (13,141 | ) | (21.0 | )% | $ | (5,343 | ) | (9.5 | )% | $ | (7,798 | ) | 145.9 | % | |||||
31
Revenue
Three Months Ended March 31, | ||||||||||||||||||||
Period-to-Period | ||||||||||||||||||||
2016 | 2015 | Change | ||||||||||||||||||
Amount | Percentage of Gross Revenue | Amount | Percentage of Gross Revenue | Amount | Percentage | |||||||||||||||
(dollars in thousands) | ||||||||||||||||||||
Revenue: | ||||||||||||||||||||
Interest income | $ | 53,479 | 85.4 | % | $ | 48,699 | 86.3 | % | $ | 4,780 | 9.8 | % | ||||||||
Gain on sales of loans | 7,111 | 11.4 | 6,679 | 11.8 | 432 | 6.5 | ||||||||||||||
Other revenue | 2,025 | 3.2 | 1,080 | 1.9 | 945 | 87.5 | ||||||||||||||
Gross revenue | $ | 62,615 | 100.0 | % | $ | 56,458 | 100.0 | % | $ | 6,157 | 10.9 | % | ||||||||
Gross revenue increased by $6.2 million, or 11%, from $56.5 million in the first quarter of 2015 to $62.6 million in first the quarter of 2016. This growth was in part attributable to a $4.8 million, or 9.8%, increase in interest income, which was primarily driven by the increase in Average Loans which increased 18% to $630.6 million from $534.5 million. The increase in originations was partially offset by a decline in our EIY on loans outstanding from 37.6% to 34.5% over the same period.
Gain on sales of loans increased by $0.4 million, from $6.7 million to $7.1 million. This increase was primarily attributable to a $28.8 million increase in sales of loans through OnDeck Marketplace, offset by a decrease in Marketplace Gain on Sale Rate from 7.0% to 5.7%.
Other revenue increased $0.9 million, or 88%, mostly attributable to an increase of $0.3 million in marketing fees from our issuing bank partners and an increase of $0.3 million in fees earned from lines of credit as lines of credit increased from 7.5% of originations to 12.9%.
Cost of Revenue
Three Months Ended March 31, | ||||||||||||||||||||
Period-to-Period | ||||||||||||||||||||
2016 | 2015 | Change | ||||||||||||||||||
Amount | Percentage of Gross Revenue | Amount | Percentage of Gross Revenue | Amount | Percentage | |||||||||||||||
(dollars in thousands) | ||||||||||||||||||||
Cost of revenue: | ||||||||||||||||||||
Provision for loan losses | $ | 25,437 | 40.6 | % | $ | 23,101 | 40.9 | % | $ | 2,336 | 10.1 | % | ||||||||
Funding costs | 5,722 | 9.1 | 5,045 | 8.9 | 677 | 13.4 | ||||||||||||||
Total cost of revenue | $ | 31,159 | 49.8 | % | $ | 28,146 | 49.9 | % | $ | 3,013 | 10.7 | % | ||||||||
Provision for Loan Losses. Provision for loan losses increased by $2.3 million, or 10%, from $23.1 million in the first quarter of 2015 to $25.4 million in the first quarter of 2016. This increase was primarily attributable to the increase in originations of term loans and lines of credit originated and held for investment. In accordance with GAAP, we recognize revenue on loans over their term, but provide for probable credit losses on the loans at the time they are originated. We then periodically adjust our estimate of those probable credit losses based on actual performance and changes in loss expectations. As a result, we believe that analyzing provision for loan losses as a percentage of originations, rather than as a percentage of gross revenue, provides more useful insight into our operating performance. Our provision for loan losses as a percentage of originations held for investment, or the Provision Rate, decreased from 7.2% to 5.8%. The decrease was related to improvements in the portfolio performance, an increase in loan rollovers and line of credit repayments and re-borrowings and a more predictive OnDeck Score, partially offset by the origination of longer average term loans and the increase of originations of our line of credit product.
Funding Costs. Funding costs increased by $0.7 million, or 13%, from $5.0 million in the first quarter of 2015 to $5.7 million in the first quarter of 2016. The increase in funding costs was primarily attributable to the increases in our aggregate outstanding borrowings, growth of our partner synthetic participation program and the increase in unused commitment fees. The average
32
balance of our funding debt facilities in the first quarter of 2016 was $419.3 million as compared to the average balance of $385.6 million during 2015. As a percentage of gross revenue, funding costs increased from 8.9% to 9.1%. The increase in funding costs as a percentage of gross revenue was primarily the result of the decrease in our EIY, higher partner synthetic participation program impact and higher unused commitment fees. Additionally, our Cost of Funds Rate increased from 5.2% to 5.5% for the same reasons.
Operating Expense
Sales and Marketing
Three Months Ended March 31, | ||||||||||||||||||||
Period-to-Period | ||||||||||||||||||||
2016 | 2015 | Change | ||||||||||||||||||
Amount | Percentage of Gross Revenue | Amount | Percentage of Gross Revenue | Amount | Percentage | |||||||||||||||
(dollars in thousands) | ||||||||||||||||||||
Sales and marketing | $ | 16,548 | 26.4 | % | $ | 12,675 | 22.5 | % | $ | 3,873 | 30.6 | % | ||||||||
Sales and marketing expense increased by $3.9 million, or 31%, from $12.7 million in the first quarter of 2015 to $16.5 million in the first quarter of 2016. The increase was in part attributable to a $2.2 million increase in direct marketing, general marketing and advertising costs as we expanded our marketing programs to drive increased customer acquisition and brand awareness. In addition, we incurred a $1.6 million increase in salaries and personnel-related cost as we expanded our sales and marketing departments to meet our growing needs.
Technology and Analytics
Three Months Ended March 31, | ||||||||||||||||||||
Period-to-Period | ||||||||||||||||||||
2016 | 2015 | Change | ||||||||||||||||||
Amount | Percentage of Gross Revenue | Amount | Percentage of Gross Revenue | Amount | Percentage | |||||||||||||||
(dollars in thousands) | ||||||||||||||||||||
Technology and analytics | $ | 14,087 | 22.5 | % | $ | 8,587 | 15.2 | % | $ | 5,500 | 64.1 | % | ||||||||
Technology and analytics expense increased by $5.5 million, or 64%, from $8.6 million in the first quarter of 2015 to $14.1 million in the first quarter of 2016. The increase was primarily attributable to a $3.5 million increase in salaries and personnel-related costs, as we increased the number of technology personnel developing our platform, as well as analytics personnel to further improve upon algorithms underlying the OnDeck Score. We incurred a $0.8 million increase in technology-related consulting expense, a $0.7 million increase in information technology security expense, non-capitalizable technology supplies and software licenses and a $0.5 million increase in amortization of capitalized internal-use software costs related to our technology platform.
Processing and Servicing
Three Months Ended March 31, | ||||||||||||||||||||
Period-to-Period | ||||||||||||||||||||
2016 | 2015 | Change | ||||||||||||||||||
Amount | Percentage of Gross Revenue | Amount | Percentage of Gross Revenue | Amount | Percentage | |||||||||||||||
(dollars in thousands) | ||||||||||||||||||||
Processing and servicing | $ | 4,215 | 6.7 | % | $ | 2,703 | 4.8 | % | $ | 1,512 | 55.9 | % | ||||||||
33
Processing and servicing expense increased by $1.5 million, or 56%, from $2.7 million in the first quarter of 2015 to $4.2 million in the first quarter of 2016. The increase was primarily attributable to a $1.2 million increase in salaries and personnel-related costs, as we increased the number of processing and servicing personnel to support the increased volume of loan applications and approvals and increased loan servicing requirements. In addition, we incurred a $0.3 million increase in third-party processing costs, credit information and filing fees as a result of the increased volume of loan applications and originations.
General and Administrative
Three Months Ended March 31, | ||||||||||||||||||||
Period-to-Period | ||||||||||||||||||||
2016 | 2015 | Change | ||||||||||||||||||
Amount | Percentage of Gross Revenue | Amount | Percentage of Gross Revenue | Amount | Percentage | |||||||||||||||
(dollars in thousands) | ||||||||||||||||||||
General and administrative | $ | 9,709 | 15.5 | % | $ | 9,584 | 17.0 | % | $ | 125 | 1.3 | % | ||||||||
General and administrative expense increased by $0.1 million, or 1%, from $9.6 million in the first quarter of 2015 to $9.7 million in the first quarter of 2016. In support of the growth of our business, salaries and personnel-related costs increased $2.1 million as we increased the number of general and administrative personnel while legal and compliance fees, recruiting and personnel-related expenses, facility depreciation and other miscellaneous expenses increased $0.9 million. The increases were offset by a decrease in the reserve on unfunded lines of credit of $1.5 million and a increase in gain related to foreign currency of $1.4 million. The decrease in the reserve on unfunded lines of credit resulted from improvements made to the reserve model utilizing historical performance data we have aggregated since we began offering lines of credit in 2013. The gain related to foreign currency was driven by the strengthening of the Canadian dollar relative to the U.S. dollar in the first quarter of 2016 as compared to the prior year.
Liquidity and Capital Resources
Sources of Liquidity
During the first quarter of 2016, we originated $569.7 million of loans utilizing a diversified set of funding sources, including third-party lenders (through debt warehouse facilities and securitization), OnDeck Marketplace and equity financing.
At March 31, 2016, we had approximately $137 million of cash on hand to fund our future operations compared to approximately $160 million at December 31, 2015.
Current Debt Facilities
The following table summarizes our current debt facilities available for funding our lending activities, referred to as funding debt, and our operating expenditures, referred to as corporate debt, as of March 31, 2016:
34
Description | Maturity Date | Weighted Average Interest Rate | Borrowing Capacity | Principal Outstanding | ||||||||
(in millions) | ||||||||||||
Funding debt: | ||||||||||||
OnDeck Asset Securitization Trust LLC | May 2018(1) | 3.4 | % | $ | 175.0 | $ | 175.0 | |||||
Prime OnDeck Receivable Trust, LLC | June 2017 | 2.7 | % | 100.0 | 78.3 | |||||||
Receivable Assets of OnDeck, LLC | May 2017 | 3.4 | % | 100.0 | 79.0 | |||||||
OnDeck Account Receivables Trust 2013-1 LLC | September 2017 | 2.7 | % | 150.0 | 33.4 | |||||||
On Deck Asset Company, LLC | May 2017 | 8.7 | % | 50.0 | (2) | 35.1 | ||||||
Small Business Asset Fund 2009 LLC | Various(3) | 6.7 | % | 9.7 | 9.7 | |||||||
On Deck Asset Pool, LLC | August 2017(4) | 5.0 | % | 100.0 | 52.1 | |||||||
Partner Synthetic Participations | Various(5) | Various | 6.7 | 6.7 | ||||||||
691.4 | 469.3 | |||||||||||
Deferred Debt Issuance Cost | (3.7 | ) | ||||||||||
Total funding debt | $ | 691.4 | $ | 465.6 | ||||||||
Corporate debt: | ||||||||||||
On Deck Capital, Inc. | October 2016 | 4.5 | % | $ | 20.0 | $ | 2.7 | |||||
_________________________
(1) | The period during which remaining cash flow can be used to purchase additional loans expires April 30, 2016. |
(2) | On April 28, 2016, this agreement was amended to increase the borrowing capacity from $50 million to $75 million. |
(3) | Maturity dates range from April 2016 through August 2017. |
(4) | The period during which new borrowings may be made under this facility expires in August 2016. |
(5) | Maturity dates range from April 2016 through February 2018. |
While the lenders under our corporate debt facility and Partner Synthetic Participation have direct recourse to us as the borrower thereunder, lenders to our subsidiaries do not have direct recourse to us.
OnDeck Marketplace
OnDeck Marketplace is our proprietary whole loan sale platform that allows participating third-party institutional investors to directly purchase small business loans from us. OnDeck Marketplace participants enter into whole loan purchase agreements, so as to purchase a pre-determined dollar amount of loans that satisfy certain eligibility criteria. Some participants agree to purchase such loans on what is known as a "forward flow basis" while other participants purchase larger pools of whole loans in isolated transactions. The loans are sold to the participant at a pre-determined purchase price above par. We recognize a gain or loss from OnDeck Marketplace loans when sold. The loan sales typically are conducted daily. We currently act as servicer in exchange for a servicing fee with respect to the loans purchased by the applicable OnDeck Marketplace participant. For the three months ended March 31, 2016, December 31, 2015 and March 31, 2015, 25.9%, 39.8% and 24.4%, respectively, of term loan were originated through OnDeck Marketplace. We expect to decrease the utilization of OnDeck Marketplace during 2016 relative to the rate during the three months ended December 31, 2015. To the extent our use of OnDeck Marketplace as a funding source decreases in the future due to lower available premiums or otherwise, we may choose to generate liquidity through our other available funding sources.
35
Cash and Cash Equivalents, Loans (Net of Allowance for Loan Losses), and Cash Flows
The following table summarizes our cash and cash equivalents, loans (net of ALLL) and cash flows:
As of and for the Three Months Ended March 31, | |||||||
2016 | 2015 | ||||||
(in thousands) | |||||||
Cash and cash equivalents | $ | 136,843 | $ | 168,202 | |||
Restricted cash | $ | 32,691 | $ | 26,052 | |||
Loans held for investment, net | $ | 601,682 | $ | 499,626 | |||
Cash provided by (used in): | |||||||
Operating activities | $ | 19,849 | $ | 28,173 | |||
Investing activities | $ | (134,253 | ) | $ | (76,980 | ) | |
Financing activities | $ | 90,959 | $ | (3,424 | ) | ||
Our cash and cash equivalents at March 31, 2016 were held primarily for working capital purposes. We may, from time to time, use excess cash and cash equivalents to fund our lending activities. We do not enter into investments for trading or speculative purposes. Our policy is to invest any cash in excess of our immediate working capital requirements in investments designed to preserve the principal balance and provide liquidity. Accordingly, our excess cash is invested primarily in demand deposit accounts that are currently providing only a minimal return.
Our restricted cash represents funds held in accounts as reserves on certain debt facilities and as collateral for issuing bank partner transactions. We have no ability to draw on such funds as long as they remain restricted under the applicable arrangements.
Cash Flows
Operating Activities
For the three months ended March 31, 2016, net cash provided by our operating activities was $19.8 million, which was primarily the result of our cash received from our customers including interest payments of $62.9 million, plus proceeds from sale of loans held for sale of $112.9 million, less $108.1 million of originations of loans held for sale in excess of loan repayments received, $40.7 million utilized to pay our operating expenses, $4.1 million used to pay the interest on our debt (both funding and corporate) and $4.0 million of origination costs paid in excess of fees collected. During that same period, accounts payable and accrued expenses and other liabilities increased by approximately $2.0 million.
For the three months ended March 31, 2015, net cash provided by our operating activities was $28.2 million, which was primarily the result of our cash received from our customers, including interest payments as well as the gain on sale of our loans totaling approximately $65.7 million, less the amount of cash we utilized to pay our operating expenses of approximately $31.9 million and $4.2 million we used to pay the interest on our debt (both funding and corporate). During that same period, accounts payable and accrued expenses and other liabilities increased by approximately $2.3 million.
Investing Activities
Our investing activities have consisted primarily of funding our term loan and line of credit originations, including payment of associated direct costs and receipt of associated fees, offset by customer repayments of term loans and lines of credit, purchases of property, equipment and software, capitalized internal-use software development costs, proceeds from the sale of term loans which were not specifically identified at origination through our OnDeck Marketplace and changes in restricted cash. Purchases of property, equipment and software and capitalized internal-use software development costs may vary from period to period due to the timing of the expansion of our operations, the addition of employee headcount and the development cycles of our internal-use technology.
For the three months ended March 31, 2016, net cash used to fund our investing activities was $134.3 million and consisted primarily of $140.9 million of loan originations in excess of loan repayments received, $9.8 million of origination costs paid in excess of fees collected and $6.1 million for the purchase of property, equipment and software and capitalized internal-use software development costs offset by $17.0 million of proceeds from sales of loans held for investment. The growth in our loan originations w
36
as consistent with the overall increase in revenue during the year. We also restricted less cash as collateral for financing arrangements, resulting in a $5.8 million increase in unrestricted cash during the year.
For the three months ended March 31, 2015, net cash used to fund our investing activities was $77.0 million and consisted primarily of $68.5 million of loan originations in excess of loan repayments received, $9.2 million of origination costs paid in excess of fees collected and $2.7 million for the purchase of property, equipment and software and capitalized internal-use software development costs. We also restricted less cash as collateral for financing arrangements, resulting in a $3.4 million increase in unrestricted cash during the year.
Financing Activities
Our financing activities have consisted primarily of the net borrowings from our securitization facility and our revolving debt facilities.
For the three months ended March 31, 2016, net cash provided by our financing activities was $91.0 million and consisted primarily of $89.5 million in net borrowings from our revolving debt facilities, primarily associated with the increase in loan originations during the year and $1.5 million of cash received from the issuance of common stock under our employee stock purchase plan.
For the three months ended March 31, 2015, net cash used to fund our financing activities was $3.4 million and consisted primarily of $1.5 million in net repayments on our revolving debt facilities and $1.8 million of payments of initial public offering costs. Borrowings from our funding facilities decreased from the prior year period due to growth of OnDeck Marketplace and our use of available cash from our IPO, which permitted us to fund more loans without drawing corresponding debt, thereby reducing interest expense.
Operating and Capital Expenditure Requirements
We require substantial capital to fund our current operating and capital expenditure requirements. We expect these requirements to increase as we pursue our growth strategy.
As a result of our growth strategy, we grew our annual originations significantly over each of the past three years. Our originations were $0.5 billion in 2013, $1.2 billion in 2014 and $1.9 billion in 2015, which equates to annual year over year growth rates of 165%, 152% and 62%, respectively. In comparison, originations for the three months ended March 31, 2016 increased 37% over originations for the comparable prior year period.
While we remain focused on growth, our strategy is to continue to grow in a disciplined manner while remaining highly focused on credit quality. To accomplish this, we plan to allocate our resources efficiently and to invest in growth by applying sophisticated decision making based on data and analytics to improve performance and enhance our operating leverage.
While we expect our originations to continue to grow in absolute dollars for the full year 2016, we expect our year over year growth rates to continue to decline. The expected growth rate decline can be attributed to several factors. First, as OnDeck continues to mature, it is more difficult to maintain historical growth rates due to the increased size of the previous year’s originations. Because we will remain focused on credit quality, we are also prepared to forgo lending opportunities that do not meet our credit, underwriting and pricing standards. In addition, despite the continuing competition for customer response, we intend to allocate resources to continue to optimize marketing and customer acquisition costs based on targeted returns on investment rather than spending inefficiently in these areas to achieve incremental growth.
Although by design our disciplined growth strategy will result in lower originations growth as a percentage of the prior year’s originations compared to a more aggressive growth strategy, we believe it will increase our operating leverage and improve our overall performance.
In May 2016, the two-year period during which remaining cash flow under our asset-backed securitization transaction can be used to purchase additional loans will expire. Similarly, in August 2016, the period during which new borrowings may be made under the ODAP facility for purposes of the purchase of additional loans will expire. Accordingly, our ability to finance additional loans utilizing these two financing sources will end. Excluding these two funding sources, at March 31, 2016, we had approximately $174.1 million of available capacity through other debt facilities to finance additional loans in addition to approximately $17.3 million available under our corporate debt facility.
37
In order to pursue our growth strategy, we will be required to secure additional funding sources such as new asset-backed securitization transactions, new debt facilities and/or extensions and increases to existing facilities. The proportion of loans we sell through OnDeck Marketplace largely depends on the premiums available to us. As demonstrated during the first quarter of 2016, if premiums available to us were to decrease or other events were to reduce the benefit of selling loans, we may choose to reduce our use of OnDeck Marketplace as a funding source, which could require us to find other financing alternatives. The extent to which we utilize OnDeck Marketplace will vary based on market conditions and business circumstances. There can be no assurance given that we will utilize OnDeck Marketplace at levels consistent with the past twelve months.
On April 27, 2016, we priced $250 million initial principal amount of Series 2016-1 Fixed Rate Asset-Backed Notes, or the Notes, in a private asset-backed securitization transaction. The Notes will be issued in two classes consisting of $211.5 million initial principal amount of Class A Notes and $38.5 million initial principal amount of Class B Notes. The Notes were priced with an annual yield to expected maturity of 4.250% for the Class A Notes and 7.754% for the Class B Notes. Closing is scheduled for May 17, 2016, although there can be no assurance that it will close as scheduled. The Notes will have a final legal maturity of May 2020.
In addition to pursuing funding through OnDeck Marketplace or additional debt funding sources as described above, although it is not currently anticipated, depending upon the circumstances we may seek additional equity financing. The sale of equity may result in dilution to our stockholders, and those securities may have rights senior to those of our common shares. If we raise additional funds through the issuance of additional debt, the agreements governing such debt could contain covenants that would restrict our operations and such debt would rank senior to shares of our common stock.
We believe that our cash from operations, available capacity under our revolving lines of credit (and expected extensions or replacements of those lines), liquidity from expected sales of loans through OnDeck Marketplace and existing cash balances are sufficient to meet our cash operating and capital expenditure requirements for at least the next 12 months. We also believe that those sources of liquidity, together with additional debt financing we expect to be able to obtain on market terms, will be sufficient to meet the needs of our currently planned growth. It is possible that we may require capital in excess of amounts we currently anticipate. Depending on market conditions and other factors, we may not be able to obtain additional capital for our current operations or anticipated future growth on reasonable terms or at all.
Contractual Obligations
Other than as described below, there have been no material changes in our commitments under contractual obligations from those disclosed in our Annual Report on Form 10-K for the year ended December 31, 2015.
ODAC Credit Agreement Amendment
On April 28, 2016, On Deck Asset Company, LLC , or ODAC, one of our wholly-owned subsidiary, amended and restated its existing asset-backed revolving debt facility, or the ODAC Facility, which is utilized solely for the financing of our line of credit offering, as described below. On that date, ODAC entered into that certain Third Amended and Restated Credit Agreement, or the Third A&R Credit Agreement, with the Lenders party thereto from time to time and WC 2014-1, LLC, as Administrative Agent for the Lenders, or the Administrative Agent, and Deutsche Bank Trust Company Americas, as Paying Agent and as Collateral Agent for the Secured Parties, or the Collateral Agent. The Third A&R Credit Agreement amends and restates the Second Amended and Restated Credit Agreement, or the Second A&R Credit Agreement, dated as of December 19, 2014, by and among ODAC, as Borrower, the Lenders party thereto from time to time, the Administrative Agent and the Collateral Agent. The Second A&R Credit Agreement was previously filed as Exhibit 10.16 to the Company's Annual Report on Form 10-K for the year ended December 31, 2014.
The Third A&R Credit Agreement provides for:
• | an increase in the Lenders' revolving commitment from an aggregate amount of $50 million to $75 million; |
• | an increase in the revolving loans interest rate from LIBOR + 8.25% to LIBOR (minimum of 0.0%) + 9.25%; |
• | an increase in the borrowing base advance rate from 70% to 75%; |
• | an extension of the date on or prior to which early termination fees may be payable in the event of a termination or other permanent reduction of the revolving commitments by approximately 11 months to April 28, 2017; |
• | certain changes to portfolio performance covenants; and |
• | various related technical, definitional, conforming and other changes. |
38
The foregoing description of the Third A&R Credit Agreement does not purport to be complete and is qualified in its entirety by reference to the Third A&R Credit Agreement, which will be filed as an exhibit to the Company's Quarterly Report on Form 10-Q for the quarter ending June 30, 2016.
SunTrust Credit Agreement Amendment
On February 26, 2016, Receivable Assets of OnDeck, LLC, or RAOD, one of our wholly-owned subsidiaries, amended and restated its existing asset-backed revolving debt facility, or the SunTrust Facility. On that date, RAOD entered into that certain Amended and Restated Credit Agreement, or the A&R SunTrust Credit Agreement, with the Lenders party thereto from time to time, SunTrust Bank, as Administrative Agent for the Class A Revolving Lenders, or the “Administrative Agent, and Wells Fargo Bank, N.A., as Paying Agent , or in such capacity, the Paying Agent, and as Collateral Agent for the Secured Parties, or in such capacity, the Collateral Agent. The A&R SunTrust Credit Agreement amends and restates that certain Credit Agreement, or the SunTrust Credit Agreement, by and among RAOD, as Borrower, the Lenders party thereto, the Administrative Agent, the Paying Agent and the Collateral Agent. The SunTrust Credit Agreement was previously filed as Exhibit 10.2 to our Quarterly Report on Form 10-Q for the quarter ended June 30, 2015, as filed with the SEC on August 11, 2015.
The A&R SunTrust Credit Agreement amends the SunTrust Credit Agreement to provide for:
• | an increase in the Class A Revolving Lenders' revolving commitment from an aggregate amount of $50,000,000 to $100,000,000; |
• | the utilization of up to half of the SunTrust Facility to finance our expanded term loan range offered to select, highly qualified customers, which reflects an increase in the maximum scheduled loan term (to up to 36 months) and the maximum original principal amount (to up to $500,000); |
• | certain changes to portfolio performance covenants; and |
• | various related technical, definitional, conforming and other changes. |
The foregoing description of the A&R SunTrust Credit Agreement does not purport to be complete and is qualified in its entirety by reference to the A&R SunTrust Credit Agreement, which will be filed as an Exhibit 10.1 to this report and incorporated herein by reference. At March 31, 2016, there were $79.0 million in borrowings outstanding under this facility.
Off-Balance Sheet Arrangements
As of March 31, 2016, we did not have any off-balance sheet arrangements, as defined in Item 303(a)(4)(ii) of Regulation S-K, such as the use of unconsolidated subsidiaries, structured finance, special purpose entities or variable interest entities.
Critical Accounting Policies and Significant Judgments and Estimates
There have been no material changes to our critical accounting policies and estimates as compared to those described in our Annual Report on Form 10-K for the year ended December 31, 2015.
Our management’s discussion and analysis of our financial condition and results of operations is based on our condensed consolidated financial statements, which have been prepared in accordance with GAAP. The preparation of these condensed consolidated financial statements requires us to make estimates and assumptions that affect the reported amounts of assets and liabilities, disclosure of contingent assets and liabilities at the date of the condensed consolidated financial statements and the reported amounts of revenue and expenses during the reported period. In accordance with GAAP, we base our estimates on historical experience and on various other assumptions that we believe are reasonable under the circumstances. Actual results may differ from these estimates under different assumptions or conditions.
Recently Issued Accounting Pronouncements and JOBS Act Election
Refer to Note 1, Organization and Summary of Significant Accounting Policies, contained in the Notes to Unaudited Condensed Consolidated Financial Statements in Item 1 of Part I of this report for a full description of the recent accounting pronouncements and our expectation of their impact, if any, on our results of operations and financial conditions.
Under the JOBS Act, we meet the definition of an “emerging growth company.” We have irrevocably elected to opt out of the extended transition period for complying with new or revised accounting standards pursuant to Section 107(b) of the JOBS Act.
39
Item 3. | Quantitative and Qualitative Disclosures About Market Risk |
There have been no material changes from the information previously reported under Part II, Item 7A of our Annual Report on Form 10-K for the year ended December 31, 2015.
40
Item 4. | Controls and Procedures |
Evaluation of Disclosure Controls and Procedures
As required by Rule 13a-15 under the Securities Exchange Act of 1934, as amended, or the Exchange Act, management has evaluated, with the participation of our Chief Executive Officer and Chief Financial Officer, the effectiveness of our disclosure controls and procedures as of the end of the period covered by this report. Disclosure controls and procedures refer to controls and other procedures designed to ensure that information required to be disclosed in the reports we file or submit under the Exchange Act are recorded, processed, summarized, and reported within the time periods specified in the rules and forms of the SEC. Disclosure controls and procedures include, without limitation, controls and procedures designed to ensure that information required to be disclosed by us in our reports that we file or submit under the Exchange Act are accumulated and communicated to our management, including our Chief Executive Officer and Chief Financial Officer, as appropriate, to allow timely decisions regarding our required disclosure. In designing and evaluating our disclosure controls and procedures, management recognizes that any controls and procedures, no matter how well designed and operated, can provide only reasonable assurance of achieving the desired control objectives, and management is required to apply its judgment in evaluating and implementing possible controls and procedures.
Based on the foregoing evaluation, our Chief Executive Officer and Chief Financial Officer have concluded that, as of March 31, 2016, the end of the period covered by this report, our disclosure controls and procedures were effective at a reasonable assurance level.
Changes in Internal Control over Financial Reporting
There were no changes in our internal control over financial reporting during the quarter ended March 31, 2016 that have materially affected, or are reasonably likely to materially affect, our internal control over financial reporting.
PART II - OTHER INFORMATION
Item 1. | Legal Proceedings |
Two separate putative class actions were filed in August 2015 in the United States District Court for the Southern District of New York against us, certain of our executive officers, our directors and certain or all of the underwriters of our IPO. The suits allege that the registration statement and prospectus for our IPO contained materially false and misleading statements regarding, or failed to disclose, certain information in violation of the Securities Act of 1933, as amended. The suits seek a determination that the case is a proper class action and/or certification of the plaintiff as a class representative, rescission or a rescissory measure of damages and/or unspecified damages, interest, attorneys’ fees and other fees and costs. On February 18, 2016 the court issued an order (1) consolidating the two cases, (2) selecting the lead plaintiff and (3) appointing lead class counsel. On March 18, 2016, the lead plaintiff filed an amended complaint. On April 14, 2016, the court approved a schedule allowing the defendants 60 days to file a motion to dismiss, allowing the plaintiff to file any opposition within 60 days of the filing of the motion to dismiss and allowing the defendants to file a reply within 30 days after the filing of plaintiff’s opposition. We intend to defend ourselves vigorously in these consolidated matters, although at this time we cannot predict the outcome.
From time to time we are subject to other legal proceedings and claims in the ordinary course of business. The results of such matters cannot be predicted with certainty. However, we believe that the final outcome of any such current matters will not result in a material adverse effect on our consolidated financial condition, consolidated results of operations or consolidated cash flows.
Item 1A. | Risk Factors |
For a discussion of certain risk factors affecting us, see Part I, Item 1A, "Risk Factors" in our Annual Report on Form 10-K for the year ended December 31, 2015 and "Cautionary Note Regarding Forward-Looking Statements" in this report.
Item 2. | Unregistered Sales of Equity Securities and Use of Proceeds |
Recent Sales of Unregistered Securities
None.
41
Use of Proceeds from Initial Public Offering of Common Stock
There has been no material change in the planned use of proceeds from our initial public offering as described in our final prospectus filed with the SEC on December 17, 2014 pursuant to Rule 424(b)(4). During the quarter ended March 31, 2016 (the period covered by this report), pending their application, the net proceeds from our IPO were maintained as described in our final prospectus.
Issuer Purchases of Equity Securities
None.
Item 3. | Defaults Upon Senior Securities |
None.
42
Item 4. | Mine Safety Disclosures |
None.
Item 5. | Other Information |
None.
43
Item 6. | Exhibits |
The documents listed in the Exhibit Index of this report are incorporated by reference or are filed with this Quarterly Report on Form 10-Q, in each case as indicated therein (numbered in accordance with Item 601 of Regulation S-K).
44
SIGNATURES
Pursuant to the requirements of Section 13 or 15(d) of the Securities Exchange Act of 1934, the registrant has duly caused this report to be signed on its behalf by the undersigned, thereunto duly authorized.
On Deck Capital, Inc. | |
/s/ Howard Katzenberg | |
Howard Katzenberg Chief Financial Officer (Principal Financial Officer) | |
Date: May 5, 2016 | |
/s/ Nicholas Sinigaglia | |
Nicholas Sinigaglia Senior Vice President (Principal Accounting Officer) | |
Date: May 5, 2016 | |
45
Exhibit Index
Exhibit Number | Description | Filed / Furnished / Incorporated by Reference from Form * | Incorporated by Reference from Exhibit Number | Date Filed | ||||
3.1 | Amended and Restated Certificate of Incorporation | 8-K | 3.1 | 12/22/2014 | ||||
3.2 | Second Amended and Restated Bylaws | 8-K | 3.1 | 5/1/2015 | ||||
4.1 | Form of common stock certificate. | S-1 | 4.1 | 11/10/2014 | ||||
4.2 | Ninth Amended and Restated Investors’ Rights Agreement, dated March 13, 2014, by and among the Registrant and certain of its stockholders. | S-1 | 4.2 | 11/10/2014 | ||||
4.3 | Form of warrant to purchase Series E preferred stock. | S-1 | 4.5 | 11/10/2014 | ||||
4.4 | Form of warrant to purchase common stock. | S-1 | 4.6 | 11/10/2014 | ||||
10.1 | Amended and Restated Credit Agreement, dated as of February 26, 2016, by and among Receivable Assets of OnDeck, LLC, as Borrower, the Lenders party thereto from time to time, SunTrust Bank, as Administrative Agent for the Class A Revolving Lenders and Wells Fargo Bank, N.A., as Paying Agent and as Collateral Agent for the Secured Parties. | Filed herewith. | ||||||
31.1 | Certification pursuant to Section 302 of the Sarbanes-Oxley Act of 2002, Rule 13a-14(a)/15d-14(a), by President and Chief Executive Officer. | Filed herewith. | ||||||
31.2 | Certification pursuant to Section 302 of the Sarbanes-Oxley Act of 2002, Rule 13a-14(a)/15d-14(a), by President and Chief Financial Officer. | Filed herewith. | ||||||
32.1 | Certification pursuant to 18 U.S.C. Section 1350, as adopted pursuant to Section 906 of the Sarbanes-Oxley Act of 2002, by President and Chief Executive Officer. | Filed herewith. | ||||||
32.2 | Certification pursuant to 18 U.S.C. Section 1350, as adopted pursuant to Section 906 of the Sarbanes-Oxley Act of 2002, by President and Chief Financial Officer. | Filed herewith. | ||||||
101.INS | XBRL Instance Document | Filed herewith. | ||||||
101.SCH | XBRL Taxonomy Extension Schema Document | Filed herewith. | ||||||
101.CAL | XBRL Taxonomy Extension Calculation Linkbase Document | Filed herewith. | ||||||
101.DEF | XBRL Taxonomy Extension Definition Linkbase Document | Filed herewith. | ||||||
101.LAB | XBRL Taxonomy Extension Labels Linkbase Document | Filed herewith. | ||||||
101.PRE | XBRL Taxonomy Extension Presentation Linkbase Document | Filed herewith. | ||||||
* | All exhibits incorporated by reference to the Registrant's Form S-1 or S-1/A registration statements relate to Registration No. 333-200043 |
46