Attached files
| file | filename |
|---|---|
| EX-99.1 - EX-99.1 - NN INC | d186427dex991.htm |
| 8-K - FORM 8-K - NN INC | d186427d8k.htm |
Exhibit 99.2
|
|

First Quarter 2016 Earnings Release
May 4, 2016
|
|
Forward Looking Statements
Forward Looking Statement: With the exception of the historical information contained in this presentation, the matters described herein contain forward-looking statements that are made pursuant to the safe harbor provisions of the Private Securities Litigation Reform Act of 1995.— number of risks and uncertainties that may cause actual results to be materially different from such forward-looking statements. Such factors include, among others, general economic conditions and economic conditions in the industrial sector, competitive influences, risks that current customers will commence or increase captive production, risks of capacity underutilization, quality issues, availability of raw materials, currency and other risks associated with international trade, the Company’s dependence on certain major customers, and other risk factors and cautionary statements listed from time to time in the Company’s periodic reports filed with the Securities and Exchange Commission, including, but not limited to, the Company’s Annual Report on 10-K for the fiscal year ended December 31, 2015.
With respect to any non-GAAP financial measures included in the following presentation, the accompanying information required by SEC Regulation G can be found at the back of this presentation or in the “Investor Relations” section of the Company’s web site, www.nninc.com, under the heading “News & Events” and subheading “Presentations.”
Disclaimer: NN disclaims any obligation to update any such factors or to publicly announce the result of any revisions to any of the forward-looking statements included herein or therein to reflect future events or developments.
www.nninc.com
| 2 |
|
|
|

First Quarter
|
|
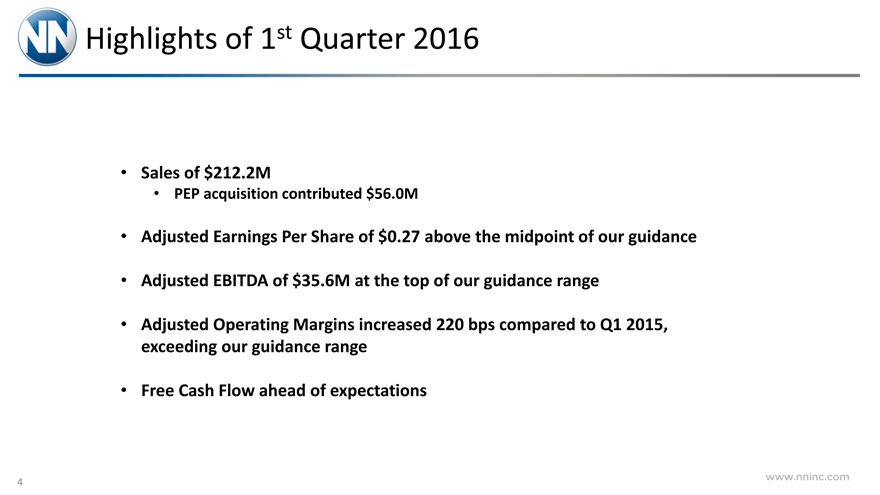
Highlights of 1st Quarter 2016
Sales of $212.2M
PEP acquisition contributed $56.0M
Adjusted Earnings Per Share of $0.27 above the midpoint of our guidance
Adjusted EBITDA of $35.6M at the top of our guidance range
Adjusted Operating Margins increased 220 bps compared to Q1 2015, exceeding our guidance range
Free Cash Flow ahead of expectations
www.nninc.com
| 4 |
|
|
|
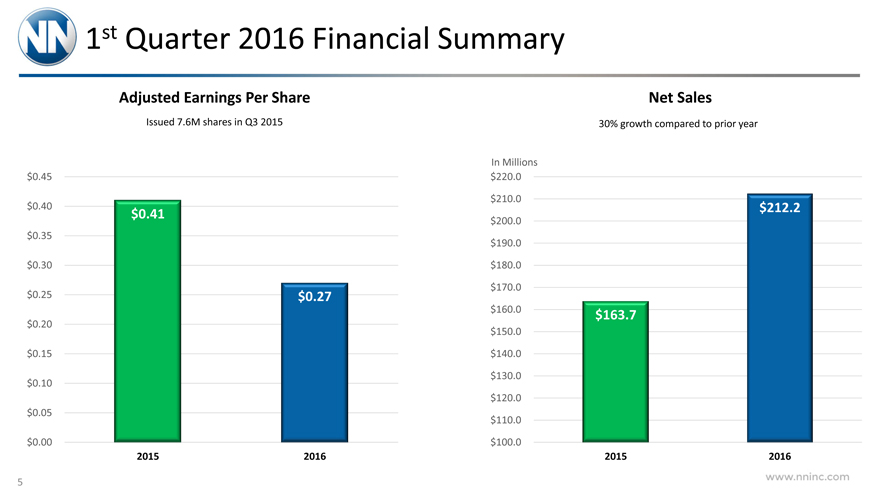
1st Quarter 2016 Financial Summary
Adjusted Earnings Per Share Net Sales
Issued 7.6M shares in Q3 2015 30% growth compared to prior year
In Millions
| $0.45 |
|
$ 220.0 |
$ 210.0
| $0.40 |
|
$ 212.2 |
$ 0.41 $ 200.0
$0.35
$ 190.0
| $0.30 |
|
$ 180.0 |
$ 170.0
| $0.25 |
|
$0.27 |
$ 160.0 $163.7
$0.20
$ 150.0
| $0.15 |
|
$ 140.0 |
$ 130.0
$0.10
$ 120.0
$0.05
$ 110.0
| $0.00 |
|
$ 100.0 |
2015 2016 2015 2016
www.nninc.com
| 5 |
|
|
|
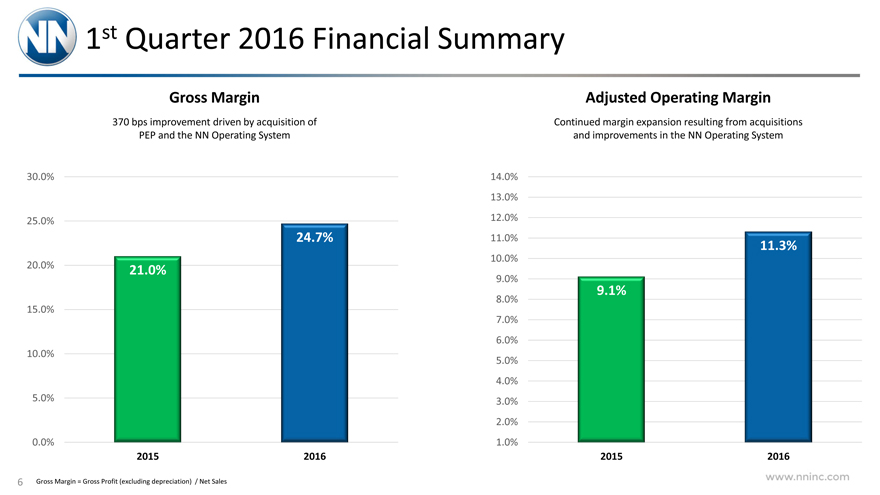
1st Quarter 2016 Financial Summary
Gross Margin Adjusted Operating Margin
370 bps improvement driven by acquisition of Continued margin expansion resulting from acquisitions
PEP and the NN Operating System and improvements in the NN Operating System
| 30.0% |
|
14.0% |
13.0%
| 25.0% |
|
12.0% |
| 24.7% |
|
11.0% 11.3% |
10.0%
| 20.0% |
|
21.0% |
9.0%
9.1%
8.0%
15.0%
7.0%
6.0%
10.0%
5.0%
4.0%
| 5.0% |
|
3.0% |
2.0%
| 0.0% |
|
1.0% |
2015 2016 2015 2016
Gross Margin = Gross Profit (excluding depreciation) / Net Sales
www.nninc.com
| 6 |
|
|
|
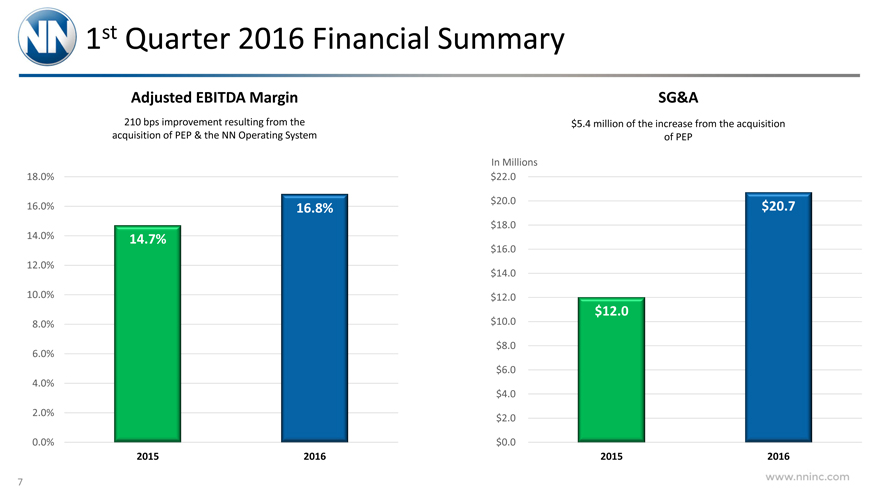
1st Quarter 2016 Financial Summary
Adjusted EBITDA Margin SG&A
210 bps improvement resulting from the $5.4 million of the increase from the acquisition
acquisition of PEP & the NN Operating System of PEP
In Millions
| 18.0% |
|
$22.0 |
| 16.0% |
|
16.8% $20.0 $20.7 |
$18.0
| 14.0% |
|
14.7% |
$16.0
12.0%
$14.0
| 10.0% |
|
$12.0 |
$12.0
| 8.0% |
|
$10.0 |
$8.0
6.0%
$6.0
4.0%
$4.0
| 2.0% |
|
$2.0 |
| 0.0% |
|
$0.0 |
2015 2016 2015 2016
www.nninc.com
| 7 |
|
|
|
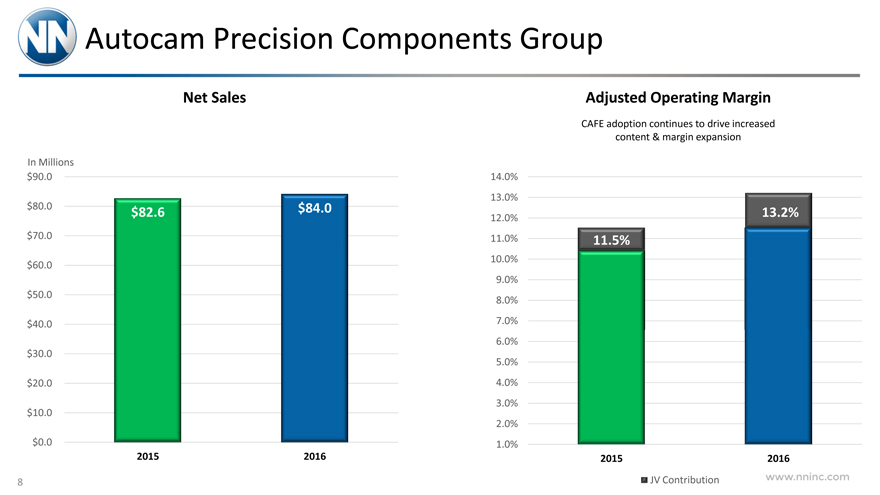
Autocam Precision Components Group
Net Sales Adjusted Operating Margin
CAFE adoption continues to drive increased
content & margin expansion
In Millions
| $90.0 |
|
14.0% |
13.0%
| $80.0 |
|
$82.6 $84.0 13.2% |
12.0%
| $70.0 |
|
11.0% 11.5% |
| $60.0 |
|
10.0% |
9.0%
| $50.0 |
|
8.0% |
| $40.0 |
|
7.0% |
6.0%
$30.0
5.0%
| $20.0 |
|
4.0% |
3.0%
$10.0
2.0%
| $0.0 |
|
1.0% |
2015 2016 2015 2016
JV Contribution
www.nninc.com
| 8 |
|
|
|
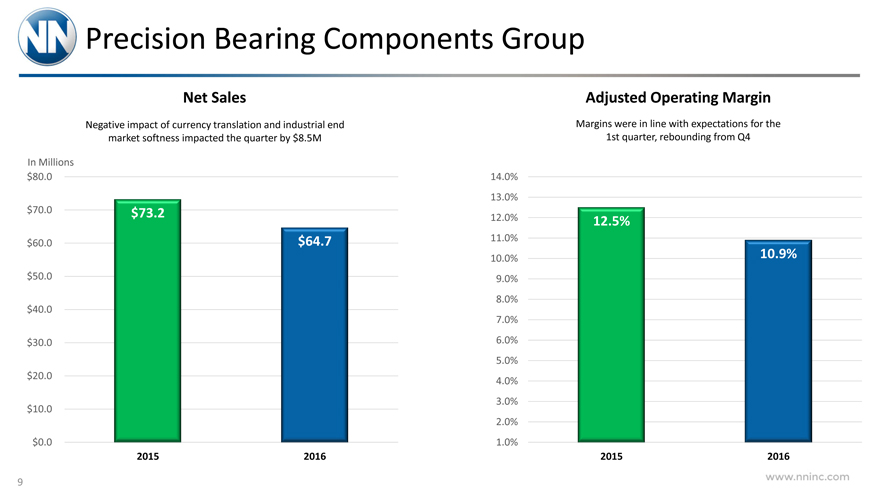
Precision Bearing Components Group
Net Sales Adjusted Operating Margin
Negative impact of currency translation and industrial end Margins were in line with expectations for the
market softness impacted the quarter by $8.5M 1st quarter, rebounding from Q4
In Millions
| $80.0 |
|
14.0% |
13.0%
| $70.0 |
|
$73.2 12.0% 12.5% |
| $60.0 |
|
$64.7 11.0% |
| 10.0% |
|
10.9% |
| $50.0 |
|
9.0% |
8.0%
$40.0
7.0%
| $30.0 |
|
6.0% |
5.0%
| $20.0 |
|
4.0% |
3.0%
$10.0
2.0%
| $0.0 |
|
1.0% |
2015 2016 2015 2016
www.nninc.com
9
|
|
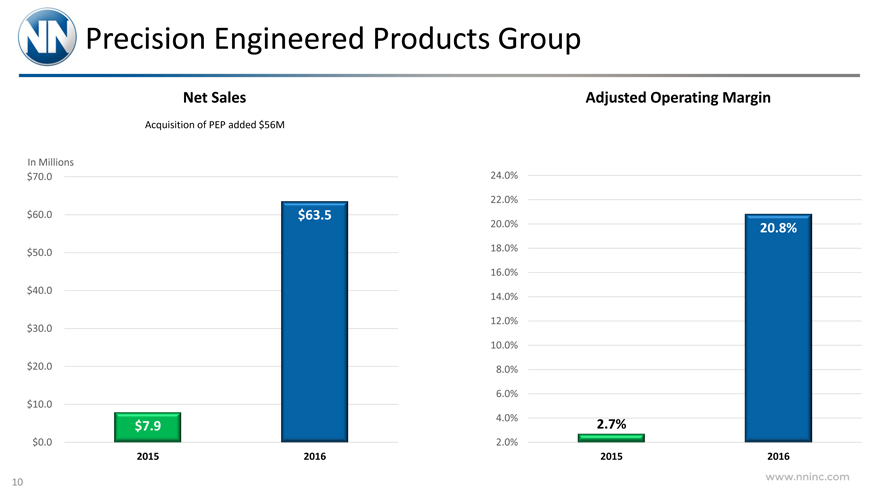
Precision Engineered Products Group
Net Sales Adjusted Operating Margin
Acquisition of PEP added $56M
In Millions
| $70.0 |
|
24.0% |
22.0%
| $60.0 |
|
$63.5 |
| 20.0% |
|
20.8% |
| $50.0 |
|
18.0% |
16.0%
| $40.0 |
|
14.0% |
12.0%
$30.0
10.0%
| $20.0 |
|
8.0% |
6.0%
$10.0
4.0%
| $7.9 |
|
2.7% |
| $0.0 |
|
2.0% |
2015 2016 2015 2016
www.nninc.com
10
|
|
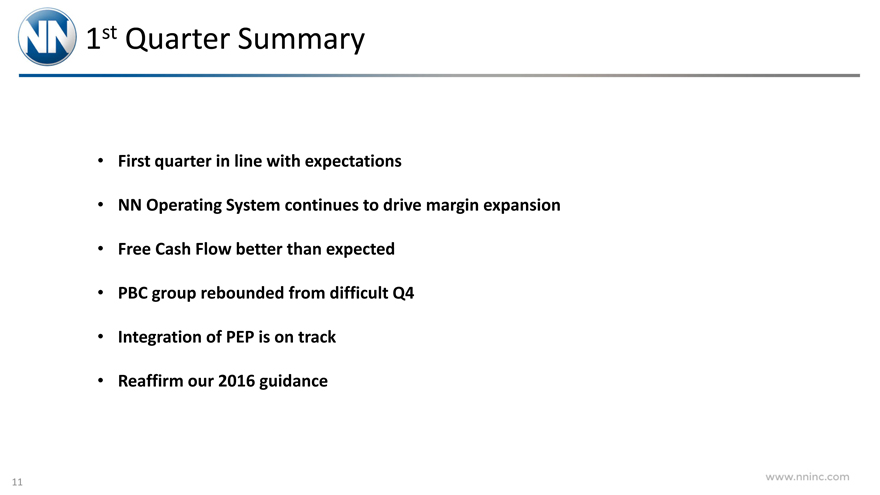
1st Quarter Summary
First quarter in line with expectations
NN Operating System continues to drive margin expansion Free Cash Flow better than expected PBC group rebounded from difficult Q4 Integration of PEP is on track Reaffirm our 2016 guidance
www.nninc.com
11
|
|

Guidance
|
|
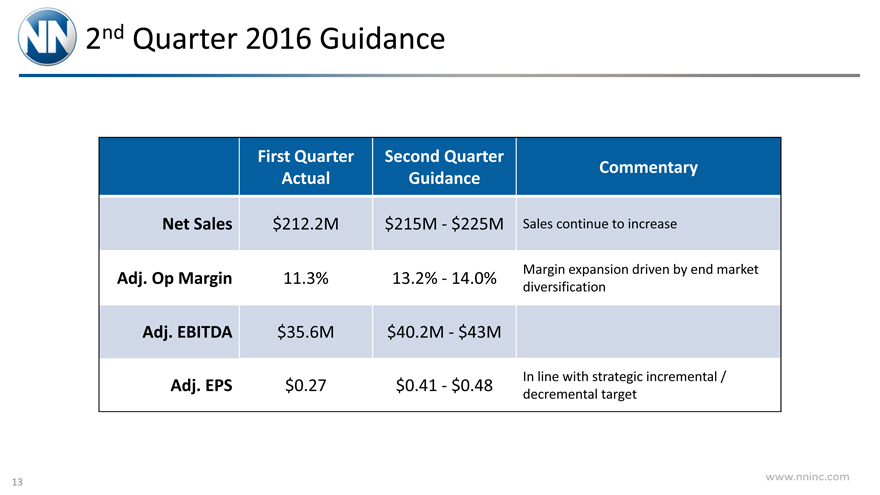
2nd Quarter 2016 Guidance
First Quarter Second Quarter
Commentary
Actual Guidance
Net Sales $212.2M $215M—$225M Sales continue to increase
Adj. Op Margin 11.3% 13.2%—14.0% Margin expansion driven by end market
diversification
Adj. EBITDA $35.6M $40.2M—$43M
Adj. EPS $0.27 $0.41—$0.48 In line with strategic incremental /
decremental target
www.nninc.com
13
|
|
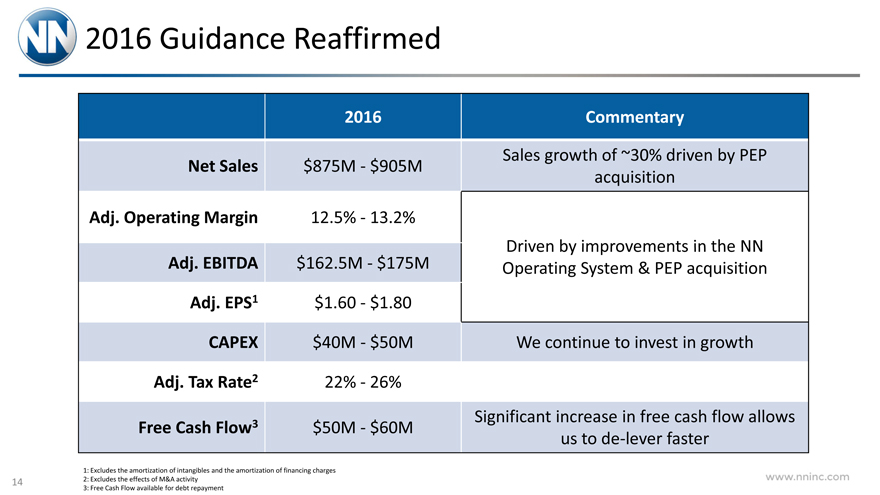
2016 Guidance Reaffirmed
2016 Commentary
Sales growth of ~30% driven by PEP
Net Sales $875M—$905M
acquisition
Adj. Operating Margin 12.5%—13.2%
Driven by improvements in the NN
Adj. EBITDA $162.5M—$175M Operating System & PEP acquisition
Adj. EPS1 $1.60—$1.80
CAPEX $40M—$50M We continue to invest in growth
Adj. Tax Rate2 22%—26%
Free Cash Flow3 $50M—$60M Significant increase in free cash flow allows
us to de-lever faster
1: Excludes the amortization of intangibles and the amortization of financing charges
2: Excludes the effects of M&A activity
3: Free Cash Flow available for debt repayment
www.nninc.com
14
|
|

Reconciliation Tables
|
|
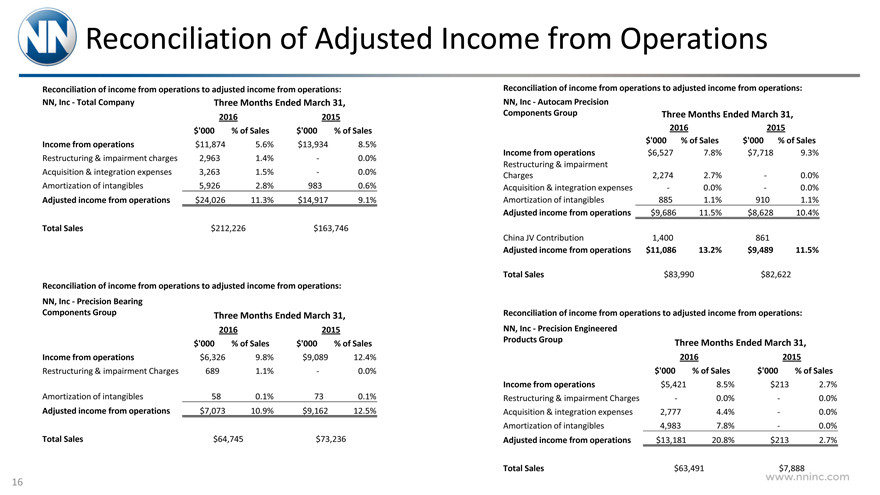
Reconciliation of Adjusted Income from Operations
Reconciliation of income from operations to adjusted income from operations:
NN, Inc—Total Company Three Months Ended March 31,
2016 2015
$‘000% of Sales $‘000% of Sales
Income from operations $11,874 5.6% $13,934 8.5%
Restructuring & impairment charges 2,963 1.4%—0.0%
Acquisition & integration expenses 3,263 1.5%—0.0%
Amortization of intangibles 5,926 2.8% 983 0.6%
Adjusted income from operations $24,026 11.3% $14,917 9.1%
Total Sales $212,226 $163,746
Reconciliation of income from operations to adjusted income from operations:
NN, Inc—Precision Bearing
Components Group Three Months Ended March 31,
2016 2015
$‘000% of Sales $‘000% of Sales
Income from operations $6,326 9.8% $9,089 12.4%
Restructuring & impairment Charges 689 1.1%—0.0%
Amortization of intangibles 58 0.1% 73 0.1%
Adjusted income from operations $7,073 10.9% $9,162 12.5%
Total Sales $64,745 $73,236
Reconciliation of income from operations to adjusted income from operations:
NN, Inc—Autocam Precision
Components Group Three Months Ended March 31,
2016 2015
$‘000 % of Sales $‘000 % of Sales
Income from operations $6,527 7.8% $7,718 9.3%
Restructuring & impairment
Charges 2,274 2.7%—0.0%
Acquisition & integration expenses—0.0%—0.0%
Amortization of intangibles 885 1.1% 910 1.1%
Adjusted income from operations $9,686 11.5% $8,628 10.4%
China JV Contribution 1,400 861
Adjusted income from operations $11,086 13.2% $9,489 11.5%
Total Sales $83,990 $82,622
Reconciliation of income from operations to adjusted income from operations:
NN, Inc—Precision Engineered
Products Group Three Months Ended March 31,
2016 2015
$‘000% of Sales $‘000% of Sales
Income from operations $5,421 8.5% $213 2.7%
Restructuring & impairment Charges—0.0%—0.0%
Acquisition & integration expenses 2,777 4.4%—0.0%
Amortization of intangibles 4,983 7.8%—0.0%
Adjusted income from operations $13,181 20.8% $213 2.7%
Total Sales $63,491 $7,888
www.nninc.com
16
|
|
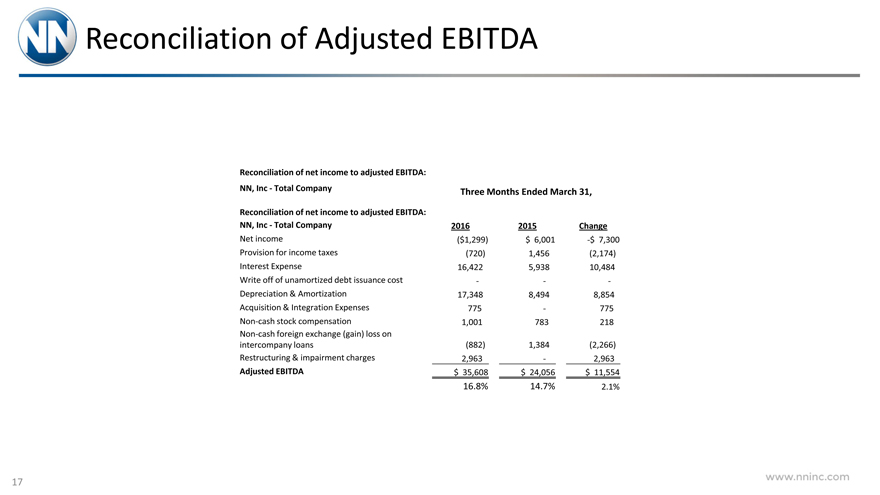
Reconciliation of Adjusted EBITDA
Reconciliation of net income to adjusted EBITDA:
NN, Inc—Total Company Three Months Ended March 31,
Reconciliation of net income to adjusted EBITDA:
NN, Inc—Total Company 2016 2015 Change
Net income($1,299) $ 6,001 -$ 7,300
Provision for income taxes(720) 1,456(2,174)
Interest Expense 16,422 5,938 10,484
Write off of unamortized debt issuance cost — -
Depreciation & Amortization 17,348 8,494 8,854
Acquisition & Integration Expenses 775—775
Non-cash stock compensation 1,001 783 218
Non-cash foreign exchange (gain) loss on
intercompany loans(882) 1,384(2,266)
Restructuring & impairment charges 2,963—2,963
Adjusted EBITDA $ 35,608 $ 24,056 $ 11,554
| 16.8% |
|
14.7% 2.1% |
www.nninc.com
17
|
|
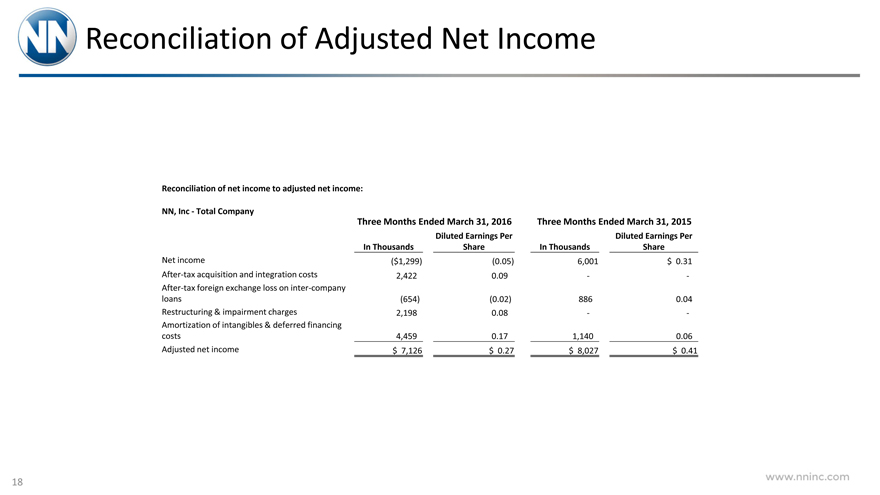
Reconciliation of Adjusted Net Income
Reconciliation of net income to adjusted net income:
NN, Inc—Total Company
Three Months Ended March 31, 2016 Three Months Ended March 31, 2015
Diluted Earnings Per Diluted Earnings Per
In Thousands Share In Thousands Share
Net income($1,299)(0.05) 6,001 $ 0.31
After-tax acquisition and integration costs 2,422 0.09 —
After-tax foreign exchange loss on inter-company
loans(654)(0.02) 886 0.04
Restructuring & impairment charges 2,198 0.08 —
Amortization of intangibles & deferred financing
costs 4,459 0.17 1,140 0.06
Adjusted net income $ 7,126 $ 0.27 $ 8,027 $ 0.41
www.nninc.com
18
|
|
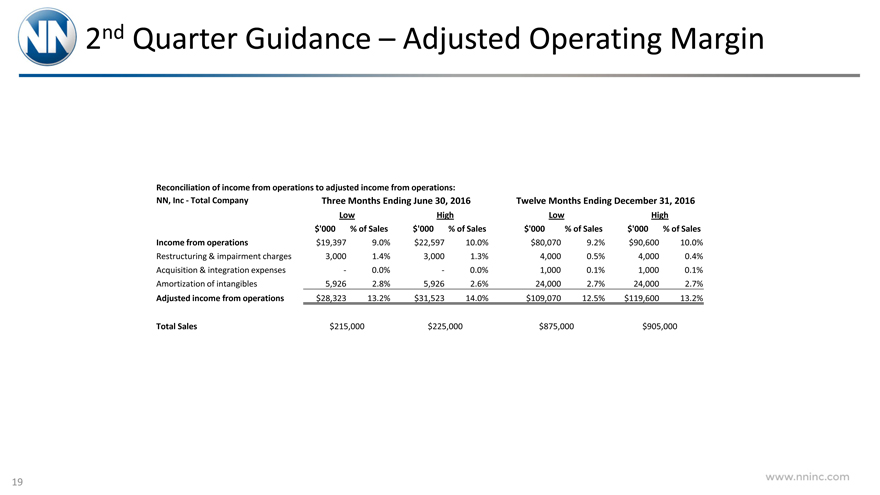
2nd Quarter Guidance – Adjusted Operating Margin
Reconciliation of income from operations to adjusted income from operations:
NN, Inc—Total Company Three Months Ending June 30, 2016 Twelve Months Ending December 31, 2016
Low High Low High
$‘000% of Sales $‘000% of Sales $‘000% of Sales $‘000% of Sales
Income from operations $19,397 9.0% $22,597 10.0% $80,070 9.2% $90,600 10.0%
Restructuring & impairment charges 3,000 1.4% 3,000 1.3% 4,000 0.5% 4,000 0.4%
Acquisition & integration expenses—0.0%—0.0% 1,000 0.1% 1,000 0.1%
Amortization of intangibles 5,926 2.8% 5,926 2.6% 24,000 2.7% 24,000 2.7%
Adjusted income from operations $28,323 13.2% $31,523 14.0% $109,070 12.5% $119,600 13.2%
Total Sales $215,000 $225,000 $875,000 $905,000
www.nninc.com
19
|
|
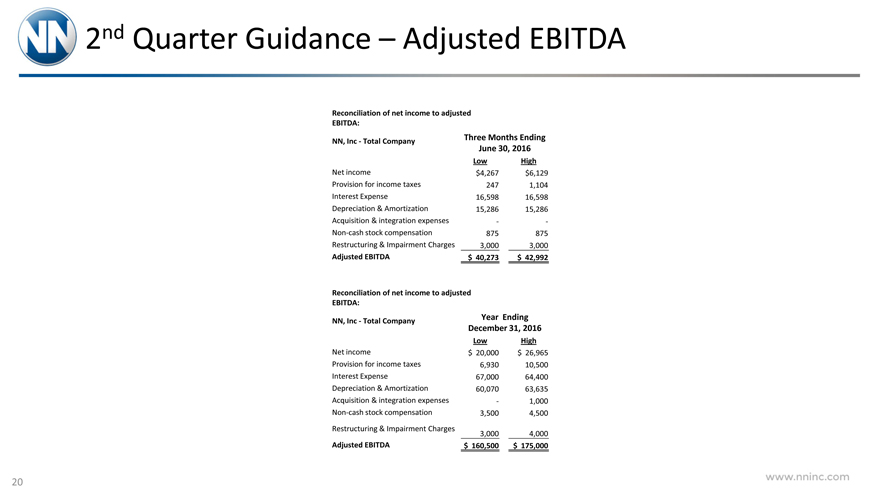
2nd Quarter Guidance – Adjusted EBITDA
Reconciliation of net income to adjusted
EBITDA:
NN, Inc—Total Company Three Months Ending
June 30, 2016
Low High
Net income $4,267 $6,129
Provision for income taxes 247 1,104
Interest Expense 16,598 16,598
Depreciation & Amortization 15,286 15,286
Acquisition & integration expenses —
Non-cash stock compensation 875 875
Restructuring & Impairment Charges 3,000 3,000
Adjusted EBITDA $ 40,273 $ 42,992
Reconciliation of net income to adjusted
EBITDA:
NN, Inc—Total Company Year Ending
December 31, 2016
Low High
Net income $ 20,000 $ 26,965
Provision for income taxes 6,930 10,500
Interest Expense 67,000 64,400
Depreciation & Amortization 60,070 63,635
Acquisition & integration expenses—1,000
Non-cash stock compensation 3,500 4,500
Restructuring & Impairment Charges
3,000 4,000
Adjusted EBITDA $ 160,500 $ 175,000
www.nninc.com
20
|
|
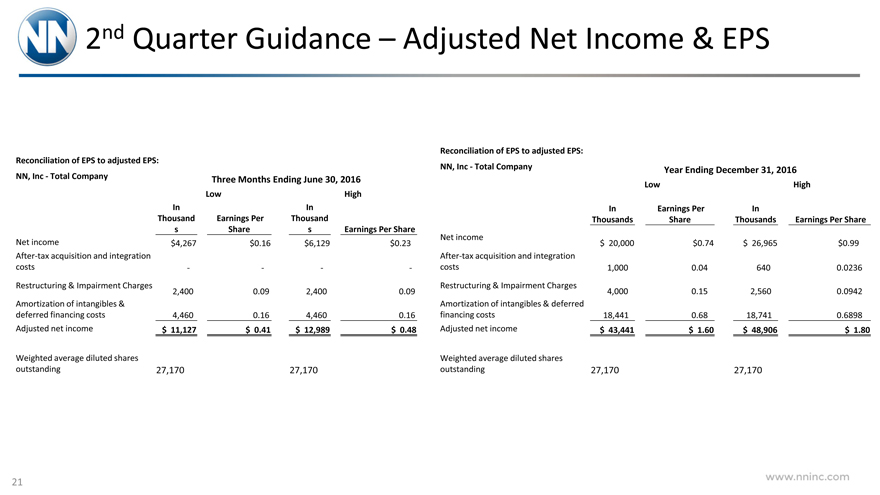
2nd Quarter Guidance – Adjusted Net Income & EPS
Reconciliation of EPS to adjusted EPS:
NN, Inc—Total Company Three Months Ending June 30, 2016
Low High
In In
Thousand Earnings Per Thousand
s Share s Earnings Per Share
Net income $4,267 $0.16 $6,129 $0.23
After-tax acquisition and integration
costs — —
Restructuring & Impairment Charges
2,400 0.09 2,400 0.09
Amortization of intangibles &
deferred financing costs 4,460 0.16 4,460 0.16
Adjusted net income $ 11,127 $0.41 $ 12,989 $0.48
Weighted average diluted shares
outstanding 27,170 27,170
Reconciliation of EPS to adjusted EPS:
NN, Inc—Total Company Year Ending December 31, 2016
Low High
In Earnings Per In
Thousands Share Thousands Earnings Per Share
Net income
$ 20,000 $0.74 $ 26,965 $0.99
After-tax acquisition and integration
costs 1,000 0.04 640 0.0236
Restructuring & Impairment Charges
4,000 0.15 2,560 0.0942
Amortization of intangibles & deferred
financing costs 18,441 0.68 18,741 0.6898
Adjusted net income $ 43,441 $1.60 $ 48,906 $1.80
Weighted average diluted shares
outstanding 27,170 27,170
www.nninc.com
21
|
|
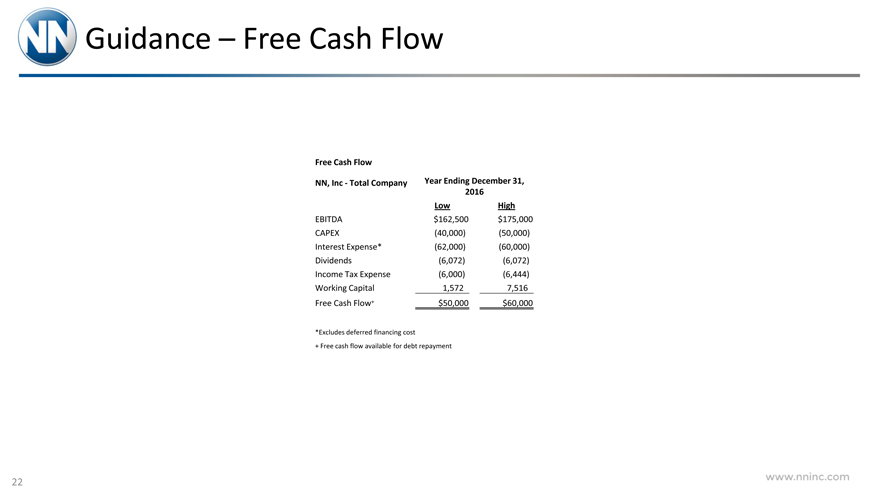
Guidance – Free Cash Flow
Free Cash Flow
NN, Inc—Total Company Year Ending December 31,
2016
Low High
EBITDA $162,500 $175,000
CAPEX(40,000)(50,000)
Interest Expense*(62,000)(60,000)
Dividends(6,072)(6,072)
Income Tax Expense(6,000)(6,444)
Working Capital 1,572 7,516
Free Cash Flow+ $50,000 $60,000
*Excludes deferred financing cost
+ Free cash flow available for debt repayment
www.nninc.com
22