Attached files
| file | filename |
|---|---|
| 8-K - CURRENT REPORT OF MATERIAL EVENTS OR CORPORATE CHANGES - Monogram Residential Trust, Inc. | a16-10657_18k.htm |
| EX-99.1 - EX-99.1 - Monogram Residential Trust, Inc. | a16-10657_1ex99d1.htm |
Exhibit 99.2
Monogram Residential Trust, Inc. Supplemental Financial Information First Quarter 2016

Table of Contents First Quarter 2016 Forward-Looking Statements 3 Consolidated Balance Sheets 4 5 6 7 8 9 10 Proportionate Balance Sheet Information as of March 31, 2016 Proportionate Balance Sheet Information as of December 31, 2015 Consolidated Statements of Operations Funds from Operations, Core FFO and Adjusted Core FFO Proportionate YTD Operating Information and Reconciliation to FFO EBITDA Reconciliation Equity Investments by Geographic Regions 11 12 13 17 Summary of Number of Units and Communities Summary of Operating Communities Summary of Proportionate Share of Notes Receivable Consolidated Net Operating Income 18 19 20 22 24 26 27 Reconciliation of Consolidated Net Operating Income Consolidated YTD Net Operating Income by Geographic Region and Market Consolidated YTD Operating Metrics by Geographic Region and Market Proportionate YTD Net Operating Income by Geographic Region and Market Consolidated YTD Comparisons of Same Store Operating Expenses Proportionate Share QTD General and Administrative and Corporate Property Management Expenses Summary of Developments 28 29 30 31 Development Cash Costs to Complete, Interest and Other Costs Acquisition and Disposition Summary - Three Years Capital Expenditures - Same Store Debt Summary 32 34 36 Debt Detail by Multifamily Community Sources of Funds Available Preferred Stock, Common Stock and Common Stock Equivalents 37 Road Map to Net Asset Value 38 Information on Joint Ventures 41 © Monogram Residential Trust, Inc. 2 Definitions and other Explanatory Information 42 Co-Investment Venture Partners Net Asset Value Equity Capitalization Capital Deployment Operating Performance Portfolio Overview Financial Information
Forward-Looking Statements First Quarter 2016 This supplemental package contains certain statements that may be considered “forward-looking statements” within the meaning of Section 27A of the Securities Act of 1933, as amended, and Section 21E of the Securities Exchange Act of 1934, as amended. Such forward-looking statements can generally be identified by our use of forward-looking terminology such as “may,” “will,” “expect,” “intend,” “anticipate,” “estimate,” “believe,” “continue,” or other similar words. Monogram Residential Trust, Inc. (which together with its subsidiaries may be referred to as the “Company,” “we,” “us,” or “our”) intends these forward-looking statements to be covered by the safe harbor provisions for forward-looking statements contained in the Private Securities Litigation Reform Act of 1995 and are including them in this supplemental financial information for purposes of complying with those safe harbor provisions. Readers are cautioned not to place undue reliance on these forward-looking statements, which speak only as of the date this supplemental financial information is published, and which are subject to certain risks and uncertainties which could cause actual results to differ materially from those projected or anticipated. The following are some of the factors that could cause our actual results and its expectations to differ materially from those described in our forward-looking statements: we may abandon or defer development opportunities for a number of reasons, including, without limitation, changes in local market conditions which make development less desirable, increases in costs of development, increases in the cost of capital or lack of capital availability, resulting in losses; construction costs of a community may exceed our original estimates; we may not complete construction and lease up of communities under development or redevelopment on schedule, resulting in increased interest costs and construction costs and a decrease in our expected rental revenues; occupancy rates and market rents may be adversely affected by competition and local economic and market conditions which are beyond our control; financing may not be available on favorable terms or at all, and our cash flows from operations and access to cost effective capital may be insufficient for the growth of our development program which could limit our pursuit of opportunities; our cash flows may be insufficient to meet required payments of principal and interest, and we may be unable to refinance existing indebtedness or the terms of such refinancing may not be as favorable as the terms of existing indebtedness; and we may be unsuccessful in managing changes in our portfolio composition. Other important risk factors regarding our Company are included under the caption “Risk Factors” in our Annual Report on Form 10-K for the year ended December 31, 2015 and may be discussed in subsequent filings with the SEC. We do not intend to publicly update or revise any forward-looking statements, whether as a result of new information, future events, or otherwise. © Monogram Residential Trust, Inc. 3
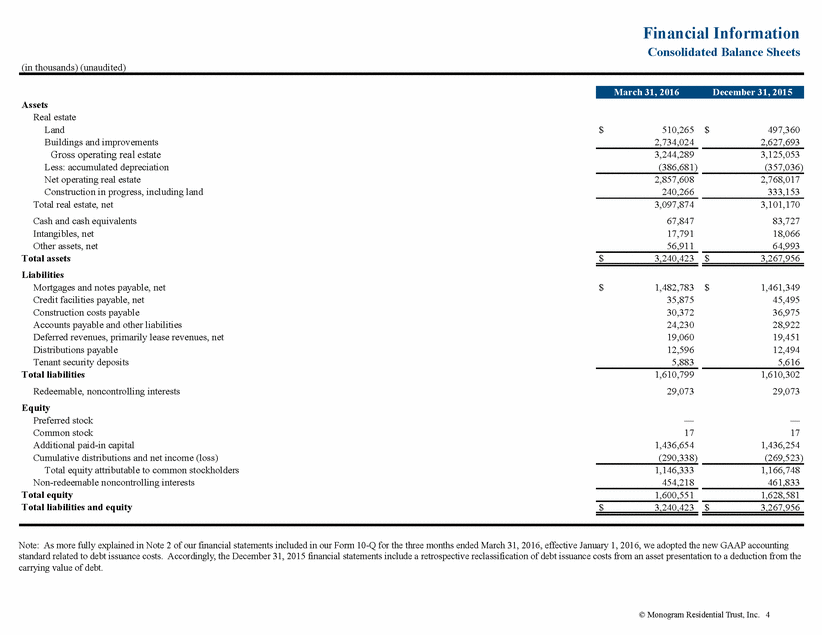
Financial Information Consolidated Balance Sheets (in thousands) (unaudited) Assets Real estate Land Buildings and improvements Gross operating real estate Less: accumulated depreciation Net operating real estate Construction in progress, including land Total real estate, net Cash and cash equivalents Intangibles, net Other assets, net Total assets Liabilities Mortgages and notes payable, net Credit facilities payable, net Construction costs payable Accounts payable and other liabilities Deferred revenues, primarily lease revenues, net Distributions payable Tenant security deposits Total liabilities Redeemable, noncontrolling interests Equity Preferred stock Common stock Additional paid-in capital Cumulative distributions and net income (loss) Total equity attributable to common stockholders Non-redeemable noncontrolling interests Total equity Total liabilities and equity $ 510,265 2,734,024 $ 497,360 2,627,693 3,244,289 (386,681) 3,125,053 (357,036) 2,857,608 240,266 2,768,017 333,153 3,097,874 67,847 17,791 56,911 3,101,170 83,727 18,066 64,993 $ 3,240,423 $ 3,267,956 $ 1,482,783 35,875 30,372 24,230 19,060 12,596 5,883 $ 1,461,349 45,495 36,975 28,922 19,451 12,494 5,616 1,610,799 29,073 1,610,302 29,073 — 17 1,436,654 (290,338) — 17 1,436,254 (269,523) 1,146,333 454,218 1,166,748 461,833 1,600,551 1,628,581 $ 3,240,423 $ 3,267,956 Note: As more fully explained in Note 2 of our financial statements included in our Form 10-Q for the three months ended March 31, 2016, effective January 1, 2016, we adopted the new GAAP accounting standard related to debt issuance costs. Accordingly, the December 31, 2015 financial statements include a retrospective reclassification of debt issuance costs from an asset presentation to a deduction from the carrying value of debt. © Monogram Residential Trust, Inc. 4 March 31, 2016 December 31, 2015
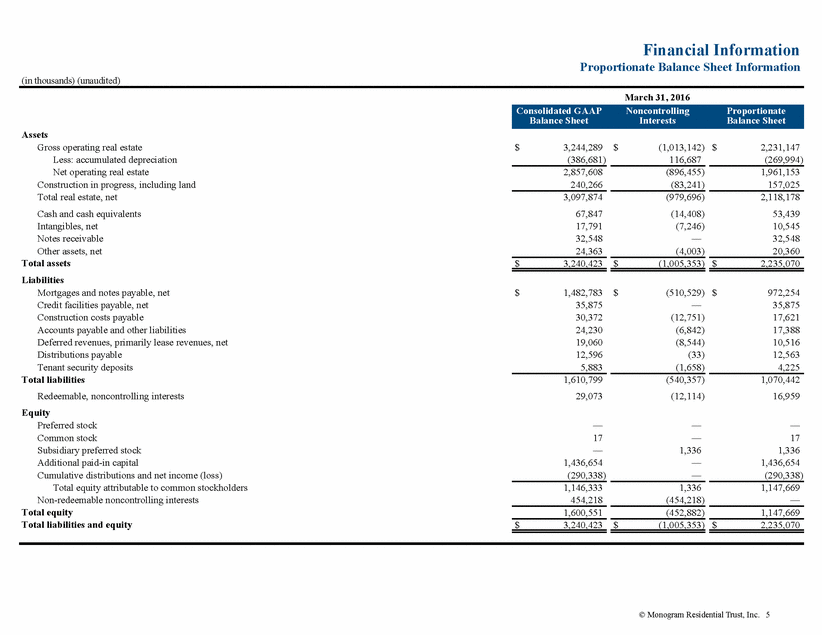
Financial Information Proportionate Balance Sheet Information (in thousands) (unaudited) March 31, 2016 Assets Gross operating real estate Less: accumulated depreciation Net operating real estate Construction in progress, including land Total real estate, net Cash and cash equivalents Intangibles, net Notes receivable Other assets, net Total assets Liabilities Mortgages and notes payable, net Credit facilities payable, net Construction costs payable Accounts payable and other liabilities Deferred revenues, primarily lease revenues, net Distributions payable Tenant security deposits Total liabilities Redeemable, noncontrolling interests Equity Preferred stock Common stock Subsidiary preferred stock Additional paid-in capital Cumulative distributions and net income (loss) Total equity attributable to common stockholders Non-redeemable noncontrolling interests Total equity Total liabilities and equity $ 3,244,289 (386,681) $ (1,013,142) 116,687 $ 2,231,147 (269,994) 2,857,608 240,266 (896,455) (83,241) 1,961,153 157,025 3,097,874 67,847 17,791 32,548 24,363 (979,696) (14,408) (7,246) — (4,003) 2,118,178 53,439 10,545 32,548 20,360 $ 3,240,423 $ (1,005,353) $ 2,235,070 $ 1,482,783 35,875 30,372 24,230 19,060 12,596 5,883 $ (510,529) — (12,751) (6,842) (8,544) (33) (1,658) $ 972,254 35,875 17,621 17,388 10,516 12,563 4,225 1,610,799 29,073 (540,357) (12,114) 1,070,442 16,959 — 17 — 1,436,654 (290,338) — — 1,336 — — — 17 1,336 1,436,654 (290,338) 1,146,333 454,218 1,336 (454,218) 1,147,669 — 1,600,551 (452,882) 1,147,669 $ 3,240,423 $ (1,005,353) $ 2,235,070 © Monogram Residential Trust, Inc. 5 Consolidated GAAP Noncontrolling Proportionate Balance Sheet Interests Balance Sheet
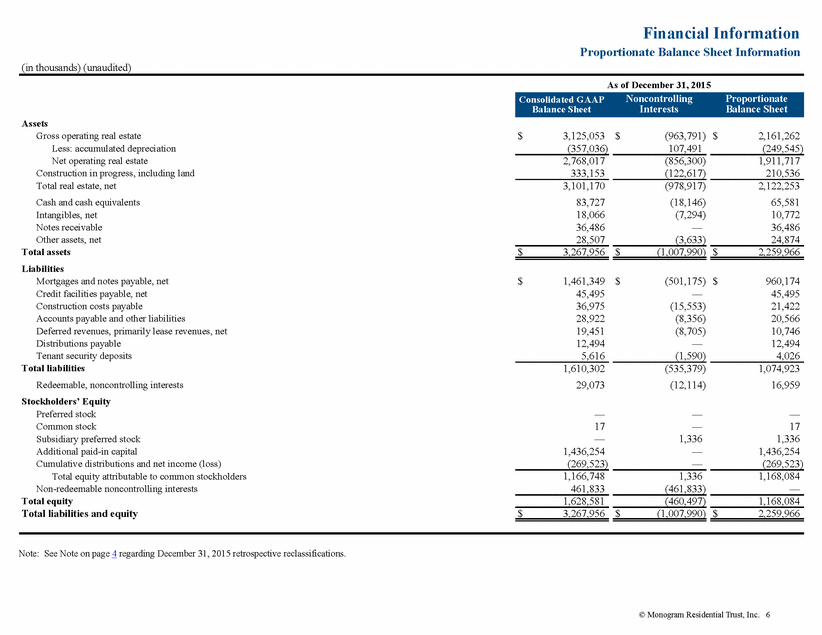
Financial Information Proportionate Balance Sheet Information (in thousands) (unaudited) As of December 31, 2015 Interests Balance Sheet Balance Sheet Assets Gross operating real estate Less: accumulated depreciation Net operating real estate Construction in progress, including land Total real estate, net Cash and cash equivalents Intangibles, net Notes receivable Other assets, net Total assets Liabilities Mortgages and notes payable, net Credit facilities payable, net Construction costs payable Accounts payable and other liabilities Deferred revenues, primarily lease revenues, net Distributions payable Tenant security deposits Total liabilities Redeemable, noncontrolling interests Stockholders’ Equity Preferred stock Common stock Subsidiary preferred stock Additional paid-in capital Cumulative distributions and net income (loss) Total equity attributable to common stockholders Non-redeemable noncontrolling interests Total equity Total liabilities and equity $ 3,125,053 (357,036) $ (963,791) 107,491 $ 2,161,262 (249,545) 2,768,017 333,153 (856,300) (122,617) 1,911,717 210,536 3,101,170 83,727 18,066 36,486 28,507 (978,917) (18,146) (7,294) — (3,633) 2,122,253 65,581 10,772 36,486 24,874 $ 3,267,956 $ (1,007,990) $ 2,259,966 $ 1,461,349 45,495 36,975 28,922 19,451 12,494 5,616 $ (501,175) — (15,553) (8,356) (8,705) — (1,590) $ 960,174 45,495 21,422 20,566 10,746 12,494 4,026 1,610,302 29,073 (535,379) (12,114) 1,074,923 16,959 — 17 — 1,436,254 (269,523) — — 1,336 — — — 17 1,336 1,436,254 (269,523) 1,166,748 461,833 1,336 (461,833) 1,168,084 — 1,628,581 (460,497) 1,168,084 $ 3,267,956 $ (1,007,990) $ 2,259,966 Note: See Note on page 4 regarding December 31, 2015 retrospective reclassifications. © Monogram Residential Trust, Inc. 6 Consolidated GAAP Noncontrolling Proportionate
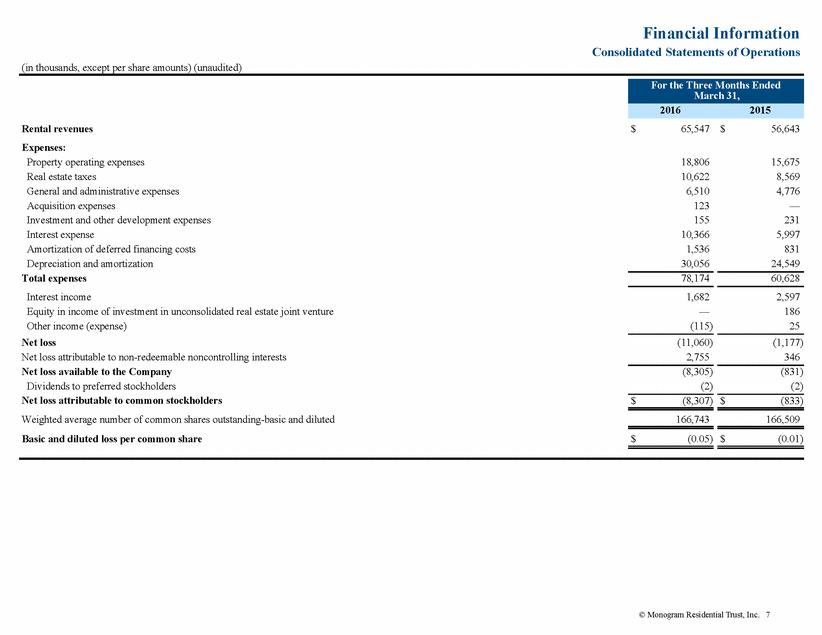
Financial Information Consolidated Statements of Operations (in thousands, except per share amounts) (unaudited) Rental revenues Expenses: Property operating expenses Real estate taxes General and administrative expenses Acquisition expenses Investment and other development expenses Interest expense Amortization of deferred financing costs Depreciation and amortization Total expenses Interest income Equity in income of investment in unconsolidated real estate joint venture Other income (expense) Net loss Net loss attributable to non-redeemable noncontrolling interests Net loss available to the Company Dividends to preferred stockholders Net loss attributable to common stockholders Weighted average number of common shares outstanding-basic and diluted Basic and diluted loss per common share $ 65,547 $ 56,643 18,806 10,622 6,510 123 155 10,366 1,536 30,056 15,675 8,569 4,776 — 231 5,997 831 24,549 78,174 60,628 1,682 — (115) 2,597 186 25 (11,060) 2,755 (1,177) 346 (8,305) (2) (831) (2) $ (8,307) $ (833) 166,743 166,509 $ (0.05) $ (0.01) © Monogram Residential Trust, Inc. 7 For the Three Months Ended March 31, 2016 2015
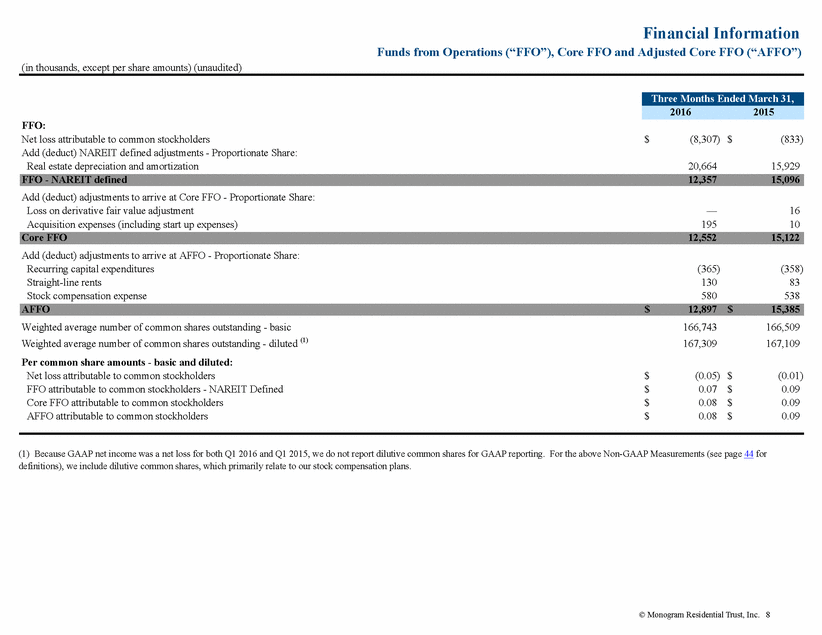
Financial Information Funds from Operations (“FFO”), Core FFO and Adjusted Core FFO (“AFFO”) (in thousands, except per share amounts) (unaudited) FFO: Net loss attributable to common stockholders Add (deduct) NAREIT defined adjustments - Proportionate Share: Real estate depreciation and amortization $ (8,307) $ (833) 20,664 15,929 Add (deduct) adjustments to arrive at Core FFO - Proportionate Share: Loss on derivative fair value adjustment Acquisition expenses (including start up expenses) — 195 16 10 Add (deduct) adjustments to arrive at AFFO - Proportionate Share: Recurring capital expenditures Straight-line rents Stock compensation expense (365) 130 580 (358) 83 538 Weighted average number of common shares outstanding - basic Weighted average number of common shares outstanding - diluted (1) Per common share amounts - basic and diluted: Net loss attributable to common stockholders FFO attributable to common stockholders - NAREIT Defined Core FFO attributable to common stockholders AFFO attributable to common stockholders 166,743 167,309 166,509 167,109 $ $ $ $ (0.05) 0.07 0.08 0.08 $ $ $ $ (0.01) 0.09 0.09 0.09 (1) Because GAAP net income was a net loss for both Q1 2016 and Q1 2015, we do not report dilutive common shares for GAAP reporting. For the above Non-GAAP Measurements (see page 44 for definitions), we include dilutive common shares, which primarily relate to our stock compensation plans. © Monogram Residential Trust, Inc. 8 AFFO $12,897 $15,385 Core FFO 12,552 15,122 FFO - NAREIT defined 12,357 15,096 Three Months Ended March 31, 20162015
Financial Information Proportionate YTD Operating Information and Reconciliation to FFO (in thousands) (unaudited) Rental revenues Property operating expenses: Property operating expenses (including real estate taxes) Net operating income - FFO Defined Fee income: Asset management fees Property management fees Total fee income Other: General and administrative expenses Corporate property management expenses Acquisition expenses (including start up expenses) Straight-line rents Stock compensation expense Investment and other development expenses Interest expense (1) Interest income Equity in income of investments in unconsolidated real estate joint ventures Other income (expense) Dividends to preferred stockholders Depreciation and amortization related to non-real estate assets Total other adjustments FFO - NAREIT defined $ 65,789 $ (19,884) $ 45,905 $ 56,837 $ — $ (19,633) $ 37,204 (26,725) 8,417 (18,308) (22,441) — 7,741 (14,700) 39,064 (11,467) 27,597 34,396 — (11,892) 22,504 — — 375 754 375 754 — — — — 425 728 425 728 — 1,129 1,129 — — 1,153 1,153 (6,019) (2,512) (225) (242) (580) (155) (11,902) 1,682 — (115) (87) (133) 237 — 30 112 — 66 3,418 (3) — 25 32 2 (5,782) (2,512) (195) (130) (580) (89) (8,484) 1,679 — (90) (55) (131) (4,281) (1,771) (12) (194) (538) (231) (6,828) 2,597 186 25 (85) (136) (7) — — — — — — 101 (186) 10 (1) — 182 (8) 2 111 — 97 2,332 (120) — 154 36 4 (4,106) (1,779) (10) (83) (538) (134) (4,496) 2,578 — 189 (50) (132) (20,288) 3,919 (16,369) (11,268) (83) 2,790 (8,561) $ 18,776 $ (6,419) $ 12,357 $ 23,128 $ (83) $ (7,949) $ 15,096 Note: Certain amounts from the consolidated financial statements differ from the consolidated amounts above due to non-FFO items or reclassifications (e.g., straight-line rents, corporate property management expenses, stock compensation expenses, etc.) (1) See page 10 for components of interest expense, including contractual interest, capitalized interest, amortization of deferred financing costs and other finance fees. © Monogram Residential Trust, Inc. 9 Three Months Ended March 31, 2015 Proportionate Share of Non-Consolidated Unconsolidated controlling Proportionate Amount Joint Venture Interests Amount Three Months Ended March 31, 2016 Non-Consolidated controlling Proportionate AmountInterestsAmount
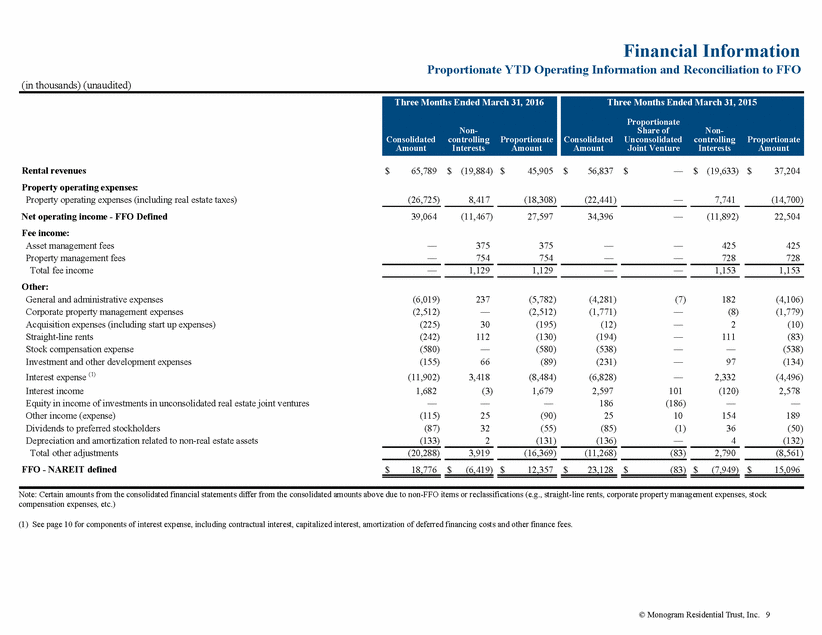
Financial Information EBITDA Reconciliation (in thousands) (unaudited) Reconciliation of loss from continuing operations to Adjusted EBITDA: Loss from continuing operations before gains on sales of real estate - Consolidated Depreciation and amortization (2) Interest expense (1) Acquisition expenses Loss on derivative fair value adjustment Non-redeemable noncontrolling interests expense (subsidiary preferred units dividends) $ (11,060) 31,836 9,774 123 — 87 $ (1,177) 25,624 5,298 — 16 85 Loss from continuing operations before gains on sales of real estate - Proportionate Share Depreciation and amortization (2) Interest expense (1) Acquisition expenses Loss on derivative fair value adjustment Non-redeemable noncontrolling interests expense (subsidiary preferred units dividends) $ (8,371) 22,150 6,685 123 — 55 $ (978) 16,847 3,146 — 16 50 Consolidated Proportionate Share Three Months Ended March 31, Three Months Ended March 31, Reconciliation of interest expense: Contractual interest expense Less: Capitalized interest Mortgage premium amortization Plus: Credit facility and other finance fees Amortization of deferred financing costs Interest expense for GAAP Less: Credit facility and other finance fees Amortization of deferred financing costs EBITDA interest adjustment Reconciliation of depreciation and amortization expense: Depreciation and amortization expense for GAAP Plus: Purchase accounting intangible expense Amortization of deferred financing costs EBITDA depreciation and amortization adjustment 2016 2015 2016 2015 (1) $ 12,604 (2,417) (413) 592 1,536 $ 10,596 (4,758) (540) 699 831 $ 8,524 (1,539) (300) 592 1,207 $ 6,316 (2,872) (298) 699 651 11,902 (592) (1,536) 6,828 (699) (831) 8,484 (592) (1,207) 4,496 (699) (651) $ 9,774 $ 5,298 $ 6,685 $ 3,146 (2) $ 30,056 244 1,536 $ 24,549 244 831 $ 20,809 134 1,207 $ 16,061 135 651 $ 31,836 $ 25,624 $ 22,150 $ 16,847 © Monogram Residential Trust, Inc. 10 Adjusted EBITDA - Proportionate Share $20,642 $19,081 Adjusted EBITDA - Consolidated $30,760 $29,846 Three Months Ended March 31, 2016 2015
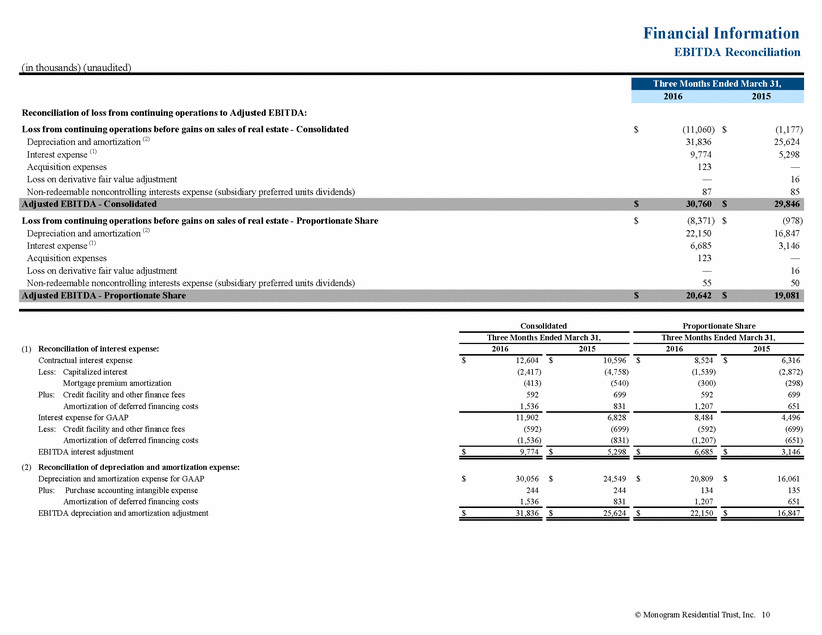
Portfolio Overview Equity Investments by Geographic Regions As of March 31, 2016 Texas 10 /1 *Operating (46 communities) *Development (6 communities) Note: Excludes 3 debt investments © Monogram Residential Trust, Inc. 11
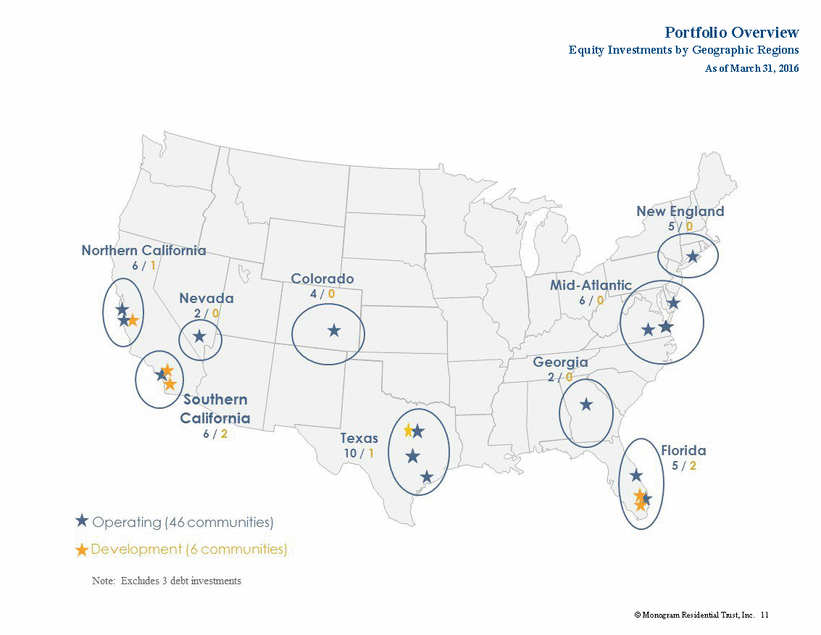
Portfolio Overview Summary of Number of Units and Communities Total Units Total Communities Equity Investments: Same Store Wholly owned (1) Consolidated joint ventures 2,912 5,784 1,769 7,002 10 22 6 25 Stabilized - Non Comparable Wholly owned Consolidated joint ventures 208 1,677 202 1,470 1 7 1 6 Lease up (including operating communities and developments in lease up) Wholly owned Consolidated joint ventures 208 2,165 — 398 1 6 — 2 Developments under Construction and Pre-development Wholly owned Consolidated joint ventures 120 1,021 — 3,772 1 3 — 11 Land Held for Future Development Debt Investments: Mezzanine Loans - Development, Lease up, and Stabilized Wholly owned Unconsolidated joint venture 1,116 — 1,069 444 3 — 3 1 Recap of Totals by Category Wholly owned Consolidated joint ventures Unconsolidated joint ventures 4,564 10,647 — 3,040 12,642 444 16 39 — 10 45 1 (1) Includes five multifamily communities with 1,631 units acquired from PGGM in May 2015 that became wholly owned from that date forward. © Monogram Residential Trust, Inc. 12 Total Communities - Equity and Debt Investments 15,211 16,126 55 56 Total Communities - Equity and Debt Investments 15,211 16,126 55 56 Total Communities - Debt Investments 1,116 1,513 34 Total Communities - Equity Investments 14,095 14,613 52 52 Consolidated Joint Venture N/A N/A 11 Total Developments under Construction and Pre-development 1,141 3,772 41 1 Total Lease up (including operating communities and developments in lease up) 2,373 398 72 Total Stabilized - Non Comparable 1,885 1,672 87 Total Stabilized 10,581 10,443 40 38 Total Same Store 8,696 8,771 32 31 March 31, 2016 March 31, 2015 March 31, 2016 March 31, 2015
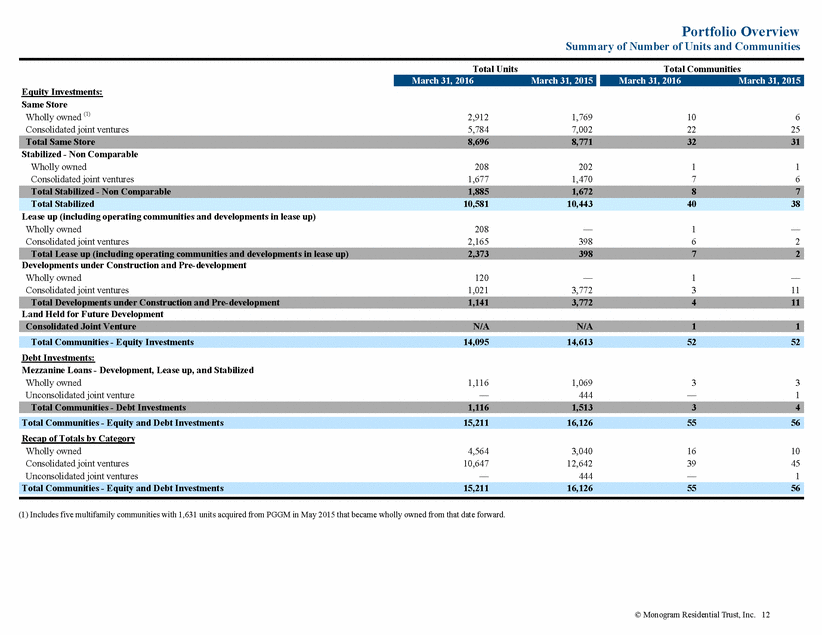
Portfolio Overview Summary of Operating Communities As of March 31, 2016 Same Store Communities: Wholly owned Skye 2905 (1) Consolidated joint ventures 4550 Cherry Creek 7166 at Belmar Denver, CO 100% 2010 400 Denver, CO Lakewood, CO 55% 55% 2004 2008 288 308 Wholly owned The District Universal Boulevard (1) Consolidated joint venture Satori The Franklin Delray Orlando, FL 100% 2009 425 Fort Lauderdale, FL Delray Beach, FL 55% 55% 2010 2013 279 180 Wholly owned The Reserve at LaVista Walk Atlanta, GA 100% 2008 283 Wholly owned The Cameron (1) Consolidated joint ventures 55 Hundred Bailey's Crossing Burrough's Mill The Lofts at Park Crest Silver Spring, MD 100% 2010 325 Arlington, VA Alexandria, VA Cherry Hill, NJ McLean, VA 55% 55% 55% 55% 2010 2010 2004 2008 234 414 308 131 Consolidated joint ventures The Venue Veritas (1) Clark County, NV Henderson, NV 55% 100% 2009 2011 168 430 Wholly owned Pembroke Woods Stone Gate (1) Consolidated joint venture West Village Pembroke, MA Marlborough, MA 100% 100% 2006 2007 240 332 Mansfield, MA 55% 2008 200 (Table continued on next page; see page 16 for footnotes) © Monogram Residential Trust, Inc. 13 New England Totals 7727.9% Nevada Totals 5984.0% Mid-Atlantic Totals 1,412 17.4% Georgia Totals 283 2.1% Florida Totals 884 9.2% Colorado Totals 996 12.8% Current Year of Completion or Most Percentage of Portfolio Based on Effective Recent Substantial Consolidated YTD 2016 Same Location Ownership Development Units Store NOI
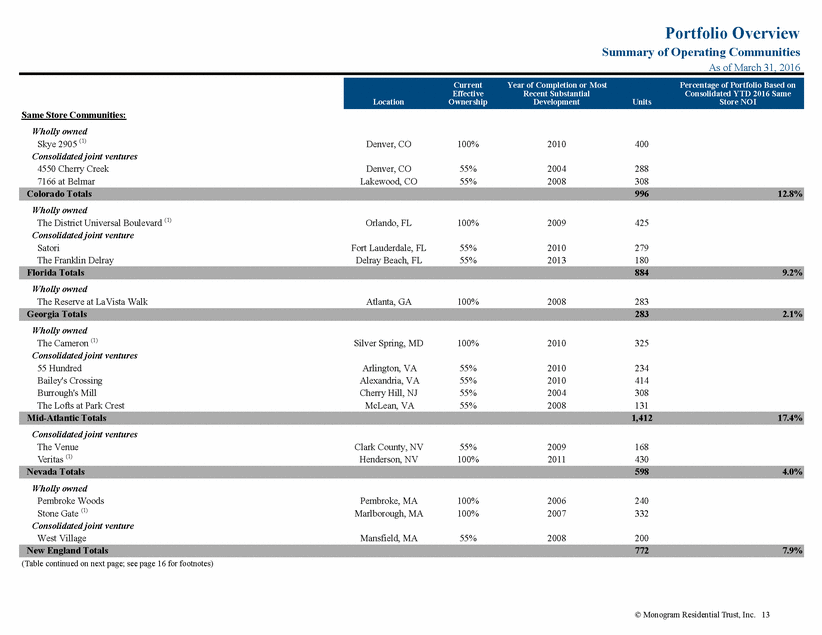
Portfolio Overview Summary of Operating Communities As of March 31, 2016 Same Store Communities (continued): Wholly owned Acappella Vara Consolidated joint ventures Acacia on Santa Rosa Creek Argenta Renaissance (Phase I) San Bruno, CA San Francisco, CA 100% 100% 2010 2013 163 202 Santa Rosa, CA San Francisco, CA Concord, CA 55% 55% 55% 2003 2008 2008 277 179 134 Consolidated joint ventures Calypso Apartments and Lofts Forty55 Lofts The Gallery at NoHo Commons San Sebastian Irvine, CA Marina del Rey, CA Los Angeles, CA Laguna Woods, CA 55% 55% 55% 55% 2008 2010 2008 2010 177 140 438 134 Wholly owned Allegro (2) Grand Reserve (1) Consolidated joint ventures Allusion West University Briar Forest Lofts Eclipse Fitzhugh Urban Flats Addison, TX Dallas, TX 100% 100% 2013 2009 393 149 Houston, TX Houston, TX Houston, TX Dallas, TX 55% 55% 55% 55% 2014 2008 2009 2009 231 352 330 452 Stabilized Non-Comparable Communities: Consolidated joint venture Point 21 Denver, CO 55% 2015 212 Wholly Owned The Mark Boca Raton, FL 100% 2015 208 (Table continued on next page; see page 16 for footnotes) © Monogram Residential Trust, Inc. 14 Florida Totals 208 Colorado Totals 212 Total Same Store Communities 2009 8,696 100.0% Texas Totals 1,907 14.5% Southern California Totals 889 13.8% Northern California Totals 955 18.3% Current Year of Completion or Most Percentage of Portfolio Based on Effective Recent Substantial Consolidated YTD 2016 Same Location Ownership Development Units Store NOI
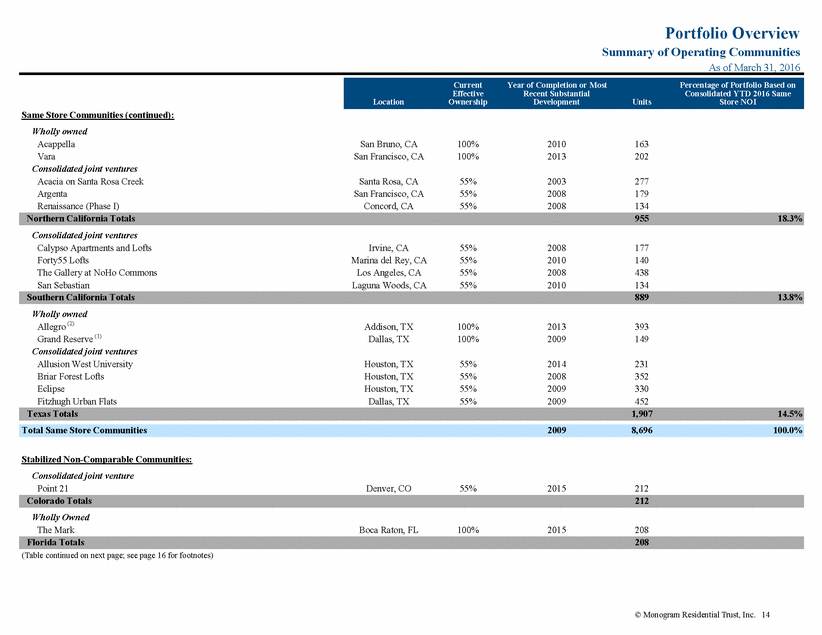
Portfolio Overview Summary of Operating Communities As of March 31, 2016 Stabilized Non-Comparable Communities (continued): Consolidated joint venture Everly Wakefield, MA 55% 2014 186 Consolidated joint venture Blue Sol Costa Mesa, CA 100% 2014 113 Consolidated joint ventures 4110 Fairmount Arpeggio Victory Park Muse Museum District SEVEN Dallas, TX Dallas, TX Houston, TX Austin, TX 55% 55% 55% 55% 2014 2014 2014 2015 299 377 270 220 Lease up (including operating communities and developments in lease up): (3) Consolidated joint venture SoMa Miami, FL 55% 2016 418 Consolidated joint venture Cyan on Peachtree Atlanta, GA 55% 2015 329 Consolidated joint venture Nouvelle Tysons Corner, VA 55% 2015 461 Consolidated joint venture Zinc Cambridge, MA 55% 2015 392 (Table continued on next page; see page 16 for footnotes) © Monogram Residential Trust, Inc. 15 New England Totals 392 Mid-Atlantic Totals 461 Georgia Totals 329 Florida Totals 418 Total Stabilized / Non-Comparable Communities 20141,885 Texas Totals 1,166 Southern California Totals 113 New England Totals 186 Current Year of Completion or Most Percentage of Portfolio Based on Effective Recent Substantial Consolidated YTD 2016 Same Location Ownership Development Units Store NOI
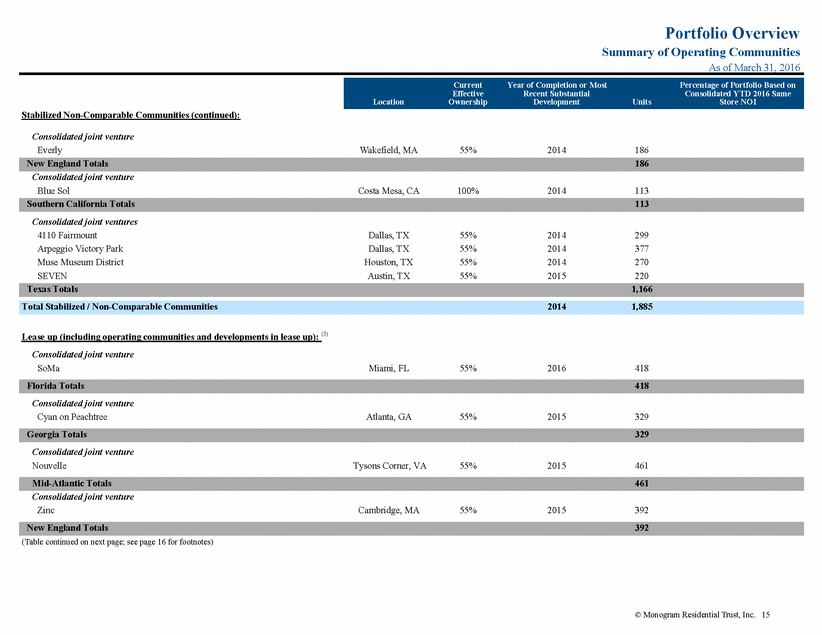
Portfolio Overview Summary of Operating Communities As of March 31, 2016 Lease up (including operating communities and developments in lease up) (continued): (3) Consolidated joint venture OLUME San Francisco, CA 55% 2016 121 Wholly owned Ev Consolidated joint venture Verge San Diego, CA 100% 2015 208 San Diego, CA 70% N/A 444 (1) Acquired noncontrolling interests from PGGM in May 2015. For all but Veritas, we now own 100%. For Veritas, our effective ownership is 100% and based on contributed capital is 93.5%. We report all of these communities for all periods as same store. (2) During 2013, we completed the development of the second phase of Allegro which added an additional 121 units. The property was initially completed in 2010. (3) These are communities included in the GAAP presentation in land, building and improvements where Verge for GAAP presentation is partially included in land, buildings and improvements and the remaining balance is reflected in construction in progress on the consolidated balance sheet. © Monogram Residential Trust, Inc. 16 Total Operating Communities 20101 2,954 Total Lease up Communities 2015 2,373 Southern California Totals 652 Northern California Totals 121 Current Year of Completion or Most Percentage of Portfolio Based on Effective Recent Substantial Consolidated YTD 2016 Same Location Ownership Development Units Store NOI
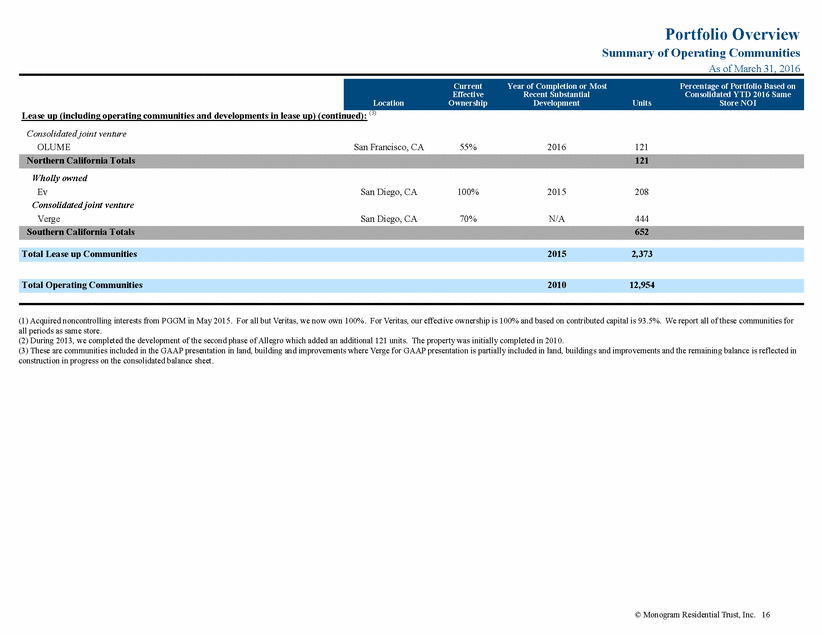
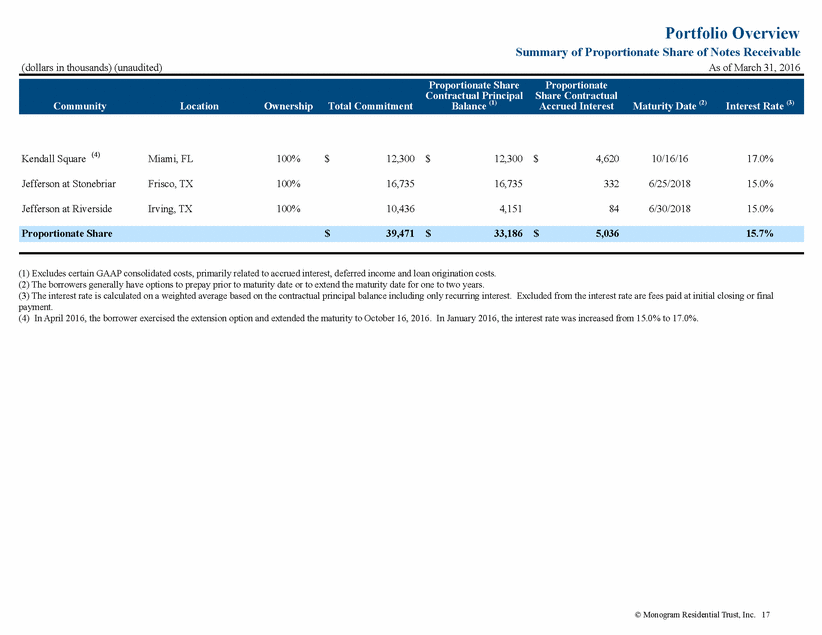
Portfolio Overview Summary of Proportionate Share of Notes Receivable As of March 31, 2016 (dollars in thousands) (unaudited) Balance (1) Maturity Date (2) Interest Rate (3) Community Location Ownership Total Commitment Accrued Interest (4) Kendall Square Miami, FL 100% $ 12,300 $ 12,300 $ 4,620 10/16/16 17.0% Jefferson at Stonebriar Frisco, TX 100% 16,735 16,735 332 6/25/2018 15.0% Jefferson at Riverside Irving, TX 100% 10,436 4,151 84 6/30/2018 15.0% (1) Excludes certain GAAP consolidated costs, primarily related to accrued interest, deferred income and loan origination costs. (2) The borrowers generally have options to prepay prior to maturity date or to extend the maturity date for one to two years. (3) The interest rate is calculated on a weighted average based on the contractual principal balance including only recurring interest. Excluded from the interest rate are fees paid at initial closing or final payment. (4) In April 2016, the borrower exercised the extension option and extended the maturity to October 16, 2016. In January 2016, the interest rate was increased from 15.0% to 17.0%. © Monogram Residential Trust, Inc. 17 Proportionate Share $39,471 $33,186 $5,036 15.7% Proportionate Share Proportionate Contractual Principal Share Contractual
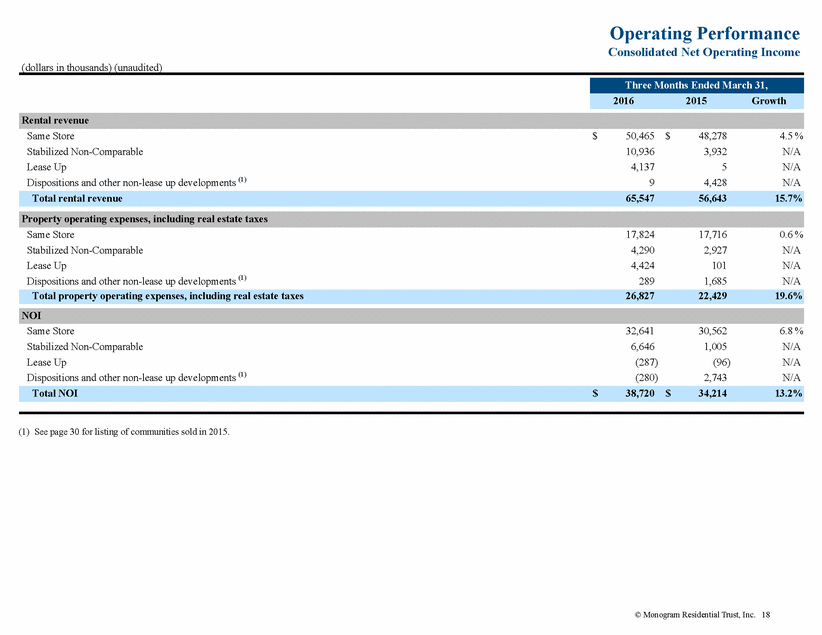
Operating Performance Consolidated Net Operating Income (dollars in thousands) (unaudited) Same Store Stabilized Non-Comparable Lease Up Dispositions and other non-lease up developments (1) $ 50,465 10,936 4,137 9 $ 48,278 3,932 5 4,428 4.5 % N/A N/A N/A Same Store Stabilized Non-Comparable Lease Up Dispositions and other non-lease up developments (1) 17,824 4,290 4,424 289 17,716 2,927 101 1,685 0.6 % N/A N/A N/A Same Store Stabilized Non-Comparable Lease Up Dispositions and other non-lease up developments (1) 32,641 6,646 (287) (280) 30,562 1,005 (96) 2,743 6.8 % N/A N/A N/A (1) See page 30 for listing of communities sold in 2015. © Monogram Residential Trust, Inc. 18 Total NOI $38,720 $34,214 13.2% NOI Total property operating expenses, including real estate taxes 26,827 22,429 19.6% Property operating expenses, including real estate taxes Total rental revenue 65,547 56,643 15.7% Rental revenue Three Months Ended March 31, 2016 2015 Growth
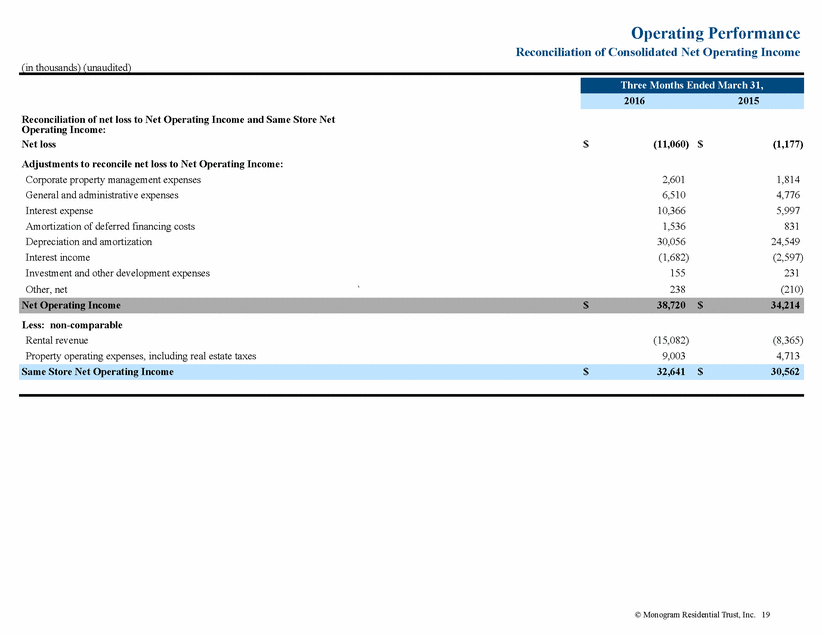
Operating Performance Reconciliation of Consolidated Net Operating Income (in thousands) (unaudited) Reconciliation of net loss to Net Operating Income and Same Store Net Operating Income: Net loss Adjustments to reconcile net loss to Net Operating Income: Corporate property management expenses General and administrative expenses Interest expense Amortization of deferred financing costs Depreciation and amortization Interest income Investment and other development expenses Other, net $ (11,060) $ (1,177) 2,601 6,510 10,366 1,536 30,056 (1,682) 155 238 1,814 4,776 5,997 831 24,549 (2,597) 231 (210) ` Less: non-comparable Rental revenue Property operating expenses, including real estate taxes (15,082) 9,003 (8,365) 4,713 © Monogram Residential Trust, Inc. 19 Same Store Net Operating Income $32,641 $30,562 Net Operating Income $38,720 $34,214 Three Months Ended March 31, 2016 2015
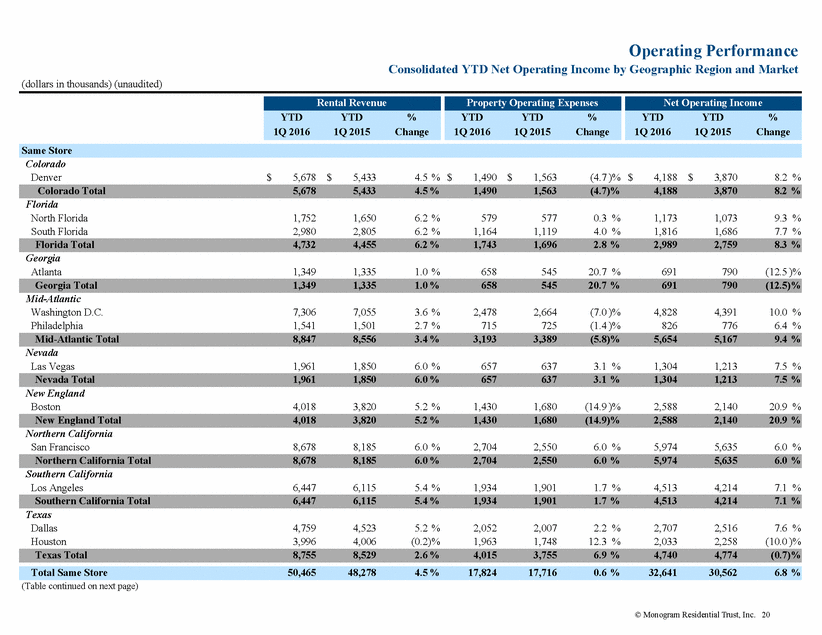
Operating Performance Consolidated YTD Net Operating Income by Geographic Region and Market (dollars in thousands) (unaudited) Colorado Denver $ 5,678 $ 5,433 4.5 % $ 1,490 $ 1,563 (4.7 )% $ 4,188 $ 3,870 8.2 % Florida North Florida South Florida 1,752 2,980 1,650 2,805 6.2 % 6.2 % 579 1,164 577 1,119 0.3 % 4.0 % 1,173 1,816 1,073 1,686 9.3 % 7.7 % Georgia Atlanta 1,349 1,335 1.0 % 658 545 20.7 % 691 790 (12.5 )% Mid-Atlantic Washington D.C. Philadelphia 7,306 1,541 7,055 1,501 3.6 % 2.7 % 2,478 715 2,664 725 (7.0 )% (1.4 )% 4,828 826 4,391 776 10.0 % 6.4 % Nevada Las Vegas 1,961 1,850 6.0 % 657 637 3.1 % 1,304 1,213 7.5 % New England Boston 4,018 3,820 5.2 % 1,430 1,680 (14.9 )% 2,588 2,140 20.9 % Northern California San Francisco 8,678 8,185 6.0 % 2,704 2,550 6.0 % 5,974 5,635 6.0 % Southern California Los Angeles 6,447 6,115 5.4 % 1,934 1,901 1.7 % 4,513 4,214 7.1 % Texas Dallas Houston 4,759 3,996 4,523 4,006 5.2 % (0.2)% 2,052 1,963 2,007 1,748 2.2 % 12.3 % 2,707 2,033 2,516 2,258 7.6 % (10.0 )% (Table continued on next page) © Monogram Residential Trust, Inc. 20 Total Same Store 50,465 48,278 4.5% 17,824 17,716 0.6% 32,641 30,562 6.8% Texas Total 8,755 8,529 2.6% 4,015 3,755 6.9% 4,740 4,774 (0.7)% Southern California Total 6,447 6,115 5.4% 1,934 1,901 1.7% 4,513 4,214 7.1% Northern California Total 8,678 8,185 6.0% 2,704 2,550 6.0% 5,974 5,635 6.0% New England Total 4,018 3,820 5.2% 1,430 1,680 (14.9)% 2,588 2,1402 0.9% Nevada Total 1,961 1,850 6.0% 65 76 37 3.1% 1,304 1,213 7.5% Mid-Atlantic Total 8,847 8,556 3.4% 3,193 3,389 (5.8)% 5,654 5,167 9.4% Georgia Total 1,349 1,335 1.0% 65 85 45 20.7% 69 17 90 (12.5)% Florida Total 4,732 4,455 6.2% 1,743 1,696 2.8% 2,989 2,759 8.3% Colorado Total 5,678 5,433 4.5% 1,490 1,563 (4.7)% 4,188 3,870 8.2% Same Store Net Operating Income YTD YTD % 1Q 2016 1Q 2015 Change Property Operating Expenses YTD YTD % 1Q 2016 1Q 2015 Change Rental Revenue YTD YTD % 1Q 2016 1Q 2015 Change
Operating Performance Consolidated YTD Net Operating Income by Geographic Region and Market (dollars in thousands) (unaudited) Colorado Denver 1,192 74 N/A 364 213 N/A 828 (139) N/A Florida South Florida 1,454 — N/A 637 — N/A 817 — N/A New England Boston 1,138 299 N/A 323 367 N/A 815 (68) N/A Southern California Los Angeles 870 421 N/A 290 366 N/A 580 55 N/A Texas Austin Dallas Houston 1,806 3,045 1,431 9 2,201 928 N/A N/A N/A 721 1,362 593 117 1,281 583 N/A N/A N/A 1,085 1,683 838 (108) 920 345 N/A N/A N/A Florida Georgia Mid-Atlantic New England Northern California Southern California 636 1,460 300 393 12 1,336 — 5 — — — — N/A N/A N/A N/A N/A N/A 725 693 1,002 718 130 1,156 1 70 1 3 1 25 N/A N/A N/A N/A N/A N/A (89) 767 (702) (325) (118) 180 (1) (65) (1) (3) (1) (25) N/A N/A N/A N/A N/A N/A Note: Certain amounts from the Proportionate YTD Operating Information and Reconciliation to FFO on page 9 differ from the amounts above due to adjustments for non-FFO items (e.g., straight-line rents and start up expenses). © Monogram Residential Trust, Inc. 21 Total Portfolio $65,547 $56,643 15.7 % $26,827 $22,429 19.6 % $38,720 $34,214 13.2 % Dispositions and other non-lease up developments 94,428 N/A 289 1,685 N/A (280) 2,743 N/A Total Lease up 4,1375 N/A 4,424 101 N/A (287) (96) N/A Lease up (includes operating and development communities) Total Stabilized Non-Comparable 10,936 3,932 178 % 4,2902,92747 %6,6461,005561 % Texas Total6,2823,138N/A2,6761,981N/A3,6061,157N/A Southern California Total870421N/A290366N/A58055N/A New England Total1,138299N/A323367N/A815(68)N/A Florida Total1,454—N/A637—N/A817—N/A Colorado Total1,19274N/A364213N/A828(139)N/A Stabilized Non-Comparable Net Operating Income YTDYTD% 1Q 20161Q 2015Change Property Operating Expenses YTDYTD% 1Q 20161Q 2015Change Rental Revenue YTDYTD% 1Q 20161Q 2015Change
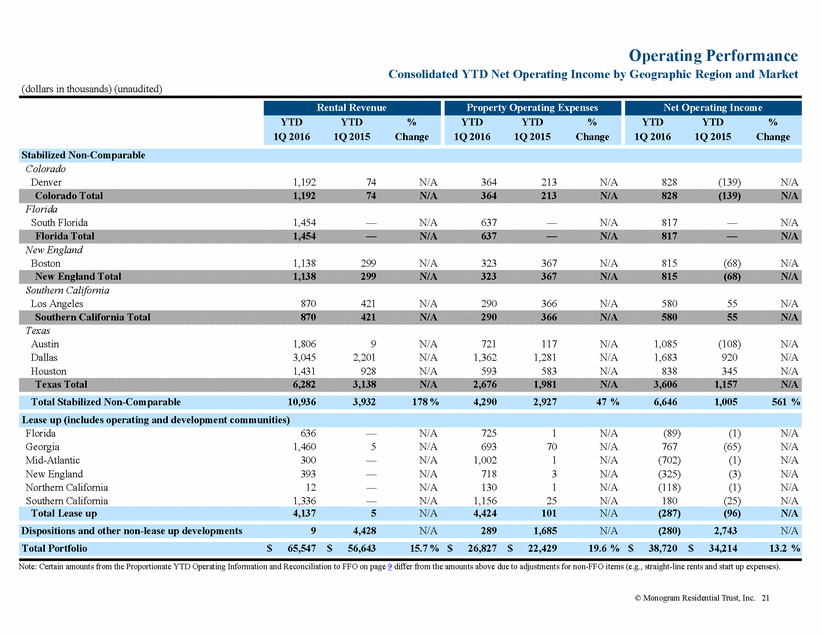
Operating Performance Consolidated YTD Operating Metrics by Geographic Region and Market Colorado Denver 73.8 % 71.2 % 95.1 % 95.2 % 94.9 % 95.4 % $ 1,859 $ 1,762 Florida North Florida South Florida 67.0 % 60.9 % 65.0 % 60.1 % 95.5 % 94.6 % 97.4 % 96.3 % 96.2 % 96.3 % 94.9 % 93.6 % 1,235 2,086 1,198 2,041 Georgia Atlanta 51.2 % 59.2 % 95.8 % 96.1 % 95.5 % 97.5 % 1,459 1,422 Mid-Atlantic Washington D.C. Philadelphia 66.1 % 53.6 % 62.2 % 51.7 % 93.9 % 94.8 % 92.8 % 92.9 % 94.0 % 96.2 % 91.2 % 94.7 % 2,083 1,609 2,110 1,587 Nevada Las Vegas 66.5 % 65.6 % 95.2 % 94.6 % 95.6 % 93.6 % 1,080 1,023 New England Boston 64.4 % 56.0 % 96.5 % 97.8 % 96.6 % 96.2 % 1,668 1,603 Northern California San Francisco 68.8 % 68.8 % 94.6 % 95.5 % 95.2 % 95.8 % 3,005 2,796 Southern California Los Angeles 70.0 % 68.9 % 96.4 % 95.5 % 96.1 % 95.5 % 2,295 2,180 Texas Dallas Houston 56.9 % 50.9 % 55.6 % 56.4 % 94.5 % 93.5 % 95.1 % 92.1 % 95.4 % 95.2 % 94.4 % 93.6 % 1,611 1,423 1,553 1,476 (Table continued on next page) © Monogram Residential Trust, Inc. 22 Total Same Store8,69664.7%63.3%94.9%94.9%95.4%94.5% $1,873$1,813 Texas Total1,90754.1%56.0%94.0%93.7%95.3%94.0%1,5211,516 Southern California Total88970.0%68.9%96.4%95.5%96.1%95.5%2,2952,180 Northern California Total95568.8%68.8%94.6%95.5%95.2%95.8%3,0052,796 New England Total77264.4%56.0%96.5%97.8%96.6%96.2%1,6681,603 Nevada Total59866.5%65.6%95.2%94.6%95.6%93.6%1,0801,023 Mid-Atlantic Total1,41263.9%60.4%94.1%92.8%94.5%91.9%1,9801,996 Georgia Total28351.2%59.2%95.8%96.1%95.5%97.5%1,4591,422 Florida Total88463.2%61.9%95.0%96.8%96.2%94.2%1,6771,635 Colorado Total99673.8%71.2%95.1%95.2%94.9%95.4%1,8591,762 Same Store Monthly Rental Revenue per Unit (1) QTDQTD 1Q 20161Q 2015 Weighted Average Occupancy QTDQTD 1Q 20161Q 2015 Period End Occupancy QTDQTD 1Q 20161Q 2015 Operating Margin YTDYTD 1Q 20161Q 2015 Units QTD 1Q 2016
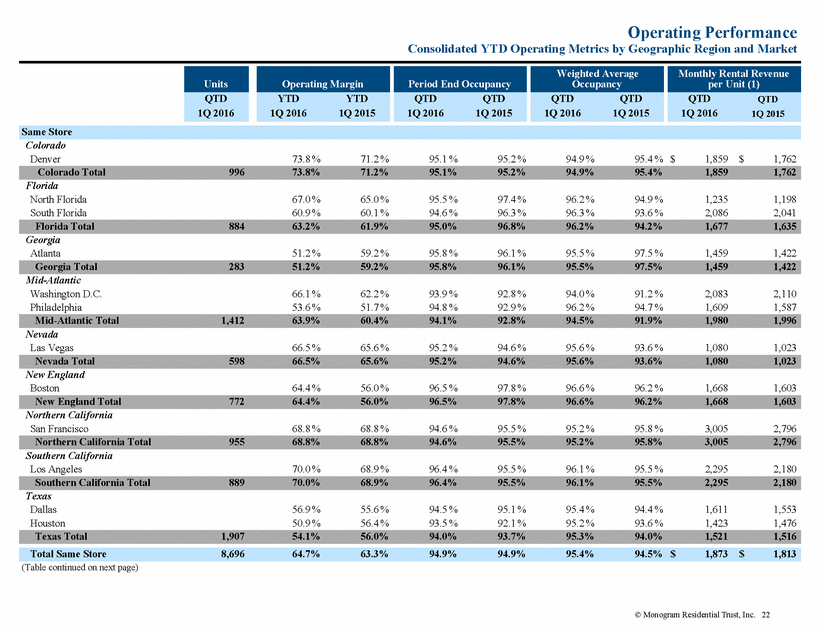
Operating Performance Consolidated YTD Operating Metrics by Geographic Region and Market Colorado Denver 69.5 % N/A 95.3 % 24.5 % 95.4 % 13.4 % 1,884 N/A Florida South Florida 56.2 % N/A 98.6 % N/A 98.2 % N/A 2,320 N/A New England Boston 71.6 % N/A 97.3 % 39.8 % 95.7 % 34.4 % 2,016 N/A Southern California Los Angeles 66.7 % N/A 93.8 % 91.2 % 93.5 % 76.1 % 2,552 N/A Texas Austin Dallas Houston 60.1 % 55.3 % 58.6 % N/A N/A N/A 94.1 % 92.2 % 94.4 % N/A 89.9 % 90.7 % 94.2 % 93.7 % 96.9 % N/A 76.1 % 74.0 % 2,961 1,547 1,786 N/A N/A N/A Florida Georgia Mid-Atlantic New England Northern California Southern California 418 329 461 392 121 652 N/A N/A N/A N/A N/A N/A N/A N/A N/A N/A N/A N/A 32.3 % 82.1 % 20.2 % 22.2 % 12.4 % 49.9 % N/A N/A N/A N/A N/A N/A 25.5 % 73.9 % 13.3 % 18.0 % 1.4 % 41.9 % N/A N/A N/A N/A N/A N/A N/A N/A N/A N/A N/A N/A N/A N/A N/A N/A N/A N/A (1) Monthly rental revenue per unit is only provided for communities that are stabilized as of the end of the period. Monthly rental revenue per unit is not meaningful prior to stabilization. © Monogram Residential Trust, Inc. 23 Total Lease up2,373N/AN/A39.0%N/A31.9%N/AN/A N/A Lease up (includes operating and development communities) Total Stabilized10,58164.0%N/A94.8%88.3%95.4%86.1%1,891N/A Total Stabilized Non-Comparable1,88560.8%N/A94.4%57.5%95.1%47.5%1,976N/A Texas Total1,16657.4%N/A93.1%73.3%94.6%61.4%1,869N/A Southern California Total11366.7%N/A93.8%91.2%93.5%76.1%2,552N/A New England Total18671.6%N/A97.3%39.8%95.7%34.4%2,016N/A Florida Total20856.2%N/A98.6%N/A98.2%N/A2,320N/A Colorado Total21269.5%N/A95.3%24.5%95.4%13.4%1,884N/A Stabilized Non-Comparable Monthly Rental Revenue per Unit (1) QTDQTD 1Q 20161Q 2015 Weighted Average Occupancy QTDQTD 1Q 20161Q 2015 Period End Occupancy QTDQTD 1Q 20161Q 2015 Operating Margin YTDYTD 1Q 20161Q 2015 Units QTD 1Q 2016
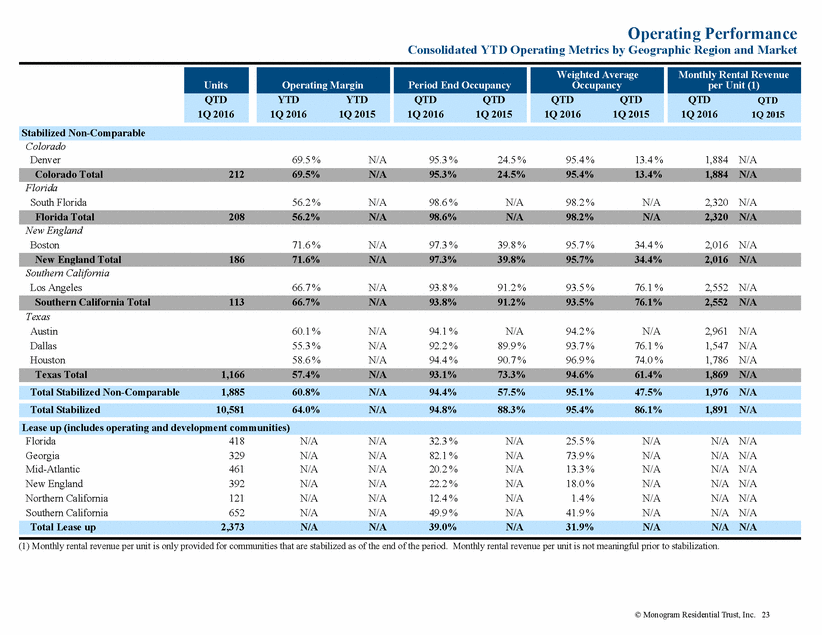
Operating Performance Proportionate YTD Net Operating Income by Geographic Region and Market (dollars in thousands) (unaudited) NOI by Market Colorado Denver $ 4,117 $ 3,951 4.2 % $ 1,068 $ 1,100 (2.9 )% $ 3,049 $ 2,851 6.9 % 13.0 % Florida North Florida South Florida 1,752 1,652 1,650 1,556 6.2 % 6.2 % 579 645 577 621 0.3 % 3.9 % 1,173 1,007 1,073 935 9.3 % 7.7 % 5.0 % 4.3 % Georgia Atlanta 1,349 1,334 1.1 % 658 545 20.7 % 691 789 (12.4 )% 2.9 % Mid-Atlantic Washington D.C. Philadelphia 4,963 848 4,745 826 4.6 % 2.7 % 1,627 393 1,792 399 (9.2 )% (1.5 )% 3,336 455 2,953 427 13.0 % 6.6 % 14.3 % 1.9 % Nevada Las Vegas 1,723 1,626 6.0 % 559 547 2.2 % 1,164 1,079 7.9 % 5.0 % New England Boston 3,515 3,335 5.4 % 1,261 1,495 (15.7 )% 2,254 1,840 22.5 % 9.6 % Northern California San Francisco 6,447 6,094 5.8 % 2,005 1,904 5.3 % 4,442 4,190 6.0 % 18.9 % Southern California Los Angeles 3,550 3,367 5.4 % 1,065 1,046 1.8 % 2,485 2,321 7.1 % 10.6 % Texas Dallas Houston 3,938 2,203 3,726 2,208 5.7 % (0.2)% 1,673 1,082 1,629 963 2.7 % 12.4 % 2,265 1,121 2,097 1,245 8.0 % (10.0 )% 9.7 % 4.8 % (Table continued on next page) © Monogram Residential Trust, Inc. 24 Total Same Store36,05734,4184.8 %12,61512,618— %23,44221,8007.5 %100.0% Texas Total6,1415,9343.5 %2,7552,5926.3 %3,3863,3421.3 %14.5% Southern California Total3,5503,3675.4 %1,0651,0461.8 %2,4852,3217.1 %10.6% Northern California Total6,4476,0945.8 %2,0051,9045.3 %4,4424,1906.0 %18.9% New England Total3,5153,3355.4 %1,2611,495(15.7)%2,2541,84022.5 %9.6% Nevada Total1,7231,6266.0 %5595472.2 %1,1641,0797.9 %5.0% Mid-Atlantic Total5,8115,5714.3 %2,0202,191(7.8)%3,7913,38012.2 %16.2% Georgia Total1,3491,3341.1 %65854520.7 %691789(12.4)%2.9% Florida Total3,4043,2066.2 %1,2241,1982.2 %2,1802,0088.6 %9.3% Colorado Total4,1173,9514.2 %1,0681,100(2.9)%3,0492,8516.9 %13.0% Same Store (1) % of Same Store YTD 1Q 2016 Net Operating Income YTDYTD% 1Q 20161Q 2015Change Property Operating Expenses YTDYTD% 1Q 20161Q 2015Change Rental Revenue YTDYTD% 1Q 20161Q 2015Change
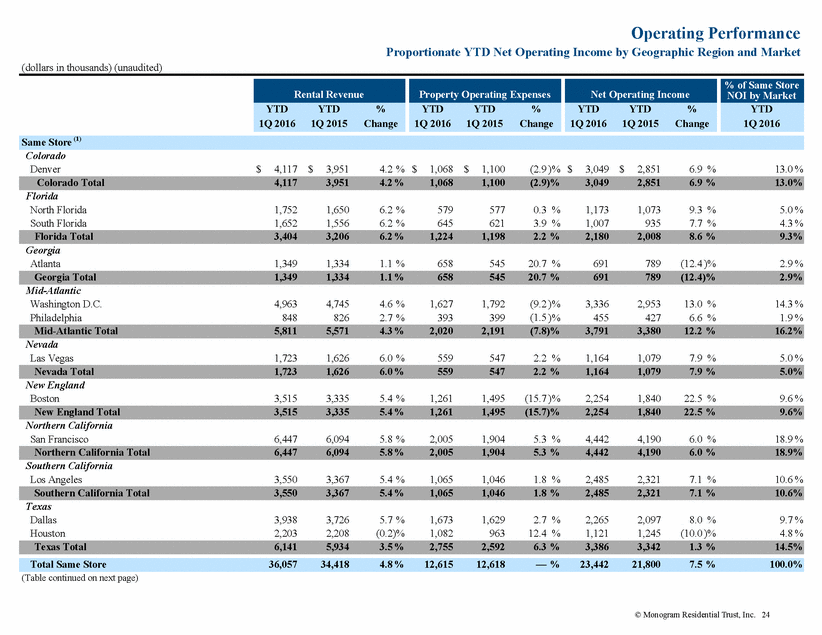
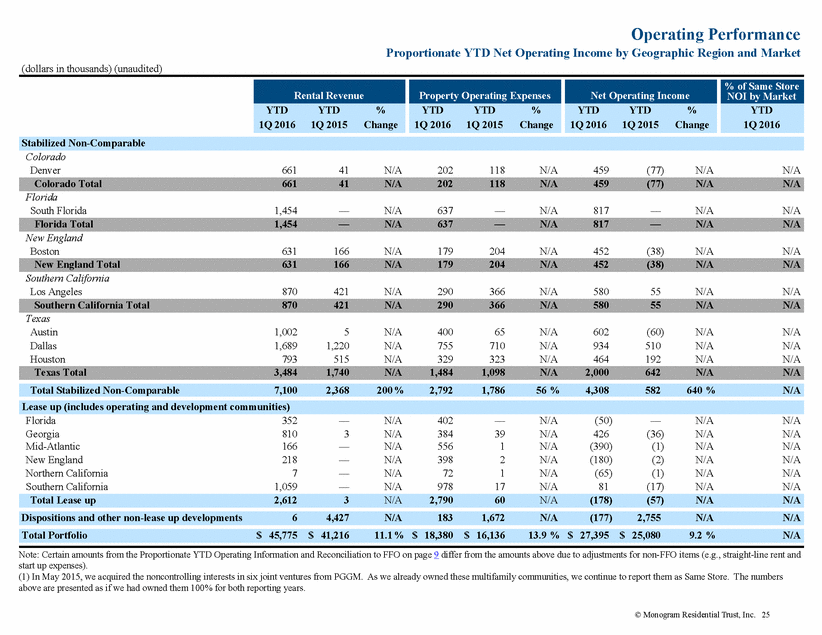
Operating Performance Proportionate YTD Net Operating Income by Geographic Region and Market (dollars in thousands) (unaudited) NOI by Market Colorado Denver 661 41 N/A 202 118 N/A 459 (77) N/A N/A Florida South Florida 1,454 — N/A 637 — N/A 817 — N/A N/A New England Boston 631 166 N/A 179 204 N/A 452 (38) N/A N/A Southern California Los Angeles 870 421 N/A 290 366 N/A 580 55 N/A N/A Texas Austin Dallas Houston 1,002 1,689 793 5 1,220 515 N/A N/A N/A 400 755 329 65 710 323 N/A N/A N/A 602 934 464 (60) 510 192 N/A N/A N/A N/A N/A N/A Florida Georgia Mid-Atlantic New England Northern California Southern California 352 810 166 218 7 1,059 — 3 — — — — N/A N/A N/A N/A N/A N/A 402 384 556 398 72 978 — 39 1 2 1 17 N/A N/A N/A N/A N/A N/A (50) 426 (390) (180) (65) 81 — (36) (1) (2) (1) (17) N/A N/A N/A N/A N/A N/A N/A N/A N/A N/A N/A N/A Note: Certain amounts from the Proportionate YTD Operating Information and Reconciliation to FFO on page 9 differ from the amounts above due to adjustments for non-FFO items (e.g., straight-line rent and start up expenses). (1) In May 2015, we acquired the noncontrolling interests in six joint ventures from PGGM. As we already owned these multifamily communities, we continue to report them as Same Store. The numbers above are presented as if we had owned them 100% for both reporting years. © Monogram Residential Trust, Inc. 25 Total Portfolio$ 45,775$ 41,21611.1 % $ 18,380$ 16,13613.9 % $ 27,395$ 25,0809.2 %N/A Dispositions and other non-lease up developments64,427N/A1831,672N/A(177)2,755N/AN/A Total Lease up2,6123N/A2,79060N/A(178)(57)N/AN/A Lease up (includes operating and development communities) Total Stabilized Non-Comparable7,1002,368200 %2,7921,78656 %4,308582640 %N/A Texas Total3,4841,740N/A1,4841,098N/A2,000642N/AN/A Southern California Total870421N/A290366N/A58055N/AN/A New England Total631166N/A179204N/A452(38)N/AN/A Florida Total1,454—N/A637—N/A817—N/AN/A Colorado Total66141N/A202118N/A459(77)N/AN/A Stabilized Non-Comparable % of Same Store YTD 1Q 2016 Net Operating Income YTDYTD% 1Q 20161Q 2015Change Property Operating Expenses YTDYTD% 1Q 20161Q 2015Change Rental Revenue YTDYTD% 1Q 20161Q 2015Change
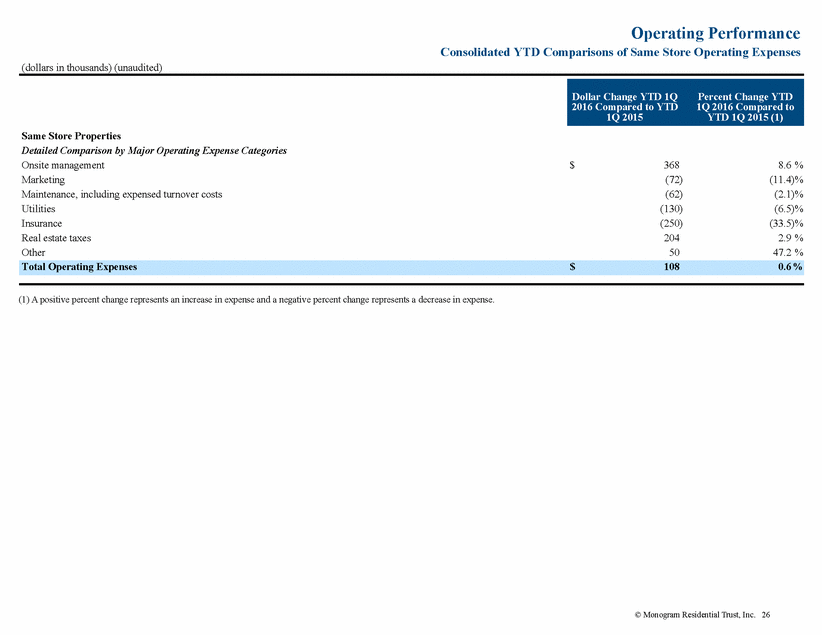
Operating Performance Consolidated YTD Comparisons of Same Store Operating Expenses (dollars in thousands) (unaudited) 2016 Compared to YTD 1Q 2016 Compared to Same Store Properties Detailed Comparison by Major Operating Expense Categories Onsite management Marketing Maintenance, including expensed turnover costs Utilities Insurance Real estate taxes Other $ 368 (72) (62) (130) (250) 204 50 8.6 % (11.4)% (2.1)% (6.5)% (33.5)% 2.9 % 47.2 % (1) A positive percent change represents an increase in expense and a negative percent change represents a decrease in expense. © Monogram Residential Trust, Inc. 26 Total Operating Expenses$1080.6 % Dollar Change YTD 1QPercent Change YTD 1Q 2015YTD 1Q 2015 (1)
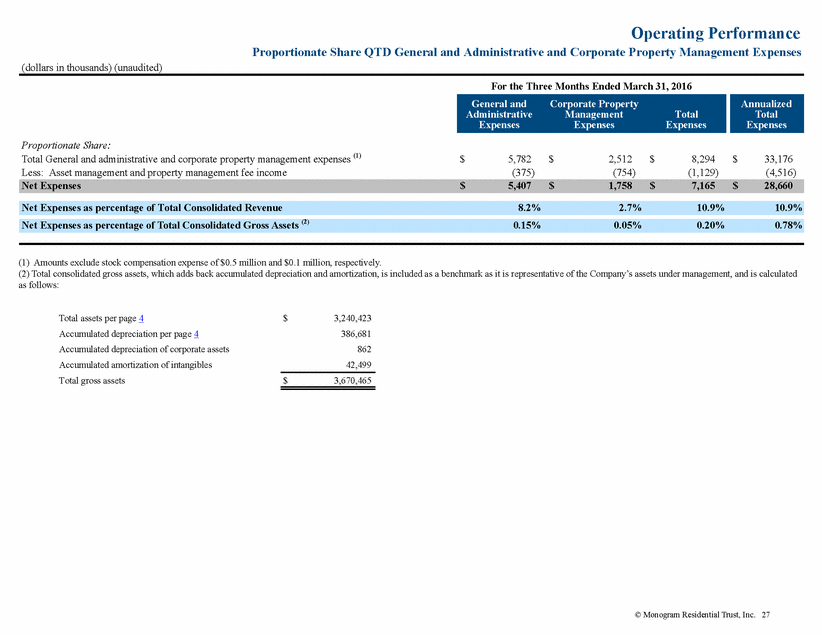
Operating Performance Proportionate Share QTD General and Administrative and Corporate Property Management Expenses (dollars in thousands) (unaudited) For the Three Months Ended March 31, 2016 Proportionate Share: Total General and administrative and corporate property management expenses (1) Less: Asset management and property management fee income $ 5,782 (375) $ 2,512 (754) $ 8,294 (1,129) $ 33,176 (4,516) (1) Amounts exclude stock compensation expense of $0.5 million and $0.1 million, respectively. (2) Total consolidated gross assets, which adds back accumulated depreciation and amortization, is included as a benchmark as it is representative of the Company’s assets under management, and is calculated as follows: Total assets per page 4 Accumulated depreciation per page 4 Accumulated depreciation of corporate assets Accumulated amortization of intangibles Total gross assets $ 3,240,423 386,681 862 42,499 $ 3,670,465 © Monogram Residential Trust, Inc. 27 Net Expenses as percentage of Total Consolidated Gross Assets (2)0.15%0.05%0.20%0.78% Net Expenses as percentage of Total Consolidated Revenue8.2%2.7%10.9%10.9% Net Expenses$5,407$1,758$7,165$28,660 Annualized Total Expenses General andCorporate Property AdministrativeManagementTotal ExpensesExpensesExpenses
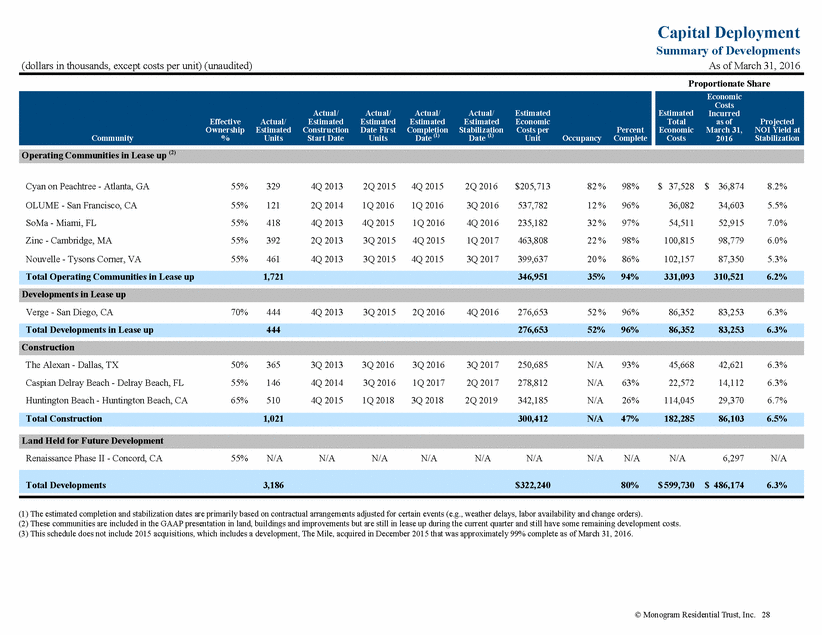
Capital Deployment Summary of Developments As of March 31, 2016 (dollars in thousands, except costs per unit) (unaudited) Proportionate Share Estimated Economic Incurred March 31, NOI Yield at Cyan on Peachtree - Atlanta, GA OLUME - San Francisco, CA SoMa - Miami, FL Zinc - Cambridge, MA Nouvelle - Tysons Corner, VA 55% 55% 55% 55% 55% 329 121 418 392 461 4Q 2013 2Q 2014 4Q 2013 2Q 2013 4Q 2013 2Q 2015 1Q 2016 4Q 2015 3Q 2015 3Q 2015 4Q 2015 1Q 2016 1Q 2016 4Q 2015 4Q 2015 2Q 2016 3Q 2016 4Q 2016 1Q 2017 3Q 2017 $205,713 537,782 235,182 463,808 399,637 82 % 12 % 32 % 22 % 20 % 98% 96% 97% 98% 86% $ 37,528 36,082 54,511 100,815 102,157 $ 36,874 34,603 52,915 98,779 87,350 8.2% 5.5% 7.0% 6.0% 5.3% Verge - San Diego, CA 70% 444 4Q 2013 3Q 2015 2Q 2016 4Q 2016 276,653 52 % 96% 86,352 83,253 6.3% The Alexan - Dallas, TX Caspian Delray Beach - Delray Beach, FL Huntington Beach - Huntington Beach, CA 50% 55% 65% 365 146 510 3Q 2013 4Q 2014 4Q 2015 3Q 2016 3Q 2016 1Q 2018 3Q 2016 1Q 2017 3Q 2018 3Q 2017 2Q 2017 2Q 2019 250,685 278,812 342,185 N/A N/A N/A 93% 63% 26% 45,668 22,572 114,045 42,621 14,112 29,370 6.3% 6.3% 6.7% Renaissance Phase II - Concord, CA 55% N/A N/A N/A N/A N/A N/A N/A N/A N/A 6,297 N/A (1) The estimated completion and stabilization dates are primarily based on contractual arrangements adjusted for certain events (e.g., weather delays, labor availability and change orders). (2) These communities are included in the GAAP presentation in land, buildings and improvements but are still in lease up during the current quarter and still have some remaining development costs. (3) This schedule does not include 2015 acquisitions, which includes a development, The Mile, acquired in December 2015 that was approximately 99% complete as of March 31, 2016. © Monogram Residential Trust, Inc. 28 Total Developments3,186$322,24080%$ 599,730$ 486,1746.3% Land Held for Future Development Total Construction1,021300,412N/A47%182,28586,1036.5% Construction Total Developments in Lease up444276,65352%96%86,35283,2536.3% Developments in Lease up Total Operating Communities in Lease up1,721346,95135%94%331,093310,5216.2% Operating Communities in Lease up (2) Economic Costs Totalas ofProjected Costs2016Stabilization Actual/Actual/Actual/Actual/Estimated EffectiveActual/EstimatedEstimatedEstimatedEstimatedEconomic OwnershipEstimatedConstructionDate FirstCompletionStabilizationCosts perPercent Community%UnitsStart DateUnitsDate (1) Date (1) UnitOccupancyComplete
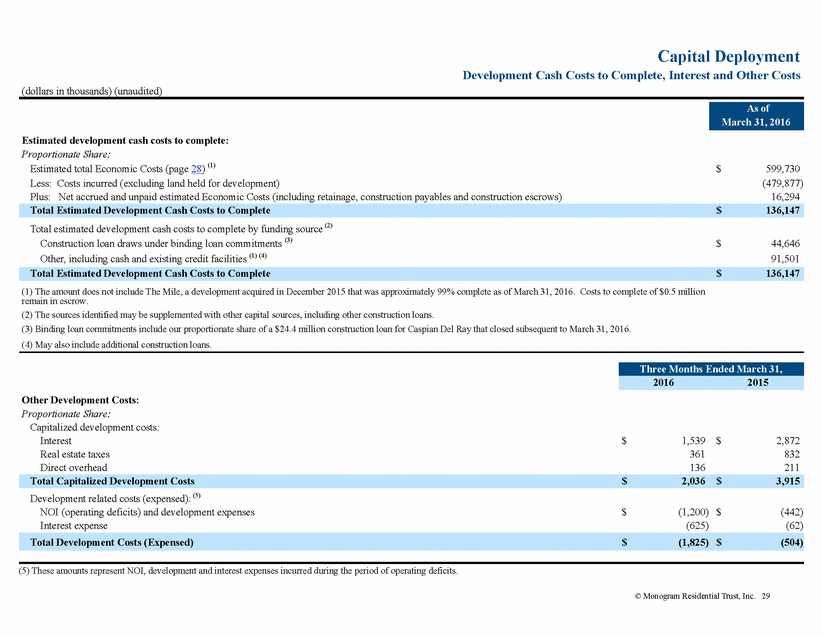
Capital Deployment Development Cash Costs to Complete, Interest and Other Costs (dollars in thousands) (unaudited) Estimated development cash costs to complete: Proportionate Share: Estimated total Economic Costs (page 28) (1) Less: Costs incurred (excluding land held for development) Plus: Net accrued and unpaid estimated Economic Costs (including retainage, construction payables and construction escrows) $ 599,730 (479,877) 16,294 Total estimated development cash costs to complete by funding source (2) Construction loan draws under binding loan commitments (3) Other, including cash and existing credit facilities (1) (4) $ 44,646 91,501 (1) The amount does not include The Mile, a development acquired in December 2015 that was approximately 99% complete as of March 31, 2016. Costs to complete of $0.5 million remain in escrow. (2) The sources identified may be supplemented with other capital sources, including other construction loans. (3) Binding loan commitments include our proportionate share of a $24.4 million construction loan for Caspian Del Ray that closed subsequent to March 31, 2016. (4) May also include additional construction loans. Other Development Costs: Proportionate Share: Capitalized development costs: Interest Real estate taxes Direct overhead $ 1,539 361 136 $ 2,872 832 211 Development related costs (expensed): (5) NOI (operating deficits) and development expenses Interest expense $ (1,200) (625) $ (442) (62) (5) These amounts represent NOI, development and interest expenses incurred during the period of operating deficits. © Monogram Residential Trust, Inc. 29 Total Development Costs (Expensed)$(1,825) $(504) Total Capitalized Development Costs$2,036$3,915 Three Months Ended March 31, 20162015 Total Estimated Development Cash Costs to Complete$136,147 Total Estimated Development Cash Costs to Complete$136,147 As of March 31, 2016
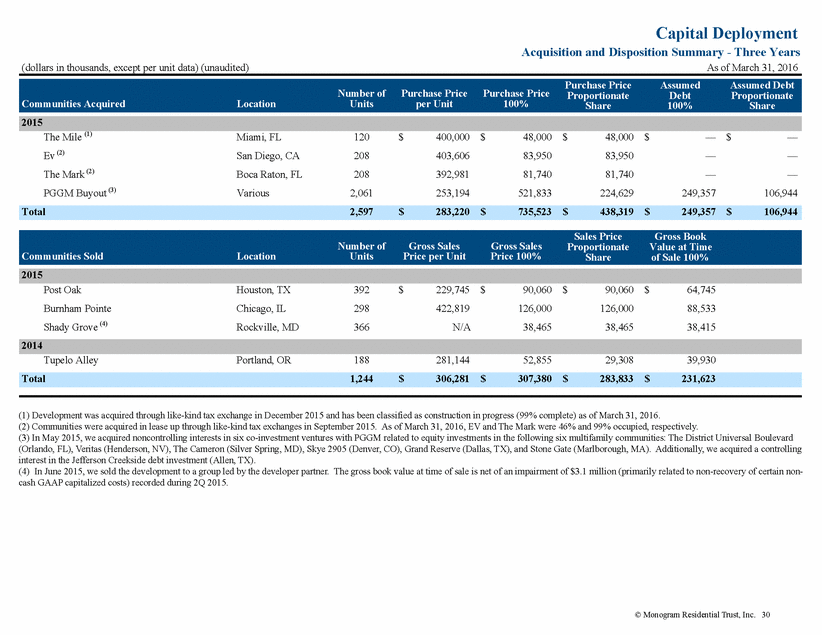
Capital Deployment Acquisition and Disposition Summary - Three Years As of March 31, 2016 (dollars in thousands, except per unit data) (unaudited) Number of Purchase Price Purchase Price Proportionate Debt Proportionate The Mile (1) Miami, FL San Diego, CA Boca Raton, FL Various 120 208 208 2,061 $ 400,000 403,606 392,981 253,194 $ 48,000 83,950 81,740 521,833 $ 48,000 83,950 81,740 224,629 $ — — — 249,357 $ — — — 106,944 Ev (2) The Mark (2) PGGM Buyout (3) Number of Gross Sales Gross Sales Proportionate Value at Time Post Oak Burnham Pointe Shady Grove (4) Houston, TX Chicago, IL Rockville, MD 392 298 366 $ 229,745 422,819 N/A $ 90,060 126,000 38,465 $ 90,060 126,000 38,465 $ 64,745 88,533 38,415 Tupelo Alley Portland, OR 188 281,144 52,855 29,308 39,930 (1) Development was acquired through like-kind tax exchange in December 2015 and has been classified as construction in progress (99% complete) as of March 31, 2016. (2) Communities were acquired in lease up through like-kind tax exchanges in September 2015. As of March 31, 2016, EV and The Mark were 46% and 99% occupied, respectively. (3) In May 2015, we acquired noncontrolling interests in six co-investment ventures with PGGM related to equity investments in the following six multifamily communities: The District Universal Boulevard (Orlando, FL), Veritas (Henderson, NV), The Cameron (Silver Spring, MD), Skye 2905 (Denver, CO), Grand Reserve (Dallas, TX), and Stone Gate (Marlborough, MA). Additionally, we acquired a controlling interest in the Jefferson Creekside debt investment (Allen, TX). (4) In June 2015, we sold the development to a group led by the developer partner. The gross book value at time of sale is net of an impairment of $3.1 million (primarily related to non-recovery of certain non-cash GAAP capitalized costs) recorded during 2Q 2015. © Monogram Residential Trust, Inc. 30 Total1,244$306,281$307,380$283,833$231,623 2014 2015 Sales PriceGross Book Communities SoldLocationUnitsPrice per UnitPrice 100%Shareof Sale 100% Total2,597$283,220$735,523$438,319$249,357$106,944 2015 Purchase PriceAssumedAssumed Debt Communities AcquiredLocationUnitsper Unit100%Share100%Share
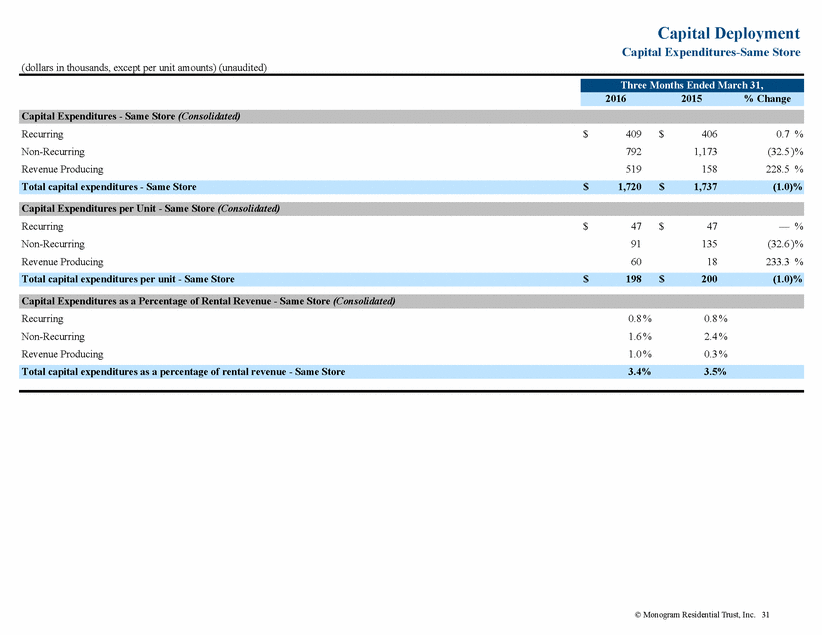
Capital Deployment Capital Expenditures-Same Store (dollars in thousands, except per unit amounts) (unaudited) Recurring Non-Recurring Revenue Producing $ 409 792 519 $ 406 1,173 158 0.7 % (32.5 )% 228.5 % Recurring Non-Recurring Revenue Producing $ 47 91 60 $ 47 135 18 — % (32.6 )% 233.3 % Recurring Non-Recurring Revenue Producing 0.8 % 1.6 % 1.0 % 0.8 % 2.4 % 0.3 % © Monogram Residential Trust, Inc. 31 Total capital expenditures as a percentage of rental revenue - Same Store3.4%3.5% Capital Expenditures as a Percentage of Rental Revenue - Same Store (Consolidated) Total capital expenditures per unit - Same Store$198$200(1.0)% Capital Expenditures per Unit - Same Store (Consolidated) Total capital expenditures - Same Store$1,720$1,737(1.0)% Capital Expenditures - Same Store (Consolidated) Three Months Ended March 31, 20162015% Change
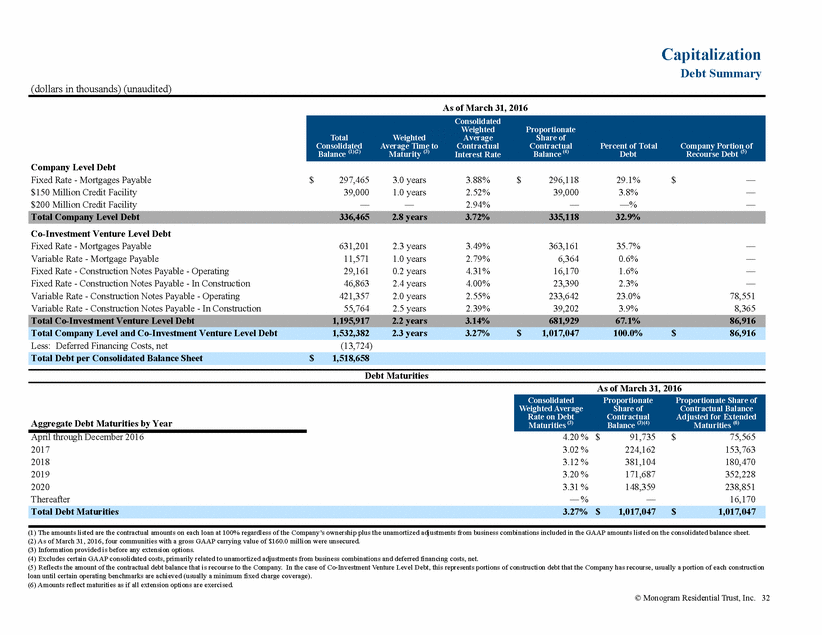
Capitalization Debt Summary (dollars in thousands) (unaudited) As of March 31, 2016 Weighted Contractual Proportionate Contractual Consolidated Average Time to Percent of Total Company Portion of Company Level Debt Fixed Rate - Mortgages Payable $150 Million Credit Facility $200 Million Credit Facility $ 297,465 39,000 — 3.0 years 1.0 years — 3.88% 2.52% 2.94% $ 296,118 39,000 — 29.1% 3.8% —% $ — — — Co-Investment Venture Level Debt Fixed Rate - Mortgages Payable Variable Rate - Mortgage Payable Fixed Rate - Construction Notes Payable - Operating Fixed Rate - Construction Notes Payable - In Construction Variable Rate - Construction Notes Payable - Operating Variable Rate - Construction Notes Payable - In Construction 631,201 11,571 29,161 46,863 421,357 55,764 2.3 years 1.0 years 0.2 years 2.4 years 2.0 years 2.5 years 3.49% 2.79% 4.31% 4.00% 2.55% 2.39% 363,161 6,364 16,170 23,390 233,642 39,202 35.7% 0.6% 1.6% 2.3% 23.0% 3.9% — — — — 78,551 8,365 Less: Deferred Financing Costs, net (13,724) Debt Maturities As of March 31, 2016 Aggregate Debt Maturities by Year April through December 2016 4.20 % 3.02 % 3.12 % 3.20 % 3.31 % — % $ 91,735 224,162 381,104 171,687 148,359 — $ 75,565 153,763 180,470 352,228 238,851 16,170 2017 2018 2019 2020 Thereafter (1) The amounts listed are the contractual amounts on each loan at 100% regardless of the Company’s ownership plus the unamortized adjustments from business combinations included in the GAAP amounts listed on the consolidated balance sheet. (2) As of March 31, 2016, four communities with a gross GAAP carrying value of $160.0 million were unsecured. (3) Information provided is before any extension options. (4) Excludes certain GAAP consolidated costs, primarily related to unamortized adjustments from business combinations and deferred financing costs, net. (5) Reflects the amount of the contractual debt balance that is recourse to the Company. In the case of Co-Investment Venture Level Debt, this represents portions of construction debt that the Company has recourse, usually a portion of each construction loan until certain operating benchmarks are achieved (usually a minimum fixed charge coverage). (6) Amounts reflect maturities as if all extension options are exercised. © Monogram Residential Trust, Inc. 32 Total Debt Maturities3.27% $1,017,047$1,017,047 ConsolidatedProportionateProportionate Share of Weighted AverageShare ofContractual Balance Rate on DebtContractualAdjusted for Extended Maturities (3) Balance (3)(4) Maturities (6) Total Debt per Consolidated Balance Sheet$1,518,658 Total Co-Investment Venture Level Debt1,195,9172.2 years3.14%681,92967.1%86,916 Total Company Level and Co-Investment Venture Level Debt1,532,3822.3 years3.27%$1,017,047100.0%$86,916 Total Company Level Debt336,4652.8 years3.72%335,11832.9% Consolidated TotalWeightedAverageShare of Balance (1)(2) Maturity (3) Interest RateBalance (4) DebtRecourse Debt (5)
Capitalization Debt Summary (dollars in thousands) (unaudited) Consolidated Leverage Ratios Fixed Charge coverage ratio Debt to EBITDA (1) Net Debt to EBITDA (1) Adjusted Financial Ratios - Excluding Development Activity Fixed Charge coverage ratio Debt to EBITDA (1)(2) Net Debt to EBITDA (1)(2) 2.42x 12.44x 11.89x 2.79x 10.58x 9.99x 3.04x 8.09x 7.56x 3.14x 7.87x 7.27x (1) EBITDA is annualized for last quarter for the respective reporting periods. (2) Adjusted EBITDA, excluding development activity. Three Months Ended March 31, Fixed Charges: Contractual interest expense Non-redeemable noncontrolling interests expense (subsidiary preferred units dividends) Fixed Charges Less: Development related fixed charges (3) Fixed Charges, excluding development activity Debt: Mortgages, notes payable and credit facilities Less: Mortgage premium - GAAP Contractual debt Less: Cash and cash equivalents Net debt Less: Development related debt Net debt, excluding development activity 2016 2015 $ 12,604 87 $ 10,596 85 12,691 (2,251) 10,681 (1,307) $ 10,440 $ 9,374 March 31, 2016 March 31, 2015 $ 1,532,382 (2,076) $ 1,267,200 (3,768) 1,530,306 (67,847) 1,263,432 (70,379) 1,462,459 (502,069) 1,193,053 (335,418) $ 960,390 $ 857,635 Three Months Ended March 31, 2016 2015 EBITDA (page 10) Plus: NOI and development costs expensed, consolidated for non-stabilized developments Adjusted EBITDA, excluding development activity Annualized EBITDA Annualized EBITDA, excluding development activity (3) Represents interest expense related to developments during periods of operating deficits. $ 30,760 1,004 $ 29,846 (367) $ 31,764 $ 29,479 $ 123,040 $ 119,384 $ 127,056 $ 117,916 © Monogram Residential Trust, Inc. 33 Three Months Ended March 31, 20162015
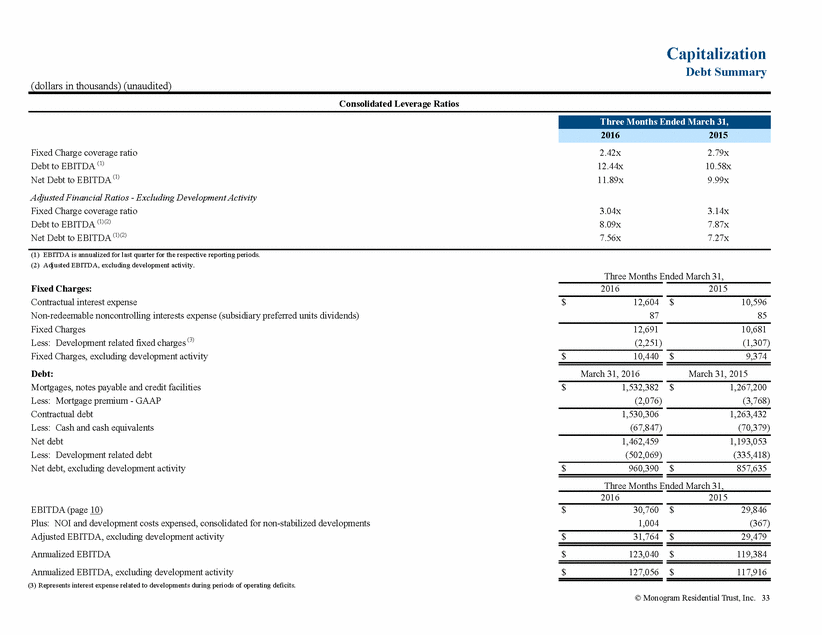
Capitalization Debt Detail by Multifamily Community (dollars in thousands) (unaudited) As of March 31, 2016 Contractual Company Portion of Total Contractual of Contractual Company Level Debt Fixed Rate - Mortgages Payable Acappella The Cameron The District Universal Boulevard Grand Reserve Skye 2905 Stone Gate Vara $ 29,934 63,237 36,431 20,259 55,413 33,844 57,000 August-2018 July-2019 June-2018 May-2019 June-2018 July-2018 December-2020 3.86% 3.09% 4.54% 3.41% 4.19% 4.24% 4.00% $ 29,934 63,237 36,431 20,259 55,413 33,844 57,000 39,000 — April-2017 January-2019 Monthly LIBOR + 2.08% Monthly LIBOR + 2.50% 39,000 — $150 Million Credit Facility $200 Million Credit Facility Co-Investment Venture Level Debt Fixed Rate - Mortgages Payable 55 Hundred Acacia on Santa Rosa Creek Argenta Bailey's Crossing Belmar Briar Forest Lofts Burrough’s Mill Calypso Cherry Creek Eclipse Fitzhugh Urban Flats Forty 55 Lofts The Gallery at NoHo Commons The Lofts at Park Crest - multifamily San Sebastian Satori The Venue Veritas West Village 40,852 29,000 51,000 76,000 28,500 20,118 24,334 29,500 39,500 19,969 26,759 25,500 51,300 31,493 21,000 51,000 10,468 34,560 19,619 January-2017 March-2020 August-2016 July-2017 August-2020 September-2017 October-2016 August-2020 August-2020 September-2017 August-2017 October-2020 November-2016 January-2019 June-2020 January-2019 January-2019 November-2019 October-2019 3.75% 3.17% 3.19% 2.82% 2.82% 4.46% 5.29% 2.82% 2.82% 4.46% 4.35% 3.90% 4.72% 3.42% 3.31% 3.54% 3.66% 2.77% 2.48% 22,652 15,950 28,050 42,142 15,675 11,065 13,383 16,225 21,725 10,983 14,718 14,025 28,215 17,321 11,645 28,280 5,757 34,560 10,790 Variable Rate - Mortgages Payable The Lofts at Park Crest - retail 11,571 April-2017 Monthly LIBOR + 2.35% 6,364 (Table continued on next page) © Monogram Residential Trust, Inc. 34 Total Variable Rate - Mortgages Payable11,5712.79%6,364 Total Fixed Rate - Mortgages Payable630,4723.49%363,161 Total Company Level Debt335,1183.72%335,118 Total Credit Facilities39,0002.52%39,000 Total Fixed Rate - Mortgages Payable296,1183.88%296,118 Proportionate Share Balance (1)Maturity DateInterest Rate (2) Balance (1) Recourse Debt
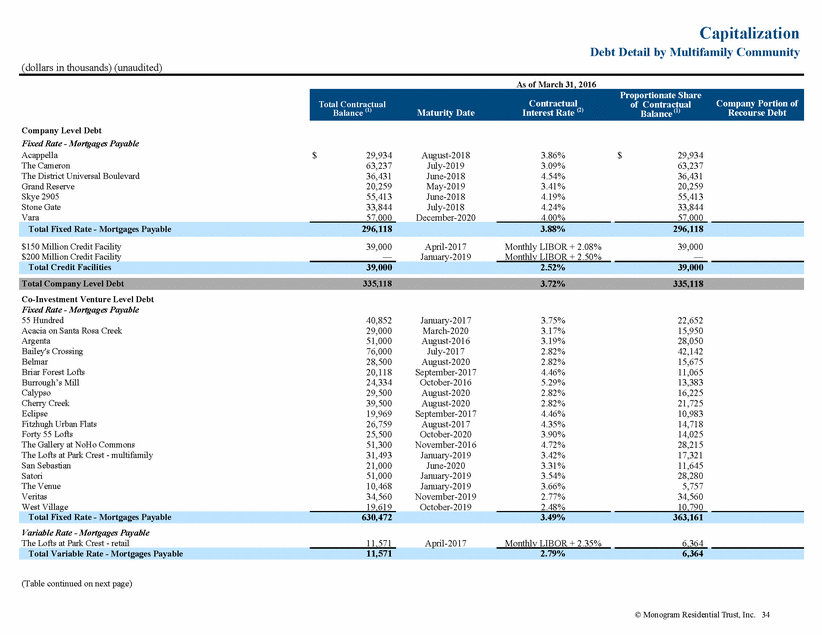
Capitalization Debt Detail by Multifamily Community (dollars in thousands) (unaudited) As of March 31, 2016 Contractual Company Portion of Total Contractual of Contractual Fixed Rate - Construction Notes Payable (3) Arpeggio Victory Park Total - Operating The Alexan Total - Under Construction 29,161 June-2016 4.31% 16,170 29,161 46,863 16,170 23,390 August-2018 4.00% 46,863 23,390 Variable Rate - Construction Notes Payable (3) 4110 Fairmount Allusion West University (4) Cyan on Peachtree Everly Muse Museum District Nouvelle Point 21 SEVEN SoMa Zinc Total - Operating Verge Total - Under Construction 24,825 20,623 39,114 22,982 26,700 69,401 26,552 32,483 55,202 103,475 April-2017 April-2017 February-2018 June-2018 February-2018 August-2018 December-2017 August-2018 October-2017 October-2018 Monthly LIBOR + 2.25% Monthly LIBOR + 2.25% Monthly LIBOR + 1.90% Monthly LIBOR + 2.00% Monthly LIBOR + 1.95% Monthly LIBOR + 2.10% Monthly LIBOR + 2.00% Monthly LIBOR + 2.15% Monthly LIBOR + 2.10% 13,765 11,436 21,689 12,743 14,805 38,483 14,723 18,012 30,609 6,206 — 5,867 3,447 4,005 17,350 2,655 4,872 8,280 Monthly LIBOR + 2.25% 57,377 25,869 421,357 55,764 2.55% 233,642 78,551 October-2018 Monthly LIBOR + 1.95% 39,202 8,365 55,764 2.39% 39,202 8,365 Plus: unamortized adjustments from business combinations (5) Less: deferred financing costs, net (6) 2,076 (13,724) 1,749 (10,667) (1) The amounts listed by multifamily community are the contractual amounts on each loan at 100% regardless of the Company’s ownership. Total net deferred financing costs and unamortized GAAP adjustments from business combinations are provided in total to reconcile to total debt per the consolidated/proportionate balance sheets. (2) Total and sub-totals represent the weighted-average interest rates as of March 31, 2016. Monthly LIBOR as of March 31, 2016 is 0.44%. (3) The maturity dates provided for these loans do not include any extension options. These loans include one to two year extension options with the exception of Arpeggio Victory Park which includes an option to convert the loan into a permanent loan and extend the maturity to 2023. (4) In April 2016 the extension option was exercised and the maturity date was extended to April 5, 2017. (5) Unamortized adjustments from business combinations are added to debt to agree to the GAAP amounts on the consolidated/proportionate balance sheets. (6) Deferred financing costs, net are deducted from debt to agree to the GAAP amounts on the consolidated/proportionate balance sheets. © Monogram Residential Trust, Inc. 35 Total Debt per Consolidated/Proportionate Balance Sheet$1,518,658$1,008,129 Total Company Level and Co-Investment Venture Level Debt1,530,3063.27%1,017,047$86,916 Total Co-Investment Venture Level Debt1,195,1883.14%681,92986,916 Total Variable Rate - Construction Notes Payable477,1212.53%272,84486,916 Total Fixed Rate - Construction Notes Payable76,0244.12%39,560 Proportionate Share Balance (1)Maturity DateInterest Rate (2) Balance (1) Recourse Debt
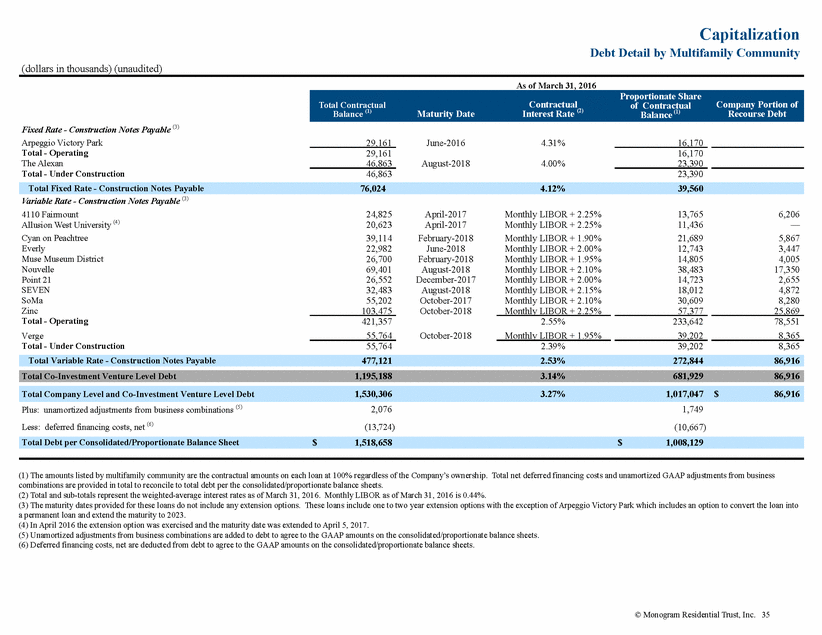
Capitalization Sources of Funds Available As of March 31, 2016 (dollars in thousands) (unaudited) Capacity (1) Commitment Outstanding Commitments Commitments $150 Million Credit Facility - 100% our share $ 150,000 $ 108,214 $ 39,000 $ 69,214 $ — $200 Million Credit Facility - 100% our share $ 200,000 $ 200,000 $ — $ 200,000 $ — Construction notes payable - Proportionate Share (2) (3) $ 355,098 $ 355,098 $ 312,404 $ 42,694 $ — PGGM commitments (4) $ 300,000 $ 300,000 $ 275,801 $ 12,323 $ 11,876 Developer partner commitment $ 3,800 $ 3,800 $ 3,237 $ 563 $ — (1) Available capacity represents the amount of the maximum commitment that is available to be drawn based on current loan requirements (e.g. collateral, borrowing base). The amount currently drawn is reflected in the balance outstanding column. (2) We may not draw all amounts available to draw, and we may use other sources to fund our developments. (3) The amounts reported for construction notes payable exclude our proportionate share of the $24.4 million Caspian Del Ray construction loan closed subsequent to March 31, 2016. (4) PGGM’s remaining commitment would apply to future investments. © Monogram Residential Trust, Inc. 36 MaximumAvailableBalanceUnfundedRemaining
Equity Capitalization Preferred Stock, Common Stock and Common Stock Equivalents (unaudited) Outstanding as of Preferred Securities: Series A Preferred Stock (1) 10,000 7% $0.0001 $10.00 Common Stock and Common Stock Equivalents: Common stock (2) Dilutive securities: Series A Preferred Stock Restricted stock units Total common stock and common stock equivalents (3) 166,754,852 — 853,419 167,608,271 (1) As more fully explained in the notes to the financial statements (stockholders’ equity - capitalization) the Series A Preferred Stock can be converted into common stock on or before December 31, 2016. The conversion is based on a formula which includes the price issued for shares outstanding as of July 31, 2013, dividends paid and a simple 7% return on the shares outstanding. As of March 31, 2016, we estimate the minimum common stock price for a conversion of the Series A Preferred Stock to be $11.42 per share. As of March 31, 2016, the closing market price for the Company’s closing stock was $9.86 per common share. (2) The distribution for the first quarter of 2016 was $0.075 per share. (3) 0.7% of total common stock and common stock equivalents are held by employees and directors. © Monogram Residential Trust, Inc. 37 Shares/Units March 31, 2016CouponPar Value per ShareLiquidation Preference per Share
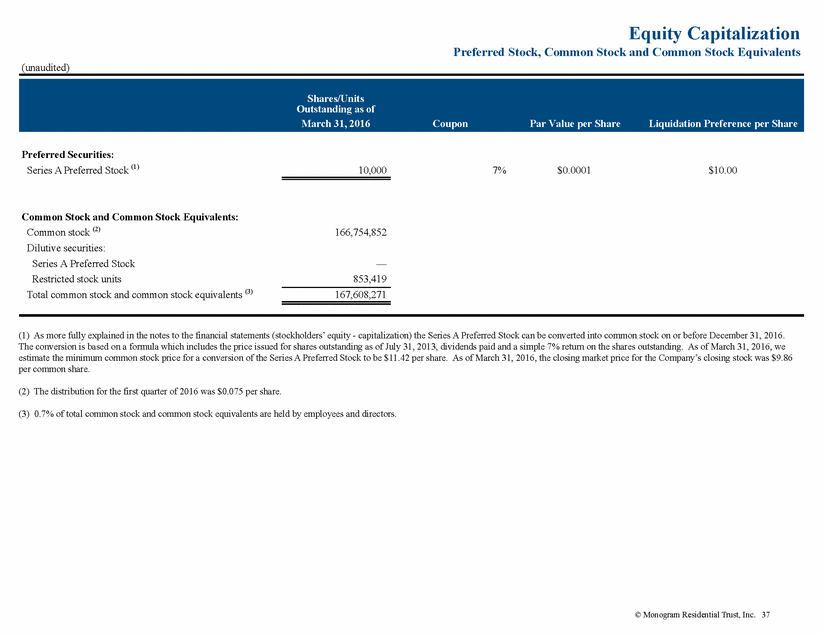
Net Asset Value Road Map to Net Asset Value (dollars in thousands) (unaudited) Property revenue - stabilized portfolio (1) $ 43,157 (15,407) (1,295) $ — — — $ 43,157 (15,407) (1,295) Less: Property operating expenses, excluding property management expenses (1) Less: Assumed market rate property management fee @ 3% of revenue Adjusted property Net Operating Income Annualized adjusted property Net Operating Income Third party asset management revenue (2) Third party property management revenue (2) $ 26,455 $ — $ 26,455 $ $ $ 105,820 375 754 $ $ $ — — — $ $ $ 105,820 375 754 Acquisitions in development and lease up(3) Development (excludes land held for future development presented below) - total Economic Costs incurred (4) Acquisitions in lease up and development - total potential value creation (5) $ $ $ 132,079 479,877 173,340 $ $ $ — — — $ $ $ 132,079 479,877 173,340 Cash and cash equivalents Land Held for Future Development (6) Master partnership promote due to the Company (7) Notes receivable (8) Other tangible assets (9) Total Other Assets $ 53,439 6,297 8,778 33,186 19,040 $ — — — — — $ 53,439 6,297 8,778 33,186 19,040 $ 120,740 $ — $ 120,740 Mortgages and notes payable (10) (11) $ 978,047 39,000 1,336 36,016 51,797 $ 5,913 — 100 — — $ 983,960 39,000 1,436 36,016 51,797 Credit facilities payable (10) Convertible and subsidiary preferred stock (12) Developer promotes and put options, net (13) Other tangible liabilities (14) Total Liabilities $ 1,106,196 $ 6,013 $ 1,112,209 Common stock outstanding Convertible preferred stock (15) Restricted stock units outstanding Fully diluted shares outstanding (See Notes to Road Map to Net Asset Value on next page) 166,754,852 — 853,419 167,608,271 © Monogram Residential Trust, Inc. 38 Other Data Balance Sheet Data - Liabilities (Proportionate Share) Balance Sheet Data - Other Assets (Proportionate Share) As of March 31, 2016AdjustmentsAs Adjusted Acquisitions in Lease Up and Development Data (Proportionate Share) Three Months Ended March 31, 2016AdjustmentsAs Adjusted Income Statement Data (Proportionate Share)
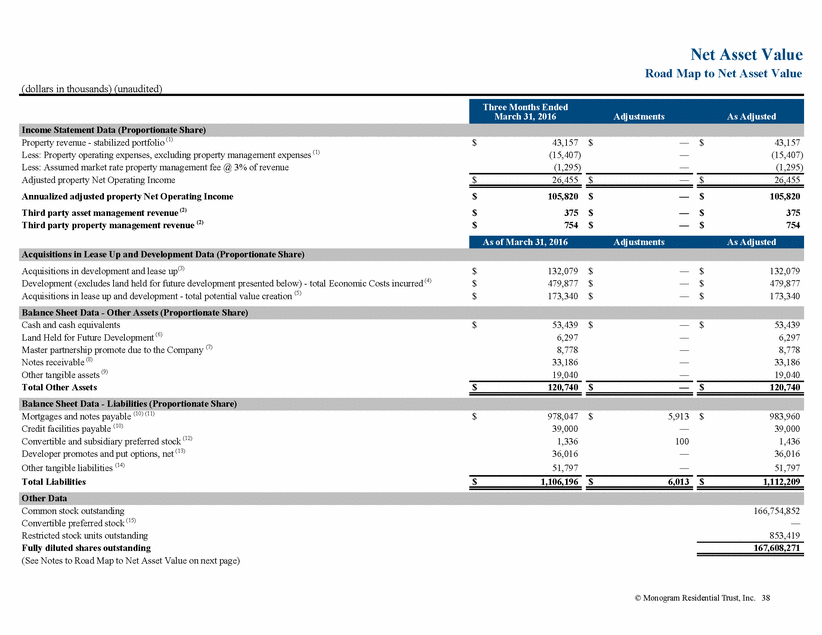
Net Asset Value Road Map to Net Asset Value (dollars in thousands) (unaudited) Notes to Road Map to Net Asset Value on page 38: (1) Property revenue and property operating expenses-stabilized portfolio includes: Rental Revenue Property Operating Expenses Same Store per page 24 Stabilized Non-Comparable per page 25 $ 36,057 7,100 $ 12,615 2,792 $ 43,157 $ 15,407 (2) Represents property and asset management revenue associated with third party joint venture assets per page 9. (3) Includes 2015 acquisitions : The Mile (under development) and EV (in lease up). Amounts represent cost as of March 31, 2016. See page 30. Total potential value creation is included below. See note 5. (4) Development-total Economic Costs incurred: Economic Costs Incurred as of March 31, 2016 Total Developments per page 28 Less: Land Held for Future Development per page 28 $ 486,174 (6,297) $ 479,877 (5) Value creation is equal to projected future stabilized value less total Economic Costs. The projected future stabilized value is based on the projected annual NOI at stabilization, less capital reserves divided by an estimated future capitalization rate, which includes a premium from the current capitalization rate to adjust for the period until stabilization. Total potential value creation represents the undiscounted total future value to be created at the stabilization date, before any selling expenses. (6) Land Held for Future Development per page 28. (7) Projected promote due to the Company by PGGM based on current estimated portfolio value. (8) Notes receivable is our proportionate share of the contractual principal balance as presented on page 17. (9) Other tangible assets include: Escrows and restricted cash Resident, tenant and other receivables Prepaid assets and deposits Total $ 5,951 8,101 4,988 $ 19,040 (Notes continued on next page) © Monogram Residential Trust, Inc. 39
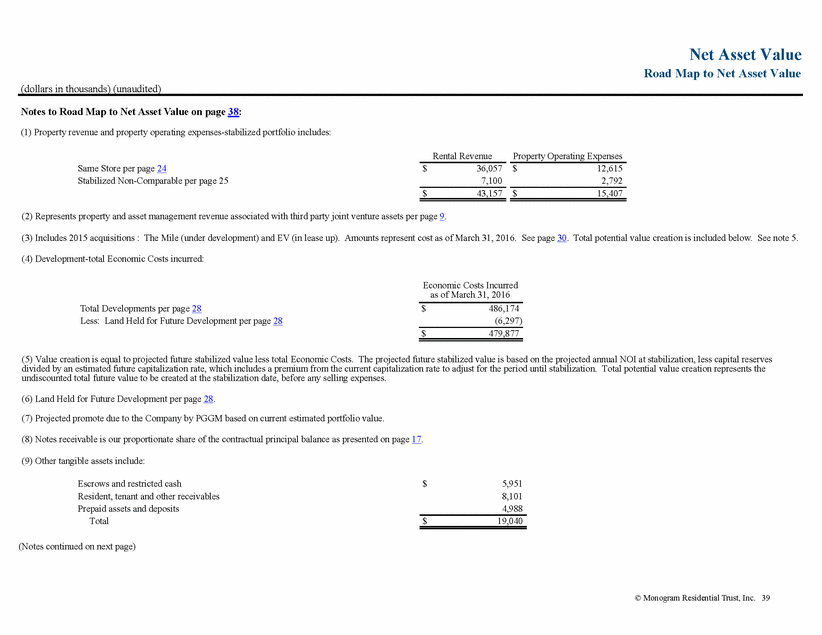
Net Asset Value Road Map to Net Asset Value (dollars in thousands) (unaudited) Notes to Road Map to Net Asset Value on page 38 (continued from previous page): (10) Represents our proportionate share of contractual balance outstanding as of March 31, 2016. See page 32. (11) Includes mark-to-market adjustment to mortgages and notes payable. (12) Convertible and subsidiary preferred stock includes the liquidation value of convertible preferred stock calculated as 10,000 shares at a contractual liquidation value of $10.00 per share (see note 15), and subsidiary preferred stock of $1.3 million as of March 31, 2016. (13) Developer’s put options and amounts attributable to developer promotes. The amount included for developer promotes is calculated based on estimated valuations as of March 31, 2016. The developer promotes are not currently payable, where actual amounts, if any, are subject to future property sales prices, net of selling expenses, our capital account and our preferred return at the time of the property sale. (14) Other tangible liabilities include: Construction costs payable Accounts payable and other liabilities Distributions payable Tenants security deposits Total $ 17,621 17,388 12,563 4,225 $ 51,797 (15) Potential dilution associated with the conversion of the outstanding Series A Preferred Stock utilizing the treasury stock method and common stock market price as of March 31, 2016. As more fully discussed in note 1, page 37, the Series A Preferred Stock does not have a convertible value based on the March 31, 2016 closing stock market price. © Monogram Residential Trust, Inc. 40
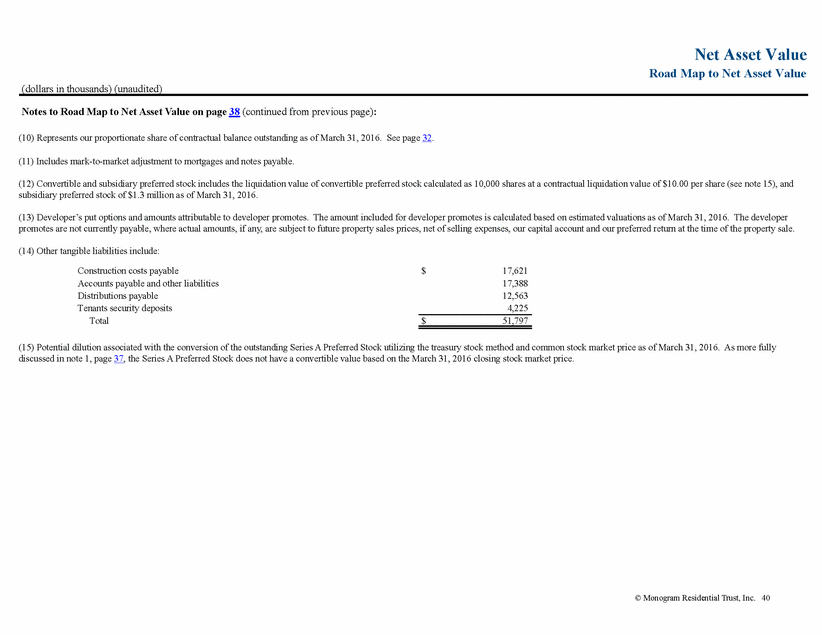
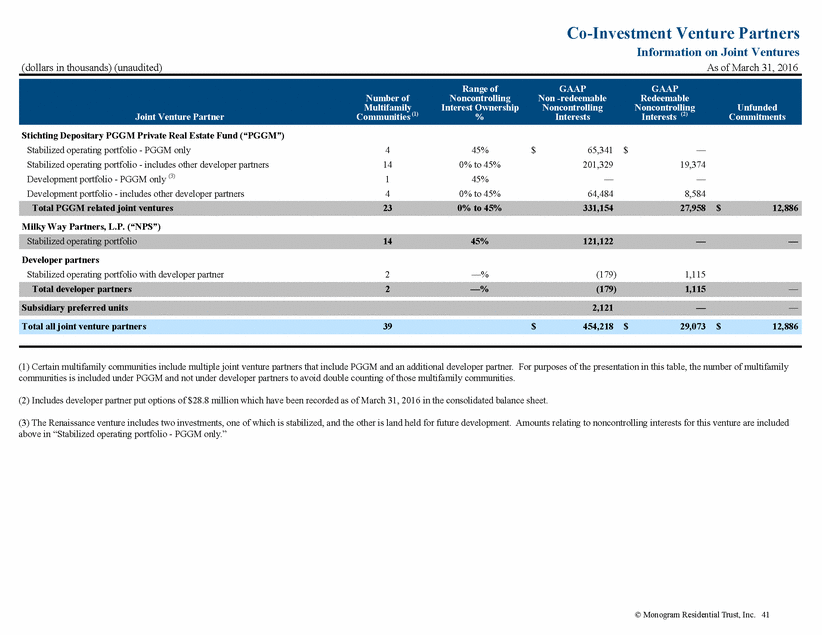
Co-Investment Venture Partners Information on Joint Ventures As of March 31, 2016 (dollars in thousands) (unaudited) Communities (1) Interests (2) Joint Venture Partner % Interests Commitments Stichting Depositary PGGM Private Real Estate Fund (“PGGM”) Stabilized operating portfolio - PGGM only Stabilized operating portfolio - includes other developer partners Development portfolio - PGGM only (3) Development portfolio - includes other developer partners 4 14 1 4 45% 0% to 45% 45% 0% to 45% $ 65,341 201,329 — 64,484 $ — 19,374 — 8,584 Milky Way Partners, L.P. (“NPS”) Developer partners Stabilized operating portfolio with developer partner 2 —% (179) 1,115 (1) Certain multifamily communities include multiple joint venture partners that include PGGM and an additional developer partner. For purposes of the presentation in this table, the number of multifamily communities is included under PGGM and not under developer partners to avoid double counting of those multifamily communities. (2) Includes developer partner put options of $28.8 million which have been recorded as of March 31, 2016 in the consolidated balance sheet. (3) The Renaissance venture includes two investments, one of which is stabilized, and the other is land held for future development. Amounts relating to noncontrolling interests for this venture are included above in “Stabilized operating portfolio - PGGM only.” © Monogram Residential Trust, Inc. 41 Total all joint venture partners39$454,218$29,073$12,886 Subsidiary preferred units2,121—— Total developer partners2—%(179)1,115— Stabilized operating portfolio1445%121,122—— Total PGGM related joint ventures230% to 45%331,15427,958$12,886 Range ofGAAPGAAP Number ofNoncontrollingNon -redeemableRedeemable MultifamilyInterest OwnershipNoncontrollingNoncontrollingUnfunded
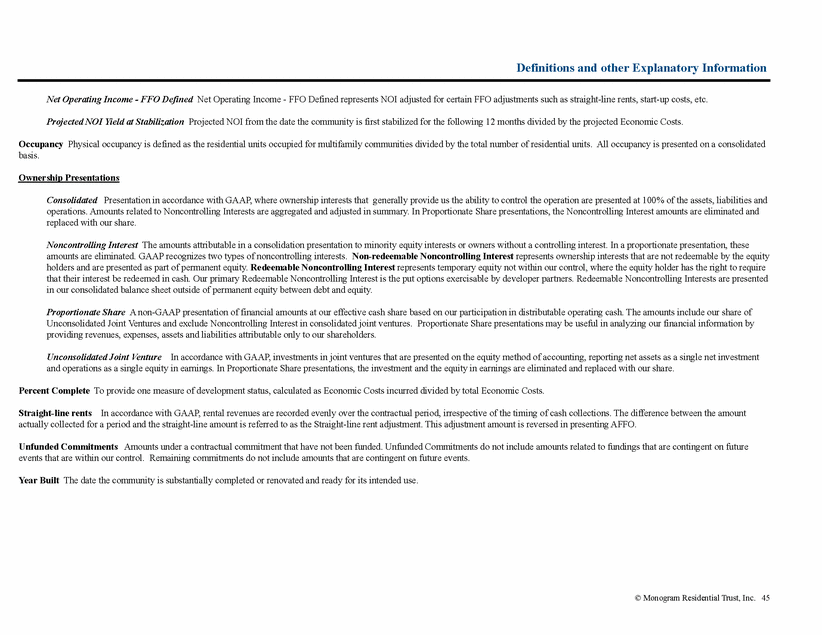
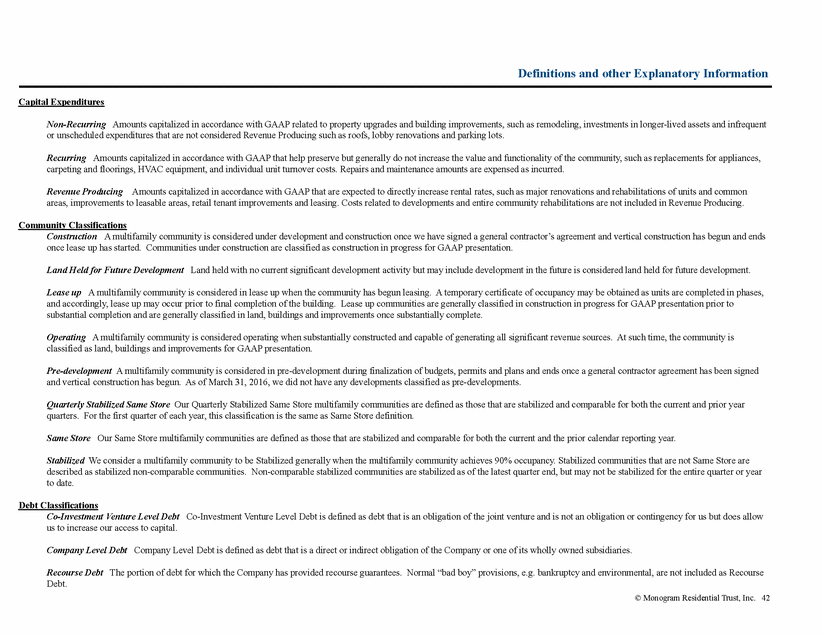
Definitions and other Explanatory Information Capital Expenditures Non-Recurring Amounts capitalized in accordance with GAAP related to property upgrades and building improvements, such as remodeling, investments in longer-lived assets and infrequent or unscheduled expenditures that are not considered Revenue Producing such as roofs, lobby renovations and parking lots. Recurring Amounts capitalized in accordance with GAAP that help preserve but generally do not increase the value and functionality of the community, such as replacements for appliances, carpeting and floorings, HVAC equipment, and individual unit turnover costs. Repairs and maintenance amounts are expensed as incurred. Revenue Producing Amounts capitalized in accordance with GAAP that are expected to directly increase rental rates, such as major renovations and rehabilitations of units and common areas, improvements to leasable areas, retail tenant improvements and leasing. Costs related to developments and entire community rehabilitations are not included in Revenue Producing. Community Classifications Construction A multifamily community is considered under development and construction once we have signed a general contractor’s agreement and vertical construction has begun and ends once lease up has started. Communities under construction are classified as construction in progress for GAAP presentation. Land Held for Future Development Land held with no current significant development activity but may include development in the future is considered land held for future development. Lease up A multifamily community is considered in lease up when the community has begun leasing. A temporary certificate of occupancy may be obtained as units are completed in phases, and accordingly, lease up may occur prior to final completion of the building. Lease up communities are generally classified in construction in progress for GAAP presentation prior to substantial completion and are generally classified in land, buildings and improvements once substantially complete. Operating A multifamily community is considered operating when substantially constructed and capable of generating all significant revenue sources. At such time, the community is classified as land, buildings and improvements for GAAP presentation. Pre-development A multifamily community is considered in pre-development during finalization of budgets, permits and plans and ends once a general contractor agreement has been signed and vertical construction has begun. As of March 31, 2016, we did not have any developments classified as pre-developments. Quarterly Stabilized Same Store Our Quarterly Stabilized Same Store multifamily communities are defined as those that are stabilized and comparable for both the current and prior year quarters. For the first quarter of each year, this classification is the same as Same Store definition. Same Store Our Same Store multifamily communities are defined as those that are stabilized and comparable for both the current and the prior calendar reporting year. Stabilized We consider a multifamily community to be Stabilized generally when the multifamily community achieves 90% occupancy. Stabilized communities that are not Same Store are described as stabilized non-comparable communities. Non-comparable stabilized communities are stabilized as of the latest quarter end, but may not be stabilized for the entire quarter or year to date. Debt Classifications Co-Investment Venture Level Debt Co-Investment Venture Level Debt is defined as debt that is an obligation of the joint venture and is not an obligation or contingency for us but does allow us to increase our access to capital. Company Level Debt Company Level Debt is defined as debt that is a direct or indirect obligation of the Company or one of its wholly owned subsidiaries. Recourse Debt The portion of debt for which the Company has provided recourse guarantees. Normal “bad boy” provisions, e.g. bankruptcy and environmental, are not included as Recourse Debt. © Monogram Residential Trust, Inc. 42
Definitions and other Explanatory Information EBITDA Earnings before interest, taxes, depreciation, amortization, and other non-recurring items. Deduction for interest expense only includes stated interest expense. Fees and other charges are included as an expense in EBITDA. Amortization expense adjustments include amortization of deferred finance fees and all purchase accounting intangibles. Economic Costs Represents costs for all on-site development and construction costs recognized for GAAP, but including certain items expensed for GAAP (primarily specific financing and operating expenses incurred during lease up) and excluding certain GAAP costs related to consolidated allocated costs, former sponsor-related fees and other non-cash capitalized cost items. Effective Ownership Effective ownership represents our participation in the distributable operating cash and may change over time as certain milestones related to budgets, plans and completion are achieved. This effective ownership is indicative of, but may differ from, percentages for distributions, contributions or financing requirements. Fee Income Our revenue collected from joint ventures related to property management, asset management and dispositions. Financial Ratios Debt (or Net Debt) to EBITDA Total contractual debt divided by annualized EBITDA based on respective reporting period. Contractual debt excludes certain GAAP adjustments, primarily purchased discounts and premiums. Net debt presentations deduct cash and cash equivalents from the total debt amounts. Excluding Development Activity As developments prior to stabilization are not yet producing expected operating results but may have outstanding debt and related interest and other finance charges (directly or indirectly), we also present certain ratios without the related NOI deficit, associated development debt, interest and other finance charges. Fixed Charge Income/loss from continuing operations, before gain on sale of real estate, adjusted for depreciation, amortization, federal and state income taxes, early extinguishment of debt, acquisition expenses, fair value adjustments, non cash and non-recurring expenses. May be calculated on a consolidated basis or based on our proportionate share. Monthly Rental Revenue Per UnitMonthly rental revenue per unit is calculated based on the leases in effect as of the indicated date, including in-place base rents for the occupied units and the current market rate for vacant units, including the effects of any rental concessions and affordable housing payments and subsidies, plus other charges for storage, parking, pets, trash or other recurring resident charges. Operating Margin NOI divided by total revenue. Joint Venture Partners Stichting Depositary PGGM Private Real Estate Fund (“PGGM”) PGGM is a $209 billion Dutch foundation acting in its capacity as title holder of and for the account of PGGM Private Real Estate Funds and its affiliates, a real estate investment vehicle for Dutch pension funds. Ten year (through 2023) - $300 million commitment including operating and development properties. We and, under certain circumstances, PGGM have buy/sell rights, which if exercised by us, may require us to acquire PGGM’s respective ownership interest or if exercised by PGGM, may require us to sell our respective ownership interest. Milky Way Partners, L.P. (“NPS”) NPS, the primary partner of which is Korea Exchange Bank, as Trustee for and on behalf of National Pension Service (acting for and on behalf of the National Pension Fund of the Republic of Korea Government, a $447 billion fund). We and, under certain circumstances, NPS have buy/sell rights, which if exercised by us, may require us to acquire NPS’s respective ownership interest or if exercised by NPS, may require us to sell our respective ownership interest. Developer partners Developer partners include national or regional real estate developer/owners. Generally, the developer partners have initial capital requirements until certain milestones are achieved, at which point their initial capital contributions are returned to them. The developer partners have a back-end interest generally only attributable to distributions related to a property sale or financings. The developer partners also have put options, one year after completion of the development where we (and in most cases PGGM) would be required to acquire their back-end interest at a set price as well as options to trigger a mark-to-market process after the seventh year after completion and a buy/sell after the tenth year. The amount of the individual put options range from $0.8 million to $6.4 million. © Monogram Residential Trust, Inc. 43
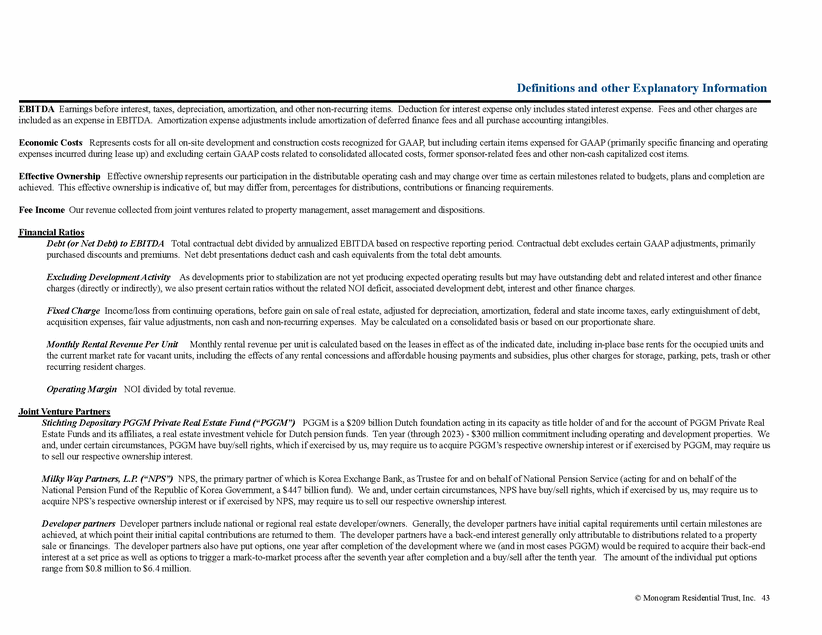
Definitions and other Explanatory Information Subsidiary preferred units Subsidiary preferred units issued in order for PGGM and NPS investments to qualify as a REIT. Units are callable at our option, paying an annual distribution of 12.5% on the face amount of $500 per unit. Non-GAAP Measurements We use the following non-GAAP measurements to present different components of our performance. We believe this information is also useful to our investors in comparing our results to other real estate companies and trusts because they provide characteristics of our performance that reflect the reality that real estate generally appreciates over time, which is not reflected in most depreciation methods, and focus on operating results widely used by real estate investors. These non-GAAP measurements should not be considered as alternatives to net income (loss) presented in accordance with GAAP but as a supplemental performance measurement. Because these measurements may exclude certain cash flows or expenses, we caution that these measurements may not be representative of our current or future liquidity as presented in accordance with GAAP. There can be no assurance that our methods for computing these non-GAAP measurements is comparable with that of other real estate companies and trusts in all respects. A reconciliation for each non-GAAP measurement to the most applicable GAAP measurement is provided on pages 8 and 19. Funds from Operations (“FFO”) FFO is a non-GAAP performance financial measure that is widely recognized as a measure of REIT operating performance. We use FFO as currently defined by the National Association of Real Estate Investment Trusts (“NAREIT”) to be net income (loss), computed in accordance with GAAP, excluding gains (or losses) from sales of property (including deemed sales (if any) and settlements of pre-existing relationships), plus depreciation and amortization on real estate assets, impairment write-downs of depreciable real estate or of investments in unconsolidated real estate partnerships, joint ventures and subsidiaries (if any) that are driven by measurable decreases in the fair value of depreciable real estate assets, and after related adjustments for unconsolidated partnerships, joint ventures and subsidiaries and noncontrolling interests. May be calculated on a consolidated basis or based on our Proportionate Share. Core FFO Core FFO is calculated starting from FFO adjusted for loss on early extinguishment of debt, acquisition expenses, contingent purchase price adjustments, gain or loss on derivative fair value adjustments and non-recurring expenses, such as transition expenses. May be calculated on a consolidated basis or based on our Proportionate Share. Adjusted Core FFO (“AFFO”) AFFO is calculated starting from Core FFO adjusted for Recurring capital expenditures, Straight-line rents and stock compensation expense. May be calculated on a consolidated basis or based on our Proportionate Share. Net Operating Income (“NOI”) NOI is calculated as total rental revenue less direct property operating expenses including real estate taxes. NOI does not include property management revenues, interest income, property management expenses, depreciation, interest and other finance expense, corporate general and administrative expenses, overhead allocations and other non-onsite operations. We provide NOI on a consolidated and proportional basis. The reconciliation of net loss to NOI is provided on page 19. The reconciliation of net loss attributable to common stockholders to proportionate share of NOI is provided below for all periods presented (amounts in thousands): 1Q 2016 1Q 2015 Net loss attributable to common stockholders Adjustments to reconcile Net loss attributable to common stockholders to Proportionate Share of Net Operating Income: Add: real estate depreciation and amortization (page 8) Less: total fee income (page 9-YTD) Less: total other adjustments ( page 9-YTD) Less: net of straight-line rents, start up expenses, etc. (1) Proportionate Share of Net Operating Income (page 25-YTD) $ (8,307) $ (833) 20,664 (1,129) 16,369 (202) 15,929 (1,153) 8,561 2,576 $ 27,395 $ 25,080 (1) Also includes the effect of presenting the NOI related the entities acquired in the PGGM acquisitions of noncontrolling interests at 100% ownership for all reporting periods presented. © Monogram Residential Trust, Inc. 44
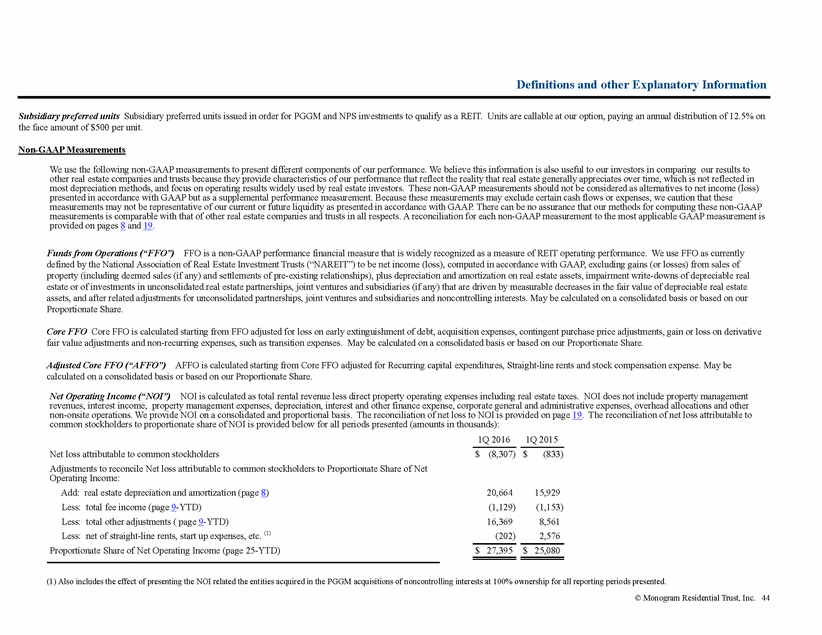
Definitions and other Explanatory Information Net Operating Income - FFO Defined Net Operating Income - FFO Defined represents NOI adjusted for certain FFO adjustments such as straight-line rents, start-up costs, etc. Projected NOI Yield at Stabilization Projected NOI from the date the community is first stabilized for the following 12 months divided by the projected Economic Costs. Occupancy Physical occupancy is defined as the residential units occupied for multifamily communities divided by the total number of residential units. All occupancy is presented on a consolidated basis. Ownership Presentations Consolidated Presentation in accordance with GAAP, where ownership interests that generally provide us the ability to control the operation are presented at 100% of the assets, liabilities and operations. Amounts related to Noncontrolling Interests are aggregated and adjusted in summary. In Proportionate Share presentations, the Noncontrolling Interest amounts are eliminated and replaced with our share. Noncontrolling Interest The amounts attributable in a consolidation presentation to minority equity interests or owners without a controlling interest. In a proportionate presentation, these amounts are eliminated. GAAP recognizes two types of noncontrolling interests. Non-redeemable Noncontrolling Interest represents ownership interests that are not redeemable by the equity holders and are presented as part of permanent equity. Redeemable Noncontrolling Interest represents temporary equity not within our control, where the equity holder has the right to require that their interest be redeemed in cash. Our primary Redeemable Noncontrolling Interest is the put options exercisable by developer partners. Redeemable Noncontrolling Interests are presented in our consolidated balance sheet outside of permanent equity between debt and equity. Proportionate Share A non-GAAP presentation of financial amounts at our effective cash share based on our participation in distributable operating cash. The amounts include our share of Unconsolidated Joint Ventures and exclude Noncontrolling Interest in consolidated joint ventures. Proportionate Share presentations may be useful in analyzing our financial information by providing revenues, expenses, assets and liabilities attributable only to our shareholders. Unconsolidated Joint Venture In accordance with GAAP, investments in joint ventures that are presented on the equity method of accounting, reporting net assets as a single net investment and operations as a single equity in earnings. In Proportionate Share presentations, the investment and the equity in earnings are eliminated and replaced with our share. Percent Complete To provide one measure of development status, calculated as Economic Costs incurred divided by total Economic Costs. Straight-line rents In accordance with GAAP, rental revenues are recorded evenly over the contractual period, irrespective of the timing of cash collections. The difference between the amount actually collected for a period and the straight-line amount is referred to as the Straight-line rent adjustment. This adjustment amount is reversed in presenting AFFO. Unfunded Commitments Amounts under a contractual commitment that have not been funded. Unfunded Commitments do not include amounts related to fundings that are contingent on future events that are within our control. Remaining commitments do not include amounts that are contingent on future events. Year Built The date the community is substantially completed or renovated and ready for its intended use. © Monogram Residential Trust, Inc. 45
