Attached files
| file | filename |
|---|---|
| 8-K - 8-K - Globalstar, Inc. | a2016q1earningsrelease8-k.htm |
| EX-99.1 - EXHIBIT 99.1 - Globalstar, Inc. | gsat2016331-ex991.htm |

Earnings Call Presentation First Quarter 2016 May 5, 2016

Safe Harbor Language 1 This presentation contains certain statements that are “forward-looking statements” within the meaning of the Private Securities Litigation Reform Act of 1995. These forward-looking statements are based on current expectations and assumptions that are subject to risks and uncertainties which may cause actual results to differ materially from the forward-looking statements. Forward-looking statements, such as the statements regarding our expectations with respect to actions by the FCC, future increases in our revenue and profitability and other statements contained in this presentation regarding matters that are not historical facts, involve predictions. Any forward-looking statements made in this presentation are accurate as of the date made and are not guarantees of future performance. Actual results or developments may differ materially from the expectations expressed or implied in the forward-looking statements, and we undertake no obligation to update any such statements. Additional information on factors that could influence our financial results is included in our filings with the Securities and Exchange Commission, including our Annual Report on Form 10-K, Quarterly Reports on Form 10-Q and Current Reports on Form 8-K.

67% 33% 75% 25% 55% 45% 67% 33% Continued Focus On International Expansion 2 Two-Way Duplex One-Way SPOT and Simplex Gross Subscriber Additions Composition LTM Q1 2015 LTM Q1 2016 LTM Q1 2015 LTM Q1 2016 North America Non-North America For the twelve month period ended March 31, 2016, Non-North American Duplex subscriber additions increased 56% vs. prior twelve months For the twelve month period ended March 31, 2016, Non-North American SPOT and Simplex subscriber additions increased 9% vs. prior twelve months

Second-Generation Ground Rollout – On Track Initial Deliveries North American RAN Installations Rest of the World RAN Installations Complete Complete 2016 Second-Generation Rollout Schedule Summary Completed all RAN installations in U.S., Canada and Europe RAN installations at gateways in Brazil scheduled for Q3 2016 To enhance our second-generation coverage in the Caribbean, we have deployed a RAN at our gateway in Puerto Rico – over-the-air and acceptance testing scheduled to be complete next month Ground System Update Final configuration acceptance testing has now been completed at Canadian gateway Final production acceptance testing completed – geo-redundancy testing to be complete this month Final milestone for the core network – diversity testing. Allows for seamless gateway handoff Core Network Update 3 Increased data speeds Gateway diversity Smaller, feature rich products Enhanced capacity

SMARTONE C STX-3 Recent Product Rollouts 4 Globalstar has rolled out a series of commercial simplex products to serve the M2M and OEM channels. ● Asset-ready solution – robust device provides connectivity for assets virtually anywhere including areas beyond terrestrial networks ● Generates opportunities for Globalstar subscribers to leverage the power of the Internet of Things (IoT) STINGR Combines the STX-3 chip with an integrated antenna and GPS unit, allowing for modular capability as others develop connected add-ons for specific market applications Connects and integrates antenna and GPS systems on each device – improves the ease of development for our partners and reduces product certification time and expense Satellite transmitted chip for OEMs – 1/3rd the size of previous generation product – Integrates satellite connectivity into products used for vehicle and asset tracking, remote data reporting Affordable pricing, low power consumption and small form factor Module can be integrated for use in a wide range of applications including liquid petroleum gas tanks, water tanks, pipelines, electricity, meters, cars, trucks, boats and sea or land containers

Next-Generation Sat-Fi & SPOT Devices Wi-Fi 5 Next-Generation Sat-Fi Next-Generation Sat-Fi: Satellite communications device which turns any smartphone, laptop or tablet into a satellite phone / global data device Next-Generation SPOT: Two-way texting device with SPOT Tracking and SOS functionality SPOT Personal Tracker SPOT 2 SPOT Gen3 One-way Two-way Next-Generation SPOT

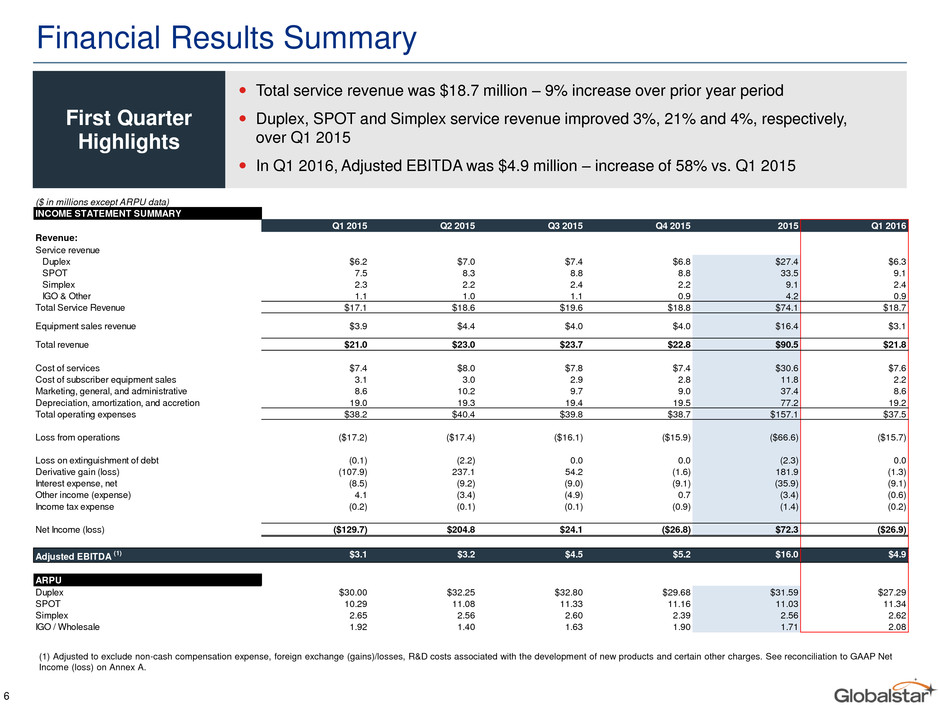
Financial Results Summary (1) Adjusted to exclude non-cash compensation expense, foreign exchange (gains)/losses, R&D costs associated with the development of new products and certain other charges. See reconciliation to GAAP Net Income (loss) on Annex A. 6 First Quarter Highlights Total service revenue was $18.7 million – 9% increase over prior year period Duplex, SPOT and Simplex service revenue improved 3%, 21% and 4%, respectively, over Q1 2015 In Q1 2016, Adjusted EBITDA was $4.9 million – increase of 58% vs. Q1 2015 ($ in millions except ARPU data) INCOME STATEMENT SUMMARY Q1 2015 Q2 2015 Q3 2015 Q4 2015 2015 Q1 2016 Revenue: Service revenue Duplex $6.2 $7.0 $7.4 $6.8 $27.4 $6.3 SPOT 7.5 8.3 8.8 8.8 33.5 9.1 Simplex 2.3 2.2 2.4 2.2 9.1 2.4 IGO & Other 1.1 1.0 1.1 0.9 4.2 0.9 Total Service Revenue $17.1 $18.6 $19.6 $18.8 $74.1 $18.7 Equipment sales revenue $3.9 $4.4 $4.0 $4.0 $16.4 $3.1 Total revenue $21.0 $23.0 $23.7 $22.8 $90.5 $21.8 Cost of services $7.4 $8.0 $7.8 $7.4 $30.6 $7.6 Cost of subscriber equipment sales 3.1 3.0 2.9 2.8 11.8 2.2 Marketing, general, and administrative 8.6 10.2 9.7 9.0 37.4 8.6 Depreciation, amortization, and accretion 19.0 19.3 19.4 19.5 77.2 19.2 Total operating expenses $38.2 $40.4 $39.8 $38.7 $157.1 $37.5 Loss from operations ($17.2) ($17.4) ($16.1) ($15.9) ($66.6) ($15.7) Loss on extinguishment of debt (0.1) (2.2) 0.0 0.0 (2.3) 0.0 Derivative gain (loss) (107.9) 237.1 54.2 (1.6) 181.9 (1.3) Interest expense, net (8.5) (9.2) (9.0) (9.1) (35.9) (9.1) Other income (expense) 4.1 (3.4) (4.9) 0.7 (3.4) (0.6) Income tax expense (0.2) (0.1) (0.1) (0.9) (1.4) (0.2) Net Income (loss) ($129.7) $204.8 $24.1 ($26.8) $72.3 ($26.9) Adj sted EBITDA (1) $3.1 $3.2 $4.5 $5.2 $16.0 $4.9 ARPU Duplex $30.00 $32.25 $32.80 $29.68 $31.59 $27.29 SPOT 10.29 11.08 11.33 11.16 11.03 11.34 Simplex 2.65 2.56 2.60 2.39 2.56 2.62 IGO / Wholesale 1.92 1.40 1.63 1.90 1.71 2.08

44.5 41.7 288.2 298.4 246.6 269.1 69.7 77.7 - 100.0 200.0 300.0 400.0 500.0 600.0 700.0 800.0 Q1 2015 Q1 2016 $1.1 $0.9 $2.3 $2.4 $7.5 $9.1 $6.2 $6.3 $0.0 $2.0 $4.0 $6.0 $8.0 $10.0 $12.0 $14.0 $16.0 $18.0 $20.0 Q1 2015 Q1 2016 Service Revenue Highlights 7 Duplex SPOT Simplex IGO / Other ($ in millions) (in thousands) $17.1 $18.7 649.8 686.9 Service Revenue Profile Subscriber Profile 9% 6% EOP subscribers for Duplex, SPOT and Simplex grew 12%, 9% and 4%, respectively, over Q1 2015 Despite FX headwinds, total service revenue improved 9% over prior year period Key Highlights

1.2 2.6 15.7 13.5 14.7 14.2 3.9 3.5 - 5.0 10.0 15.0 20.0 25.0 30.0 35.0 40.0 Q1 2015 Q1 2016 $0.2 $0.3 $1.2 $0.9 $1.1 $1.0 $1.5 $0.8 $0.0 $0.5 $1.0 $1.5 $2.0 $2.5 $3.0 $3.5 $4.0 $4.5 Q1 2015 Q1 2016 Equipment Revenue Highlights 8 Duplex SPOT Simplex IGO / Other Equipment revenue decreased year-over-year due primarily to lower selling prices of Duplex devices ahead of the launch of second-generation products Reduction in the number of simplex units sold was due primarily to the economic downturn in the Oil and Gas sector Key Highlights 33.8 (in thousands) 35.5 Units Sold ($ in millions) $3.1 $3.9 Equipment Revenue

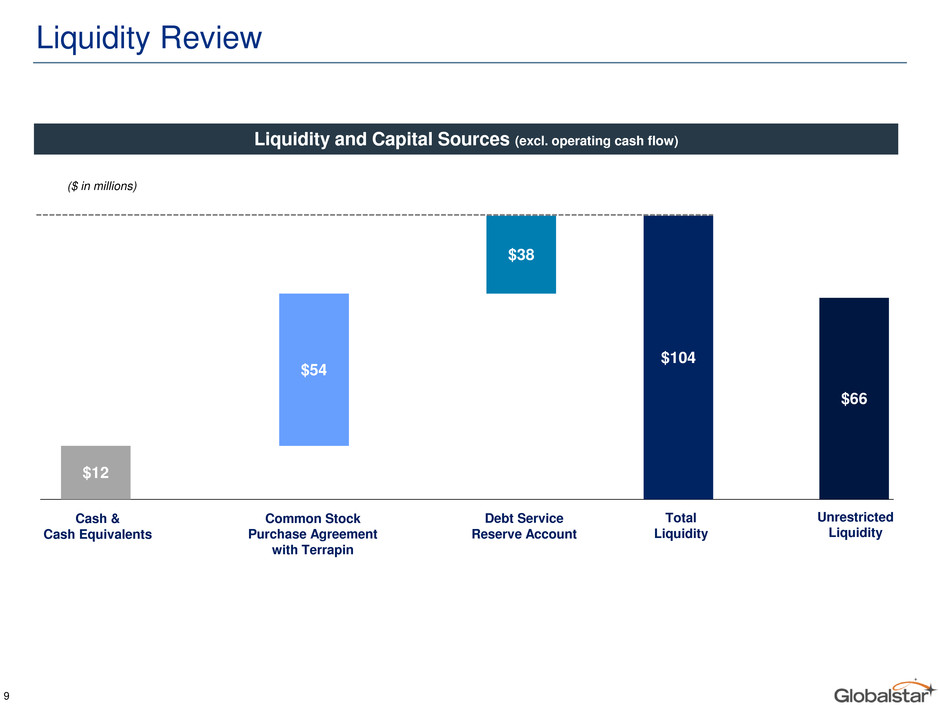
Liquidity Review Liquidity and Capital Sources (excl. operating cash flow) Cash & Cash Equivalents Common Stock Purchase Agreement with Terrapin Debt Service Reserve Account Total Liquidity Unrestricted Liquidity $12 $54 $38 $104 $66 ($ in millions) 9

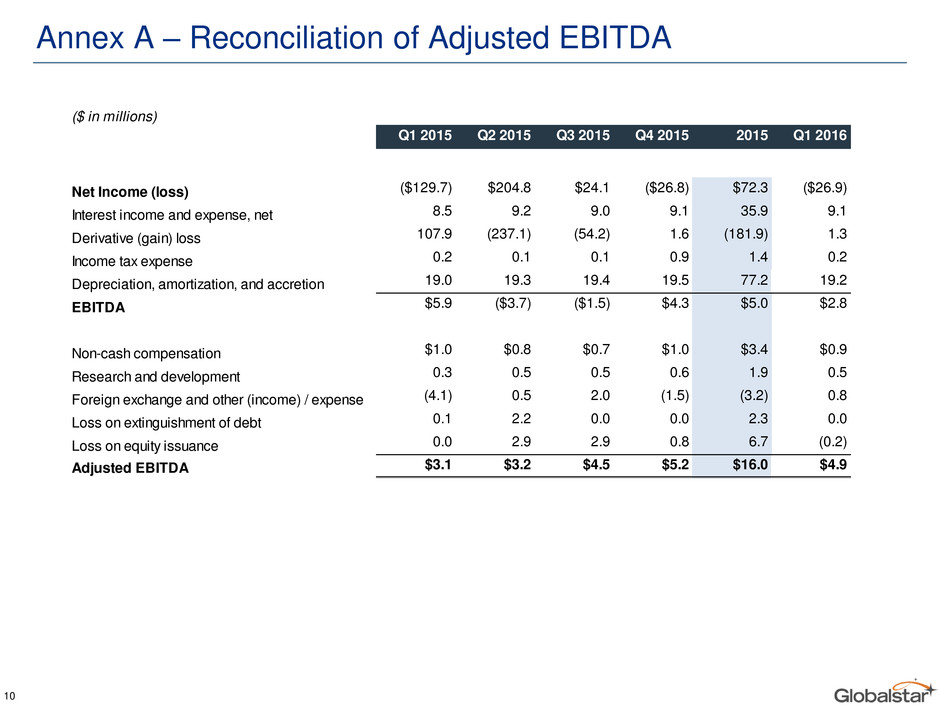
Annex A – Reconciliation of Adjusted EBITDA 10 ($ in millions) Q1 2015 Q2 2015 Q3 2015 Q4 2015 2015 Q1 2016 Net Income (loss) ($129.7) $204.8 $24.1 ($26.8) $72.3 ($26.9) Interest income and expense, net 8.5 9.2 9.0 9.1 35.9 9.1 Derivative (gain) loss 107.9 (237.1) (54.2) 1.6 (181.9) 1.3 Income tax expense 0.2 0.1 0.1 0.9 1.4 0.2 Depreciation, amortization, and accretion 19.0 19.3 19.4 19.5 77.2 19.2 EBITDA $5.9 ($3.7) ($1.5) $4.3 $5.0 $2.8 Non-cash compensation $1.0 $0.8 $0.7 $1.0 $3.4 $0.9 R search and development 0.3 0.5 0.5 0.6 1.9 0.5 Foreign exchange and other (income) / expense (4.1) 0.5 2.0 (1.5) (3.2) 0.8 Loss on extinguishment of debt 0.1 2.2 0.0 0.0 2.3 0.0 Loss on equity issuance 0.0 2.9 2.9 0.8 6.7 (0.2) Adjusted EBITDA $3.1 $3.2 $4.5 $5.2 $16.0 $4.9
