Attached files
| file | filename |
|---|---|
| 8-K - 8-K - ENTERPRISE FINANCIAL SERVICES CORP | a2016-058kannualshareholde.htm |

Enterprise Financial Services Corp ANNUAL SHAREHOLDER MEETING – MAY 5, 2016

1 JAMES J. MURPHY, JR. CHAIRMAN, EFSC 2016 ANNUAL SHAREHOLDER MEETING

2 BIRCH M. MULLINS THANK YOU FOR YOUR SERVICE AND MANY CONTRIBUTIONS 1996-2016

3 WELCOME TO THE EFSC BOARD OF DIRECTORS MICHAEL R. HOLMES
4 JOHN S. EULICH CHAIRMAN ELECT, EFSC 2016 ANNUAL SHAREHOLDER MEETING

5 JAMES J. MURPHY, JR. THANK YOU FOR YOUR SERVICE AS CHAIRMAN OF THE BOARD 2008-2016

6 KEENE S. TURNER CHIEF FINANCIAL OFFICER, EFSC 2016 ANNUAL SHAREHOLDER MEETING
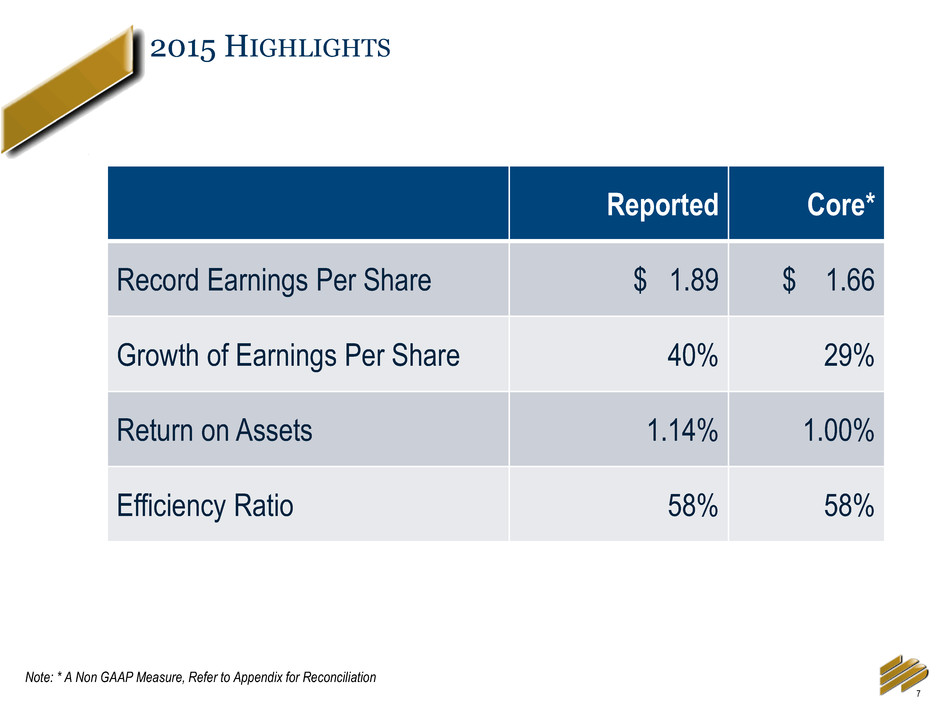
7 Reported Core* Record Earnings Per Share $ 1.89 $ 1.66 Growth of Earnings Per Share 40% 29% Return on Assets 1.14% 1.00% Efficiency Ratio 58% 58% 2015 HIGHLIGHTS Note: * A Non GAAP Measure, Refer to Appendix for Reconciliation

8 FULL YEAR EARNINGS PER SHARE TREND $1.29 $0.29 < $0.01> $0.03 $0.06 $1.66 2014 YTD Net Interest Income Portfolio Loan Loss Provision Non Interest Income Non Interest Expense 2015 YTD In Millions CHANGES IN CORE EPS* Note: * A Non GAAP Measure, Refer to Appendix for Reconciliation

9 POSITIVE MOMENTUM IN CORE* EARNINGS PER SHARE $0.28 $0.31 $0.37 $0.33 $0.35 $0.38 $0.44 $0.49 $0.47 Q1 '14 Q2 '14 Q3 '14 Q4 '14 Q1 '15 Q2 '15 Q3 '15 Q4 '15 Q1 '16 Note: * A Non-GAAP Measure, Refer to Appendix for Reconciliation 68% Core EPS Growth from Q1 2014 to Q1 2016 Two-year CAGR – 30%

10 CORE NET INTEREST INCOME TRENDS* In Millions Note: * A Non-GAAP Measure, Refer to Appendix for Reconciliation $25.6 $26.3 $27.1 $28.7 $29.6 3.46% 3.46% 3.41% 3.50% 3.54% 0.00% 0.50% 1.00% 1.50% 2.00% 2.50% 3.00% 3.50% $18.0 $19.0 $20.0 $21.0 $22.0 $23.0 $24.0 $25.0 $26.0 $27.0 $28.0 $29.0 $30.0 Q1 '15 Q2 '15 Q3 '15 Q4 '15 Q1 '16 Core Net Interest Income* FTE Net Interest Margin*

11 CREDIT TRENDS FOR PORTFOLIO LOANS 25 bps 11 bps 2 bps -10 bps -1 bps Q1 '15 Q2 '15 Q3 '15 Q4 '15 Q1 '16 Net Charge-offs (1) (1) Portfolio loans only, excludes PCI (Purchased Credit Impaired) loans $1.6 $2.2 $0.6 $0.5 $0.8 $- $0.6 $1.2 $1.8 $2.4 Q1 '15 Q2 '15 Q3 '15 Q4 '15 Q1 '16 Provision for Portfolio Loans Q1 2016 EFSC PEER(2) NPA’S/ASSETS = 0.52% 0.64% NPL’S/LOANS = 0.34% 0.62% ALLL/NPL’S = 361% 175% ALLL/LOANS = 1.21% 1.10% (2) Peer data as of 12/31/2015 (source: SNL Financial) In Millions 2015 NCO = 6 bps $1.6 $107 $59.6 $149 $81.9 Q1 '15 Q2 '15 Q3 '15 Q4 '15 Q1 '16 Portfolio Loan Growth In Millions Net Charge-offs (1)

12 OPERATING EXPENSES TRENDS* In Millions Note: * A Non-GAAP Measure, Refer to Appendix for Reconciliation $5.9 $6.1 $6.2 $6.5 $6.1 $1.7 $1.6 $1.6 $1.7 $1.7 $11.5 $11.3 $11.5 $11.8 $12.6 60.7% 57.6% 58.6% 56.1% 57.4% 0 5 10 15 20 25 Q1 '15 Q2 '15 Q3 '15 Q4 '15 Q1 '16 Other Occupancy Employee compensation and benefits Core Efficiency Ratio* $19.1 $19.0 $19.3 $20.0 $20.4

13 SCOTT R. GOODMAN PRESIDENT, ENTERPRISE BANK & TRUST 2016 ANNUAL SHAREHOLDER MEETING

14 GROWING OPPORTUNITIES FOR REGIONAL BANKS LIKE ENTERPRISE Universal Banks Assets / Total Financial Sector Assets (1) Source: Board of Governors of the Federal Reserve System, SNL Financial and KBW Research Universal Banks include: BAC, BK, C, GS, JPM, MS, STT and WFC (1) Measures the sum of universal bank assets as a percentage of total financial assets for the domestic financial sector in Flow of Funds data
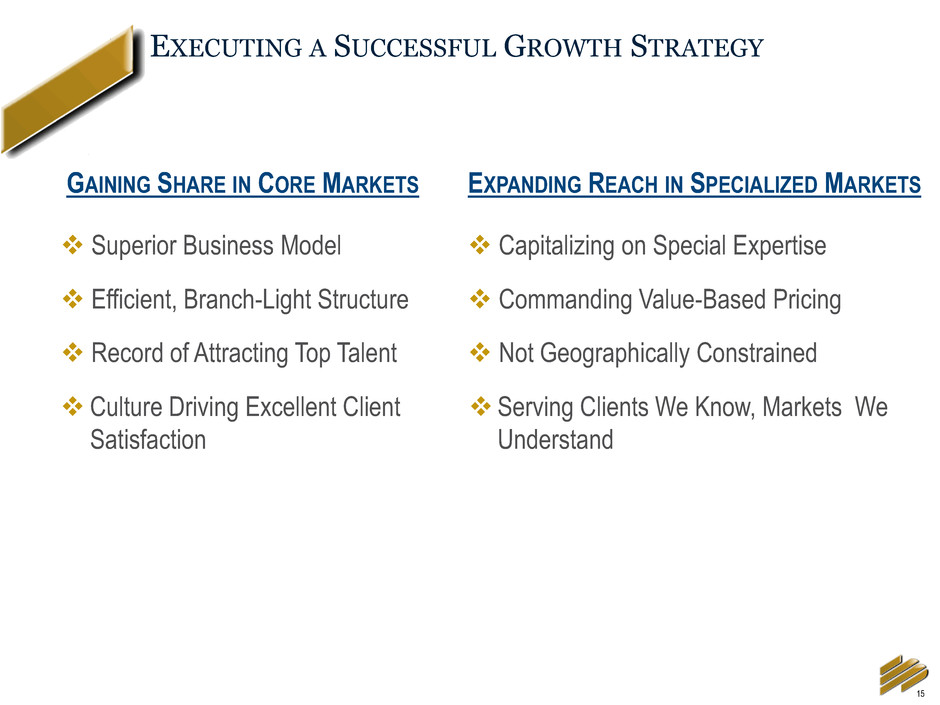
15 GAINING SHARE IN CORE MARKETS Superior Business Model Efficient, Branch-Light Structure Record of Attracting Top Talent Culture Driving Excellent Client Satisfaction EXECUTING A SUCCESSFUL GROWTH STRATEGY EXPANDING REACH IN SPECIALIZED MARKETS Capitalizing on Special Expertise Commanding Value-Based Pricing Not Geographically Constrained Serving Clients We Know, Markets We Understand
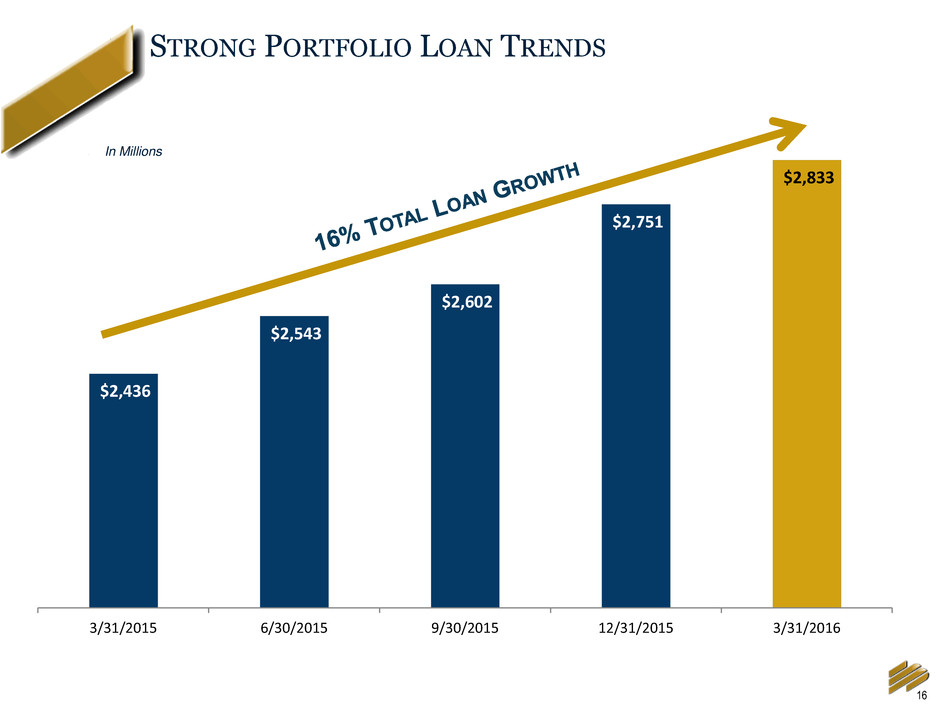
16 STRONG PORTFOLIO LOAN TRENDS $2,436 $2,543 $2,602 $2,751 $2,833 3/31/2015 6/30/2015 9/30/2015 12/31/2015 3/31/2016 In Millions
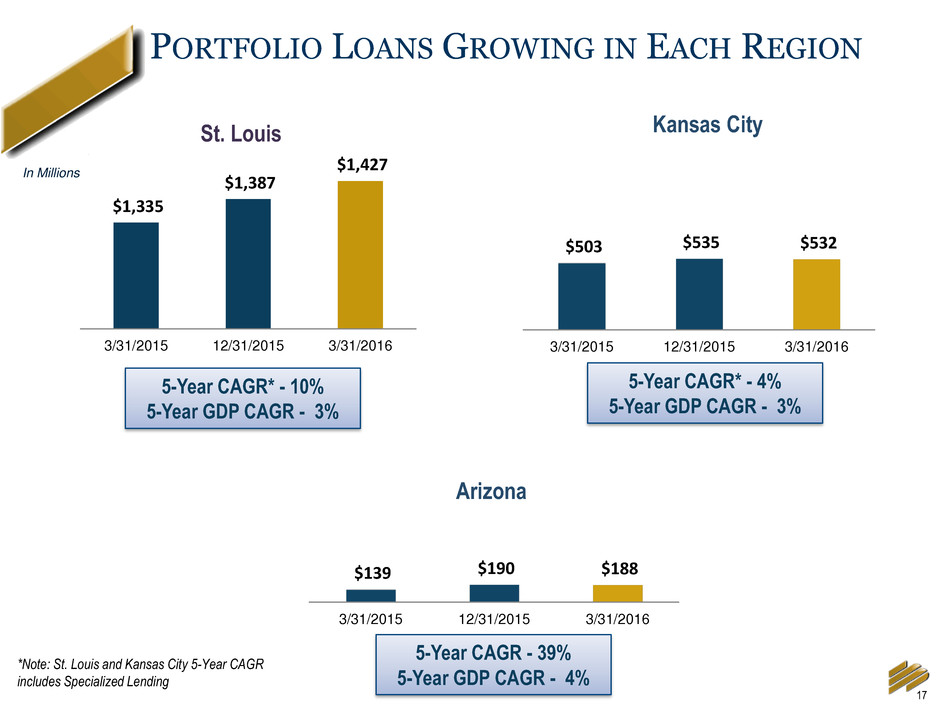
17 PORTFOLIO LOANS GROWING IN EACH REGION $1,335 $1,387 $1,427 $1,100 $1,150 $1,200 $1,250 $1,300 $1,350 $1,400 $1,450 3/31/2015 12/31/2015 3/31/2016 St. Louis $503 $535 $532 0 200 400 600 800 1000 1200 1400 3/31/2015 12/31/2015 3/31/2016 $139 $190 $188 0 500 1000 1500 3/31/2015 12/31/2015 3/31/2016 In Millions Kansas City Arizona 5-Year CAGR* - 10% 5-Year GDP CAGR - 3% 5-Year CAGR* - 4% 5-Year GDP CAGR - 3% 5-Year CAGR - 39% 5-Year GDP CAGR - 4% *Note: St. Louis and Kansas City 5-Year CAGR includes Specialized Lending

18 OUR MODEL CREATES STRONG CLIENT RELATIONSHIPS 7% 5% 6% 23% 17% 24% 70% 78% 70% Overall Client Satisfaction RM Satisfaction Prefer Over Competitors Dissatisfied Satisfied Completely Satisfied NORM 56% NORM 73% Source: Greenwich & Associates

19 SPECIALIZED LENDING BOOSTS OUR GROWTH $136 $137 $153 $229 $350 $360 $230 $265 $272 $30 3/31/2015 12/31/2015 3/31/2016 Tax Credit Enterprise Value Lending Life Insurance Premium Financing Aircraft Finance In Millions

20 GROWTH POTENTIAL BEYOND OUR CORE FOOTPRINT Red: Core Markets Green: Specialized Lending Markets

21 DRIVERS OF LOAN GROWTH Enterprise Value Lending 32.9% Life Insurance Premium Finance 10.8% General Commercial & Industrial 24.1% Commercial/ Construction RE 14.8% Residential RE 5.5% Consumer & Other 11.9% $397 MILLION Mar 31, 2015 – Mar 31, 2016

22 DELIVERING ROBUST DEPOSIT GROWTH $2,109 $2,181 $2,357 $2,428 $2,471 Q1 '15 Q2 '15 Q3 '15 Q4 '15 Q1 '16

23 DDA 25% MMA & Savings 39% CD 16% Interest Bearing Transaction Accounts 20% …WITH AN ATTRACTIVE DEPOSIT MIX Cost of Deposits 0.34% Mar 31, 2016 $2,932 MILLION

24 TARGETED APPROACH TO DEPOSIT GROWTH Identify Deposit- Rich Segments Targeted Marketing, Sales, Product Design Establish Client Focused Deposit Niches FOR EXAMPLE… FINANCIAL SERVICES FIRMS REGISTERED INVESTMENT ADVISORS LARGE CORPORATIONS

25 JAMES B. LALLY EVP, DIRECTOR OF COMMERCIAL BANKING 2016 ANNUAL SHAREHOLDER MEETING

26 TREASURY MANAGEMENT INTERNATIONAL SERVICES TAX CREDIT BROKERAGE FEES FROM NEW MARKETS TAX CREDIT ALLOCATIONS WEALTH MANAGEMENT & PRIVATE BANKING MORTGAGE BANKING CARD PRODUCTS MULTIPLE FEE INCOME ENGINES

27 27.4% 31.0% 9.8% 2.9% 10.6% 0.1% 6.7% 1.6% 9.9% Trust Income Treasury Management, International & Service Charges Card Services Other Charges & Fees Gain on Sale of Tax Credits Gain on Other Real Estate (core) CDE Revenue Gain on Sale of Mortgages, net PRODUCING A DIVERSE REVENUE MIX… In Millions

28 … AND GROWING FEE INCOME STREAMS - 5.0 10.0 15.0 20.0 25.0 2011 2012 2013 2014 2015 Trust Income Service Charges On Deposits Card Services Other Charges and Fee Gain on Sale of Tax Credits Gain on other real estate (core) CDE Revenue Gain on sale of mortgages, net Miscellaneous income

29 RECRUITING TALENT DEPLOYING TECHNOLOGY Product Sales TRAINING STRATEGIC INSOURCING/OUTSOURCING CAPITALIZING ON OUR RELATIONSHIP-FOCUSED CULTURE FEE INCOME GROWTH STRATEGIES

30 PETER F. BENOIST PRESIDENT & CEO, EFSC 2016 ANNUAL SHAREHOLDER MEETING

31 SUSTAINED GROWTH IN Earnings AND Returns 45% 2015 TOTAL SHAREHOLDER RETURN NEARLY 4 times SNL Index FIVE CONSECUTIVE QUARTERLY Dividend Increases $0.10 Q2 2016 190% 91% 81% EFSC SNL S&P 5-Year Total Shareholder Return Note: SNL Index = U.S. Bank $1B - $5B, as of 12/31/2015 Source: SNL ENTERPRISE FINANCIAL 45% 12% 1% EFSC SNL S&P 1-Year Total Shareholder Return

32 Q & A 2016 ANNUAL SHAREHOLDER MEETING

Appendix
34 USE OF NON-GAAP FINANCIAL MEASURES The Company's accounting and reporting policies conform to generally accepted accounting principles in the United States (“GAAP”) and the prevailing practices in the banking industry. However, the Company provides other financial measures, such as Core net interest margin and other Core performance measures, in this presentation that are considered “non-GAAP financial measures.” Generally, a non-GAAP financial measure is a numerical measure of a company's financial performance, financial position or cash flows that exclude (or include) amounts that are included in (or excluded from) the most directly comparable measure calculated and presented in accordance with GAAP. The Company considers its Core performance measures presented in presentation as important measures of financial performance, even though they are non-GAAP measures, as they provide supplemental information by which to evaluate the impact of PCI loans and related income and expenses, the impact of nonrecurring items, and the Company's operating performance on an ongoing basis. Core performance measures include contractual interest on PCI loans but exclude incremental accretion on these loans. Core performance measures also exclude the Change in FDIC receivable, Gain or loss of other real estate from PCI loans and expenses directly related to the PCI loans and other assets formerly covered under FDIC loss share agreements. Core performance measures also exclude certain other income and expense items the Company believes to be not indicative of or useful to measure the Company's operating performance on an ongoing basis. The attached tables contain a reconciliation of these Core performance measures to the GAAP measures. The Company believes these non-GAAP measures and ratios, when taken together with the corresponding GAAP measures and ratios, provide meaningful supplemental information regarding the Company's performance and capital strength. The Company's management uses, and believes that investors benefit from referring to, these non-GAAP measures and ratios in assessing the Company's operating results and related trends and when forecasting future periods. However, these non-GAAP measures and ratios should be considered in addition to, and not as a substitute for or preferable to, ratios prepared in accordance with GAAP. In the tables below, the Company has provided a reconciliation of, where applicable, the most comparable GAAP financial measures and ratios to the non-GAAP financial measures and ratios, or a reconciliation of the non-GAAP calculation of the financial measure for the periods indicated. Peer group data consists of publicly traded banks with total assets from $1-$10 billion with commercial loans greater than 20% and consumer loans less than 20%.

35 RECONCILIATION OF NON-GAAP FINANCIAL MEASURES Mar 31, Dec 31, Sep 30, Jun 30, Mar 31, (in thousands) 2016 2015 2015 2015 2015 CORE PERFORMANCE MEASURES Net interest income 32,428$ 32,079$ 30,006$ 29,280$ 29,045$ Less: Incremental accretion income 2,834 3,412 2,919 3,003 3,458 Core net interest income 29,594 28,667 27,087 26,277 25,587 Total noninterest income 6,005 6,557 4,729 5,806 3,583 Less: Change in FDIC loss share receivable - (580) (1,241) (945) (2,264) Less (Plus): Gain (loss) on sale of other real estate from PCI loans - 81 31 10 (15) Less: Gain on sale of investment securities - - - - 23 Core noninterest income 6,005 7,056 5,939 6,741 5,839 Total core revenue 35,599 35,723 33,026 33,018 31,426 Provision for portfolio loans 833 543 599 2,150 1,580 Total noninterest expense 20,762 22,886 19,932 19,458 19,950 Less: FDIC clawback - - 298 50 412 Less: FDIC loss share termination - 2,436 Less: Other loss share expenses 327 423 287 378 470 Core noninterest expense 20,435 20,027 19,347 19,030 19,068 Core income before income tax expense 14,331 15,153 13,080 11,838 10,778 Core income tax expense 4,897 5,073 4,204 4,134 3,647 Core net income 9,434$ 10,080$ 8,876$ 7,704$ 7,131$ Core diluted earnings per share 0.47$ 0.49$ 0.44$ 0.38$ 0.35$ Core return on average assets 1.04% 1.13% 1.03% 0.93% 0.88% Core return on average common equity 10.66% 11.46% 10.41% 9.34% 8.99% Core return on average tangible common equity 11.76% 12.68% 11.56% 10.41% 10.06% Core efficiency ratio 57.40% 56.06% 58.58% 57.64% 60.67% NET INTEREST MARGIN TO CORE NET INTEREST MARGIN Net interest income (fully tax equivalent) 32,887$ 32,546$ 30,437$ 29,691$ 29,467$ Less: Incremental accretion income 2,834 3,412 2,919 3,003 3,458 Core net interest income (fully tax equivalent) 30,053$ 29,134$ 27,518$ 26,688$ 26,009$ Average earning assets 3,413,792$ 3,304,827$ 3,201,181$ 3,096,294$ 3,047,815$ Reported net interest margin (fully tax equivalent) 3.87% 3.91% 3.77% 3.85% 3.92% Core net interest margin (fully tax equivalent) 3.54% 3.50% 3.41% 3.46% 3.46% For the Quarter ended

Enterprise Financial Services Corp ANNUAL SHAREHOLDER MEETING – MAY 5, 2016
