Attached files
| file | filename |
|---|---|
| EX-2.7 - EX-2.7 - Atkore Inc. | d137452dex27.htm |
| EX-3.4 - EX-3.4 - Atkore Inc. | d137452dex34.htm |
| EX-4.1 - EX-4.1 - Atkore Inc. | d137452dex41.htm |
| EX-23.1 - EX-23.1 - Atkore Inc. | d137452dex231.htm |
| EX-23.2 - EX-23.2 - Atkore Inc. | d137452dex232.htm |
| EX-10.34 - EX-10.34 - Atkore Inc. | d137452dex1034.htm |
| EX-10.27 - EX-10.27 - Atkore Inc. | d137452dex1027.htm |
| EX-10.36 - EX-10.36 - Atkore Inc. | d137452dex1036.htm |
| EX-10.30 - EX-10.30 - Atkore Inc. | d137452dex1030.htm |
| EX-10.35 - EX-10.35 - Atkore Inc. | d137452dex1035.htm |
| EX-10.29 - EX-10.29 - Atkore Inc. | d137452dex1029.htm |
| EX-10.25 - EX-10.25 - Atkore Inc. | d137452dex1025.htm |
| EX-10.26 - EX-10.26 - Atkore Inc. | d137452dex1026.htm |
| EX-10.28.1 - EX-10.28.1 - Atkore Inc. | d137452dex10281.htm |
| EX-10.28.2 - EX-10.28.2 - Atkore Inc. | d137452dex10282.htm |
Table of Contents
As filed with the U.S. Securities and Exchange Commission on May 5, 2016
Registration No. 333-209940
UNITED STATES
SECURITIES AND EXCHANGE COMMISSION
WASHINGTON, D.C. 20549
Amendment No. 2
to
FORM S-1
REGISTRATION STATEMENT
UNDER
THE SECURITIES ACT OF 1933
Atkore International Group Inc.
(Exact Name of Registrant as Specified in its Charter)
| Delaware | 3699 | 90-0631463 | ||
| (State or Other Jurisdiction of Incorporation or Organization) |
(Primary Standard Industrial Classification Code Number) |
(I.R.S. Employer Identification Number) |
16100 South Lathrop Avenue
Harvey, Illinois 60426
(708) 339-1610
(Address, including zip code, and telephone number, including area code, of registrant’s principal executive offices)
Daniel S. Kelly, Esq.
Vice President—General Counsel and Secretary
Atkore International Group Inc.
16100 South Lathrop Avenue
Harvey, Illinois 60426
(708) 339-1610
(Name, address, including zip code, and telephone number, including area code, of agent for service)
Copies to:
| Paul M. Rodel, Esq. Debevoise & Plimpton LLP 919 Third Avenue New York, New York 10022 (212) 909-6000 |
Marc D. Jaffe, Esq. Wesley C. Holmes, Esq. Latham & Watkins LLP 885 Third Avenue New York, New York 10022 (212) 906-1200 |
Approximate date of commencement of proposed sale of the securities to the public: As soon as practicable after this registration statement becomes effective.
If any of the securities being registered on this Form are to be offered on a delayed or continuous basis pursuant to Rule 415 under the Securities Act of 1933, check the following box. ¨
If this Form is filed to register additional securities for an offering pursuant to Rule 462(b) under the Securities Act, please check the following box and list the Securities Act registration statement number of the earlier effective registration statement for the same offering. ¨
If this Form is a post-effective amendment filed pursuant to Rule 462(c) under the Securities Act, check the following box and list the Securities Act registration statement number of the earlier effective registration statement for the same offering. ¨
If this Form is a post-effective amendment filed pursuant to Rule 462(d) under the Securities Act, check the following box and list the Securities Act registration statement number of the earlier effective registration statement for the same offering. ¨
Indicate by check mark whether the registrant is a large accelerated filer, an accelerated filer, a non-accelerated filer, or a smaller reporting company. See the definitions of “large accelerated filer,” “accelerated filer,” and “smaller reporting company” in Rule 12b-2 of the Exchange Act.
| Large accelerated filer | ¨ | Accelerated filer | ¨ | |||
| Non-accelerated filer | x (Do not check if a smaller reporting company) | Smaller reporting company | ¨ | |||
CALCULATION OF REGISTRATION FEE
|
| ||||
| Title of Each Class of Securities to be Registered |
Proposed Maximum Aggregate Offering Price(1)(2) |
Amount of Registration Fee(3) | ||
| Common Stock, par value $0.01 per share |
$100,000,000 | $10,070 | ||
|
| ||||
|
| ||||
| (1) | Estimated solely for the purpose of calculating the registration fee in accordance with Rule 457(o) of the Securities Act of 1933, as amended. |
| (2) | Includes offering price of shares of Common Stock that may be sold pursuant to the underwriters’ option to purchase additional shares. |
| (3) | Previously paid. |
The registrant hereby amends this registration statement on such date or dates as may be necessary to delay its effective date until the registrant shall file a further amendment which specifically states that this registration statement shall thereafter become effective in accordance with Section 8(a) of the Securities Act of 1933 or until the registration statement shall become effective on such date as the U.S. Securities and Exchange Commission, acting pursuant to said Section 8(a), may determine.
Table of Contents
The information in this preliminary prospectus is not complete and may be changed. We may not sell these securities until the U.S. Securities and Exchange Commission declares our registration statement effective. This preliminary prospectus is not an offer to sell these securities and we are not soliciting offers to buy these securities in any state or jurisdiction where the offer or sale is not permitted.
SUBJECT TO COMPLETION, DATED MAY 5, 2016
Shares

Atkore International Group Inc.
Common Stock
This is an initial public offering of shares of common stock of Atkore International Group Inc. All of the shares of common stock are being offered by the selling stockholder identified in this prospectus. We will not receive any of the proceeds from the sale of the shares being sold in this offering.
Prior to this offering, there has been no public market for the common stock. We anticipate that the initial public offering price will be between $ and $ per share. We have been approved to list our common stock on the New York Stock Exchange, or the “NYSE,” under the symbol “ATKR”.
After the completion of this offering, we expect to be a “controlled company” within the meaning of the corporate governance standards of the NYSE.
Investing in our common stock involves risks. See “Risk Factors” beginning on page 17 of this prospectus to read about factors you should consider before buying shares of our common stock.
| Per Share | Total | |||||||
| Initial public offering price |
$ | $ | ||||||
| Underwriting discounts and commissions(1) |
$ | $ | ||||||
| Proceeds, before expenses, to the selling stockholder |
$ | $ | ||||||
| (1) | See “Underwriting” for additional information regarding total underwriter compensation. |
The underwriters also may purchase up to additional shares from the selling stockholder at the initial offering price less the underwriting discounts and commissions, within 30 days from the date of this prospectus.
Neither the U.S. Securities and Exchange Commission nor any state securities commission has approved or disapproved the securities described herein or determined if this prospectus is truthful or complete. Any representation to the contrary is a criminal offense.
The underwriters expect to deliver the shares to purchasers on or about , 2016.
| Credit Suisse | Deutsche Bank Securities | J.P. Morgan | ||
| UBS Investment Bank | ||||
| Citigroup | RBC Capital Markets | Wells Fargo Securities | ||
Prospectus dated , 2016
Table of Contents

Table of Contents
| ii | ||||
| ii | ||||
| ii | ||||
| 1 | ||||
| 17 | ||||
| Special Note Regarding Forward-Looking Statements and Information |
38 | |||
| 40 | ||||
| 41 | ||||
| 42 | ||||
| 43 | ||||
| 44 | ||||
| Management’s Discussion and Analysis of Financial Condition and Results of Operations |
47 | |||
| 80 | ||||
| 97 | ||||
| 104 | ||||
| 125 | ||||
| 127 | ||||
| 131 | ||||
| 137 | ||||
| 139 | ||||
| 146 | ||||
| 150 | ||||
| 158 | ||||
| 158 | ||||
| 158 | ||||
| F-1 |
You should rely only on the information contained in this prospectus and any free writing prospectus we may authorize to be delivered to you. We have not, and the selling stockholder and the underwriters have not, authorized anyone to provide you with information different from, or in addition to, that contained in this prospectus and any related free writing prospectus. We, the selling stockholder and the underwriters take no responsibility for, and can provide no assurances as to the reliability of, any information that others may give you. This prospectus is an offer to sell only the shares offered hereby, but only under circumstances and in jurisdictions where it is lawful to do so. The information contained in this prospectus is only accurate as of the date of this prospectus, regardless of the time of delivery of this prospectus and any sale of shares of our common stock.
i
Table of Contents
Unless the context otherwise requires, the terms “we,” “us,” “our,” “Atkore,” and the “Company,” as used in this prospectus, refer to Atkore International Group Inc. and its consolidated subsidiaries. The term “AIH” refers to Atkore International Holdings Inc., our direct wholly owned subsidiary. The term “AII” refers to Atkore International, Inc., our indirect wholly owned subsidiary.
We account for a majority of our inventory using the last-in, first-out, or “LIFO,” method measured at the lower-of-cost-or-market value. We have adopted this accounting principle because the LIFO method of valuing inventories reflects how we monitor and manage our business and matches current costs and revenues. Certain of our subsidiaries made changes to their accounting principles to conform to our accounting principles.
We have a 52- or 53-week fiscal year that ends on the last Friday in September. Fiscal 2015, 2014 and 2013 were 52-week fiscal years which ended on September 25, 2015, September 26, 2014 and September 27, 2013, respectively. Our next fiscal year will end on September 30, 2016, and will be a 53-week year. Our fiscal quarters end on the last Friday in December, March and June.
This prospectus includes estimates regarding market and industry data and forecasts, which are based on publicly available information, industry publications and surveys, reports from government agencies, reports by market research firms and our own estimates based on our management’s knowledge of, and experience in, the market segments in which we operate. We have not independently verified market and industry data from third-party sources. This information cannot always be verified with complete certainty due to the limits on the availability and reliability of raw data, the voluntary nature of the data gathering process, and other limitations and uncertainties inherent in surveys of market size. In addition, our estimates involve risks and uncertainties and are subject to change based on various factors, including those discussed under the captions “Risk Factors,” “Special Note Regarding Forward-Looking Statements and Information” and “Management’s Discussion and Analysis of Financial Condition and Results of Operations.”
We hold various service marks, trademarks and trade names, such as Atkore International, our logo design, AFC Cable Systems, Allied Tube & Conduit, Cope, FlexHead, Heritage Plastics, Kaf-Tech, Power-Strut, SprinkFLEX and Unistrut, that we deem particularly important to the advertising activities conducted by each of our businesses. Solely for convenience, the trademarks, service marks, trade names and copyrights referred to in this prospectus are listed without the ™, ® and © symbols, but such references do not constitute a waiver of any rights that might be associated with the respective trademarks, service marks, trade names or copyrights included or referred to in this prospectus. This prospectus also contains trademarks, service marks and trade names of other companies which are the property of their respective holders. We do not intend our use or display of such names or marks to imply relationships with, or endorsements of us by, any other company.
ii
Table of Contents
The following summary highlights selected information contained elsewhere in this prospectus. Because this is only a summary, it does not contain all of the information you should consider before investing in our common stock. You should carefully read the entire prospectus, including the sections entitled “Risk Factors” and “Management’s Discussion and Analysis of Financial Condition and Results of Operations,” as well as our consolidated financial statements and related notes included elsewhere in this prospectus, before making an investment decision.
Our Company
We are a leading manufacturer of Electrical Raceway products primarily for the non-residential construction and renovation markets and Mechanical Products & Solutions, or “MP&S,” for the construction and industrial markets. Electrical Raceway products form the critical infrastructure that enables the deployment, isolation and protection of a structure’s electrical circuitry from the original power source to the final outlet. MP&S frame, support and secure component parts in a broad range of structures, equipment and systems in electrical, industrial and construction applications. We believe we hold #1 or #2 positions in the United States by net sales in the vast majority of our products. The quality of our products, the strength of our brands, our reliable service capabilities and our scale and national presence provide what we believe to be a unique set of competitive advantages that positions us for profitable growth.
We manufacture a broad range of end-to-end integrated products and solutions that are critical to our customers’ businesses. Our broad product offering enables us to bundle and co-load a wide range of products, which simplifies the ordering and delivery processes and streamlines logistics, reducing costs for us and our customers. We primarily serve electrical contractors and original equipment manufacturers, or “OEMs,” both directly and through our established core customer base of electrical and industrial distributors. Our operational footprint, together with our national distribution network, provides important proximity to our customers and enables efficient and reliable delivery of our products. Our scale creates meaningful purchasing power with key suppliers and enables us to leverage common manufacturing technology and processes across our business.
We estimate that we operate in a $13 billion subset of the $78 billion U.S. electrical products market for our Electrical Raceway products and in a $3.8 billion U.S. addressable market for our MP&S products. Both of these markets are highly fragmented and present attractive opportunities for significant growth. As illustrated in the following charts, approximately 70% of our net sales in fiscal 2015 were derived from U.S. construction demand, which primarily consisted of new non-residential construction and maintenance, repair and remodel, or “MR&R,” spending on existing non-residential structures. Based on data from Dodge Data & Analytics, or “Dodge,” new non-residential construction starts remain significantly below long-term historical average levels and have meaningful opportunity for growth going forward.
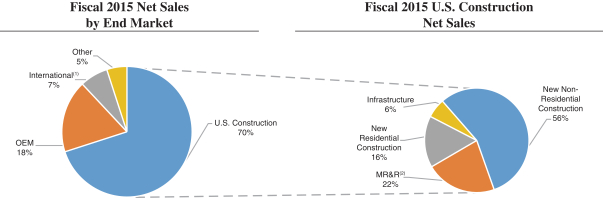
| (1) | International primarily includes Australia, Canada, China, New Zealand and United Kingdom. |
| (2) | MR&R includes non-residential and residential markets. |
1
Table of Contents
Since our separation from Tyco International Ltd., or “Tyco,” in December 2010, we have undertaken a significant transformation of our business. We have acquired six businesses, which have strengthened and extended our capabilities and offerings across our entire product portfolio. We also divested four businesses and permanently closed other businesses that we considered non-core operations due to unfavorable competitive positions or cost structures. This proactive optimization of our portfolio has enabled us to focus on our core businesses, improve our mix of higher margin products, drive market share gains and improve overall profitability.
In order to execute our business transformation we have significantly upgraded our management team, with over 90% of our executives and 70% of our senior leadership in new roles or new to the Company since 2011. Our executives have extensive experience with leading electrical and industrial corporations, including Danaher Corporation, Eaton Corporation plc, ITT Corporation, Legrand S.A., Pentair plc and Tyco. Our management team has also developed and implemented the Atkore Business System, or “ABS,” a foundational set of principles, behaviors and beliefs based on driving excellence in strategy, people and processes. The deployment of ABS throughout our operations has provided the skillset, mindset and toolset for our employees to identify, execute and sustain a series of business initiatives that have contributed to our growth and profitability improvements since 2011. By implementing employee incentives that reinforce our organization’s engagement and alignment around ABS, we expect that we will be able to achieve future business improvements and drive profitable growth in excess of the growth rates of the markets in which we compete.
As a result of our transformational business initiatives, we have been able to deliver strong financial and operating performance from fiscal 2011 to the twelve months ended March 25, 2016, or “LTM March 2016,” as set forth below:
| • | We grew our Adjusted net sales and net sales at compound annual growth rates, or “CAGRs,” of 3.9% and 2.1%, respectively, to $1,487.1 million and $1,586.1 million, respectively; |
| • | We increased our Adjusted EBITDA at a CAGR of 25.6% to $207.1 million and increased our net income by $53.0 million from a net loss position to net income of $14.6 million; and |
| • | We have driven approximately 800 basis points and 360 basis points of expansion in our Adjusted EBITDA margins and net income margins, respectively. |
For a reconciliation of net sales to Adjusted net sales, net income (loss) to Adjusted EBITDA and a definition of Adjusted EBITDA margin, see “—Summary Historical Consolidated Financial Data.”
Our Reportable Segments
We operate through two reportable segments: Electrical Raceway and MP&S. Our segments benefit from common raw material usage, similar manufacturing processes and a complementary distribution network. Our scale and rigorous application of efficient manufacturing techniques across both segments enable us to be a low-cost manufacturer, which further adds to our competitive advantage.
Electrical Raceway: Through our Electrical Raceway segment, we manufacture products that deploy, isolate and protect a structure’s electrical circuitry from the original power source to the final outlet. These products, which include electrical conduit, armored cable, cable trays, mounting systems and fittings, are critical components of the electrical infrastructure for new construction and MR&R markets. Our broad product offering and variety of base materials, such as steel, copper and polyvinyl chloride, or “PVC,” resin, provide contractors and OEMs with a complete Electrical Raceway solution. The vast majority of our Electrical Raceway net sales are made to electrical distributors, who then serve electrical contractors and we consider both to be customers. Our customers benefit from bundling and co-loading of our products, resulting in streamlined logistics and reduced costs. We believe we have a meaningful competitive advantage as the only U.S. manufacturer providing a broad product offering across most Electrical Raceway categories.
2
Table of Contents
Mechanical Products & Solutions: Through our MP&S segment, we provide products and services that frame, support and secure component parts in a broad range of structures, equipment and systems in electrical, industrial and construction applications. Our principal products in this segment are metal framing products and in-line galvanized mechanical tube. Through our metal framing business, we design, manufacture and install metal strut and fittings used to assemble mounting structures that support heavy equipment and electrical content in buildings and other structures. Approximately 40% of our U.S. net sales in strut and fittings are generally sold to mechanical and other broad-line industrial distributors, while the remaining 60% of our U.S. net sales in strut and fittings are used for mounting Electrical Raceway products and are sold to electrical distributors. Our international net sales, which are included in our MP&S segment, primarily consist of metal framing products that serve Electrical Raceway and mechanical support applications. Through our mechanical tubular products business, we believe that we are one of only two companies in the United States that manufacture and market in-line galvanized tubular products on a national basis. We believe that approximately 90% of our net sales in this business are made directly or indirectly to OEM customers serving a wide range of industrial and construction end markets.
| Electrical Raceway |
Mechanical Products & Solutions | |||||||||||
| Overview | Products that deploy, isolate and protect a structure’s electrical circuitry from the original power source to the final outlet | Products and services that frame, support and secure component parts in a broad range of structures, equipment and systems in electrical, industrial and construction applications | ||||||||||
| LTM March 2016 Adjusted Net Sales/Net Sales(1)(2) | $961.4 million/$961.4 million | $527.2 million/$621.8 million | ||||||||||
| LTM March 2016 Adjusted EBITDA(1)(3) | $140.7 million | $90.7 million | ||||||||||
| % Adjusted EBITDA margin(3) | 14.6%/14.6% | 17.2%/14.6% | ||||||||||
| Estimated U.S. Market Size(4) | $13 billion | $3.8 billion | ||||||||||
| Estimated U.S. Market Share(4) | ~8% | ~12% | ||||||||||
| Leading Market Positions(5) |

|

|

|

|

| |||||||
| #1 Steel Conduit (35% share) |
#1 PVC Conduit (37% share) | #1 Armored Cable (36% share) |
#2 Metal Framing & Related Fittings (21% share) |
#1 In-line Galvanized Mechanical Tube (80% share) | ||||||||
| Core Products | • Electrical conduit and fittings
• Armored cable and fittings
• Flexible and liquidtight electrical conduit and fittings
• Cable tray, cable ladder and wire basket |
• Metal framing and related fittings
• In-line galvanized mechanical tube | ||||||||||
| Primary Market Channel | Electrical distribution | Electrical, industrial and specialized distribution and direct to OEMs | ||||||||||
| Principal Brands |

|

|

|

|

|
| ||||||


| (1) | Includes intersegment sales and excludes amounts attributable to Corporate. |
| (2) | For a reconciliation of LTM March 2016 segment net sales to segment Adjusted net sales see “—Summary Historical Consolidated Financial Data.” |
| (3) | For a reconciliation of LTM March 2016 segment Adjusted EBITDA to segment Adjusted EBITDA for the fiscal year ended September 25, 2015 see “—Summary Historical Consolidated Financial Data.” Adjusted EBITDA margin is calculated as segment Adjusted EBITDA as a percentage of Adjusted net sales and also as Adjusted EBITDA as a percentage of net sales. |
| (4) | Management estimates based on market data and industry knowledge. Market share is based on our U.S. Adjusted net sales relative to the estimated U.S. addressable market size. |
| (5) | Based on our Adjusted net sales relative to the estimated net sales of known competitors in addressable markets. Unless stated otherwise, market position refers to management’s estimate of our market position in the United States within the estimated addressable markets we serve. |
3
Table of Contents
Our Industries
Electrical Raceway
We estimate that we operate in a $13 billion subset of the $78 billion U.S. electrical products market for our Electrical Raceway products. We believe we have an approximately 8% share of this $13 billion market, in which our existing product offering addresses an estimated $4 billion of the total market opportunity. As a result, we have a substantial opportunity to expand our presence in this market through the introduction of new products as well as through strategic acquisitions. The Electrical Raceway market is highly fragmented and is undergoing significant change as a result of consolidation among electrical distributors and manufacturers, product mix changes stemming from increasing demand for new building technology such as increased facility automation and adoption of LED lighting systems, and a demographic shift in the electrical installer base. We believe these changes are likely to drive the need for additional electrical content in building infrastructure, thereby driving growth in demand for our products. Some of the largest competitors in the Electrical Raceway market include ABB Ltd., Eaton Corporation plc, Pentair plc and Hubbell Incorporated. While most of our competitors manufacture products for only a few Electrical Raceway categories, we believe we provide a more complete offering of products and solutions, which gives us a distinct competitive advantage.
Mechanical Products & Solutions
Our MP&S segment serves a number of niche markets that we estimate to comprise an aggregate U.S. addressable market of approximately $3.8 billion, of which we believe we currently have approximately 12% market share. Our businesses in this segment include two principal product areas: metal framing and in-line galvanized mechanical tube. We believe we have the #2 position in the metal framing market in the United States with approximately 21% market share. Our primary competitors in the market include B-Line (part of Eaton Corporation plc), Thomas & Betts (part of ABB Ltd.) and Haydon Corporation, as well as a number of smaller manufacturers. Like our Electrical Raceway segment, demand in our metal framing business is primarily driven by non-residential construction trends. We believe we have the #1 position in the United States in the in-line galvanized mechanical tube market, which is a subset of the broader market for mechanical tubular products. In-line galvanization provides superior anti-corrosive performance, aesthetic appearance and product strength when compared to tubular products using other anti-corrosive processes. In this business, we serve customers in utility grade solar power generation, agricultural and other industrial end markets for whom demand is correlated to overall economic growth and industrial production, as well as market-specific factors such as alternative energy tax credits for solar power.
Non-residential Construction
Demand for products in both our Electrical Raceway and MP&S segments is primarily driven by non-residential construction activity. Construction activity in this market depends on a number of factors, including the overall economic outlook, general business cycle, interest rates, availability of credit and demographic trends that influence the location and magnitude of construction related to new business activities. We believe we will benefit from the ongoing recovery in the non-residential construction market. According to Dodge, new non-residential construction starts were estimated to be 942 million square feet in 2015, which remains well below historical levels. Starts would need to increase approximately 18% from 2015 levels to reach the average of the five cyclical troughs since 1968 prior to the downturn that began in 2008, approximately 66% to reach the average of the five cyclical peaks over the same period and approximately 35% to achieve the market average since 1968.
4
Table of Contents
Our Competitive Strengths
We believe that we have established a reputation as an industry leader in quality, delivery, value and innovation, primarily as a result of the following competitive strengths:
Leading market positions and strong brands. We believe we have leading market positions in the core products that we offer. Based on management estimates, we believe that approximately 85% of our Adjusted net sales in fiscal 2015 were derived from products for which we hold the #1 or #2 market positions by net sales in the United States. These leadership positions include the #1 positions by net sales in steel conduit and fittings, PVC conduit and fittings, armored cable and fittings and in-line galvanized mechanical tubes, and the #2 position by net sales in metal framing for cable and electrical supports. We go to market with an impressive portfolio of leading brands, including Allied Tube & Conduit, AFC Cable Systems, Heritage Plastics, Unistrut, Power-Strut and Cope. We believe that our leading market positions and strong brands are the result of the reliable performance and quality of our products, our ability to deliver superior service to address our customers’ needs and our well-established customer relationships.
Superior customer value proposition. We offer mission-critical products from a single integrated platform, enabling our customers to conveniently and efficiently purchase a broad range of solutions. Our Electrical Raceway products are core items that we believe must be stocked by U.S. electrical distributors as a staple of their inventory. We believe we maintain the broadest portfolio of products in our industry, enabling us to satisfy this demand and to deliver integrated source-to-outlet electrical solutions. Our ability to bundle and co-load a wide range of Electrical Raceway products for our customers simplifies the ordering and delivery processes and streamlines logistics, reducing costs for us and for our customers. Co-loading benefits our customers by decreasing costs, while bundling allows us to increase our customers’ overall spend by serving as their one-stop-shop. In addition, our ability to provide complete turnkey solutions for large construction and renovation projects creates labor savings for installers. Our MP&S segment employs difficult-to-replicate manufacturing technologies, such as in-line galvanizing, which provides advanced levels of corrosion protection and delivers higher strength levels in mechanical tubular products. Our customer-centric business strategy has translated into strong, consistent performance in terms of product quality, on-time delivery and customer service, further enhancing our reliability and solidifying our customer value proposition. This is evidenced by the average tenure of our top 10 customers, which is approximately 20 years.
Compelling product portfolio with demonstrated ability to innovate and acquire new product capabilities. Since 2011, we have undertaken a series of strategic acquisitions, divestitures and business closures and have developed a number of key new products that have transformed our business into a unique and scalable franchise. These efforts to optimize our product portfolio have expanded our positions in attractive segments of the Electrical Raceway and MP&S markets, while reducing our exposure to less attractive, lower margin businesses and non-core geographies. Through acquisitions, we have expanded our PVC conduit and cable and conduit fittings offerings, enabling us to provide customers with complete Electrical Raceway product solutions. We have also introduced a number of successful new products, such as Luminary Cable, an innovative product that combines data and power transmission within a single armored cable. The success of our portfolio optimization initiatives demonstrates our ability to identify, execute and integrate acquisitions and introduce new products to meet customer demand, and we maintain and continue to pursue a robust pipeline of acquisition targets and additional new product development opportunities. Given the fragmented nature of the markets we serve and evolving customer needs, we believe there is significant opportunity to continue to leverage this strength to grow our business profitably going forward.
Strong platform for growth across attractive end-markets. We believe that we are well positioned to capitalize on industry growth and end-market opportunities, while leveraging our broadening product offering to secure a larger share of customer spend. Demand for our Electrical Raceway and MP&S products is primarily
5
Table of Contents
driven by non-residential construction activity, which remains significantly below historical levels according to Dodge. We believe the continuing recovery in new non-residential construction supports a strong platform for growth, and our meaningful participation in MR&R activity provides a steady base of demand for recurring sales of our products. In addition to the positive tailwinds associated with construction trends, we believe we are positioned to benefit from the expansion of higher-growth market segments particularly suited for our products, such as solar, healthcare and data centers, as well as broader energy-efficiency trends, such as increased facility automation and adoption of LED lighting systems, that are driving greater electrical content in buildings and greater demand for our products.
Significant scale providing barriers to entry. Our industry-leading scale creates significant sales, service, manufacturing and procurement advantages over our competitors. We have developed a large, carefully constructed network of highly trained Electrical Raceway and MP&S sales agents with loyal, long-term relationships with Atkore that represent our products in the market. Our positions on our agents’ line cards (product rosters that describe an agent’s offerings) are powerful and difficult to displace, which we believe creates a sustainable advantage. Our comprehensive, integrated distribution and logistics network, consisting of Electrical Raceway stocking agents, MP&S stocking agents and company-operated warehouse locations across the United States, enables us to provide timely and reliable delivery and support for our largest distributor customers and to respond more quickly than our competitors to changes in customer demand. Our high-volume manufacturing and warehousing operations, including our one million square foot facility in Harvey, Illinois, allow us to leverage shared technology, processes and fixed costs across our platform, creating significant operating efficiencies and cost advantages. We estimate the replacement cost of our production and distribution footprint is over $350 million, which represents a sizable impediment to new competition. Finally, our significant purchasing scale enables us to achieve favorable pricing, terms and delivery from our suppliers. On average, we are able to purchase our core raw materials at discounts to market indices such as the CRU Steel Index and the CDI PVC resin index for conduit.
Strong management team driving a highly efficient operating structure. We believe we have built a world-class management team with over 90% of our executives and 70% of our senior leadership in new roles or new to the Company since 2011. Our management team has established a rigorous metric-driven culture to focus on sustained performance. Through the development and implementation of ABS, the proprietary foundational system by which our Company operates, we have transformed our business into a highly efficient platform poised to deliver future growth and incremental operating efficiency. Our operational efficiency is evidenced by our Perfect Order Rate, or “POR” (which we define as the product of order line fill, order error rate and on time delivery), which has increased from 81% in fiscal 2011 to 92% in fiscal 2015, and our Defective Parts per Million, or “DPPM” (which we calculate as volume returned to us as defective per one million of volume shipped), which has decreased by 34% over the same period. We have also taken measures to ensure our products are optimally priced in the markets we serve, employing a disciplined internal pricing strategy and equipping our sales team with the critical information and tools to optimize pricing decisions. Our rigorous internal processes support sustainability and continuous improvement of our business and drive accountability and high-level engagement by our employees.
Strong margin and cash flow profile. Since fiscal 2011, we have meaningfully improved our financial performance, and we believe that we have significant margin expansion opportunities beyond the results achieved to date. Through our business improvement initiatives and product portfolio optimization activities, we increased our Adjusted EBITDA margins by 800 basis points from 5.9% in 2011 to 13.9% for LTM March 2016 and our net income margins by approximately 360 basis points from (2.7)% in 2011 to 0.9% for LTM March 2016. Our business model generates strong cash flow with limited maintenance capital expenditure requirements that typically approximate 2% of net sales. This has given us the flexibility to pursue accretive acquisition targets while simultaneously reducing the leverage on our balance sheet.
6
Table of Contents
Our Strategies
Our goal is to be our customers’ first choice for Electrical Raceway and MP&S, and we intend to drive profitable growth in excess of the growth rates of the markets in which we operate through the following key strategies:
Increase market share by increasing sales to existing customers. We intend to further penetrate existing markets for our Electrical Raceway products and MP&S by strategically focusing our sales and marketing resources on our highly valued accounts. We have built a robust cross-selling sales organization that targets our largest distributor customers by marketing the benefits of ordering our entire product suite for both inventory stocking and for large projects. Our broad portfolio enables co-loading and bundling of our product solutions in an integrated manner. We intend to further grow our share of wallet with our largest and most valued customers by continuing to deliver cost savings, reliable customer service and the benefits of our single source platform.
Expand our product offering and improve our margin mix through new product development and acquisitions. We proactively develop new products and solutions that allow us to stay at the forefront of the needs of the Electrical Raceway and MP&S markets. We have a long history of innovation, which includes the introductions of Kwik-fit electrical conduit, Unistrut Defender and Luminary Cable. We expect to continue to invest in new product development to drive differentiation and growth. Further, our transformational portfolio optimization since 2011 has included a series of strategic acquisitions, divestitures and business closures that have expanded our positions in attractive segments of the Electrical Raceway and MP&S markets while reducing our exposure to less value-added, lower margin businesses and non-core geographies. Given the fragmented nature of the markets we serve and the sizes of our closest adjacent product categories, we intend to pursue our robust pipeline of opportunities to profitably grow our business in higher margin product categories going forward.
Capitalize on projected growth in our end markets while expanding into segments with accelerating growth trends. Market forecasts suggest that non-residential construction starts will grow from 2015 levels, which remain below the average of the past five cyclical troughs and significantly below the average annual starts since 1968, according to Dodge. We believe our exposure to new construction will provide momentum for us to increase sales and earnings as construction starts increase, and our MR&R business will provide a stable sales base going forward. Other industry trends that we believe also support our continued growth include increased facility automation, the adoption of LED lighting systems, as well as the expanding need for data centers that require greater electrical circuitry and more of our products and solutions. We intend to place particular emphasis on markets with potential for greater-than-market growth for our products, such as commercial construction, data centers, healthcare and solar.
Continue to provide reliable service and delivery to our customers. Over the last several years, we have made substantial improvements in our service and delivery performance, including significant increases in our POR and reductions in our DPPM. We believe that reliability and quality are key differentiators for our customers when choosing a supplier. As a result of these business improvements, we have strengthened our value proposition to customers and increased our pricing power. We have identified several additional initiatives in manufacturing processes, supply chain, logistics and inventory management that we expect will further improve the quality of our products and our delivery performance. We believe our focus on continuous improvement will further enhance our value to customers and will translate into accelerated sales growth and profitability in the future.
Continue our focus on excellence in processes and execution to drive margin expansion and cash flow improvements. ABS is the foundational system that drives our organizational focus on excellence in strategy, people and processes. ABS, with its key components of Lean Daily Management, or “LDM,” and our Strategy Deployment Process, or “SDP,” enables us to identify the key levers to further improve our business and subsequently manage and sustain the business improvements we realize. We believe there is a strong correlation
7
Table of Contents
between our implementation and execution of ABS and the business, volume, margin and cash flow conversion improvements we have made over the last four years. We have several initiatives currently underway to continue to improve our profitability and cash flow, including strengthening our Electrical Raceway go-to-market strategy, driving industry best delivery, enhancing our commercial excellence and accelerating innovation and new product development. These and other initiatives are focused on profitably growing our business by becoming our customers’ first choice for Electrical Raceway and MP&S, providing unmatched quality, delivery and value.
Our Sponsor and Organizational Structure
Founded in 1978, Clayton, Dubilier & Rice, LLC, or “CD&R,” is a private equity firm composed of a combination of financial and operating executives with a disciplined and clearly defined investment strategy and a special focus on manufacturing, distribution and multi-location services businesses. Over the last decade, CD&R has been an active investor in the industrial and construction markets.
After the completion of this offering, we expect that CD&R Allied Holdings, L.P., the “CD&R Investor” or the “selling stockholder,” which is owned by investment funds managed by, or affiliated with, CD&R, will hold approximately % of our common stock. As a result, we expect to qualify as and elect to be a “controlled company” within the meaning of the NYSE rules following the completion of this offering. This election will allow us to rely on exemptions from certain corporate governance requirements otherwise applicable to NYSE -listed companies. See “Management—Corporate Governance.”
8
Table of Contents
The following chart illustrates our ownership and organizational structure, after giving effect to this offering, assuming the underwriters do not exercise their option to purchase additional shares from the selling stockholder:
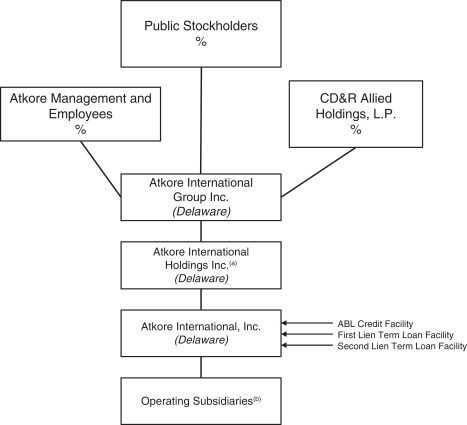
| (a) | Guarantor of AII’s (i) asset-based credit facility, or the “ABL Credit Facility,” (ii) first lien term loan facility, or the “First Lien Term Loan Facility,” (iii) second lien term loan facility, or the “Second Lien Term Loan Facility,” and together with the First Lien Term Loan Facility, the “Term Loan Facilities,” and together with the ABL Credit Facility, the “Credit Facilities.” See “Description of Certain Indebtedness.” |
| (b) | Domestic operating subsidiaries are guarantors of the Credit Facilities. See “Description of Certain Indebtedness.” |
Risks Related to Our Business
Our business is subject to a number of risks, including risks that may prevent us from achieving our business objectives or may adversely affect our business, financial condition, results of operations, cash flows and prospects that you should consider before making a decision to invest in our common stock. These risks are discussed more fully in “Risk Factors” in this prospectus. These risks include, but are not limited to, the following:
| • | the effect of general business and economic conditions; |
| • | another downturn in the non-residential construction industry; |
| • | fluctuations in the prices of raw materials on which we depend in our production process; |
9
Table of Contents
| • | the availability and cost of freight and energy; |
| • | the level of similar product imports into the United States; |
| • | regulatory changes that may affect demand for our products; |
| • | our indebtedness may adversely affect our financial health; |
| • | our ability to service our debt and to refinance all or a portion of our indebtedness; |
| • | securities or industry analysts may not publish research or may publish misleading or unfavorable research about our business; |
| • | fulfilling our obligations incident to being a public company; and |
| • | other factors set forth under the caption “Risk Factors” in this prospectus. |
Our Corporate Information
Atkore International Group Inc. is a Delaware corporation. Our principal executive offices are located at 16100 South Lathrop Avenue, Harvey, Illinois 60426, and our telephone number is (708) 339-1610. Our website is www.atkore.com. None of the information contained on, or that may be accessed through, our website or any other website identified herein is part of, or incorporated into, this prospectus.
10
Table of Contents
THE OFFERING
| Common stock offered by the selling stockholder |
shares. |
| Option to purchase additional shares |
The underwriters have a 30-day option to purchase up to an additional shares of common stock from the selling stockholder at the initial public offering price, less underwriting discounts and commissions. |
| Common stock to be outstanding after this offering |
shares. |
| Use of proceeds |
We will not receive any proceeds from the sale of our common stock by the selling stockholder in this offering. |
| Principal stockholder |
Upon completion of this offering, the CD&R Investor will control a majority of our outstanding common stock. Accordingly, we expect to qualify as a “controlled company” within the meaning of the NYSE corporate governance standards. |
| Dividend policy |
We do not currently anticipate paying dividends on our common stock for the foreseeable future. Any future determination to pay dividends on our common stock will be subject to the discretion of our board of directors and depend upon various factors. See “Dividend Policy.” |
| Risk factors |
Investing in our common stock involves a high degree of risk. See “Risk Factors” beginning on page 17 of this prospectus. |
| Proposed NYSE symbol |
“ATKR”. |
The number of shares of our common stock to be outstanding immediately following this offering is based on shares outstanding as of , 2016, and excludes:
| • | shares of common stock issuable upon exercise of options outstanding as of , 2016 at a weighted average exercise price of $ per share; and |
| • | shares of common stock reserved for future issuance following the completion of this offering under our equity plans. |
Unless otherwise indicated, all information in this prospectus:
| • | gives effect to a -for- stock split on our common stock effected on , 2016; |
| • | assumes no exercise by the underwriters of their option to purchase additional shares from the selling stockholder; |
| • | assumes that the initial public offering price of our common stock will be $ per share (which is the midpoint of the price range set forth on the cover page of this prospectus); and |
| • | gives effect to amendments to our amended and restated certificate of incorporation and amended and restated by-laws to be adopted prior to the completion of this offering. |
11
Table of Contents
SUMMARY HISTORICAL CONSOLIDATED FINANCIAL DATA
The following tables set forth our summary historical consolidated financial data derived from our consolidated financial statements as of the dates and for each of the periods indicated. The summary historical balance sheet data as of September 25, 2015 and September 26, 2014 and the summary historical statement of operations data for the years ended September 25, 2015, September 26, 2014 and September 27, 2013 are derived from our audited consolidated financial statements and related notes included elsewhere in this prospectus. The summary historical balance sheet data as of September 27, 2013 is derived from our unaudited consolidated financial statements and related notes not included elsewhere in this prospectus. The summary historical statement of operations data for the six months ended March 25, 2016 and for the six months ended March 27, 2015 and the summary historical balance sheet data as of March 25, 2016 and March 27, 2015 are derived from our unaudited condensed consolidated financial statements included elsewhere in this prospectus. The summary historical statement of operations data for the six months ended March 28, 2014 and the summary historical balance sheet data as of March 28, 2014 are derived from our unaudited condensed consolidated financial statements not included elsewhere in this prospectus. The summary historical statement of operations data, cash flow data and other financial data for the twelve months ended March 25, 2016 are calculated as fiscal year ended September 25, 2015 less six months ended March 27, 2015 plus six months ended March 25, 2016. The summary historical statement of operations data, cash flow data and other financial data for the twelve months ended March 27, 2015 are calculated as fiscal year ended September 26, 2014 less six months ended March 28, 2014 plus six months ended March 27, 2015. Our historical results are not necessarily indicative of the results to be expected for any future period.
12
Table of Contents
You should read this summary historical consolidated financial data in conjunction with the sections entitled “Selected Historical Consolidated Financial Data” and “Management’s Discussion and Analysis of Financial Condition and Results of Operations” and our consolidated financial statements and related notes, included elsewhere in this prospectus.
| Twelve Months Ended | Six Months Ended | Fiscal Year Ended | ||||||||||||||||||||||||||||||
| (in thousands, except per share data) |
March 25, 2016 |
March 27, 2015(1) |
March 25, 2016 |
March 27, 2015(1) |
March 28, 2014(2) |
September 25, 2015(1) |
September 26, 2014(2) |
September 27, 2013(3) |
||||||||||||||||||||||||
| Statement of Operations Data: |
||||||||||||||||||||||||||||||||
| Net sales |
$1,581,602 | $ | 1,759,223 | $ | 711,421 | $ | 858,987 | $ | 802,602 | $ | 1,729,168 | $ | 1,702,838 | $ | 1,475,897 | |||||||||||||||||
| Cost of sales |
1,268,201 | 1,521,794 | 547,602 | 735,776 | 689,710 | 1,456,375 | 1,475,728 | 1,264,348 | ||||||||||||||||||||||||
|
|
|
|
|
|
|
|
|
|
|
|
|
|
|
|
|
|||||||||||||||||
| Gross profit |
313,401 | 237,429 | 163,819 | 123,211 | 112,892 | 272,793 | 227,110 | 211,549 | ||||||||||||||||||||||||
| Selling, general and administrative |
199,056 | 178,072 | 98,020 | 84,779 | 87,533 | 185,815 | 180,783 | 160,749 | ||||||||||||||||||||||||
| Intangible asset amortization |
22,666 | 20,976 | 11,089 | 10,526 | 10,407 | 22,103 | 20,857 | 15,317 | ||||||||||||||||||||||||
| Asset impairment charges(4) |
27,937 | 44,381 | — | — | — | 27,937 | 44,424 | 9,161 | ||||||||||||||||||||||||
|
|
|
|
|
|
|
|
|
|
|
|
|
|
|
|
|
|||||||||||||||||
| Operating income (loss) |
63,742 | (6,000 | ) | 54,710 | 27,906 | 14,952 | 36,938 | (18,954 | ) | 26,322 | ||||||||||||||||||||||
| Interest expense, net |
42,845 | 43,286 | 20,448 | 22,412 | 23,392 | 44,809 | 44,266 | 47,869 | ||||||||||||||||||||||||
| (Gain) loss on extinguishment of debt(5) |
(1,661) | 40,913 | (1,661 | ) | — | 2,754 | — | 43,667 | — | |||||||||||||||||||||||
|
|
|
|
|
|
|
|
|
|
|
|
|
|
|
|
|
|||||||||||||||||
| Income (loss) from operations before income taxes |
22,558 | (90,199 | ) | 35,923 | 5,494 | (11,194 | ) | (7,871 | ) | (106,887 | ) | (21,547 | ) | |||||||||||||||||||
| Income tax expense (benefit) |
7,972 | (30,558 | ) | 13,344 | 2,456 | 75 | (2,916 | ) | (32,939 | ) | (2,966 | ) | ||||||||||||||||||||
|
|
|
|
|
|
|
|
|
|
|
|
|
|
|
|
|
|||||||||||||||||
| Income (loss) from continuing operations |
14,586 | (59,641 | ) | 22,579 | 3,038 | (11,269) | (4,955 | ) | (73,948 | ) | (18,581 | ) | ||||||||||||||||||||
| Loss from discontinued |
— | — | — | — | — | — | — | (42,654 | ) | |||||||||||||||||||||||
| (Expense) benefit for income taxes |
— | — | — | — | — | — | — | (2,791 | ) | |||||||||||||||||||||||
|
|
|
|
|
|
|
|
|
|
|
|
|
|
|
|
|
|||||||||||||||||
| Net income (loss) |
$ | 14,586 | $ | (59,641 | ) | $ | 22,579 | $ | 3,038 | $ | (11,269 | ) | $ | (4,955 | ) | $ | (73,948 | ) | $ | (61,235 | ) | |||||||||||
|
|
|
|
|
|
|
|
|
|
|
|
|
|
|
|
|
|||||||||||||||||
| Convertible preferred stock and dividends |
— | 3,259 | — | — | 25,796 | — | 29,055 | 47,234 | ||||||||||||||||||||||||
| Net income (loss) attributable to common stockholders |
14,586 | (62,900 | ) | 22,579 | 3,038 | (37,065 | ) | (4,955 | ) | (103,003 | ) | (108,469 | ) | |||||||||||||||||||
| Weighted average shares outstanding: |
||||||||||||||||||||||||||||||||
| Basic |
45,619 | 45,162 | 45,653 | 45,648 | 43,184 | 45,640 | 37,225 | 29,740 | ||||||||||||||||||||||||
| Diluted |
45,619 | 45,162 | 45,653 | 45,648 | 43,184 | 45,640 | 37,225 | 29,740 | ||||||||||||||||||||||||
| Net income (loss) per share: |
||||||||||||||||||||||||||||||||
| Basic |
$ | 0.32 | $ | (1.39 | ) | $ | 0.49 | $ | 0.07 | $ | (0.86 | ) | $ | (0.11 | ) | $ | (2.77 | ) | $ | (3.65 | ) | |||||||||||
| Diluted |
$ | 0.32 | $ | (1.39 | ) | $ | 0.49 | $ | 0.07 | $ | (0.86 | ) | $ | (0.11 | ) | $ | (2.77 | ) | $ | (3.65 | ) | |||||||||||
| Balance Sheet Data (at end of period): |
||||||||||||||||||||||||||||||||
| Cash and cash equivalents |
$ | 134,477 | $ | 24,608 | $ | 134,477 | $ | 24,608 | $ | 28,771 | $ | 80,598 | $ | 33,360 | $ | 54,770 | ||||||||||||||||
| Total assets |
1,118,605 | 1,237,592 | 1,118,605 | 1,237,592 | 1,282,407 | 1,113,799 | 1,185,419 | 1,272,195 | ||||||||||||||||||||||||
| Long-term debt, including current maturities |
632,250 | 728,191 | 632,250 | 728,191 | 464,266 | 652,208 | 692,867 | 451,297 | ||||||||||||||||||||||||
| Cumulative convertible preferred stock |
— | — | — | — | 449,371 | — | — | 423,576 | ||||||||||||||||||||||||
| Total equity |
179,207 | 177,681 | 179,207 | 177,681 | 499,799 | 156,277 | 176,469 | 510,377 | ||||||||||||||||||||||||
| Cash Flow Data: |
||||||||||||||||||||||||||||||||
| Cash flows provided by (used in): |
||||||||||||||||||||||||||||||||
| Operating activities |
$ | 223,303 | $ | 83,789 | $ | 82,157 | $ | (73 | ) | $ | 2,471 | $ | 141,073 | $ | 86,333 | $ | 35,424 | |||||||||||||||
| Investing activities |
(14,700 | ) | (52,548 | ) | (8,511 | ) | (40,452 | ) | (36,764 | ) | (46,641 | ) | (48,860 | ) | (87,252 | ) | ||||||||||||||||
| Financing activities |
(97,451 | ) | 3,453 | (19,973 | ) | 33,372 | 8,509 | (44,106 | ) | (57,584 | ) | 55,823 | ||||||||||||||||||||
| Other Financial Data: |
||||||||||||||||||||||||||||||||
| Adjusted net sales(7) |
$ | 1,487,055 | $ | 1,565,225 | $ | 703,605 | $ | 767,125 | $ | 712,050 | $ | 1,550,575 | $ | 1,510,150 | $ | 1,277,175 | ||||||||||||||||
| Adjusted EBITDA(8) |
207,101 | 130,244 | 106,414 | 63,263 | 59,616 | 163,950 | 126,597 | 111,559 | ||||||||||||||||||||||||
| Adjusted EBITDA Margin(8) |
13.9 | % | 8.3 | % | 15.1 | % | 8.2 | % | 8.4 | % | 10.6 | % | 8.4 | % | 8.7 | % | ||||||||||||||||
| Capital expenditures |
23,316 | 25,927 | 9,014 | 12,547 | 10,341 | 26,849 | 24,362 | 14,999 | ||||||||||||||||||||||||
| (1) | Includes results of operations of American Pipe & Plastics, Inc., or “APPI,” and Steel Components, Inc., or “SCI,” from October 20, 2014 and November 17, 2014, respectively. |
| (2) | Includes results of operations of EP Lenders II, LLC, or “Ridgeline,” from October 11, 2013. |
| (3) | Includes results of operations of Heritage Plastics, Inc., Heritage Plastics Central, Inc. and Heritage Plastics West, Inc., collectively “Heritage Plastics” and Liberty Plastics, LLC, or “Liberty Plastics,” from September 17, 2013. |
| (4) | We recorded asset impairments of $27.9 million for fiscal 2015, of which $24.0 million relates to long-lived assets from the closure of a Philadelphia, Pennsylvania manufacturing facility. We announced our planned exit from our Fence and Sprinkler steel pipe and tube product lines, or “Fence and Sprinkler,” and the closure of a Philadelphia, Pennsylvania manufacturing facility, in August 2015. The remaining $3.9 million represents impairment of goodwill from our SCI acquisition, which is part of our Electrical Raceway |
13
Table of Contents
| reportable segment. We recorded asset impairments of $44.4 million for fiscal 2014, of which $43.0 million represents goodwill impairment from a reporting unit within our MP&S reportable segment. The remaining $1.4 million primarily represents a $0.9 million impairment of trade names of our Razor Ribbon and Columbia MBF commercial businesses. We recorded asset impairments of $9.2 million for fiscal 2013, which includes $5.9 million to adjust the carrying value of several held-for-sale facilities recorded at fair value. The remaining $3.3 million represents a write-down of property, plant and equipment of our Acroba business located in France. |
| (5) | Incurred in connection with the redemption in fiscal 2014 of AII’s 9.875% Senior Secured Notes due 2018, or the “Senior Notes.” See Note 8 to our audited consolidated financial statements included elsewhere in this prospectus for further detail. |
| (6) | We divested our business in Brazil during fiscal 2013, which was reported as a discontinued operation. See Note 18 to our audited consolidated financial statements included elsewhere in this prospectus for further detail. |
| (7) | We present Adjusted net sales to facilitate comparisons of reported net sales from period to period. In August 2015, we announced plans to exit Fence and Sprinkler in order to re-align our long-term strategic focus. We define Adjusted net sales as reported net sales excluding net sales directly attributable to Fence and Sprinkler. Adjusted net sales has limitations as an analytical tool, and should not be considered in isolation or as an alternative to measures based on accounting principles generally accepted in the United States of America, or “GAAP,” such as net sales or other financial statement data presented in our consolidated financial statements as an indicator of revenue. Because Adjusted net sales is not a measure determined in accordance with GAAP and is susceptible to varying calculations, Adjusted net sales, as presented, may not be comparable to other similarly titled measures of other companies. |
The following table sets forth a reconciliation of net sales to Adjusted net sales for the periods presented, as well as the three months ended March 25, 2016 and March 27, 2015:
| Twelve Months Ended | Six Months Ended | Three Months Ended | Fiscal Year Ended | |||||||||||||||||||||||||||||||||||||
| ($ in thousands) |
March 25, 2016 |
March 27, 2015 |
March 25, 2016 |
March 27, 2015 |
March 28, 2014 |
March 25, 2016 |
March 27, 2015 |
September 25, 2015 |
September 26, 2014 |
September 27, 2013 |
||||||||||||||||||||||||||||||
| Net sales |
$ | 1,581,602 | $ | 1,759,223 | $ | 711,421 | $ | 858,987 | $ | 802,602 | $ | 353,046 | $ | 432,586 | $ | 1,729,168 | $ | 1,702,838 | $ | 1,475,897 | ||||||||||||||||||||
| Impact of Fence and Sprinkler exit |
(94,547 | ) | (193,998 | ) | (7,816 | ) | (91,862 | ) | (90,552 | ) | — | (45,811 | ) | (178,593 | ) | (192,688 | ) | (198,722 | ) | |||||||||||||||||||||
|
|
|
|
|
|
|
|
|
|
|
|
|
|
|
|
|
|
|
|
|
|||||||||||||||||||||
| Adjusted net sales |
$ | 1,487,055 | $ | 1,565,225 | $ | 703,605 | $ | 767,125 | $ | 712,050 | $ | 353,046 | $ | 386,775 | $ | 1,550,575 | $ | 1,510,150 | $ | 1,277,175 | ||||||||||||||||||||
|
|
|
|
|
|
|
|
|
|
|
|
|
|
|
|
|
|
|
|
|
|||||||||||||||||||||
The following table sets forth a reconciliation of net sales to Adjusted net sales by segment for LTM March 2016 and LTM March 2015:
| Twelve Months Ended | ||||||||||||||||
| ($ in thousands) |
March 25, 2016 | March 27, 2015 | ||||||||||||||
| Electrical Raceway | MP&S | Electrical Raceway | MP&S | |||||||||||||
| Net sales |
$ | 961,362 | $ | 621,761 | $ | 1,014,580 | $ | 745,549 | ||||||||
| Impact of Fence and Sprinkler exit |
— | (94,547 | ) | — | (193,998 | ) | ||||||||||
|
|
|
|
|
|
|
|
|
|||||||||
| Adjusted net sales |
$ | 961,362 | $ | 527,214 | $ | 1,014,580 | $ | 551,551 | ||||||||
|
|
|
|
|
|
|
|
|
|||||||||
| (8) | We define Adjusted EBITDA as net income (loss) before: loss from discontinued operations (net of income tax), depreciation and amortization, loss on extinguishment of debt, interest expense (net), income tax expense (benefit), restructuring and impairments, net periodic pension benefit cost, stock-based compensation, impact from anti-microbial coated sprinkler pipe, or “ABF,” product liability, consulting fees, multi-employer pension withdrawal, transaction costs, other items, and the impact from our Fence and Sprinkler exit. We believe Adjusted EBITDA, when presented in conjunction with comparable GAAP measures, is useful for investors because management uses Adjusted EBITDA in evaluating the performance of our business. |
We define Adjusted EBITDA Margin as Adjusted EBITDA as a percentage of Adjusted net sales. We use Adjusted EBITDA in the preparation of our annual operating budgets and as an indicator of business performance. We believe Adjusted EBITDA allows us to readily view operating trends, perform analytical comparisons and identify strategies to improve operating performance. Adjusted EBITDA is not considered a measure of financial performance under GAAP and the items excluded therefrom are significant components in understanding and assessing our financial performance. Adjusted EBITDA has limitations as an analytical tool, and should not be considered in isolation or as an alternative to such GAAP measures as net income (loss), cash flows provided by or used in operating, investing or financing activities or other financial statement data presented in our consolidated financial statements as an indicator of financial performance or liquidity. Some of these limitations are:
| • | Adjusted EBITDA does not reflect changes in, or cash requirements for, working capital needs; |
14
Table of Contents
| • | Adjusted EBITDA does not reflect interest expense, or the requirements necessary to service interest or principal payments on debt; |
| • | Adjusted EBITDA does not reflect income tax expense (benefit) or the cash requirements to pay taxes; |
| • | Adjusted EBITDA does not reflect historical cash expenditures or future requirements for capital expenditures or contractual commitments; and |
| • | although depreciation and amortization charges are non-cash charges, the assets being depreciated and amortized will often have to be replaced in the future, and Adjusted EBITDA does not reflect any cash requirements for such replacements. |
Because Adjusted EBITDA is not a measure determined in accordance with GAAP and is susceptible to varying calculations, Adjusted EBITDA, as presented, may not be comparable to other similarly titled measures of other companies.
The following table sets forth a reconciliation of net income (loss) to Adjusted EBITDA for the periods presented, as well as the three months ended March 25, 2016 and March 27, 2015:
| ($ in thousands) |
Twelve Months Ended |
Six Months Ended | Three Months Ended |
Fiscal Year Ended | ||||||||||||||||||||||||||||||||||||
| March 25, 2016 |
March 27, 2015 |
March 25, 2016 |
March 27, 2015 |
March 28, 2014 |
March 25, 2016 |
March 27, 2015 |
September 25, 2015 |
September 26, 2014 |
September 27, 2013 |
|||||||||||||||||||||||||||||||
| Net income (loss) |
$14,586 | $ | (59,641 | ) | $ | 22,579 | $ | 3,038 | $ | (11,269 | ) | 14,007 | 5,800 | $ | (4,955 | ) | $ | (73,948 | ) | $ | (61,235 | ) | ||||||||||||||||||
| Loss from discontinued operations, net of income tax expense |
— | — | — | — | — | — | — | — | — | 42,654 | ||||||||||||||||||||||||||||||
| Depreciation and amortization |
57,183 | 58,568 | 26,742 | 29,024 | 29,151 | 13,249 | 14,308 | 59,465 | 58,695 | 48,412 | ||||||||||||||||||||||||||||||
| (Gain) loss on extinguishment of debt |
(1,661 | ) | 40,913 | (1,661 | ) | — | 2,754 | (1,661 | ) | — | — | 43,667 | — | |||||||||||||||||||||||||||
| Interest expense, net |
42,845 | 43,286 | 20,448 | 22,412 | 23,392 | 10,567 | 11,483 | 44,809 | 44,266 | 47,869 | ||||||||||||||||||||||||||||||
| Income tax expense (benefit) |
7,972 | (30,558 | ) | 13,344 | 2,456 | 75 | 8,746 | 2,809 | (2,916 | ) | (32,939 | ) | (2,966 | ) | ||||||||||||||||||||||||||
| Restructuring and impairments (a) |
34,605 | 46,597 | 2,069 | 167 | 258 | 775 | 154 | 32,703 | 46,687 | 10,931 | ||||||||||||||||||||||||||||||
| Net periodic pension benefit cost (b) |
509 | 973 | 220 | 289 | 684 | 110 | 144 | 578 | 1,368 | 3,371 | ||||||||||||||||||||||||||||||
| Stock-based compensation (c) |
23,765 | 8,800 | 12,043 | 1,801 | 1,398 | 9,998 | 377 | 13,523 | 8,398 | 2,199 | ||||||||||||||||||||||||||||||
| ABF product liability impact (d) |
(913) | 2,833 | 425 | 1,122 | 1,130 | 213 | 561 | (216 | ) | 2,841 | 1,383 | |||||||||||||||||||||||||||||
| Consulting fee (e) |
3,500 | 3,604 | 1,750 | 1,750 | 3,000 | 875 | 875 | 3,500 | 4,854 | 6,000 | ||||||||||||||||||||||||||||||
| Multi-employer pension withdrawal (f) |
— | — | — | — | — | — | — | — | — | 7,290 | ||||||||||||||||||||||||||||||
| Transaction costs (g) |
8,316 | 2,975 | 3,431 | 1,154 | 3,228 | 2,776 | 637 | 6,039 | 5,049 | 1,780 | ||||||||||||||||||||||||||||||
| Other (h) |
16,748 | 11,422 | 4,213 | 1,770 | 3,004 | (1,294 | ) | 499 | 14,305 | 12,656 | 7,685 | |||||||||||||||||||||||||||||
| Impact of Fence and Sprinkler (i) |
(354 | ) | 472 | 811 | (1,720 | ) | 2,811 | — | (1,534 | ) | (2,885 | ) | 5,003 | (3,814 | ) | |||||||||||||||||||||||||
|
|
|
|
|
|
|
|
|
|
|
|
|
|
|
|
|
|
|
|
|
|
||||||||||||||||||||
| Adjusted EBITDA |
$ | 207,101 | $ | 130,244 | $ | 106,414 | $ | 63,263 | $ | 59,616 | $ | 58,361 | $ | 36,113 | $ | 163,950 | $ | 126,597 | $ | 111,559 | ||||||||||||||||||||
|
|
|
|
|
|
|
|
|
|
|
|
|
|
|
|
|
|
|
|
|
|
||||||||||||||||||||
| (a) | Restructuring amounts represent exit or disposal costs including termination benefits and facility closure costs. Impairment amounts represent write-downs of goodwill, intangible assets and/or long-lived assets. See Notes 6 and 15 to our audited consolidated financial statements and Notes 6 and 14 to our unaudited condensed consolidated financial statements included elsewhere in this prospectus for further detail. |
| (b) | Represents pension costs in excess of cash funding for pension obligations in the period. See Note 10 to our audited consolidated financial statements and Note 10 to our unaudited condensed consolidated statements included elsewhere in this prospectus in further detail. |
| (c) | Represents stock-based compensation expenses related to options awards and restricted stock units. See Note 13 to our audited consolidated financial statements and Note 12 to our unaudited condensed consolidated financial statements included elsewhere in this prospectus for further detail. |
| (d) | Represents changes in our estimated exposure to ABF matters. See Note 16 to our audited consolidated financial statements and Note 15 to our unaudited condensed consolidated financial statements included elsewhere in this prospectus for further detail. |
| (e) | Represents amounts paid to CD&R and, until April 9, 2014, to Tyco. In connection with this offering, we expect to enter into a termination agreement with CD&R, pursuant to which the parties will agree to terminate this consulting fee. See “Certain Relationships and Related Party Transactions—Consulting Agreement.” See Note 3 to our audited consolidated financial statements and Note 3 to our unaudited condensed consolidated financial statements included elsewhere in this prospectus for further detail. |
| (f) | Represents our proportional share of a multi-employer pension liability from which we withdrew in fiscal 2013. See Note 10 to our audited financial statements included elsewhere in this prospectus for further detail. |
| (g) | Represents expenses associated with acquisition and divestiture-related activities. |
15
Table of Contents
| (h) | Represents other items, such as lower-of-cost-or-market inventory adjustments and the impact of foreign exchange gains or losses related to our divestiture in Brazil. |
| (i) | Represents historical performance of Fence and Sprinkler and related operating costs. |
The following table sets forth a reconciliation of segment Adjusted EBITDA for the fiscal year ended September 25, 2015 to segment Adjusted EBITDA for LTM March 2016:
| ($ in thousands) |
Electrical Raceway |
Mechanical Products & Solutions |
||||||
| Fiscal Year Ended September 25, 2015 |
$ | 106,717 | $ | 79,553 | ||||
| Six Months Ended March 25, 2016 |
76,619 | 41,701 | ||||||
|
|
|
|
|
|||||
| 183,336 | 121,254 | |||||||
| Less: Six Months Ended March 27, 2015 |
42,680 | 30,556 | ||||||
|
|
|
|
|
|||||
| Twelve Months Ended March 25, 2016 |
$ | 140,656 | $ | 90,698 | ||||
|
|
|
|
|
|||||
For further information with respect to segment Adjusted EBITDA, see Note 19 to our audited consolidated financial statements and Note 18 to our unaudited condensed consolidated financial statements included elsewhere in this prospectus.
16
Table of Contents
Investing in our common stock involves a high degree of risk. You should consider and read carefully all of the risks and uncertainties described below, as well as other information contained in this prospectus, including our consolidated financial statements and related notes included elsewhere in this prospectus, before making an investment decision. The risks described below are not the only ones facing us. The occurrence of any of, or a combination of, the following risks or additional risks and uncertainties not presently known to us or that we currently believe to be immaterial could materially and adversely affect our business, financial position, results of operations or cash flows. In any such case, the trading price of our common stock could decline, and you may lose all or part of your investment. This prospectus also contains forward-looking statements and estimates that involve risks and uncertainties. Our actual results could differ materially from those anticipated in the forward-looking statements as a result of specific factors, including the risks and uncertainties described below.
Risks Related to Our Business
Our business is affected by general business and economic conditions, which could materially and adversely affect our business, financial position, results of operations or cash flows.
Demand for our products is affected by a number of general business and economic conditions. A decline in the U.S. and international markets in which we operate could materially and adversely affect our business, financial position, results of operations or cash flows. Our profit margins, as well as overall demand for our products, could decline as a result of a large number of factors beyond our control, including economic recessions, changes in end-user preferences, consumer confidence, inflation, availability of credit, fluctuation in interest and currency exchange rates and changes in the fiscal or monetary policies of governments in the regions in which we operate.
During the most recent U.S. economic recession, which began in the second half of 2007 and continued through 2011, demand for our products declined significantly. Another economic downturn in any of the markets we serve may result in a reduction of sales and pricing for our products. If the creditworthiness of our customers declines, we could face increased credit risk and some, or many, of our customers may not be able to pay us amounts when they become due. While the U.S. recession that began in 2007 has ended and there has been growth in the U.S. construction markets that we serve, there can be no assurance that any improvement will be sustained or continue.
We cannot predict the duration of current economic conditions, or the timing or strength of any future recovery of activities in our markets. Weakness in the markets in which we operate could have a material adverse effect on our business, financial condition, results of operations or cash flows. We may have to close underperforming facilities from time to time as warranted by general economic conditions and/or weakness in the markets in which we operate. In addition to a reduction in demand for our products, these factors may also reduce the price we are able to charge for our products. This, combined with an increase in excess capacity, could negatively impact our business, financial condition, results of operations or cash flows.
The non-residential construction industry accounts for a significant portion of our business, and the U.S. non-residential construction industry in recent years experienced a significant downturn followed by a slow recovery. Another downturn could materially and adversely affect our business, financial position, results of operations or cash flows.
Our business is largely dependent on the non-residential construction industry. Approximately 40% and 37% of our net sales and Adjusted net sales in fiscal 2015, respectively, were directly related to U.S. new non-residential construction. For new construction, we estimate that our product installation typically lags U.S. non-residential starts by six to twelve months. The U.S. non-residential construction industry is cyclical, with product demand based on numerous factors such as availability of credit, interest rates, general economic conditions, consumer confidence and other factors that are beyond our control. U.S. non-residential construction starts, as
17
Table of Contents
reported by Dodge reached a historic low of 680 million square feet in 2010 and increased to 942 million square feet in 2015, which remains well below historical levels. We expect to capitalize on any recovery in non-residential construction activity over the coming years and potentially drive higher margins by leveraging the scalability of our operations.
From time to time we have been adversely affected in various parts of the country by declines in non-residential building construction starts due to, among other things, changes in tax laws affecting the real estate industry, high interest rates and the level of non-residential construction activity. Continued uncertainty about current economic conditions will continue to pose a risk to our business, financial position, results of operations and cash flows, as participants in this industry may postpone spending in response to tighter credit, negative financial news and/or declines in income or asset values, which could have a continued material negative effect on the demand for our products.
The raw materials on which we depend in our production process may be subject to price increases which we may not be able to pass through to our customers, or to price decreases which may decrease the price levels of our products. As a result, such price fluctuations could materially and adversely affect our business, financial position, results of operations or cash flows.
Our results of operations are impacted by changes in commodity prices, primarily steel, copper and PVC resin. Historically, we have not engaged in material hedging strategies for raw material purchases. Substantially all of the products we sell (such as steel conduit, tubing and framing, copper wiring in our cables, and PVC conduit) are subject to price fluctuations because they are composed primarily of steel, copper or PVC resin, three industrial commodities that are subject to price volatility. This volatility can significantly affect our gross profit. We also watch the market trends of certain other commodities, such as zinc (used in the galvanization process for a number of our products), electricity, natural gas and diesel fuel, as such commodities can be important to us as they impact our cost of sales, both directly through our plant operations and indirectly through transportation and freight expense.
Although we seek to recover increases in raw material prices through price increases in our products, we have not always been completely successful. In addition, in periods of declining prices for our raw materials we may face pricing pressure from our customers. We generally sell our products on a spot basis (and not under long-term contracts). Any increase in raw material prices that is not offset by an increase in our prices, or our inability to maintain price levels in an environment of declining raw material prices, could materially and adversely affect our business, financial position, results of operations or cash flows.
We operate in a competitive landscape, and increased competition could materially and adversely affect our business, financial position, results of operations or cash flows.
The principal markets that we serve are highly competitive. Competition is based primarily on product offering, product innovation, quality, service and price. Our principal competitors range from national manufacturers to smaller regional manufacturers and differ by each of our product lines. See “Business—Competition.” Some of our competitors may have greater financial and other resources than we do and some may have more established brand names in the markets we serve. The actions of our competitors may encourage us to lower our prices or to offer additional services or enhanced products at a higher cost to us, which could reduce our gross profit, net income, and cash flow or may cause us to lose market share. Any of these consequences could materially and adversely affect our business, financial position, results of operations or cash flows.
Our operating results are sensitive to the availability and cost of freight and energy, such as diesel fuel and electricity, which are important in the manufacture and transport of our products.
Our operating costs increase when freight or energy costs rise. During periods of increasing freight and energy costs, we might not be able to fully recover our operating cost increases through price increases without
18
Table of Contents
reducing demand for our products. The cost of fuel is largely unpredictable and has fluctuated significantly in recent years, reaching historically high levels at times. Fuel availability, as well as pricing, is also impacted by political and economic factors that are beyond our control.
In addition, we are dependent on third-party freight carriers to transport many of our products. Our access to third-party freight carriers is not guaranteed, and we may be unable to transport our products at economically attractive rates in certain circumstances, particularly in cases of adverse market conditions or disruptions to transportation infrastructure. Similarly, increasing energy costs, in particular, the cost of diesel fuel, could put a strain on the transportation of materials and products if it forces certain transporters to close. Our business, financial position, results of operations or cash flows could be materially and adversely affected if we are unable to pass all of the cost increases on to our customers, if we are unable to obtain the necessary energy supplies or if freight carrier capacity in our geographic markets were to decline significantly or otherwise become unavailable.
Our business, financial position, results of operations or cash flows could be materially and adversely affected by the level of similar product imports into the United States.
A substantial portion of our revenue is generated through our operations in the United States. Although we have not been substantially impacted by imports historically, imports of products similar to those manufactured by us may reduce the volume of products sold by domestic producers and depress the selling prices of our products and those of our competitors.
We believe import levels are affected by, among other things, overall worldwide product demand, the trade practices of foreign governments, the cost of freight, the challenges involved in shipping, government subsidies to foreign producers and governmentally imposed trade restrictions in the United States. Increased imports of products similar to those manufactured by us in the United States could materially and adversely affect our business, financial position, results of operations or cash flows.
We are indirectly subject to regulatory changes that may affect demand for our products.
The market for certain of our products is influenced by federal, state, local and international governmental regulations and trade policies (such as the American Recovery and Reinvestment Act of 2009, Underwriters Laboratories, National Electric Code and American Society of Mechanical Engineers) as well as other policies, including those imposed on the non-residential construction industry (such as the National Electrical Code and corresponding state and local laws based on the National Electrical Code). These regulations and policies are subject to change. In the event that there would be changes in the National Electrical Code and any similar state, local or non-U.S. laws, including changes that would allow for alternative products to be used in the non-residential construction industry or that would render less restrictive or otherwise reduce the current requirements under such laws and regulations, the scope of products that would serve as alternatives to products we produce would increase. As a result, competition in the industries in which we operate could increase, with a potential corresponding decrease in the demand for our products. In addition, in the event that changes in such laws would render current requirements more restrictive, we may be required to change our products or production processes to meet such increased restrictions, which could result in increased costs and cause us to lose market share. Any changes to such regulations, laws and policies could materially and adversely affect our business, financial position, results of operations or cash flows.
Our results of operations could be adversely affected by weather.
Although weather patterns affect our operating results throughout the year, adverse weather historically has reduced construction activity in our first and second fiscal quarters. In contrast, our highest volume of net sales historically has occurred in our third and fourth fiscal quarters.
Most of our business units experience seasonal variation as a result of the dependence of our customers on suitable weather to engage in construction projects. Generally, during the winter months, construction activity
19
Table of Contents
declines due to inclement weather, frozen ground and shorter daylight hours. For example, during the spring of 2013 and 2014, extremely cold weather significantly reduced the level of construction activities in the United States, thereby impacting our net sales. In addition, to the extent that hurricanes, severe storms, floods, other natural disasters or similar events occur in the geographic regions in which we operate, our results of operations may be adversely affected. We anticipate that fluctuations of our operation results from period to period due to seasonality will continue in the future.
We may need to raise additional capital, and we cannot be sure that additional financing will be available.
To satisfy existing obligations and support the development of our business, we depend on our ability to generate cash flow from operations and to borrow funds and issue securities in the capital markets. We may require additional financing for liquidity, capital requirements or growth initiatives. We may not be able to obtain financing on terms and at interest rates that are favorable to us or at all. Any inability by us to obtain financing in the future could materially and adversely affect our business, financial position, results of operations or cash flows.
We have incurred and continue to incur significant costs to comply with current and future environmental, health and safety laws and regulations, and our operations expose us to the risk of material environmental, health and safety liabilities and obligations.
We are subject to numerous federal, state, local and non-U.S. environmental, health and safety laws governing, among other things, the generation, use, storage, treatment, transportation, disposal and management of hazardous substances and wastes, emissions or discharges of pollutants or other substances into the environment, investigation and remediation of, and damages resulting from, releases of hazardous substances and the health and safety of our employees. We have incurred, and expect to continue to incur, capital expenditures in addition to ordinary course costs to comply with applicable current and future environmental, health and safety laws, such as those governing air emissions and wastewater discharges. In addition, governing agencies could impose conditions or other restrictions in our environmental permits which increase our costs. These laws are subject to change, which can be frequent and material. More stringent federal, state or local environmental rules or regulations could increase our operating costs and expenses. Furthermore, our operations are governed by the United States Occupational Safety and Health Administration, or “OSHA.” OSHA regulations may change in a way that increases our costs of operations. Our failure to comply with applicable environmental, health and safety laws and permit requirements could result in civil or criminal fines or penalties, enforcement actions, and regulatory or judicial orders enjoining or curtailing operations or requiring corrective measures such as the installation of pollution control equipment, which could materially and adversely affect our business, financial position, results of operations or cash flows.
From time to time, we may be held liable for the costs to address contamination at any real property we have ever owned, operated or used as a disposal site. We are currently, and may in the future be, required to investigate, remediate or otherwise address contamination at our current or former facilities. Many of our current and former facilities have a history of industrial usage for which additional investigation, remediation or other obligations could arise in the future and that could materially and adversely affect our business, financial position, results of operations or cash flows. For example, as we sell, close or otherwise dispose of facilities, we may need to address environmental issues at such sites, including any previously unknown contamination.
We could be subject to third-party claims for property damage, personal injury and nuisance or otherwise as a result of violations of, or liabilities under, environmental, health or safety laws or in connection with releases of hazardous or other materials at any current or former facility. We could also be subject to environmental indemnification or other claims in connection with assets and businesses that we have divested.
In 2007, the United States Supreme Court classified carbon dioxide as an air pollutant under the Clean Air Act in a case seeking to require the United States Environmental Protection Agency to regulate carbon dioxide in
20
Table of Contents
vehicle emissions. As issues relating to climate change have become more prevalent, foreign, federal, state and local governments have responded, and are expected to continue to respond, with increased legislation and regulation, including laws aimed at reducing emissions of greenhouse gases. Such legislation and regulation can negatively affect us by, among other things, requiring us to incur costs to upgrade our equipment.
We cannot assure you that any costs relating to future capital and operating expenditures to maintain compliance with environmental, health and safety laws, as well as costs to address contamination or environmental claims, will not exceed any current estimates or adversely affect our business, financial position, results of operations or cash flows. In addition, any unanticipated liabilities or obligations arising, for example, out of discovery of previously unknown conditions or changes in law or enforcement policies, could materially and adversely affect our business, financial position, results of operations or cash flows.
We rely on a few customers for a significant portion of our net sales, and the loss of those customers could materially and adversely affect our business, financial position, results of operations or cash flows.
Certain of our customers, in particular buying groups representing consortia of independent electrical distributors, national electrical distributors, OEMs including solar infrastructure OEMs, data centers and medical center general contractors are material to our business, financial position, results of operations and cash flows because they account for a significant portion of our net sales. In fiscal 2015, although our single largest customer accounted for approximately 5% of our net sales, our ten largest customers (including buyers and distributors in buying groups) accounted for approximately 32% of our net sales. Our percentage of sales to our major customers may increase if we are successful in pursuing our strategy of broadening the range of products we sell to existing customers. In such an event, or in the event of any consolidation in certain segments we serve, including retailers selling building products, our sales may be increasingly sensitive to deterioration in the financial condition of, or other adverse developments with respect to, one or more of our top customers. Our top customers may also be able to exert influences on us with respect to pricing, delivery, payment or other terms.
A significant asset included in our working capital is accounts receivable from customers. If customers responsible for a significant amount of accounts receivable become insolvent or otherwise unable to pay for products and services, or become unwilling or unable to make payments in a timely manner, our business, financial position, results of operations or cash flows could be materially and adversely affected. A significant deterioration in the economy could have an adverse effect on the servicing of these accounts receivable, which could result in longer payment cycles, increased collection costs and defaults in excess of management’s expectations. Deterioration in the credit quality of several major customers at the same time could materially and adversely affect our business, financial position, results of operations or cash flows.
In general, we do not have long-term contracts with our customers. As a result, although our customers periodically provide indications of their product needs and purchases, they generally purchase our products on an order-by-order basis, and the relationship, as well as particular orders, can be terminated at any time. The loss or bankruptcy of, or significant decrease in business from, any of our major customers could materially and adversely affect our business, financial position, results of operations or cash flows.
Our working capital requirements could result in us having lower cash available for, among other things, capital expenditures and acquisition financing.
Our working capital needs fluctuate based on economic activity and the market prices for our main raw materials, which are predominantly steel, copper and PVC resin. We require significant working capital to purchase these raw materials and sell our products efficiently and profitably to our customers. We are typically obligated to pay for our raw material purchases within 10 and 30 days of receipt, while we generally collect cash from the sale of manufactured products between 40 and 50 days from the point at which title and risk of loss transfers. If our working capital requirements increase and we are unable to finance our working capital on terms and conditions acceptable to us, we may not be able to obtain raw materials to respond to customer demand, which could result in a loss of sales.
21
Table of Contents
If our working capital needs increase, the amount of liquidity we have at our disposal to devote to other uses will decrease. A decrease in liquidity could, among other things, limit our flexibility, including our ability to make capital expenditures and to complete acquisitions that we have identified, thereby materially and adversely affecting our business, financial condition, results of operations and cash flows.
Work stoppages and other production disruptions may adversely affect our operations and impair our financial performance.
As of March 25, 2016, approximately 34% of our U.S. employees were represented with a collective bargaining agreement by labor unions. A work stoppage or other interruption of production could occur at our facilities as a result of disputes under existing collective bargaining agreements with labor unions or in connection with negotiations of new collective bargaining agreements, as a result of supplier financial distress, or for other reasons. For example, in the third quarter of fiscal 2014, in connection with labor negotiations, we experienced a week-long work stoppage at our Harvey, Illinois facility. In addition, we may encounter supplier constraints, be unable to maintain favorable supplier arrangements and relations or be affected by disruptions in the supply chain. A work stoppage or interruption of production at our facilities, due to labor disputes, shortages of supplies or any other reason could materially and adversely affect our business, financial position, results of operations or cash flows. See “Business—Employees.”
If we are unable to hire, engage and retain key personnel, our business, financial position, results of operations or cash flows could be materially and adversely affected.
We are dependent, in part, on our continued ability to hire, engage and retain key employees at our operations around the world. Additionally, we rely upon experienced managerial, marketing and support personnel to effectively manage our business and to successfully promote our wide range of products. If we do not succeed in engaging and retaining key employees and other personnel, we may be unable to meet our objectives and, as a result, our business, financial position, results of operations or cash flows could be materially and adversely affected.
We have financial obligations relating to pension plans that we maintain in the United States.
We provide pension benefits through a number of noncontributory and contributory defined benefit retirement plans covering eligible U.S. employees. As of September 25, 2015, we estimated that our pension plans were underfunded by approximately $28 million. The funded status represents five plans, four of which are frozen and do not accrue any additional service cost. The fifth plan will be frozen in our fiscal 2017. As such, the funded status is primarily impacted by the performance of the underlying assets supporting the plan and changes in interest rates or other factors, which may trigger additional cash contributions. Our pension obligation is calculated annually and is based on several assumptions, including then-prevailing conditions, which may change from year to year. If in any year our assumptions are inaccurate, we could be required to expend greater amounts than anticipated.
Unplanned outages at our facilities and other unforeseen disruptions could materially and adversely affect our business, financial position, results of operations or cash flows.
Our business depends on the operation of our manufacturing and distribution facilities. It is possible that we could experience prolonged periods of reduced production or distribution capacity due to interruptions in the operations of our facilities or those of our key suppliers. It is also possible that operations may be disrupted due to other unforeseen circumstances such as power outages, explosions, fires, floods, accidents and severe weather conditions. Availability of raw materials and delivery of products to customers could be affected by logistical disruptions. To the extent that lost production or distribution capacity could not be compensated for at unaffected facilities and depending on the length of the outage, our sales and production costs could be adversely affected.
22
Table of Contents
We rely on the efforts of agents and distributors to generate sales of our products.
We utilize various third-party agents and distributors to market, sell and distribute our products and to directly interface with our customers and end-users by providing customer service and support. No single agent or distributor accounts for a material percentage of our annual net sales. We do not have long-term contracts with our third-party agents and distributors, who could cease offering our products. In addition, many of our third-party agents and distributors with whom we transact business also offer the products of our competitors to our ultimate customers and they could begin offering our products with less prominence. The loss of a substantial number of our third-party agents or distributors or a dramatic deviation from the amount of sales they generate, including due to an increase in their sales of our competitors’ products, could reduce our sales and could materially and adversely affect our business, financial position, results of operations or cash flows.
Interruptions in the proper functioning of our information technology, or “IT” systems, including from cybersecurity threats, could disrupt operations and cause unanticipated increases in costs or decreases in revenues, or both.
We use our information systems to, among other things, manage our manufacturing operations, manage inventories and accounts receivable, make purchasing decisions and monitor our results of operations, and process, transmit and store sensitive electronic data, including employee, supplier and customer records. As a result, the proper functioning of our IT systems is critical to the successful operation of our business. Our information systems include proprietary systems developed and maintained by us. In addition, we depend on IT systems of third parties, such as suppliers, retailers and OEMs to, among other things, market and distribute our products, develop new products and services, operate our website, host and manage our services, store data, process transactions, respond to customer inquiries and manage inventory and our supply chain. Although our IT systems are protected through physical and software safeguards and remote processing capabilities exist, our IT systems or those of third parties whom we depend upon are still vulnerable to natural disasters, power losses, unauthorized access, telecommunication failures and other problems. If critical proprietary or third-party IT systems fail or are otherwise unavailable, including as a result of system upgrades and transitions, our ability to process orders, track credit risk, identify business opportunities, maintain proper levels of inventories, collect accounts receivable, pay expenses and otherwise manage our business would be adversely affected.
Cyber incidents can result from deliberate attacks or unintentional events. These incidents can include, but are not limited to, gaining unauthorized access to digital systems for purposes of misappropriating assets or sensitive information, corrupting data, or causing operational disruption. Cybersecurity attacks in particular are becoming more sophisticated and include, but are not limited to, malicious software, attempts to gain unauthorized access to data (either directly or through our vendors) and other electronic security breaches. Despite our security measures, our IT systems and infrastructure or those of our third parties may be vulnerable to such cyber incidents. The result of these incidents could include, but are not limited to, disrupted operations, misstated or misappropriated financial data, theft of our intellectual property or other confidential information (including of our customers, suppliers and employees), liability for stolen assets or information, increased cyber security protection costs and reputational damage adversely affecting customer or investor confidence. In addition, if any information about our customers, including payment information, were the subject of a successful cybersecurity attack against us, we could be subject to litigation or other claims by the affected customers. We have incurred costs and may incur significant additional costs in order to implement the security measures we feel are appropriate to protect our IT systems.
We may be required to recognize goodwill or other long-lived asset impairment charges.
As of March 25, 2016, we had goodwill of $115.8 million and indefinite-lived intangibles of $93.9 million. Goodwill and indefinite-lived intangibles are not amortized and are subject to impairment testing at least annually using a fair value based approach. Future triggering events, such as declines in our cash flow projections or customer demand, may cause impairments of our goodwill or long-lived assets based on factors such as the stock price of our common stock, projected cash flows, assumptions used, control premiums or other variables.
23
Table of Contents
In addition, if we divest assets at prices below their asset value, we must write them down to fair value resulting in asset impairment charges, which could adversely affect our financial position or results of operations. For example, in fiscal 2015 we recorded asset impairments of $27.9 million primarily related to our announced Fence and Sprinkler exit. We cannot accurately predict the amount and timing of any impairment of assets, and we may be required to recognize goodwill or other asset impairment charges which could materially and adversely affect our results of operations.
We are subject to certain safety and labor risks associated with the manufacture and in the testing of our products.
As of March 25, 2016, we employed approximately 3,200 total full-time equivalent employees, a significant percentage of whom work at our 27 manufacturing facilities. Our business involves complex manufacturing processes and there is a risk that an accident or death could occur in one of our facilities. In addition, prior to the introduction of new products, our employees test such products under rigorous conditions, which could potentially result in injury or death. The outcome of any personal injury, wrongful death or other litigation is difficult to assess or quantify and the cost to defend litigation can be significant. As a result, the costs to defend any action or the potential liability resulting from any such accident or death or arising out of any other litigation, and any negative publicity associated therewith or negative effects on employee morale, could have a negative effect on our business, financial position, results of operations or cash flows. In addition, any accident could result in manufacturing or product delays, which could negatively affect our business, financial position, results of operations or cash flows.
The nature of our business exposes us to product liability, construction defect and warranty claims and litigation as well as other legal proceedings, which could materially and adversely affect our business, financial position, results of operations or cash flows.
We are exposed to construction defect and product liability claims relating to our various products if our products do not meet customer expectations. Such claims and liabilities may arise out of the quality of raw materials or component parts we purchase from third-party suppliers, over which we do not have direct control, or due to our fabrication, assembly or manufacture of our products. In addition, we warrant certain of our products to be free of certain defects and could incur costs related to paying warranty claims in connection with defective products. We cannot assure you that we will not experience material losses or that we will not incur significant costs to defend or pay for such claims.
While we currently maintain insurance coverage to address a portion of these types of liabilities, we cannot make assurances that we will be able to obtain such insurance on acceptable terms in the future, if at all, or that any such insurance will provide adequate coverage against potential claims. Further, while we intend to seek indemnification against potential liability for product liability claims from relevant parties, we cannot guarantee that we will be able to recover under any such indemnification agreements. Any claims that result in liability exceeding our insurance coverage and rights to indemnification by third parties could materially and adversely affect our business, financial position, results of operations or cash flows. Product liability claims can be expensive to defend and can divert the attention of management and other personnel for significant time periods, regardless of the ultimate outcome. An unsuccessful product liability defense could be highly costly and accordingly result in a decline in revenues and profitability. For example, certain of our subsidiaries have been named as defendants in a product liability class action lawsuit in South Florida claiming that our ABF II anti-microbial coated sprinkler pipe allegedly caused environmental stress cracking in chlorinated PVC pipe. See “Business—Legal Proceedings.” If this case were to be decided against us at the class certification stage or otherwise, it could have a material adverse effect on our business, financial condition, results of operations and cash flows. In addition, even if we are successful in defending any claim relating to the products we distribute, claims of this nature could negatively impact customer confidence in us and our products.
From time to time, we are also involved in government inquiries and investigations, as well as consumer, employment, tort proceedings and other litigation. We cannot predict with certainty the outcomes of these legal
24
Table of Contents
proceedings and other contingencies. The outcome of some of these legal proceedings and other contingencies could require us to take actions which would adversely affect our operations or could require us to pay substantial amounts of money. Additionally, defending against these lawsuits and proceedings may involve significant expense and diversion of management’s attention and resources from other matters.
We may not be able to adequately protect our intellectual property rights in foreign countries, and we may become involved in intellectual property disputes.
Our use of contractual provisions, confidentiality procedures and agreements, and patent, trademark, copyright, unfair competition, trade secret and other laws to protect our intellectual property and other proprietary rights may not be adequate. We have registered intellectual property (mainly trademarks and patents) in more than 75 countries. Because of the differences in foreign trademark, patent and other intellectual property or proprietary rights laws, we may not receive the same protection in foreign countries as we would in the United States.
Litigation may be necessary to enforce our intellectual property rights or to defend against claims by third parties that our products infringe their intellectual property rights. Any litigation or claims brought by or against us could result in substantial costs and diversion of our resources. A successful intellectual property infringement suit against us could prevent us from manufacturing or selling certain products in a particular area, which could materially and adversely affect our business, financial position, results of operations or cash flows.
We face risks relating to doing business internationally that could materially and adversely affect our business, financial position, results of operations or cash flows.
Our business operates and serves customers in certain foreign countries, including Australia, Canada, China, New Zealand and the United Kingdom. There are certain risks inherent in doing business internationally, including:
| • | economic volatility and sustained economic downturns; |
| • | difficulties in enforcing contractual and intellectual property rights; |
| • | currency exchange rate fluctuations and currency exchange controls; |
| • | import or export restrictions and changes in trade regulations; |
| • | difficulties in developing, staffing, and simultaneously managing a number of foreign operations as a result of distance; |
| • | issues related to occupational safety and adherence to local labor laws and regulations; |
| • | potentially adverse tax developments; |
| • | longer payment cycles; |
| • | exposure to different legal standards; |
| • | political or social unrest, including terrorism; |
| • | risks related to government regulation and uncertain protection and enforcement of our intellectual property rights; |
| • | the presence of corruption in certain countries; and |
| • | higher than anticipated costs of entry. |
One or more of these factors could materially and adversely affect our business, financial position, results of operations or cash flows.
25
Table of Contents
Our inability to introduce new products effectively or implement our innovation strategies could adversely affect our ability to compete.
We continually seek to develop products and solutions that allow us to stay at the forefront of the needs of the Electrical Raceway and MP&S markets. The success of new products depends on a variety of factors, including but not limited to, timely and successful product development, the effective consummation of strategic acquisitions, market acceptance and demand, competitive response, our ability to manage risks associated with product life cycles, the effective management of inventory and purchase commitments, the availability and cost of raw materials and the quality of our initial products during the initial period of introduction. Some of the foregoing factors are beyond our control and we cannot fully predict the ultimate success of the introduction of new products, especially in the early stages of innovation. In introducing new products and implementing our innovation strategies, any delays, unexpected costs, diversion of resources, loss of key employees or other setbacks could materially and adversely affect our business, financial position, results of operations or cash flows.
The majority of our net sales are credit sales that are made primarily to customers whose ability to pay is dependent, in part, upon the economic strength of the industries and geographic areas in which they operate, and the failure to collect monies owed from customers could adversely affect our business, financial position, results of operations or cash flows.
The majority of our net sales are facilitated through the extension of credit to our customers, whose ability to pay is dependent, in part, upon the economic strength of the industries and geographic areas in which they operate. Our business units offer credit to customers, either through unsecured credit that is based solely upon the creditworthiness of the customer, or secured credit for materials sold for a specific job where the security lies in lien rights associated with the material going into the job. The type of credit offered depends both on the financial strength of the customer and the nature of the business in which the customer is involved. End users, resellers and other non-contractor customers generally purchase more on unsecured credit than secured credit. The inability of our customers to pay off their credit lines in a timely manner, or at all, would adversely affect our business, financial condition, results of operations and cash flows. Furthermore, our collections efforts with respect to non-paying or slow-paying customers could negatively impact our customer relations going forward.
Because we depend on the creditworthiness of our customers, if the financial condition of our customers declines, our credit risk could increase. Significant contraction in our markets, coupled with tightened credit availability and financial institution underwriting standards, could adversely affect certain of our customers. Should one or more of our larger customers declare bankruptcy, it could adversely affect the collectability of our accounts receivable, bad debt reserves and net income.
In connection with acquisitions, joint ventures or divestitures, we may become subject to liabilities and required to issue additional debt or equity.
In connection with any acquisitions or joint ventures, we may acquire liabilities or defects such as legal claims, including but not limited to third party liability and other tort claims; claims for breach of contract; employment-related claims; environmental liabilities, conditions or damage; permitting, regulatory or other compliance with law issues; liability for hazardous materials; or tax liabilities. If we acquire any of these liabilities, and they are not adequately covered by insurance or an enforceable indemnity or similar agreement from a creditworthy counterparty, we may be responsible for significant out-of-pocket expenditures. In connection with any divestitures, we may incur liabilities for breaches of representations and warranties or failure to comply with operating covenants under any agreement for a divestiture. In addition, we may indemnify a counterparty in a divestiture for certain liabilities of the subsidiary or operations subject to the divestiture transaction. These liabilities, if they materialize, could materially and adversely affect our business, financial position, results of operations or cash flows.
In addition, if we were to undertake a substantial acquisition for cash, the acquisition would likely need to be financed in part through additional financing from banks, through public offerings or private placements of
26
Table of Contents
debt or equity securities or through other arrangements. Such acquisition financing might decrease our ratio of earnings to fixed charges and adversely affect other leverage criteria and our credit rating. We cannot assure you that the necessary acquisition financing would be available to us on acceptable terms if and when required. Moreover, acquisitions financed through the issuance of equity securities could cause our stockholders to experience dilution.
We may be unable to identify, acquire, close or integrate acquisition targets successfully.
Acquisitions are a component of our growth strategy; however, there can be no assurance that we will be able to continue to grow our business through acquisitions as we have done historically or that any businesses acquired will perform in accordance with expectations or that business judgments concerning the value, strengths and weaknesses of businesses acquired will prove to be correct. We will continue to analyze and evaluate the acquisition of strategic businesses or product lines with the potential to strengthen our industry position or enhance our existing product offering. We cannot assure you that we will identify or successfully complete transactions with suitable acquisition candidates in the future, nor can we assure you that completed acquisitions will be successful. If an acquired business fails to operate as anticipated or cannot be successfully integrated with our existing business, our business, financial condition, results of operations or cash flows could be materially and adversely affected.
As a result of our international operations, we could be adversely affected by violations of the U.S. Foreign Corrupt Practices Act and similar foreign anti-corruption laws.
The U.S. Foreign Corrupt Practices Act, or the “FCPA,” and similar foreign anti-corruption laws generally prohibit companies and their intermediaries from making improper payments or providing anything of value to influence foreign government officials for the purpose of obtaining or retaining business or obtaining an unfair advantage. Recent years have seen a substantial increase in the global enforcement of anti-corruption laws, with more frequent voluntary self-disclosures by companies, aggressive investigations and enforcement proceedings by both the U.S. Department of Justice and the United States Securities and Exchange Commission, or the “SEC,” resulting in record fines and penalties, increased enforcement activity by non-U.S. regulators, and increases in criminal and civil proceedings brought against companies and individuals.
We have operations in Australia, Canada, China, New Zealand and the United Kingdom and sell our products in many additional countries. Our internal policies provide for compliance with all applicable anti-corruption laws for both us and for our joint venture operations. Our continued operation and expansion outside the United States, including in developing countries, could increase the risk of such violations in the future. Despite our training and compliance programs, we cannot assure you that our internal control policies and procedures always will protect us from unauthorized reckless or criminal acts committed by our employees, agents or joint venture partners. In the event that we believe or have reason to believe that our employees, agents or distributors have or may have violated applicable anti-corruption laws, including the FCPA, we may be required to investigate or have outside counsel investigate the relevant facts and circumstances, which can be expensive and require significant time and attention from senior management. Violations of these laws may result in severe criminal or civil sanctions, which could disrupt our business and result in a material adverse effect on our business, financial condition, results of operations and cash flows.
Regulations related to “conflict minerals” may force us to incur additional expenses, may make our supply chain more complex and may result in damage to our reputation with customers.
As a public company, we will be subject to the requirements under the Dodd-Frank Wall Street Reform and Consumer Protection Act of 2010, or the “Dodd-Frank Act.” The SEC has adopted requirements under the Dodd-Frank Act for companies that use certain minerals and metals, known as conflict minerals, in their products, whether or not these products are manufactured by third parties. These requirements require companies to conduct due diligence and disclose whether or not such minerals originate from the Democratic Republic of Congo and adjoining countries. There are costs associated with complying with these disclosure requirements,
27
Table of Contents
including for efforts to determine the sources of conflict minerals used in our products and other potential changes to products, processes or sources of supply as a consequence of such verification activities. In addition, compliance with these requirements could adversely affect the sourcing, supply, and pricing of materials used in those products and we may face reputational challenges if we are unable to verify the origins for all “conflict minerals” used in products through the procedures we have implemented. We may also encounter challenges to satisfy customers that may require all of the components of products purchased to be certified as conflict free. If we are not able to meet customer requirements, customers may choose to disqualify us as a supplier.
Anti-terrorism measures and other disruptions to the raw material supply network could impact our operations.
Our ability to provide efficient distribution of products to our customers is an integral component of our overall business strategy. In the aftermath of terrorist attacks in the United States, federal, state and local authorities have implemented and continue to implement various security measures that affect the raw material supply network in the United States and abroad. If security measures disrupt or impede the receipt of sufficient raw materials, we may fail to meet the needs of our customers or may incur increased expenses to do so.
Risks Related to Our Indebtedness
Our indebtedness may adversely affect our financial health.
As of March 25, 2016, we had approximately $632.3 million of total long-term consolidated indebtedness outstanding (including current portion). As of March 25, 2016, AII had $220.7 million of available borrowing capacity under the ABL Credit Facility and there were no outstanding borrowings under AII’s ABL Credit Facility (excluding $17.9 million of letters of credit issued under the facility). In addition, subject to certain conditions and without the consent of the then existing lenders, the loans under the First Lien Term Loan Facility and the Second Lien Term Loan Facility may be expanded (or a new term loan facility, revolving credit facility or letter of credit facility added) by up to $125.0 million and $75.0 million, respectively, plus an additional amount not to exceed specified coverage ratios. See “Description of Certain Indebtedness—First Lien Term Loan Facility” and “Description of Certain Indebtedness—Second Lien Term Loan Facility.” In addition, we are able to incur additional indebtedness in the future, subject to the limitations contained in the agreements governing our indebtedness. Our indebtedness could have important consequences to you. Because of our indebtedness:
| • | our ability to obtain additional financing for working capital, capital expenditures, acquisitions, debt service requirements or general corporate purposes and our ability to satisfy our obligations with respect to our indebtedness may be impaired in the future; |
| • | a large portion of our cash flow from operations must be dedicated to the payment of principal and interest on our indebtedness, thereby reducing the funds available to us for other purposes; |
| • | we are exposed to the risk of increased interest rates because a significant portion of our borrowings are at variable rates of interest; |
| • | it may be more difficult for us to satisfy our obligations to our creditors, resulting in possible defaults on, and acceleration of, such indebtedness; |
| • | we may be more vulnerable to general adverse economic and industry conditions; |
| • | we may be at a competitive disadvantage compared to our competitors with proportionately less indebtedness or with comparable indebtedness on more favorable terms and, as a result, they may be better positioned to withstand economic downturns; |
| • | our ability to refinance indebtedness may be limited or the associated costs may increase; |
| • | our flexibility to adjust to changing market conditions and ability to withstand competitive pressures could be limited; and |
| • | we may be prevented from carrying out capital spending and restructurings that are necessary or important to our growth strategy and efforts to improve our operating margins. |
28
Table of Contents
Despite our indebtedness levels, we and our subsidiaries may incur substantially more indebtedness, which may increase the risks created by our indebtedness.
We and our subsidiaries may incur substantial additional indebtedness in the future. The terms of the credit agreements governing the Credit Facilities do not fully prohibit our subsidiaries from incurring additional debt. If our subsidiaries are in compliance with certain coverage ratios set forth in the agreements governing the Credit Facilities, they may be able to incur substantial additional indebtedness, which may increase the risks created by our current indebtedness. In addition, subject to certain conditions and without the consent of the then existing lenders, the loans under the First Lien Term Loan Facility and the Second Lien Term Loan Facility may be expanded (or a new term loan facility, revolving credit facility or letter of credit facility added) by up to $125.0 million and $75.0 million, respectively, plus an additional amount not to exceed specified leverage ratios. See “Description of Certain Indebtedness—First Lien Term Loan Facility” and “Description of Certain Indebtedness—Second Lien Term Loan Facility.” As of March 25, 2016, we were able to borrow an additional $220.7 million under the ABL Credit Facility. In addition, we can request an increase in the commitments to our ABL Credit Facility from the participating banks or other banks of up to $75.0 million under the terms of the facility.
Increases in interest rates would increase the cost of servicing our indebtedness and could reduce our profitability.
A significant portion of our outstanding indebtedness bears interest or will bear interest at variable rates. As a result, increases in interest rates would increase the cost of servicing our indebtedness and could materially and adversely affect our business, financial position, results of operations or cash flows. As of March 25, 2016, assuming LIBOR exceeded 1.00%, each one percentage point change in interest rates would result in a change of approximately $6.4 million in the annual interest expense on our Term Loan Facilities. As of March 25, 2016, assuming availability was fully utilized, each one percentage point change in interest rates would result in a change of approximately $3.6 million in annual interest expense on the ABL Credit Facility. The impact of increases in interest rates could be more significant for us than it would be for some other companies because of our indebtedness, thereby affecting our profitability.
A lowering or withdrawal of the ratings, outlook or watch assigned to our indebtedness by rating agencies may increase our future borrowing costs and reduce our access to capital.
Our indebtedness currently has a non-investment grade rating, and any rating, outlook or watch assigned could be lowered or withdrawn entirely by a rating agency if, in that rating agency’s judgment, current or future circumstances relating to the basis of the rating, outlook or watch, such as adverse changes to our business, so warrant. Any future lowering of our ratings, outlook or watch likely would make it more difficult or more expensive for us to obtain additional debt financing.
The agreements and instruments governing our indebtedness contain restrictions and limitations that could significantly impact our ability to operate our business.
The Credit Facilities contain covenants that, among other things, restrict the ability of AII and its subsidiaries to:
| • | incur additional indebtedness and create liens; |
| • | pay dividends and make other distributions or to purchase, redeem or retire capital stock; |
| • | purchase, redeem or retire certain junior indebtedness; |
| • | make loans and investments; |
| • | enter into agreements that limit AII’s or its subsidiaries’ ability to pledge assets or to make distributions or loans to us or transfer assets to us; |
| • | sell assets; |
29
Table of Contents
| • | enter into certain types of transactions with affiliates; |
| • | consolidate, merge or sell substantially all assets; |
| • | make voluntary payments or modifications of junior indebtedness; and |
| • | enter into lines of business. |
The restrictions in the Credit Facilities may prevent us from taking actions that we believe would be in the best interest of our business and may make it difficult for us to execute our business strategy successfully or effectively compete with companies that are not similarly restricted. We may also incur future debt obligations that might subject us to additional restrictive covenants that could affect our financial and operational flexibility. We may be unable to refinance our indebtedness, at maturity or otherwise, on terms acceptable to us or at all.
The ability of AII to comply with the covenants and restrictions contained in the Credit Facilities may be affected by economic, financial and industry conditions beyond our control including credit or capital market disruptions. The breach of any of these covenants or restrictions could result in a default that would permit the applicable lenders to declare all amounts outstanding thereunder to be due and payable, together with accrued and unpaid interest. If we are unable to repay indebtedness, lenders having secured obligations, such as the lenders under the Credit Facilities, could proceed against the collateral securing the indebtedness. In any such case, we may be unable to borrow under the Credit Facilities and may not be able to repay the amounts due under such facilities. This could materially and adversely affect our business, financial position, results of operations or cash flows and could cause us to become bankrupt or insolvent.
Our ability to generate the significant amount of cash needed to pay interest and principal on our indebtedness and our ability to refinance all or a portion of our indebtedness or obtain additional financing depends on many factors beyond our control.
Atkore and AII are each holding companies, and as such they have no independent operations or material assets other than ownership of equity interests in their respective subsidiaries. Atkore and AII each depend on their respective subsidiaries to distribute funds to them so that they may pay obligations and expenses, including satisfying obligations with respect to indebtedness. Our ability to make scheduled payments on, or to refinance our obligations under, our indebtedness depends on the financial and operating performance of our subsidiaries and their ability to make distributions and dividends to us, which, in turn, depends on their results of operations, cash flows, cash requirements, financial position and general business conditions and any legal and regulatory restrictions on the payment of dividends to which they may be subject, many of which may be beyond our control.
We may be unable to maintain a level of cash flows from operating activities sufficient to permit us to pay the principal and interest on our indebtedness. If our cash flow and capital resources are insufficient to fund our debt service obligations, we may be forced to reduce or delay capital expenditures, sell assets, seek to obtain additional equity capital or restructure our indebtedness. In the future, our cash flow and capital resources may not be sufficient for payments of interest on and principal of our indebtedness, and such alternative measures may not be successful and may not permit us to meet our scheduled debt service obligations.
The outstanding borrowings under the First Lien Term Loan Facility have a maturity date of April 9, 2021, the outstanding borrowings under the Second Lien Term Loan Facility have a maturity date of October 9, 2021 and the ABL Credit Facility is scheduled to mature on October 23, 2018. We may be unable to refinance any of our indebtedness or obtain additional financing, particularly because of our substantial of indebtedness. Market disruptions, such as those experienced in 2008 and 2009, as well as our indebtedness levels, may increase our cost of borrowing or adversely affect our ability to refinance our obligations as they become due. If we are unable to refinance our indebtedness or access additional credit, or if short-term or long-term borrowing costs dramatically increase, our ability to finance current operations and meet our short-term and long-term obligations could be adversely affected.
30
Table of Contents
If our subsidiary AII cannot make scheduled payments on its indebtedness, it will be in default and the lenders under the Credit Facilities could terminate their commitments to loan money or foreclose against the assets securing their borrowings, and we could be forced into bankruptcy or liquidation.
Risks Related to Our Common Stock and This Offering
Atkore is a holding company with no operations of its own, and it depends on its subsidiaries for cash to fund all of its operations and expenses, including to make future dividend payments, if any.
Our operations are conducted entirely through our subsidiaries, and our ability to generate cash to fund our operations and expenses, to pay dividends or to meet debt service obligations is highly dependent on the earnings and the receipt of funds from our subsidiaries through dividends or intercompany loans. Deterioration in the financial condition, earnings or cash flow of AII and its subsidiaries for any reason could limit or impair their ability to pay such distributions. Additionally, to the extent our subsidiaries are restricted from making such distributions under applicable law or regulation or under the terms of our financing arrangements, or are otherwise unable to provide funds to the extent of our needs, there could be a material adverse effect on our business, financial condition, results of operations or cash flows.
For example, the agreements governing the Credit Facilities significantly restrict the ability of our subsidiaries to pay dividends, make loans or otherwise transfer assets to us. Furthermore, our subsidiaries are permitted under the terms of the Credit Facilities to incur additional indebtedness that may restrict or prohibit the making of distributions, the payment of dividends or the making of loans by such subsidiaries to us.
Our common stock has no prior public market, and the market price of our common stock may be volatile and could decline after this offering.
Prior to this offering, there has been no public market for our common stock, and an active market for our common stock may not develop or be sustained after this offering. We and the selling stockholders will negotiate the initial public offering price per share with the representatives of the underwriters and, therefore, that price may not be indicative of the market price of our common stock after this offering. We cannot assure you that an active public market for our common stock will develop after this offering or, if one does develop, that it will be sustained. In the absence of an active public trading market, you may not be able to sell your shares. An inactive market may also impair our ability to raise capital to continue to fund operations by selling shares and may impair our ability to make strategic investments by using our shares as consideration. In addition, the market price of our common stock may fluctuate significantly. Among the factors that could affect our stock price are:
| • | industry or general market conditions; |
| • | domestic and international economic factors unrelated to our performance; |
| • | changes in our customers’ preferences; |
| • | new regulatory pronouncements and changes in regulatory guidelines; |
| • | lawsuits, enforcement actions and other claims by third parties or governmental authorities; |
| • | actual or anticipated fluctuations in our quarterly operating results; |
| • | changes in securities analysts’ estimates of our financial performance or lack of research coverage and reports by industry analysts; |
| • | action by institutional stockholders or other large stockholders (including the CD&R Investor), including future sales of our common stock; |
| • | failure to meet any guidance given by us or any change in any guidance given by us, or changes by us in our guidance practices; |
| • | announcements by us of significant impairment charges; |
| • | speculation in the press or investment community; |
31
Table of Contents
| • | investor perception of us and our industry; |
| • | changes in market valuations or earnings of similar companies; |
| • | announcements by us or our competitors of significant contracts, acquisitions, dispositions or strategic partnerships; |
| • | war, terrorist acts and epidemic disease; |
| • | any future sales of our common stock or other securities; |
| • | additions or departures of key personnel; and |
| • | misconduct or other improper actions of our employees. |
In particular, we cannot assure you that you will be able to resell your shares at or above the initial public offering price. Stock markets have experienced extreme volatility in recent years that has been unrelated to the operating performance of particular companies. These broad market fluctuations may adversely affect the trading price of our common stock. In the past, following periods of volatility in the market price of a company’s securities, class action litigation has often been instituted against the affected company. Any litigation of this type brought against us could result in substantial costs and a diversion of our management’s attention and resources, which could materially and adversely affect our business, financial position, results of operations or cash flows.
Future sales of shares by existing stockholders could cause our stock price to decline.
Sales of substantial amounts of our common stock in the public market following this offering, or the perception that these sales could occur, could cause the market price of our common stock to decline. These sales, or the possibility that these sales may occur, also might make it more difficult for us to sell equity securities in the future at a time and at a price that we deem appropriate.
Based on shares outstanding as of , 2016, upon the completion of this offering, we will have outstanding shares of common stock. All of the shares sold pursuant to this offering will be immediately tradable without restriction under the Securities Act of 1933, as amended, or the “Securities Act,” except for any shares held by “affiliates,” as that term is defined in Rule 144 under the Securities Act, or “Rule 144.”
The remaining shares of common stock outstanding as of , 2016 will be restricted securities within the meaning of Rule 144 but will be eligible for resale subject to applicable volume, manner of sale, holding period and other limitations of Rule 144 or pursuant to an exception from registration under Rule 701 under the Securities Act, or “Rule 701,” subject to the terms of the lock-up agreements entered into by us, the selling stockholder, our executive officers and directors, and stockholders currently representing substantially all of the outstanding shares of our common stock.
Upon the completion of this offering, we intend to file one or more registration statements on Form S-8 under the Securities Act to register the shares of common stock to be issued under our equity compensation plans and, as a result, all shares of common stock acquired upon exercise of stock options granted under our plans will also be freely tradable under the Securities Act, subject to the terms of the lock-up agreements, unless purchased by our affiliates. As of , 2016, there were stock options outstanding to purchase a total of shares of our common stock. In addition, shares of our common stock are reserved for future issuances under our equity compensation plans.
In connection with this offering, we, our executive officers and directors, and stockholders currently representing substantially all of the outstanding shares of our common stock, including the selling stockholder, will sign lock-up agreements under which, subject to certain exceptions, we and they will agree not to sell, transfer or dispose of or hedge, directly or indirectly, any shares of our common stock or any securities convertible into or exercisable or exchangeable for shares of our common stock for a period of 180 days after the date of this prospectus, except with the prior written consent of , the “Lock-Up Release Party.” See
32
Table of Contents
“Underwriting.” Following the expiration of this 180-day lock-up period, shares of our common stock will be eligible for future sale, subject to the applicable volume, manner of sale, holding period and other limitations of Rule 144 or pursuant to an exception from registration under Rule 701. See “Shares Available for Future Sale” for a discussion of the shares of common stock that may be sold into the public market in the future. In addition, our significant stockholders may distribute shares that they hold to their investors who themselves may then sell into the public market following the expiration of the lock-up period. Such sales may not be subject to the volume, manner of sale, holding period and other limitations of Rule 144. As resale restrictions end, the market price of our common stock could decline if the holders of those shares sell them or are perceived by the market as intending to sell them. Furthermore, stockholders currently representing substantially all of the outstanding shares of our common stock will have the right to require us to register shares of common stock for resale in some circumstances.
In the future, we may issue additional shares of common stock or other equity or debt securities convertible into or exercisable or exchangeable for shares of our common stock in connection with a financing, strategic investment, litigation settlement or employee arrangement or otherwise. Any of these issuances could result in substantial dilution to our existing stockholders and could cause the trading price of our common stock to decline.
If securities or industry analysts do not publish research or publish misleading or unfavorable research about our business, our stock price and trading volume could decline.
The trading market for our common stock will depend in part on the research and reports that securities or industry analysts publish about us or our business. We do not currently have, and may never obtain, research coverage for our common stock. If there is no research coverage of our common stock, the trading price for our common stock may be negatively impacted. In the event we obtain research coverage for our common stock, if one or more of the analysts downgrades our stock or publishes misleading or unfavorable research about our business, our stock price would likely decline. If one or more of the analysts ceases coverage of our common stock or fails to publish reports on us regularly, demand for our common stock could decrease, which could cause our common stock price or trading volume to decline.
The CD&R Investor will have significant influence over us and may not always exercise its influence in a way that benefits our public stockholders.
Following the completion of this offering, the CD&R Investor will own approximately % of the outstanding shares of our common stock, assuming that the underwriters do not exercise their option to purchase additional shares from the selling stockholder. As a result, the CD&R Investor will exercise significant influence over all matters requiring stockholder approval for the foreseeable future, including approval of significant corporate transactions, which may reduce the market price of our common stock.
As long as the CD&R Investor continues to beneficially own at least 50% of our outstanding common stock, the CD&R Investor generally will be able to determine the outcome of corporate actions requiring stockholder approval, including the election of the members of our board of directors and the approval of significant corporate transactions, such as mergers and the sale of substantially all of our assets. Even after the CD&R Investor reduces its beneficial ownership below 50% of our outstanding common stock, it will likely still be able to assert significant influence over our board of directors and certain corporate actions. Following the consummation of this offering, the CD&R Investor will have the right to designate for nomination for election at least a majority of our directors as long as the CD&R Investor beneficially owns at least 50% of our common stock.
Because the CD&R Investor’s interests may differ from your interests, actions the CD&R Investor takes as our controlling stockholder or as a significant stockholder may not be favorable to you. For example, the concentration of ownership held by the CD&R Investor could delay, defer or prevent a change of control of us
33
Table of Contents
or impede a merger, takeover or other business combination that another stockholder may otherwise view favorably. Other potential conflicts could arise, for example, over matters such as employee retention or recruiting, or our dividend policy.
Under our amended and restated certificate of incorporation, the CD&R Investor and its affiliates and, in some circumstances, any of our directors and officers who is also a director, officer, employee, member or partner of the CD&R Investor and its affiliates, have no obligation to offer us corporate opportunities.
The policies relating to corporate opportunities and transactions with the CD&R Investor to be set forth in our second amended and restated certificate of incorporation, or “amended and restated certificate of incorporation,” address potential conflicts of interest between Atkore, on the one hand, and the CD&R Investor and its officers, directors, employees, members or partners who are directors or officers of our company, on the other hand. In accordance with those policies, the CD&R Investor may pursue corporate opportunities, including acquisition opportunities that may be complementary to our business, without offering those opportunities to us. By becoming a stockholder in Atkore, you will be deemed to have notice of and have consented to these provisions of our amended and restated certificate of incorporation. Although these provisions are designed to resolve conflicts between us and the CD&R Investor and its affiliates fairly, conflicts may not be resolved in our favor or be resolved at all.
Future offerings of debt or equity securities which would rank senior to our common stock may adversely affect the market price of our common stock.
If, in the future, we decide to issue debt or equity securities that rank senior to our common stock, it is likely that such securities will be governed by an indenture or other instrument containing covenants restricting our operating flexibility. Additionally, any convertible or exchangeable securities that we issue in the future may have rights, preferences and privileges more favorable than those of our common stock and may result in dilution to owners of our common stock. We and, indirectly, our stockholders, will bear the cost of issuing and servicing such securities. Because our decision to issue debt or equity securities in any future offering will depend on market conditions and other factors beyond our control, we cannot predict or estimate the amount, timing or nature of our future offerings. Thus, holders of our common stock will bear the risk of our future offerings reducing the market price of our common stock and diluting the value of their stock holdings in us.
Fulfilling our obligations incident to being a public company, including with respect to the requirements of and related rules under the Sarbanes-Oxley Act of 2002, or the “Sarbanes-Oxley Act,” and the Dodd-Frank Act, will be expensive and time-consuming, and any delays or difficulties in satisfying these obligations could have a material adverse effect on our future results of operations and our stock price.
Following this offering, we will be subject to the reporting, accounting and corporate governance requirements, under the listing standards of the NYSE, the Sarbanes-Oxley Act and the Dodd-Frank Act that apply to issuers of listed equity, which will impose certain new compliance requirements, costs and obligations upon us. The changes necessitated by publicly listing our equity will require a significant commitment of additional resources and management oversight which will increase our operating costs. Further, to comply with the requirements of being a public company, we may need to undertake various actions, such as implementing new internal controls and procedures and hiring additional accounting or internal audit staff. In addition, we may identify control deficiencies which could result in a material weakness or significant deficiency. In the past, we have identified material weaknesses, all of which have since been remediated. We did not identify any material weaknesses for fiscal 2015.
The expenses associated with being a public company include increases in auditing, accounting and legal fees and expenses, investor relations expenses, increased directors’ fees and director and officer liability insurance costs, registrar and transfer agent fees and listing fees, as well as other expenses. As a public company, we will be required, among other things, to define and expand the roles and the duties of our board of directors
34
Table of Contents
and its committees and institute more comprehensive compliance and investor relations functions. Failure to comply with Sarbanes-Oxley Act or Dodd-Frank Act could potentially subject us to sanctions or investigations by the SEC, the NYSE or other regulatory authorities.
Anti-takeover provisions in our amended and restated certificate of incorporation and amended and restated by-laws could discourage, delay or prevent a change of control of our company and may affect the trading price of our common stock.
Our amended and restated certificate of incorporation and our second amended and restated by-laws, or “amended and restated by-laws,” include a number of provisions that may discourage, delay or prevent a change in our management or control over us that stockholders may consider favorable. For example, prior to the completion of this offering, our amended and restated certificate of incorporation and amended and restated by-laws will collectively:
| • | authorize the issuance of “blank check” preferred stock that could be issued by our board of directors to thwart a takeover attempt; |
| • | establish a classified board of directors, as a result of which our board of directors will be divided into three classes, with members of each class serving staggered three-year terms, which prevents stockholders from electing an entirely new board of directors at an annual meeting; |
| • | limit the ability of stockholders to remove directors if the CD&R Investor ceases to beneficially own at least 40% of the outstanding shares of our common stock; |
| • | provide that vacancies on our board of directors, including vacancies resulting from an enlargement of our board of directors, may be filled only by a majority vote of directors then in office; |
| • | prohibit stockholders from calling special meetings of stockholders if the CD&R Investor ceases to beneficially own at least 40% of the outstanding shares of our common stock; |
| • | prohibit stockholder action by written consent, thereby requiring all actions to be taken at a meeting of the stockholders, if the CD&R Investor ceases to beneficially own at least 40% of the outstanding shares of our common stock; |
| • | establish advance notice requirements for nominations of candidates for election as directors or to bring other business before an annual meeting of our stockholders; and |
| • | require the approval of holders of at least 66 2⁄3% of the outstanding shares of our common stock to amend our amended and restated by-laws and certain provisions of our amended and restated certificate of incorporation if the CD&R Investor ceases to beneficially own at least 40% of the outstanding shares of our common stock. |
These provisions may prevent our stockholders from receiving the benefit from any premium to the market price of our common stock offered by a bidder in a takeover context. Even in the absence of a takeover attempt, the existence of these provisions may adversely affect the prevailing market price of our common stock if the provisions are viewed as discouraging takeover attempts in the future. See “Description of Capital Stock—Anti-Takeover Effects of our Certificate of Incorporation and By-Laws.”
Our amended and restated certificate of incorporation and amended and restated by-laws may also make it difficult for stockholders to replace or remove our management. Furthermore, the existence of the foregoing provisions, as well as the significant amount of common stock that the CD&R Investor will own following this offering, could limit the price that investors might be willing to pay in the future for shares of our common stock. These provisions may facilitate management entrenchment that may delay, deter, render more difficult or prevent a change in our control, which may not be in the best interests of our stockholders.
35
Table of Contents
We could be the subject of securities class action litigation due to future stock price volatility, which could divert management’s attention and materially and adversely affect our business, financial position, results of operations or cash flows.
The stock market in general, and market prices for the securities of companies like ours in particular, have from time to time experienced volatility that often has been unrelated to the operating performance of the underlying companies. A certain degree of stock price volatility can be attributed to being a newly public company. These broad market and industry fluctuations may adversely affect the market price of our common stock, regardless of our operating performance. In certain situations in which the market price of a stock has been volatile, holders of that stock have instituted securities class action litigation against the company that issued the stock. If any of our stockholders were to bring a similar lawsuit against us, the defense and disposition of the lawsuit could be costly and divert the time and attention of our management and could materially and adversely affect our business, financial position, results of operations or cash flows.
We do not intend to pay dividends on our common stock for the foreseeable future and, consequently, your ability to achieve a return on your investment will depend on appreciation in the price of our common stock.
We do not intend to declare and pay dividends on our common stock for the foreseeable future. We currently intend to use our future earnings, if any, to repay debt, to fund our growth, to develop our business, for working capital needs and for general corporate purposes. Therefore, you are not likely to receive any dividends on your common stock for the foreseeable future, and the success of an investment in shares of our common stock will depend upon any future appreciation in their value. There is no guarantee that shares of our common stock will appreciate in value or even maintain the price at which our stockholders have purchased their shares. Payments of dividends, if any, will be at the sole discretion of our board of directors after taking into account various factors, including general and economic conditions, our financial condition and operating results, our available cash and current and anticipated cash needs, capital requirements, contractual, legal, tax and regulatory restrictions and implications of the payment of dividends by us to our stockholders or by our subsidiaries (including AII) to us, and such other factors as our board of directors may deem relevant. In addition, our operations are conducted almost entirely through our subsidiaries. As such, to the extent that we determine in the future to pay dividends on our common stock, none of our subsidiaries will be obligated to make funds available to us for the payment of dividends. Further, the agreements governing the Credit Facilities significantly restrict the ability of our subsidiaries to pay dividends or otherwise transfer assets to us. In addition, Delaware law imposes additional requirements that may restrict our ability to pay dividends to holders of our common stock.
We expect to be a “controlled company” within the meaning of NYSE rules and, as a result, we will qualify for, and currently intend to rely on, exemptions from certain corporate governance requirements. You will not have the same protections afforded to stockholders of companies that are subject to such requirements.
After the completion of this offering, the CD&R Investor will control a majority of the voting power of our outstanding common stock. Accordingly, we expect to qualify as a “controlled company” within the meaning of NYSE corporate governance standards. Under NYSE rules, a company of which more than 50% of the voting power is held by an individual, group or another company is a “controlled company” and may elect not to comply with certain NYSE corporate governance standards, including:
| • | the requirement that a majority of the board of directors consist of independent directors; |
| • | the requirement that our nominating and governance committee be composed entirely of independent directors with a written charter addressing the committee’s purpose and responsibilities; |
| • | the requirement that we have a compensation committee that is composed entirely of independent directors with a written charter addressing the committee’s purpose and responsibilities; and |
| • | the requirement for an annual performance evaluation of the nominating and governance and compensation committees. |
36
Table of Contents
Following this offering, we intend to utilize these exemptions. As a result, we will not have a majority of independent directors, our nominating and governance committee and compensation committee will not consist entirely of independent directors and such committees may not be subject to annual performance evaluations. Consequently, you will not have the same protections afforded to stockholders of companies that are subject to all of NYSE corporate governance rules and requirements. Our status as a controlled company could make our common stock less attractive to some investors or otherwise harm our stock price.
Our amended and restated certificate of incorporation will include provisions limiting the personal liability of our directors for breaches of fiduciary duty under the DGCL.
Our amended and restated certificate of incorporation will contain provisions permitted under the action asserting a claim arising under the General Corporation Law of the State of Delaware, or the “DGCL,” relating to the liability of directors. These provisions will eliminate a director’s personal liability to the fullest extent permitted by the DGCL for monetary damages resulting from a breach of fiduciary duty, except in circumstances involving:
| • | any breach of the director’s duty of loyalty; |
| • | acts or omissions not in good faith or which involve intentional misconduct or a knowing violation of the law; |
| • | under Section 174 of the DGCL (unlawful dividends); or |
| • | any transaction from which the director derives an improper personal benefit. |
The principal effect of the limitation on liability provision is that a stockholder will be unable to prosecute an action for monetary damages against a director unless the stockholder can demonstrate a basis for liability for which indemnification is not available under the DGCL. These provisions, however, should not limit or eliminate our rights or any stockholder’s rights to seek non-monetary relief, such as an injunction or rescission, in the event of a breach of a director’s fiduciary duty. These provisions will not alter a director’s liability under federal securities laws. The inclusion of this provision in our amended and restated certificate of incorporation may discourage or deter stockholders or management from bringing a lawsuit against directors for a breach of their fiduciary duties, even though such an action, if successful, might otherwise have benefited us and our stockholders.
Our amended and restated certificate of incorporation will designate the Court of Chancery of the State of Delaware as the sole and exclusive forum for certain litigation that may be initiated by our stockholders, which could limit our stockholders’ ability to obtain a favorable judicial forum for disputes with us or our directors, officers or stockholders.
Our amended and restated certificate of incorporation will provide that, unless we consent in writing to the selection of an alternative forum, the Court of Chancery of the State of Delaware will, to the fullest extent permitted by law, be the sole and exclusive forum for (i) any derivative action or proceeding brought on our behalf, (ii) any action asserting a claim of breach of a fiduciary duty owed to us or our stockholders by any of our directors, officers, other employees, agents or stockholders, (iii) any action asserting a claim arising out of or under the DGCL, or as to which the DGCL confers jurisdiction on the Court of Chancery of the State of Delaware (including, without limitation, any action asserting a claim arising out of or pursuant to our amended and restated certificate of incorporation or our amended and restated by-laws) or (iv) any action asserting a claim that is governed by the internal affairs doctrine. By becoming a stockholder in our company, you will be deemed to have notice of and have consented to the provisions of our amended and restated certificate of incorporation related to choice of forum. The choice of forum provision in our amended and restated certificate of incorporation may limit our stockholders’ ability to obtain a favorable judicial forum for disputes with us or any of our directors, officers, other employees, agents or stockholders, which may discourage lawsuits with respect to such claims. Alternatively, if a court were to find the choice of forum provision contained in our amended and restated certificate of incorporation to be inapplicable or unenforceable in an action, we may incur additional costs associated with resolving such action in other jurisdictions, which could materially and adversely affect our business, financial position, results of operations or cash flows.
37
Table of Contents
SPECIAL NOTE REGARDING FORWARD-LOOKING STATEMENTS AND INFORMATION
This prospectus contains forward-looking statements and cautionary statements. Some of the forward-looking statements can be identified by the use of forward-looking terms such as “believes,” “expects,” “may,” “will,” “shall,” “should,” “would,” “could,” “seeks,” “aims,” “projects,” “is optimistic,” “intends,” “plans,” “estimates,” “anticipates” or other comparable terms. Forward-looking statements include, without limitation, all matters that are not historical facts. They appear in a number of places throughout this prospectus and include, without limitation, statements regarding our intentions, beliefs, assumptions or current expectations concerning, among other things, financial position; results of operations; cash flows; prospects; growth strategies or expectations; customer retention; the outcome (by judgment or settlement) and costs of legal, administrative or regulatory proceedings, investigations or inspections, including, without limitation, collective, representative or class action litigation; and the impact of prevailing economic conditions.
Forward-looking statements are subject to known and unknown risks and uncertainties, many of which may be beyond our control. We caution you that forward-looking statements are not guarantees of future performance or outcomes and that actual performance and outcomes, including, without limitation, our actual results of operations, financial condition and liquidity, and the development of the market in which we operate, may differ materially from those made in or suggested by the forward-looking statements contained in this prospectus. In addition, even if our results of operations, financial condition and cash flows, and the development of the market in which we operate, are consistent with the forward-looking statements contained in this prospectus, those results or developments may not be indicative of results or developments in subsequent periods. A number of important factors, including, without limitation, the risks and uncertainties discussed under the captions “Risk Factors” and “Management’s Discussion and Analysis of Financial Condition and Results of Operations” in this prospectus, could cause actual results and outcomes to differ materially from those reflected in the forward-looking statements. Additional factors that could cause actual results and outcomes to differ from those reflected in forward-looking statements include, without limitation:
| • | declines in, and uncertainty regarding, the general business and economic conditions in the U.S. and international markets in which we operate; |
| • | weakness or another downturn in the U.S. non-residential construction industry; |
| • | changes in prices of raw materials; |
| • | pricing pressure, reduced profitability, or loss of market share due to intense competition; |
| • | availability and cost of third-party freight carriers and energy; |
| • | high levels of imports of products similar to those manufactured by us; |
| • | changes in federal, state, local and international governmental regulations and trade policies; |
| • | adverse weather conditions; |
| • | failure to generate sufficient cash flow from operations or to raise sufficient funds in the capital markets to satisfy existing obligations and support the development of our business; |
| • | increased costs relating to future capital and operating expenditures to maintain compliance with environmental, health and safety laws; |
| • | reduced spending by, deterioration in the financial condition of, or other adverse developments with respect to, one or more of our top customers; |
| • | increases in our working capital needs, which are substantial and fluctuate based on economic activity and the market prices for our main raw materials, including as a result of failure to collect, or delays in the collection of, cash from the sale of manufactured products; |
| • | work stoppage or other interruptions of production at our facilities as a result of disputes under existing collective bargaining agreements with labor unions or in connection with negotiations of new collective bargaining agreements, as a result of supplier financial distress, or for other reasons; |
38
Table of Contents
| • | challenges attracting and retaining key personnel or high-quality employees; |
| • | changes in our financial obligations relating to pension plans that we maintain in the United States; |
| • | reduced production or distribution capacity due to interruptions in the operations of our facilities or those of our key suppliers; |
| • | loss of a substantial number of our third-party agents or distributors or a dramatic deviation from the amount of sales they generate; |
| • | security threats, attacks, or other disruptions to our information systems, or failure to comply with complex network security, data privacy and other legal obligations or the failure to protect sensitive information; |
| • | possible impairment of goodwill or other long-lived assets as a result of future triggering events, such as declines in our cash flow projections or customer demand; |
| • | safety and labor risks associated with the manufacture and in the testing of our products; |
| • | product liability, construction defect and warranty claims and litigation relating to our various products, as well as government inquiries and investigations, and consumer, employment, tort and other legal proceedings; |
| • | our ability to protect our intellectual property and other material proprietary rights; |
| • | risks inherent in doing business internationally; |
| • | our inability to introduce new products effectively or implement our innovation strategies; |
| • | the inability of our customers to pay off the credit lines extended to them by us in a timely manner and the negative impact on customer relations resulting from our collections efforts with respect to non-paying or slow-paying customers; |
| • | the incurrence of liabilities and the issuance of additional debt or equity in connection with acquisitions, joint ventures or divestitures; |
| • | failure to manage acquisitions successfully, including identifying, evaluating, and valuing acquisition targets and integrating acquired companies, businesses or assets; |
| • | the incurrence of liabilities in connection with violations of the FCPA and similar foreign anti-corruption laws; |
| • | the incurrence of additional expenses, increase in complexity of our supply chain and potential damage to our reputation with customers resulting from regulations related to “conflict minerals”; |
| • | disruptions or impediments to the receipt of sufficient raw materials resulting from various anti-terrorism security measures; |
| • | restrictions contained in our debt agreements; |
| • | failure to generate cash sufficient to pay the principal of, interest on, or other amounts due on our debt; |
| • | the significant influence the CD&R Investor will have over corporate decisions; and |
| • | other risks and factors included under “Risk Factors” and elsewhere in this prospectus. |
You should read this prospectus completely and with the understanding that actual future results may be materially different from expectations. All forward-looking statements attributable to us or persons acting on our behalf that are made in this prospectus are qualified in their entirety by these cautionary statements. These forward-looking statements are made only as of the date of this prospectus, and we do not undertake any obligation, other than as may be required by law, to update or revise any forward-looking or cautionary statements to reflect changes in assumptions, the occurrence of events, unanticipated or otherwise, and changes in future operating results over time or otherwise.
Comparisons of results for current and any prior periods are not intended to express any future trends, or indications of future performance, unless expressed as such, and should only be viewed as historical data.
39
Table of Contents
The selling stockholder will receive all of the net proceeds from the sale of shares of our common stock offered pursuant to this prospectus. Accordingly, we will not receive any proceeds from the sale of the shares being sold in this offering, including the sale of any shares by the selling stockholder if the underwriters exercise their option to purchase additional shares. The selling stockholder will bear any underwriting commissions and discounts attributable to its sale of our common stock, and we will bear the remaining expenses. See “Principal and Selling Stockholders.”
40
Table of Contents
We do not intend to declare or pay dividends on our common stock for the foreseeable future. We currently intend to use our future earnings, if any, to repay debt, to fund our growth, to develop our business, for working capital needs and general corporate purposes. Our ability to pay dividends to holders of our common stock is significantly limited as a practical matter by the Credit Facilities insofar as we may seek to pay dividends out of funds made available to us by AII or its subsidiaries, because AII’s debt instruments directly or indirectly restrict AII’s ability to pay dividends or make loans to us. Any future determination to pay dividends on our common stock will be subject to the discretion of our board of directors and depend upon various factors, including our results of operations, financial condition, liquidity requirements, capital requirements, level of indebtedness, contractual restrictions with respect to payment of dividends, restrictions imposed by Delaware law, general business conditions and other factors that our board of directors may deem relevant. See “Description of Certain Indebtedness” for a description of restrictions on our ability to pay dividends under our debt instruments.
41
Table of Contents
The following table sets forth our cash and cash equivalents and capitalization on a consolidated basis as of March 25, 2016.
All of the shares of common stock offered in this offering are being sold by the selling stockholder. We will not receive any of the proceeds from the sale of shares by the selling stockholder in this offering including from any exercise by the underwriters of their option to purchase additional shares from the selling stockholder.
You should read this table in conjunction with “Use of Proceeds,” “Selected Historical Consolidated Financial Data,” “Management’s Discussion and Analysis of Financial Condition and Results of Operations,” “Description of Certain Indebtedness” and our consolidated financial statements and related notes included elsewhere in this prospectus.
| (in thousands, except share and per share amounts) |
As of March 25, 2016 |
|||
| Cash and cash equivalents(1) |
$ | 134,477 | ||
|
|
|
|||
| Long term debt: |
||||
| ABL Credit Facility(2) |
— | |||
| First Lien Term Loan Facility |
$ | 412,200 | ||
| Second Lien Term Loan Facility |
229,306 | |||
| Deferred financing costs |
(9,870 | ) | ||
| Other |
614 | |||
|
|
|
|||
| Total long-term debt (including current portion) |
632,250 | |||
| Equity: |
||||
| Common stock $0.01 par value per share; 200,000,000 shares authorized, 45,590,049 shares issued and outstanding |
457 | |||
| Treasury stock, held at cost, 190,438 shares |
(2,580 | ) | ||
| Additional paid-in capital |
352,726 | |||
| Accumulated deficit |
(150,662 | ) | ||
| Accumulated other comprehensive loss |
(20,734 | ) | ||
|
|
|
|||
| Total equity |
179,207 | |||
|
|
|
|||
| Total capitalization |
$ | 811,457 | ||
|
|
|
|||
| (1) | Upon consummation of this offering, we will use available cash of approximately $ million to pay a fee of $12.8 million to CD&R to terminate our consulting agreement with them and to pay offering expenses. See “Certain Relationships and Related Party Transactions—Consulting Agreements.” |
| (2) | As of March 25, 2016, we had $17.9 million of letters of credit issued under the ABL Credit Facility and available borrowing capacity of $220.7 million under the ABL Credit Facility. |
42
Table of Contents
If you invest in our common stock in this offering, your ownership interest will be diluted to the extent of the difference between the initial public offering price per share of our common stock and the net tangible book value per share of our common stock. Net tangible book value dilution per share to new investors means that the per share offering price of the common stock exceeds the book value per share attributable to the shares of common stock held by existing stockholders.
Our net tangible book value (deficit) as of , 2016 was $ . Net tangible book value per share before the offering has been determined by dividing net tangible book value (total book value of tangible assets less total liabilities) by the number of shares of common stock outstanding as of , 2016.
We will not receive any proceeds from the sale of common stock by the selling stockholder in this offering. Consequently, this offering will not result in any change to our net tangible deficit per share, prior to giving effect to the payment of estimated fees and expenses in connection with this offering. Purchasing shares of common stock in this offering will result in net tangible book value dilution to new investors of $ per share. The following table illustrates this per share dilution to new investors:
| Per Share | ||||
| Assumed initial public offering price per share |
$ | |||
| Net tangible book value (deficit) per share as of , 2016 |
$ | |||
| Dilution in net tangible book value per share to new investors |
$ | |||
|
|
|
|||
The following table summarizes, as of , 2016, the total number of shares of common stock owned by the existing stockholders prior to the completion of this offering and to be owned by new investors, the total consideration paid and the average price per share paid by the existing stockholders and to be paid by new investors purchasing shares in this offering (amounts in thousands, except share and per share data):
| Shares Purchased | Total Consideration | Average Price Per Share | ||||||||
| Existing stockholders(1) |
$ | $ | ||||||||
| New investors |
||||||||||
|
|
|
|
||||||||
| Total |
$ | |||||||||
|
|
|
|
||||||||
| (1) | Does not give effect to the sale of shares by the selling stockholder in this offering. |
The foregoing table does not reflect stock options outstanding under our stock incentive plans or stock options to be granted after this offering. As of , 2016, there were stock options outstanding with an average exercise price of $ per share. To the extent that any of these stock options are exercised, there may be further dilution to new investors. See “Executive Compensation” and Note 13 to our audited consolidated financial statements included elsewhere in this prospectus.
After giving effect to the sale of shares by the selling stockholder in this offering, new investors will hold shares, or % of the total number of shares of common stock after this offering and existing stockholders will hold % of the total shares outstanding. If the underwriters exercise their option to purchase additional shares in full, the number of shares held by new investors will increase to , or % of the total number of shares of common stock after this offering, and the percentage of shares held by existing stockholders will decrease to % of the total shares outstanding.
In addition, we may choose to raise capital due to market conditions or strategic considerations even if we believe we have sufficient funds for our current or future operating plans. To the extent that capital is raised through the sale of equity or convertible debt securities, the issuance of such securities could result in further dilution to our stockholders.
43
Table of Contents
SELECTED HISTORICAL CONSOLIDATED FINANCIAL DATA
The following tables set forth selected historical financial data as of the dates and for the periods indicated. The selected historical consolidated financial data are presented for two periods: Predecessor and Successor, which relate to the period from September 25, 2010 through December 22, 2010 (preceding the transactions that resulted in the CD&R Investor acquiring a controlling interest in the Company) and the period from December 23, 2010 through September 30, 2011 and all periods subsequent to September 30, 2011 (succeeding such transactions), respectively. The selected historical consolidated financial data as of and for the years ended September 25, 2015 and September 26, 2014 and for the fiscal years ended September 25, 2015, September 26, 2014 and September 27, 2013 have been derived from our audited consolidated financial statements and related notes included elsewhere in this prospectus. The selected historical consolidated financial data as of September 27, 2013, September 28, 2012, the period from December 23, 2010 through September 30, 2011 (Successor) and the period from September 25, 2010 through December 22, 2010 (Predecessor) and for the fiscal year ended September 28, 2012 have been derived from our unaudited consolidated financial statements and related notes not included elsewhere in this prospectus. The selected historical consolidated financial data as of and for the six months ended March 25, 2016 and March 27, 2015 are derived from our unaudited condensed consolidated financial statements included elsewhere in this prospectus. The summary historical statement of operations data for the six months ended March 28, 2014 and the summary historical balance sheet data as of March 28, 2014 are derived from our unaudited condensed consolidated financial statements not included elsewhere in this prospectus. The summary historical statement of operations data, cash flow data and other financial data for the twelve months ended March 25, 2016 are calculated as fiscal year ended September 25, 2015 less six months ended March 27, 2015 plus six months ended March 25, 2016. The summary historical statement of operations data, cash flow data and other financial data for the twelve months ended March 27, 2015 are calculated as fiscal year ended September 26, 2014 less six months ended March 28, 2014 plus six months ended March 27, 2015. Our historical results are not necessarily indicative of the results to be expected for any future period.
44
Table of Contents
This “Selected Historical Consolidated Financial Data” is qualified in its entirety by, and should be read in conjunction with, our audited consolidated financial statements and related notes and our unaudited condensed consolidated financial statements and related notes and “Management’s Discussion and Analysis of Financial Condition and Results of Operations” and the “Prospectus Summary—Summary Historical Consolidated Financial Data” included elsewhere in this prospectus.
| Successor | Predecessor | |||||||||||||||||||||||||||||||||||||||||||||
| Twelve Months Ended | Six Months Ended | Fiscal Year Ended | Period from Dec. 23, 2010 through Sept. 30, 2011 |
Period from Sept. 25, 2010 through Dec. 22, 2010 |
||||||||||||||||||||||||||||||||||||||||||
| (in thousands, except per share |
Mar. 25, 2016 |
Mar. 27, 2015(1) |
Mar. 25, 2016 |
Mar. 27, 2015(1) |
Mar. 28, 2014(2) |
Sept. 25, 2015(1) |
Sept. 26, 2014(2) |
Sept. 27, 2013(3) |
Sept. 28, 2012 |
|||||||||||||||||||||||||||||||||||||
| Statement of Operations Data: |
||||||||||||||||||||||||||||||||||||||||||||||
| Net sales |
$1,581,602 | $ | 1,759,223 | $ | 711,421 | $ | 858,987 | $ | 802,602 | $ | 1,729,168 | $ | 1,702,838 | $ | 1,475,897 | $ | 1,549,325 | $ | 1,135,212 | $ | 303,764 | |||||||||||||||||||||||||
| Cost of sales |
1,268,201 | 1,521,794 | 547,602 | 735,776 | 689,710 | 1,456,375 | 1,475,728 | 1,264,348 | 1,305,432 | 981,525 | 255,399 | |||||||||||||||||||||||||||||||||||
|
|
|
|
|
|
|
|
|
|
|
|
|
|
|
|
|
|
|
|
|
|
|
|||||||||||||||||||||||||
| Gross profit |
313,401 | 237,429 | 163,819 | 123,211 | 112,892 | 272,793 | 227,110 | 211,549 | 243,893 | 153,687 | 48,365 | |||||||||||||||||||||||||||||||||||
| Selling, general and administrative |
199,056 | 178,072 | 98,020 | 84,779 | 87,533 | 185,815 | 180,783 | 160,749 | 162,845 | 147,865 | 37,146 | |||||||||||||||||||||||||||||||||||
| Intangible asset amortization |
22,666 | 20,976 | 11,089 | 10,526 | 10,407 | 22,103 | 20,857 | 15,317 | 14,939 | 10,205 | 16 | |||||||||||||||||||||||||||||||||||
| Asset impairment charges(4) |
27,937 | 44,381 | — | — | — | 27,937 | 44,424 | 9,161 | 12,153 | — | — | |||||||||||||||||||||||||||||||||||
|
|
|
|
|
|
|
|
|
|
|
|
|
|
|
|
|
|
|
|
|
|
|
|||||||||||||||||||||||||
| Operating income (loss) |
63,742 | (6,000 | ) | 54,710 | 27,906 | 14,952 | 36,938 | (18,954 | ) | 26,322 | 53,956 | (4,383 | ) | 11,203 | ||||||||||||||||||||||||||||||||
| Interest expense, net |
42,845 | 43,286 | 20,448 | 22,412 | 23,392 | 44,809 | 44,266 | 47,869 | 50,113 | 38,139 | 10,976 | |||||||||||||||||||||||||||||||||||
| (Gain) loss on extinguishment of debt(5) |
(1,661) | 40,913 | (1,661) | — | 2,754 | — | 43,667 | — | — | — | — | |||||||||||||||||||||||||||||||||||
|
|
|
|
|
|
|
|
|
|
|
|
|
|
|
|
|
|
|
|
|
|
|
|||||||||||||||||||||||||
| Income (loss) from operations before income taxes |
22,558 | (90,199 | ) | 35,923 | 5,494 | (11,194 | ) | (7,871 | ) | (106,887 | ) | (21,547 | ) | 3,843 | (42,522 | ) | 227 | |||||||||||||||||||||||||||||
| Income tax expense (benefit) |
7,972 | (30,558 | ) | 13,344 | 2,456 | 75 | (2,916 | ) | (32,939 | ) | (2,966 | ) | (3,347 | ) | (9,849 | ) | 382 | |||||||||||||||||||||||||||||
|
|
|
|
|
|
|
|
|
|
|
|
|
|
|
|
|
|
|
|
|
|
|
|||||||||||||||||||||||||
| Income (loss) from continuing operations |
14,586 | (59,641 | ) | 22,579 | 3,038 | (11,269) | (4,955 | ) | (73,948 | ) | (18,581 | ) | 7,190 | (32,673 | ) | (155 | ) | |||||||||||||||||||||||||||||
| Loss from discontinued |
— | — | — | — | — | — | — | (42,654 | ) | (5,142 | ) | (2,337 | ) | (3,270 | ) | |||||||||||||||||||||||||||||||
| (Expense) benefit for income taxes |
— | — | — | — | — | — | — | (2,791 | ) | 1,129 | (254 | ) | 251 | |||||||||||||||||||||||||||||||||
|
|
|
|
|
|
|
|
|
|
|
|
|
|
|
|
|
|
|
|
|
|
|
|||||||||||||||||||||||||
| Net income (loss) |
$ | 14,586 | $ | (59,641 | ) | $ | 22,579 | $ | 3,038 | $ | (11,269 | ) | $ | (4,955 | ) | $ | (73,948 | ) | $ | (61,235 | ) | $ | 2,048 | $ | (35,010 | ) | $ | (3,425 | ) | |||||||||||||||||
|
|
|
|
|
|
|
|
|
|
|
|
|
|
|
|
|
|
|
|
|
|
|
|
||||||||||||||||||||||||
| Convertible preferred stock and dividends |
— | 3,259 | — | — | 25,796 | — | 29,055 | 47,234 | 41,967 | 28,374 | ||||||||||||||||||||||||||||||||||||
| Net income (loss) attributable to common stockholders |
14,586 | (62,900 | ) | 22,579 | 3,038 | (37,065 | ) | (4,955 | ) | (103,003 | ) | (108,469 | ) | 39,919 | (63,384 | ) | ||||||||||||||||||||||||||||||
| Weighted average shares outstanding: |
||||||||||||||||||||||||||||||||||||||||||||||
| Basic |
45,619 | 45,162 | 45,653 | 45,648 | 43,184 | 45,640 | 37,225 | 29,740 | 29,699 | 29,499 | ||||||||||||||||||||||||||||||||||||
| Diluted |
45,619 | 45,162 | 45,653 | 45,648 | 43,184 | 45,640 | 37,225 | 29,740 | 29,699 | 29,499 | ||||||||||||||||||||||||||||||||||||
| Net income (loss) per share: |
||||||||||||||||||||||||||||||||||||||||||||||
| Basic |
$ | 0.32 | $ | (1.39 | ) | $ | 0.49 | $ | 0.07 | $ | (0.86 | ) | $ | (0.11 | ) | $ | (2.77 | ) | $ | (3.65 | ) | $ | (1.34 | ) | $ | (2.15 | ) | |||||||||||||||||||
| Diluted |
$ | 0.32 | $ | (1.39 | ) | $ | 0.49 | $ | 0.07 | $ | (0.86 | ) | $ | (0.11 | ) | $ | (2.77 | ) | $ | (3.65 | ) | $ | (1.34 | ) | $ | (2.15 | ) | |||||||||||||||||||
| Balance Sheet Data (at end of period): |
||||||||||||||||||||||||||||||||||||||||||||||
| Cash and cash equivalents |
$ | 134,477 | $ | 24,608 | $ | 134,477 | $ | 24,608 | $ | 28,771 | $ | 80,598 | $ | 33,360 | $ | 54,770 | $ | 51,927 | $ | 47,714 | ||||||||||||||||||||||||||
| Total assets |
1,118,605 | 1,237,592 | 1,118,605 | 1,237,592 | 1,282,407 | 1,113,799 | 1,185,419 | 1,272,195 | 1,267,996 | 1,333,700 | ||||||||||||||||||||||||||||||||||||
| Long-term debt, including current maturities |
632,250 | 728,191 | 632,250 | 728,191 | 464,266 | 652,208 | 692,867 | 451,297 | $ | 389,633 | $ | 430,916 | ||||||||||||||||||||||||||||||||||
| Cumulative convertible preferred stock |
— | — | — | — | 449,371 | — | — | 423,576 | 376,341 | 334,374 | ||||||||||||||||||||||||||||||||||||
| Total equity |
179,207 | 177,681 | 179,207 | 177,681 | 499,799 | 156,277 | 176,469 | 510,377 | 543,378 | 552,581 | ||||||||||||||||||||||||||||||||||||
| Cash Flow Data: |
||||||||||||||||||||||||||||||||||||||||||||||
| Cash flows provided by (used in): |
||||||||||||||||||||||||||||||||||||||||||||||
| Operating activities |
$ | 223,303 | $ | 83,789 | $ | 82,157 | $ | (73) | $ | 2,471 | $ | 141,073 | $ | 86,333 | $ | 35,424 | $ | 58,361 | $ | 67,993 | ||||||||||||||||||||||||||
| Investing activities |
(14,700 | ) | (52,548 | ) | (8,511) | (40,452) | (36,764 | ) | (46,641 | ) | (48,860 | ) | (87,252 | ) | (12,750 | ) | (49,429 | ) | ||||||||||||||||||||||||||||
| Financing activities |
(97,451 | ) | 3,453 | (19,973) | 33,372 | 8,509 | (44,106 | ) | (57,584 | ) | 55,823 | (41,246 | ) | 18,880 | ||||||||||||||||||||||||||||||||
| Other Financial Data: |
||||||||||||||||||||||||||||||||||||||||||||||
| Adjusted net sales(7) |
$ | 1,487,055 | $ | 1,565,225 | $ | 703,605 | $ | 767,125 | $ | 712,050 | $ | 1,550,575 | $ | 1,510,150 | $ | 1,277,175 | $ | 1,347,848 | $ | 993,130 | $ | 256,403 | ||||||||||||||||||||||||
| Adjusted EBITDA(8) |
207,101 | 130,244 | 106,414 | 63,263 | 59,616 | 163,950 | 126,597 | 111,559 | 124,877 | 61,888 | 12,408 | |||||||||||||||||||||||||||||||||||
| Adjusted EBITDA Margin(8) |
13.9 | % | 8.3 | % | 15.1% | 8.2% | 8.4 | % | 10.6 | % | 8.4 | % | 8.7 | % | 9.3 | % | 6.2 | % | 4.8 | % | ||||||||||||||||||||||||||
| Capital expenditures |
23,316 | 25,927 | 9,014 | 12,547 | 10,341 | 26,849 | 24,362 | 14,999 | 19,192 | 37,098 | 10,324 | |||||||||||||||||||||||||||||||||||
| (1) | Includes results of operations of APPI and SCI from October 20, 2014 and November 17, 2014, respectively. |
| (2) | Includes results of operations of Ridgeline from October 11, 2013. |
| (3) | Includes results of Heritage Plastics and Liberty Plastics from September 17, 2013. |
| (4) | We recorded asset impairments of $27.9 million for fiscal 2015, of which $24.0 million relates to long-lived assets from the closure of a Philadelphia, Pennsylvania facility. The remaining $3.9 million represents impairment of goodwill from our SCI acquisition, which is part of our Electrical Raceway reportable segment. We recorded asset impairments of $44.4 million for fiscal 2014, of which, $43.0 million represents goodwill impairment from a reporting unit within our MP&S reportable segment. The remaining $1.4 million primarily represents a $0.9 million impairment of trade names of our Razor Ribbon and Columbia MBF commercial businesses. We recorded asset |
45
Table of Contents
| impairments of $9.2 million for fiscal 2013, which includes $5.9 million to adjust the carrying value of several held-for-sale facilities recorded at fair value. The remaining $3.3 million represents a write-down of property, plant and equipment of our Acroba business located in France. We recorded $12.2 million for fiscal 2012, which included $6.6 million related to the write-down of an Enterprise Resource Planning system and $5.3 million to adjust the carrying value of a manufacturing facility reported as held for sale. See Notes 6 and 15 to our audited consolidated financial statements included elsewhere in this prospectus for further detail. |
| (5) | Incurred in connection with the redemption in fiscal 2014 of AII’s Senior Notes. See Note 8 to our audited consolidated financial statements included elsewhere in this prospectus for further detail. |
| (6) | We divested our business in Brazil during fiscal 2013, which was reported as a discontinued operation. See Note 18 to our audited consolidated financial statements included elsewhere in this prospectus for further detail. |
| (7) | For the complete definition of Adjusted net sales, see “Prospectus Summary—Summary Historical Consolidated Financial Data.” The following table sets forth a reconciliation of net sales to Adjusted net sales for the periods presented: |
| Successor | Predecessor | |||||||||||||||||||||||||||||||||||||||||||||
| ($ in thousands) |
Twelve Months Ended | Six Months Ended | Fiscal Year Ended | Period from March 23, 2010 through September 30, 2011 |
Period from September 25, 2010 through December 22, 2010 |
|||||||||||||||||||||||||||||||||||||||||
| March 25, 2016 |
March 27, 2015 |
March 25, 2016 |
March 27, 2015 |
March 28, 2014 |
September 25, 2015 |
September 26, 2014 |
September 27, 2013 |
September 28, 2012 |
||||||||||||||||||||||||||||||||||||||
| Net sales |
$ | 1,581,602 | $ | 1,759,223 | $ | 711,421 | $ | 858,987 | $ | 802,602 | $ | 1,729,168 | $ | 1,702,838 | $ | 1,475,897 | $ | 1,549,325 | $ | 1,135,212 | $ | 303,764 | ||||||||||||||||||||||||
| Impact of Fence and Sprinkler exit |
(94,547 | ) | (193,998 | ) | (7,816) | (91,862 | (90,552) | (178,593 | ) | (192,688 | ) | (198,722 | ) | (201,477 | ) | (142,082 | ) | (47,361 | ) | |||||||||||||||||||||||||||
|
|
|
|
|
|
|
|
|
|
|
|
|
|
|
|
|
|
|
|
|
|
|
|||||||||||||||||||||||||
| Adjusted net sales |
$ | 1,487,055 | $ | 1,565,225 | $ | 703,605 | $ | 767,125 | $ | 712,050 | $ | 1,550,575 | $ | 1,510,150 | $ | 1,277,175 | $ | 1,347,848 | $ | 993,130 | $ | 256,403 | ||||||||||||||||||||||||
|
|
|
|
|
|
|
|
|
|
|
|
|
|
|
|
|
|
|
|
|
|
|
|||||||||||||||||||||||||
| (8) | For the complete definition of Adjusted EBITDA and Adjusted EBITDA margin, see “Prospectus Summary—Summary Historical Consolidated Financial Data.” The following table sets forth a reconciliation of net income (loss) to Adjusted EBITDA for the periods presented: |
| Successor | Predecessor | |||||||||||||||||||||||||||||||||||||||||||||
| Twelve Months Ended |
Six Months Ended | Fiscal Year Ended | Period from December 23, 2010 through September 30, 2011 |
Period from September 25, 2010 through December 22, 2010 |
||||||||||||||||||||||||||||||||||||||||||
| ($ in thousands) |
March 25, 2016 |
March 27, 2015 |
March 25, 2016 |
March 27, 2015 |
March 28, 2014 |
September 25, 2015 |
September 26, 2014 |
September 27, 2013 |
September 28, 2012 |
|||||||||||||||||||||||||||||||||||||
| Net income (loss) |
$ | 14,586 | $ | (59,641 | ) | $ | 22,579 | $ | 3,038 | $ | (11,269 | ) | $ | (4,955 | ) | $ | (73,948 | ) | $ | (61,235 | ) | $ | 2,048 | $ | (35,010 | ) | $ | (3,425 | ) | |||||||||||||||||
| Loss from discontinued operations, net of income tax expense |
— | — | — | — | — | — | — | 42,654 | 5,142 | 2,337 | 3,270 | |||||||||||||||||||||||||||||||||||
| Depreciation and amortization |
57,183 | 58,568 | 26,742 | 29,024 | 29,151 | 59,465 | 58,695 | 48,412 | 38,587 | 11,572 | 671 | |||||||||||||||||||||||||||||||||||
| (Gain) loss on extinguishment of debt |
(1,661 | ) | 40,913 | (1,661) | — | 2,754 | — | 43,667 | — | — | — | — | ||||||||||||||||||||||||||||||||||
| Interest expense, net |
42,845 | 43,286 | 20,448 | 22,412 | 23,392 | 44,809 | 44,266 | 47,869 | 50,113 | 38,139 | 10,976 | |||||||||||||||||||||||||||||||||||
| Income tax expense (benefit) |
7,972 | (30,558 | ) | 13,344 | 2,456 | 75 | (2,916 | ) | (32,939 | ) | (2,966 | ) | (3,347 | ) | (9,849 | ) | 382 | |||||||||||||||||||||||||||||
| Restructuring and impairments(a) |
34,605 | 46,597 | 2,069 | 167 | 258 | 32,703 | 46,687 | 10,931 | 12,731 | 2,114, | (1,234 | ) | ||||||||||||||||||||||||||||||||||
| Net periodic pension benefit cost(b) |
509 | 973 | 220 | 289 | 684 | 578 | 1,368 | 3,371 | 2,935 | 1,218 | 406 | |||||||||||||||||||||||||||||||||||
| Stock-based compensation(c) |
23,765 | 8,800 | 12,043 | 1,801 | 1,398 | 13,523 | 8,398 | 2,199 | 1,035 | 557 | 863 | |||||||||||||||||||||||||||||||||||
| ABF product liability impact(d) |
(913 | ) | 2,833 | 425 | 1,122 | 1,130 | (216 | ) | 2,841 | 1,383 | 3,437 | 1,429 | — | |||||||||||||||||||||||||||||||||
| Consulting fee(e) |
3,500 | 3,604 | 1,750 | 1,750 | 3,000 | 3,500 | 4,854 | 6,000 | 6,000 | 4,500 | 1,500 | |||||||||||||||||||||||||||||||||||
| Multi-employer pension withdrawal(f) |
— | — | — | — | — | — | — | 7,290 | — | — | — | |||||||||||||||||||||||||||||||||||
| Transaction costs(g) |
8,316 | 2,975 | 3,431 | 1,154 | 3,228 | 6,039 | 5,049 | 1,780 | 1,258 | 18,829 | (1,529 | ) | ||||||||||||||||||||||||||||||||||
| Other(h) |
16,748 | 11,422 | 4,213 | 1,770 | 3,004 | 14,305 | 12,656 | 7,685 | 8,092 | 30,217 | 1,916 | |||||||||||||||||||||||||||||||||||
| Impact of Fence and Sprinkler(i) |
(354 | ) | 472 | 811 | (1,720 | ) | 2,811 | (2,885 | ) | 5,003 | (3,814 | ) | (3,154 | ) | (4,166 | ) | (1,389 | ) | ||||||||||||||||||||||||||||
|
|
|
|
|
|
|
|
|
|
|
|
|
|
|
|
|
|
|
|
|
|
|
|||||||||||||||||||||||||
| Adjusted EBITDA |
$ | 207,101 | $ | 130,244 | $ | 106,414 | $ | 63,263 | $ | 59,616 | $ | 163,950 | $ | 126,597 | $ | 111,559 | $ | 124,877 | $ | 61,888 | $ | 12,408 | ||||||||||||||||||||||||
|
|
|
|
|
|
|
|
|
|
|
|
|
|
|
|
|
|
|
|
|
|
|
|||||||||||||||||||||||||
| (a) | Restructuring amounts represent exit or disposal costs including termination benefits and facility closure costs. Impairment amounts represent write-downs of goodwill, intangible assets and/or long-lived assets. See Notes 6 and 15 to our audited consolidated financial statements and Notes 6 and 14 to our unaudited condensed consolidated financial statements included elsewhere in this prospectus for further detail. |
| (b) | Represents pension costs in excess of cash funding for pension obligations in the period. See Note 10 to our audited consolidated financial statements and Note 10 to our unaudited condensed consolidated statements included elsewhere in this prospectus in further detail. |
| (c) | Represents stock-based compensation expenses related to options awards and restricted stock units. See Note 13 to our audited consolidated financial statements and Note 12 to our unaudited condensed consolidated financial statements included elsewhere in this prospectus for further detail. |
| (d) | Represents changes in our estimated exposure to ABF matters. See Note 16 to our audited consolidated financial statements and Note 15 to our unaudited condensed consolidated financial statements included elsewhere in this prospectus for further detail. |
| (e) | Represents amounts paid to CD&R and, until April 9, 2014, to Tyco. In connection with this offering, we expect to enter into a termination agreement with CD&R, pursuant to which the parties will agree to terminate this consulting fee. See “Certain Relationships and Related Party Transactions—Consulting Agreement.” See Note 3 to our audited consolidated financial statements and Note 3 to our unaudited condensed consolidated financial statements included elsewhere in this prospectus for further detail. |
| (f) | Represents our proportional share of a multi-employer pension liability from which we withdrew in fiscal 2013. See Note 10 to our audited financial statements included elsewhere in this prospectus for further detail. |
| (g) | Represents expenses associated with acquisition and divestiture-related activities. |
| (h) | Represents other items, such as lower-of-cost-or-market inventory adjustments and the impact of foreign exchange gains or losses related to our divestiture in Brazil. |
| (i) | Represents historical performance of Fence and Sprinkler and related operating costs. |
46
Table of Contents
MANAGEMENT’S DISCUSSION AND ANALYSIS OF FINANCIAL CONDITION
AND RESULTS OF OPERATIONS
The following information should be read in conjunction with our audited consolidated financial statements and related notes and our unaudited condensed consolidated financial statements and related notes included elsewhere in this prospectus, “Prospectus Summary—Summary Historical Consolidated Financial Data” and “Selected Historical Consolidated Financial Data.” The following discussion may contain forward-looking statements that reflect our plans, estimates and beliefs. Our actual results could differ materially from those discussed in these forward-looking statements. Factors that could cause or contribute to these differences include those factors discussed below and elsewhere in this prospectus, particularly under the captions “Risk Factors” and “Special Note Regarding Forward-Looking Statements and Information.” The percentages provided below reflect rounding adjustments. Accordingly, figures expressed as percentages when aggregated may not be the arithmetic sum of the percentages that precede them.
Company Overview
We are a leading manufacturer of Electrical Raceway products primarily for the non-residential construction and renovation markets and MP&S for the construction and industrial markets. Electrical Raceway products form the critical infrastructure that enables the deployment, isolation and protection of a structure’s electrical circuitry from the original power source to the final outlet. MP&S frame, support and secure component parts in a broad range of structures, equipment and systems in electrical, industrial and construction applications. We believe we hold #1 or #2 positions in the United States by net sales in the vast majority of our products. The quality of our products, the strength of our brands and our scale and national presence provide what we believe to be a unique set of competitive advantages that position us for profitable growth.
Prior to December 2010, we operated as the Tyco Electrical and Metal Products, or “TEMP,” business of Tyco. In December 2010, an affiliate of Tyco completed the sale to the CD&R Investor of a 51% stake in the Company. In April 2014, we acquired all of the shares of our common stock then held by an affiliate of Tyco. For further discussion of our corporate history, see “Business—Company History.” Since our separation from Tyco, we have undertaken a significant transformation of our business, including:
| • | the acquisition of six businesses, which have strengthened and extended our capabilities and offerings across our entire product portfolio; |
| • | the divestiture and permanent closure of businesses that we considered non-core operations due to unfavorable competitive positions or cost structures; |
| • | significant upgrades in our management team, with over 90% of our executives and 70% of our senior leadership in new roles or new to the Company since 2011; and |
| • | the development and implementation of ABS, a foundational set of principles, behaviors and beliefs based on driving excellence in strategy, people and processes. |
This proactive optimization of our portfolio has enabled us to focus on our core businesses, improve our mix of higher margin products, drive market share gains and improve overall profitability.
Business Factors Influencing our Results of Operations
The following factors may affect our results of operations in any given period:
Economic Conditions. Our business depends on demand from customers across various end markets, including wholesale distributors, OEMs, retail distributors and general contractors. Our products are primarily used by trade contractors in the construction and renovation of non-residential structures such as commercial
47
Table of Contents
office buildings, healthcare facilities and manufacturing plants. In fiscal 2015, 93% of our net sales were to customers located in the United States. As a result, our business is heavily dependent on the health of the U.S. economy, in general, and on U.S. non-residential construction activity, in particular. A stronger U.S. economy and robust non-residential construction generally increase demand for our products.
We believe that our business and demand for our products is influenced by two main economic indicators: U.S. gross domestic product, or “GDP,” and non-residential construction starts, measured in square footage. The U.S. non-residential construction market has experienced modest growth over the past few years, in line with U.S. GDP. Our historic results have been positively impacted by growth in the non-residential construction market, as such growth leads to greater demand for our products. MR&R activity generally increases and represents a greater share of non-residential construction activity during challenging periods in the economic or construction cycle. During those periods, our MR&R demand as a percentage of total demand typically increases, providing a more consistent revenue stream for our business.
Raw Materials. We use a variety of raw materials in the manufacture of our products, which primarily include steel, copper and PVC resin. We believe that sources for these raw materials are well established, generally available and are in sufficient quantity that we may avoid disruption in our business. The cost to procure these raw materials is subject to price fluctuations, often as a result of macroeconomic conditions. Our cost of sales may be affected by changes in the market price of these materials, and to a lesser extent other commodities, such as zinc, electricity, natural gas and diesel fuel. The prices at which we sell our products may adjust upward or downward based on raw material price changes. We believe several factors drive the pricing of our products, including the quality of our products, the ability to meet customer delivery expectations and co-loading capabilities as well as the prices of our raw material inputs. Historically, we have not engaged in hedging strategies for raw material purchases. Our results may be impacted by inventory liquidations at costs higher or lower than current prices we pay for similar items.
Working Capital. Our working capital requirements are impacted by our operational activities. Our inventory levels may be impacted from time to time, due to delivery lead times from our suppliers. We are typically obligated to pay for our raw material purchases within 10 and 30 days of their receipt, while we generally collect cash from the sale of our manufactured products between 40 and 50 days from the point at which title and risk of loss transfers.
Seasonality. In a typical year, our operating results are impacted by seasonality. Historically, sales of our products have been higher in the third and fourth quarters of each fiscal year due to favorable weather for construction-related activities.
Recent Acquisitions. In addition to our organic growth, we have transformed our Company through acquisitions in recent years, allowing us to expand our product offerings with existing and new customers. In accordance with GAAP, the results of our acquisitions are reflected in our financial statements from the date of each acquisition forward.
Our acquisition strategy has focused primarily on growing market share by complementing our existing portfolio with synergistic products and expanding into end-markets that we have not previously served. In total, we have invested over $200 million in acquisitions since 2011. In 2012, we acquired Flexhead Industries, or “Flexhead,” a leading manufacturer of flexible sprinkler drops that provided a set of higher margin, value-added products to our MP&S portfolio. Flexhead’s products provide engineers, architects, contractors and building owners with solutions for rapid installation, simple relocation and system versatility for commercial ceilings applications.
Product diversification has been a core element to our growth strategy. Prior to 2013, our Electrical Raceway offering primarily consisted of steel and copper products. At that time, we produced PVC conduit from a single facility in Georgia, and we did not have a meaningful presence in the market. In 2013 and 2014, we completed the acquisitions of Heritage Plastics, Liberty Plastics, Ridgeline and APPI, which significantly
48
Table of Contents
increased our portfolio of PVC products, including PVC conduit, fittings, elbows and sweeps. The additional scale, which included new operations in the Northeast, Midwest, Southwest and Western United States, enabled us to more comprehensively serve our largest electrical distribution customers in this product line and significantly increased our market share and presence in the Electrical Raceway market. These acquisitions also substantially increased our cross-selling opportunities, providing a meaningful avenue for growth going forward.
In 2015, we acquired SCI, a manufacturer of electrical fittings for steel, flexible and liquidtight conduit as well as armored cable. SCI enhanced the breadth of our product portfolio and is representative of the opportunities we have in our fragmented markets to add complementary products that will further support our growth and customer value proposition. We expect to continue to pursue synergistic acquisitions as part of our growth strategy to expand our product offerings.
See Note 2 to our audited consolidated financial statements included elsewhere in this prospectus for further detail.
Divestitures and Restructurings. Since 2011, we have continuously evaluated our operations to ensure that we are investing resources strategically. Our assessment has included existing operating performance, required levels of investment to improve performance and the overall complexities of doing business in certain markets and geographic regions. After careful consideration, we streamlined our business through a combination of business divestitures, asset sales and the exit of certain product lines.
In 2012, we sold our interest in a joint venture in Saudi Arabia that represented our only investment in the Middle East because we determined that it did not provide sufficient earnings or strategic value to support the complexities of managing foreign operations. During that same year, we also sold two low-margin, commodity-oriented businesses in the United States for which we had limited market presence or competitive differentiation—our hollow structural tube business based in Morrisville, Pennsylvania and our sprinkler system fabrication business. During 2013, we further reduced our non-domestic footprint by closing one facility in Brazil, selling the remainder of our Brazilian operations and closing our Acroba subsidiary in France. Exiting these international businesses allowed us to generate cash, eliminate low-margin businesses from our portfolio and mitigate various risks, such as foreign currency exposure and the general complexities of managing operations outside the United States.
In April 2014, AII refinanced its then outstanding indebtedness with the proceeds of the Term Loan Facilities. AII paid a dividend to AIH with a portion of the proceeds of the Term Loan Facilities, and AIH in turn paid a dividend to us to fund our acquisition of all of the shares of our common stock then held by the Tyco Seller for an aggregate cash purchase price of approximately $250.0 million.
In 2015, we exited Fence and Sprinkler, two product lines that did not align with our long-term vision due to limited product differentiation, exposure to significant import competition, ongoing price pressure due to overcapacity in the market and having different channels to market than our Electrical Raceway and MP&S segments. In conjunction with the exit from Fence and Sprinkler, we evaluated the viability of a Philadelphia, Pennsylvania manufacturing facility and determined that significant investment would be required to bring that facility to an acceptable level of operation. Given our ability to shift ongoing production capacity from that facility to other existing facilities, we closed this facility in the first quarter of fiscal 2016. Neither Fence nor Sprinkler constituted a component with a significance level that would have required presentation as discontinued operations.
See Notes 15 and 18 to our audited consolidated financial statements included elsewhere in this prospectus for further detail.
49
Table of Contents
Foreign currencies. In fiscal 2015, approximately 6% of our net sales came from customers located outside the United States, most of which were foreign currency sales denominated in Canadian dollars, British pounds sterling, Australian dollars, Chinese Yuan and New Zealand dollars. The functional currency of our operations outside the United States is generally the local currency. Assets and liabilities of our non-U.S. subsidiaries are translated into U.S. dollars using period-end exchange rates. Foreign revenue and expenses are translated at the monthly average exchange rates in effect during the period. Foreign currency translation adjustments are included as a component of accumulated other comprehensive loss within our statements of comprehensive loss. See “—Quantitative and Qualitative Disclosures about Market Risk—Foreign Currency Risk.”
See Note 1 to our audited consolidated financial statements included elsewhere in this prospectus for further detail.
Emerging Industry Trends. In addition to U.S. GDP and non-residential construction starts, there are emerging industry trends that we believe will drive further demand for our products. These include new building technologies which enhance facility management, such as automation and LED lighting systems, as well as the rapid expansion of certain non-residential construction categories, including data centers and healthcare facilities. In recent years, technological advancements aimed at improving facility management have been driven by a number of factors, including integration and interoperability, the proliferation of the Internet and associated increases in data and power requirements and a desire to reduce costs through improved energy efficiency, lighting systems and operating effectiveness. We believe that these trends will drive greater needs for electrical capacity and circuitry, increasing the demand for many of our products. We also target high growth end-markets that are projected to experience rapid growth and to drive demand for our products, including our framing and support products. According to Dodge non-residential construction data, healthcare sector construction activity is projected to grow at a CAGR of 8.6% between 2015 and 2018. Lastly, based on third-party data, growth in the data center construction market in the United States is forecast to grow at a CAGR of 4.2% between 2014 and 2019 and, between 2015 and 2020, the building lighting control systems market in the United States is forecast to grow at a CAGR of 5%, while the LED lighting market in North America is forecast to grow at a CAGR of 13%.
Reportable Segments
We operate our business through two operating segments which are also our reportable segments: Electrical Raceway and MP&S. Our operating segments are organized based on primary market channel and, in most instances, the end use of products. We review the results of our operating segments separately for the purposes of making decisions about resource allocation and performance assessment. We evaluate performance on the basis of net sales, Adjusted net sales and Adjusted EBITDA. See Note 18 to our audited consolidated financial statements included elsewhere in this prospectus for further detail.
Intersegment transactions primarily consist of product sales at transfer prices which we set on an arms-length basis. Gross profit earned and reported within each segment from such transactions is eliminated in our consolidated results. Certain manufacturing and distribution expenses are allocated between our operating segments on a pro rata basis due to the shared nature of activities. Certain assets, such as machinery and equipment and facilities, are not allocated to each segment despite serving both segments. These shared assets are reported within the MP&S segment. We allocate certain corporate operating expenses that directly benefit our operating segments, such as insurance and information technology, on a basis that reasonably approximates an estimate of the use of these services.
In addition to our operating segments, our consolidated financial results include “Corporate.” Corporate consists of unallocated selling, general and administrative activities and associated expenses including executive, legal, finance, human resources, information technology, business development and communications. In addition, certain costs and earnings of employee-related benefits plans, such as stock-based compensation and the portion of medical costs for which the Company is self-insured, are included in Corporate and not allocated to our operating segments. Corporate also reflects our cash pooling structures and borrowings under the Credit Facilities to meet liquidity needs.
50
Table of Contents
Fiscal Year
We have a 52- or 53-week fiscal year that ends on the last Friday in September. Fiscal 2015, 2014 and 2013 were 52-week fiscal years which ended on September 25, 2015, September 26, 2014 and September 27, 2013, respectively. Our next fiscal year will end on September 30, 2016 and will be a 53-week year. Our fiscal quarters end on the last Friday in December, March and June.
Key Components of Results of Operations
Net sales
Net sales represents external sales of Electrical Raceway products to the non-residential construction and MR&R markets and MP&S products and solutions to the commercial and industrial markets. Net sales includes gross product sales and freight billed to our customers, net of allowances for rebates, sales incentives, trade promotions, product returns and discounts.
Adjusted net sales
We present Adjusted net sales to facilitate comparisons of reported net sales from period to period within our MP&S segment. In August 2015, we announced plans to exit Fence and Sprinkler in order to re-align our long-term strategic focus. These product lines were discontinued during the first quarter of fiscal 2016. Management uses Adjusted net sales to evaluate our ongoing business operations, which no longer include Fence and Sprinkler. For further discussion on Adjusted net sales, including the definition thereof and a reconciliation to net sales, see “Prospectus Summary—Summary Historical Consolidated Financial Data.”
Cost of sales
Cost of sales includes all costs directly related to the production of goods for sale. These costs include direct material, direct labor, production related overheads, excess and obsolescence costs, lower-of-cost-or-market provisions, freight and distribution costs and the depreciation and amortization of assets directly used in the production of goods for sale.
Gross profit
Gross profit represents the difference between our net sales and cost of sales.
Selling, general and administrative expenses
Selling, general and administrative costs includes payroll related expenses including salaries, wages, employee benefits, payroll taxes, variable cash compensation for both administrative and selling personnel and consulting and professional services fees and other recurring costs as we prepare to be a public company. Also included are compensation expense for share-based awards, restructuring-related charges, third-party professional services and translation gains or losses for foreign currency transactions.
Adjusted EBITDA and Adjusted EBITDA margin
We use Adjusted EBITDA and Adjusted EBITDA Margin in evaluating the performance of our business. We use Adjusted EBITDA and Adjusted EBITDA Margin in the preparation of our annual operating budgets and as indicators of business performance. We believe Adjusted EBITDA and Adjusted EBITDA Margin allow us to readily view operating trends, perform analytical comparisons and identify strategies to improve operating performance. For further discussion on Adjusted EBITDA and Adjusted EBITDA Margin, including definitions thereof and a reconciliation of net income (loss) to Adjusted EBITDA, see “Prospectus Summary—Summary Historical Consolidated Financial Data.”
51
Table of Contents
Results of Operations—Twelve Months Ended March 25, 2016 and March 27, 2015
| Twelve Months Ended | ||||||||||||||||
| ($ in thousands) |
March 25, 2016 |
March 27, 2015 |
Change | % Change |
||||||||||||
| Net sales |
$ | 1,581,602 | $ | 1,759,223 | $ | (177,621 | ) | (10.10 | )% | |||||||
| Cost of sales |
1,268,201 | 1,521,794 | (253,593 | ) | (16.66 | )% | ||||||||||
|
|
|
|
|
|
|
|||||||||||
| Gross profit |
313,401 | 237,429 | 75,972 | 32.00 | % | |||||||||||
| Selling, general and administrative |
199,056 | 178,072 | 20,984 | 11.78 | % | |||||||||||
| Intangible asset amortization |
22,666 | 20,976 | 1,690 | 8.06 | % | |||||||||||
| Asset impairment charges |
27,937 | 44,381 | (16,444 | ) | (37.05 | )% | ||||||||||
|
|
|
|
|
|
|
|||||||||||
| Operating income (loss) |
63,742 | (6,000 | ) | 69,742 | * | |||||||||||
| Interest expense, net |
42,845 | 43,286 | (441 | ) | (1.02 | )% | ||||||||||
| Loss (gain) on extinguishment of debt |
(1,661 | ) | 40,913 | (42,574 | ) | * | ||||||||||
|
|
|
|
|
|
|
|||||||||||
| Income (loss) from operations before income taxes |
22,558 | (90,199 | ) | 112,757 | * | |||||||||||
| Income tax expense (benefit) |
7,972 | (30,558 | ) | 38,530 | * | |||||||||||
|
|
|
|
|
|
|
|||||||||||
| Net income (loss) |
$ | 14,586 | $ | (59,641 | ) | $ | 74,227 | * | ||||||||
|
|
|
|
|
|
|
|||||||||||
| Non-GAAP financial data |
||||||||||||||||
| Adjusted net sales |
1,487,055 | 1,565,225 | (78,170 | ) | (4.99 | )% | ||||||||||
| Adjusted EBITDA |
207,101 | 130,245 | 76,856 | 59.01 | % | |||||||||||
| Adjusted EBITDA Margin |
13.9 | % | 8.3 | % | ||||||||||||
| * | Not meaningful |
Twelve Months Ended March 25, 2016 Compared to March 27, 2015
Net sales
Net sales decreased $177.6 million, or 10.1%, for the twelve months ended March 25, 2016 to $1,581.6 million, compared to $1,759.2 million for the twelve months ended March 27, 2015. The decrease was primarily due to $99.5 million related to the Fence and Sprinkler exit, which we announced in the fourth quarter of fiscal 2015. These product lines were fully discontinued in the first quarter of fiscal 2016. Net sales also declined $63.4 million due to lower average selling prices as a result of lower raw material prices during the period and lower sales volume of $25.6 million. The decline in sales volume is primarily due to a change in the mix of our products, in particular armored cable and fittings products, sold to focus on higher margin products. Lastly, net sales declined $14.2 million due to an unfavorable foreign exchange impact resulting from a stronger U.S. dollar on reported foreign currency sales. These declines were offset in part by $23.9 million of increased sales from our APPI and SCI businesses which were acquired in the first quarter of fiscal 2015 and increased freight revenue of $1.2 million.
Cost of sales
Cost of sales decreased $253.6 million, or 16.7%, for the twelve months ended March 25, 2016 to $1,268.2 million, compared to $1,521.8 million for the twelve months ended March 27, 2015. The decrease was primarily due to $143.8 million of lower raw material costs, $96.9 million related to the exit of the Fence and Sprinkler product lines and a favorable foreign exchange impact of $14.8 million due to a stronger U.S. dollar. Cost of sales also declined due to lower freight and warehouse expenses of $11.8 million due to process improvements, lower volume of $11.0 million, lower depreciation expense of $3.9 million due to lower levels of property, plant, and equipment and $0.3 million of other costs. These declines were offset in part by increases to cost of sales of $19.2 million due to our APPI and SCI businesses and write-downs representing a lower-of-cost-or-market adjustment of $9.7 million.
52
Table of Contents
Gross profit
Gross profit increased by $76.0 million, or 32.0%, to $313.4 million for the twelve months ended March 25, 2016, compared to $237.4 million for the twelve months ended March 27, 2015. The net increase was primarily attributable to the benefit of material costs declining in excess of the decline in average selling prices, lower warehouse and freight costs and contributions received from our acquisitions of APPI and SCI businesses, offset in part by the impact of our exit of the Fence and Sprinkler product lines.
Selling, general and administrative expenses
Selling, general and administrative expenses increased $21.0 million, or 11.8%, to $199.1 million for the twelve months ended March 25, 2016, compared to $178.1 million for the twelve months ended March 27, 2015. The increase is due to incremental stock compensation expense of $15.0 million due to an increase in the estimated fair value of a share of our common stock. Our stock-based awards are accounted for as liability awards and require mark-to-market adjustments each period to account for the fair value of the awards. We also recorded increased transaction costs of $5.2 million. Lastly, we incurred restructuring charges of $4.3 million related to the Fence and Sprinkler exit and the closure of the Philadelphia, Pennsylvania manufacturing facility. These increases are offset in part by favorable foreign exchange impact of $2.0 million due to a stronger U.S. dollar and a reduction of other expenses of $1.5 million across a variety of expense categories.
Intangible asset amortization
Intangible asset amortization expenses increased $1.7 million, or 8.1%, to $22.7 million for the twelve months ended March 25, 2016, compared to $21.0 million for the twelve months ended March 27, 2015. The increase is primarily attributable to incremental amortization from intangible assets acquired from the APPI and SCI businesses.
Asset impairment charges
During the twelve months ended March 25, 2015, we announced the exit from our Fence and Sprinkler product lines and the planned closure of a manufacturing facility in Philadelphia, Pennsylvania. As such, we recorded asset impairments of $24.0 million related to long-lived assets and prepaid shop supplies which were written-down to their fair value.
Additionally, we recorded a $3.9 million impairment to goodwill related to our SCI acquisition. The impairment was triggered by a decline in net sales and earnings in part due to a shift in the mix of products sold to a key customer, which was not expected to be replaced. The customer operates in the oil and gas end market which has recently experienced a significant downturn. Consequently, sales volume was expected to decline due to this customer’s exposure to volatility in the oil and gas industry. Additionally, this customer chose an alternative supplier outside the United States for certain other products. The decline in net sales and earnings occurred after the acquisition closed. We recorded this impairment within our Electrical Raceway reportable segment.
We concluded that the circumstances surrounding this customer constituted a triggering event in accordance with ASC 360 - Property, Plant & Equipment. We compared the estimated undiscounted cash flows of the finite lived customer relationship intangible asset to its carrying value to assess the recoverability. As the undiscounted cash flows related to the customer relationship intangible asset exceeded its carrying value, we did not proceed to the second step of the impairment test.
During the twelve months ended March 27, 2014, we recorded impairment to goodwill of $43.0 million related to a reporting unit in our MP&S segment. Additionally, we recorded impairments of $0.9 million related to the Razor Ribbon and Columbia MBF trade names due to a contraction in the long-term growth projections of products sold under these trade names. The impairments of trade names were recorded in our MP&S reportable segment. Lastly, we recorded $0.5 million impairment related to our closed facility in Reux, France to adjust the carrying value to its fair value.
53
Table of Contents
Operating income (loss)
Operating income (loss) increased $69.7 million to income of $63.7 million for the twelve months ended March 25, 2016, compared to a loss of $6.0 million for the twelve months ended March 27, 2015. The increase was due primarily to expanded gross profit of $76.0 million and lower asset impairment charges of $16.4 million offset in part by an increase in selling, general and administrative expenses of $21.0 million and increased intangible asset amortization expenses of $1.7 million.
Interest expense, net
Interest expense, net, decreased by $0.4 million, or 1.0%, to $42.8 million for the twelve months ended March 25, 2016, compared to $43.3 million for the twelve months ended March 27, 2015. Interest expense was higher during the twelve months ended March 27, 2015 due to increased borrowings against the ABL Credit Facility compared to the twelve months ended March 25, 2016.
(Gain) loss from extinguishment of debt
During the twelve months ended March 25, 2016, AII redeemed $17.0 million of the Second Lien Term Loan Facility at a redemption price of 89.00% of the par value, and $2.0 million at a redemption price of 89.75% of the par value. We recorded a gain on the extinguishment of debt of $1.7 million compared to a $40.9 million loss on the redemption of our Senior Notes during the twelve months ended March 27, 2015. The loss primarily included an early redemption premium and a write-off of unamortized debt issuance costs.
Income tax expense (benefit)
We recorded tax expense of $8.0 million for the twelve months ended March 25, 2016, compared to a tax benefit of $30.6 million for the twelve months ended March 27, 2015. Our income tax expense was primarily attributable to our increase in income from operations before taxes as compared to a loss from operations before taxes in the preceding period.
Adjusted EBITDA
Adjusted EBITDA increased by $76.9 million, or 59.0%, to $207.1 million for the twelve months ended March 25, 2016, compared to $130.2 million for the twelve months ended March 27, 2015. The increase was due primarily to higher gross profit driven by our ability to maintain an average selling price that declined less than the decrease in raw material costs in both business segments. In addition, our acquisitions of APPI and SCI contributed $4.1 million of Adjusted EBITDA.
Segment results
Electrical Raceway
| ($ in thousands) |
March 25, 2016 |
March 27, 2015 |
Change | % Change | ||||||||||||
| Net sales |
$ | 961,362 | $ | 1,014,580 | $ | (53,218 | ) | (5.2 | )% | |||||||
| Adjusted EBITDA |
$ | 140,656 | $ | 86,648 | $ | 54,008 | 62.3 | % | ||||||||
| Adjusted EBITDA margin |
14.6 | % | 8.5 | % | ||||||||||||
54
Table of Contents
Net sales
Net sales decreased $53.2 million, or 5.2%, for the twelve months ended March 25, 2016 to $961.4 million, compared to $1,014.6 million for the twelve months ended March 27, 2015. The decrease was primarily due to $46.7 million lower average selling prices as a result of lower raw material prices during the period. Volume declined $27.4 million primarily due to change in the mix of our products sold to focus on higher-margin products. Lastly, negative foreign currency translation provided a negative impact of $4.7 million due to a strengthened U.S. dollar. These decreases were partially offset in part by $23.9 million of increased sales acquired from our APPI and SCI businesses and $1.7 million of increased freight and other revenue.
Adjusted EBITDA
Adjusted EBITDA increased $54.0 million, or 62.3%, to $140.7 million for the twelve months ended March 25, 2016, compared to $86.6 million for the twelve months ended March 27, 2015. The increase was due primarily to higher gross profit driven by our ability to maintain an average selling price that declined less than the decrease in raw material costs. Additionally, our APPI and SCI businesses contributed $4.1 million to the increase.
Mechanical Products & Solutions
| ($ in thousands) |
March 25, 2016 |
March 27, 2015 |
Change | % Change | ||||||||||||
| Net sales |
$ | 621,761 | $ | 745,549 | $ | (123,788 | ) | (16.6 | )% | |||||||
| Impact of Fence and Sprinkler exit |
(94,547 | ) | (193,998 | ) | 99,451 | (51.3 | )% | |||||||||
|
|
|
|
|
|||||||||||||
| Adjusted net sales |
$ | 527,214 | $ | 551,551 | $ | (24,337 | ) | (4.4 | )% | |||||||
| Adjusted EBITDA |
$ | 90,698 | $ | 61,638 | $ | 29,060 | 47.1 | % | ||||||||
| Adjusted EBITDA margin |
17.2 | % | 11.2 | % | ||||||||||||
Net sales
Net sales decreased $123.8 million, or 16.6%, for the twelve months ended March 25, 2016 to $621.8 million, compared to $745.5 million for the twelve months ended March 27, 2015. The decrease was primarily due to declines in sales of $99.5 million related to the Fence and Sprinkler exit. Net sales further declined $16.7 million due to lower average selling prices, $9.4 due to negative foreign currency translation impact from a strengthened U.S. dollar and $0.2 million from other sales. These declines were offset in part by $1.7 million in higher volume. The higher volume was due to a shift in timing of purchases to meet demand in a particular end market. Lastly, the declines in net sales were offset by $0.3 million due to increased freight revenue.
Adjusted EBITDA
Adjusted EBITDA increased $29.1 million, or 47.1%, for the twelve months ended March 25, 2016 to $90.7 million, compared to $61.6 million for the twelve months ended March 27, 2015. The increase was due primarily to higher gross profit driven by our ability to maintain an average selling price that declined less than the decrease in raw material costs.
55
Table of Contents
Results of Operations—Three and Six Months Ended March 25, 2016 and March 27, 2015
| Three Months Ended | Six Months Ended | |||||||||||||||||||||||||||||||
| ($ in thousands) |
March 25, 2016 |
March 27, 2015 |
Change | % Change |
March 25, 2016 |
March 27, 2015 |
Change | % Change |
||||||||||||||||||||||||
| Net sales |
$ | 353,046 | $ | 432,586 | $ | (79,540 | ) | (18.4 | )% | $ | 711,421 | $ | 858,987 | $ | (147,566 | ) | (17.2 | )% | ||||||||||||||
| Cost of sales |
261,636 | 365,140 | (103,504 | ) | (28.3 | )% | 547,602 | 735,776 | (188,174 | ) | (25.6 | )% | ||||||||||||||||||||
|
|
|
|
|
|
|
|
|
|
|
|
|
|
|
|
|
|||||||||||||||||
| Gross profit |
91,410 | 67,446 | 23,964 | 35.5 | % | 163,819 | 123,211 | 40,608 | 33.0 | % | ||||||||||||||||||||||
| Selling, general and administrative |
54,179 | 41,981 | 12,198 | 29.1 | % | 98,020 | 84,779 | 13,241 | 15.6 | % | ||||||||||||||||||||||
| Intangible asset amortization |
5,572 | 5,373 | 199 | 3.7 | % | 11,089 | 10,526 | 563 | 5.3 | % | ||||||||||||||||||||||
|
|
|
|
|
|
|
|
|
|
|
|
|
|
|
|
|
|||||||||||||||||
| Operating income |
31,659 | 20,092 | 11,567 | 57.6 | % | 54,710 | 27,906 | 26,804 | 96.1 | % | ||||||||||||||||||||||
|
|
|
|
|
|
|
|
|
|
|
|
|
|
|
|
|
|||||||||||||||||
| Interest expense, net |
10,567 | 11,483 | (916 | ) | (8.0 | )% | 20,448 | 22,412 | (1,964 | ) | (8.8 | )% | ||||||||||||||||||||
| Gain on extinguishment of debt |
(1,661 | ) | — | (1,661 | ) | * | (1,661 | ) | — | (1,661 | ) | * | ||||||||||||||||||||
|
|
|
|
|
|
|
|
|
|
|
|
|
|
|
|
|
|||||||||||||||||
| Income from operations before income taxes |
22,753 | 8,609 | 14,144 | 164.3 | % | 35,923 | 5,494 | 30,429 | 553.9 | % | ||||||||||||||||||||||
| Income tax expense |
8,746 | 2,809 | 5,937 | 211.4 | % | 13,344 | 2,456 | 10,888 | 443.3 | % | ||||||||||||||||||||||
|
|
|
|
|
|
|
|
|
|
|
|
|
|
|
|
|
|||||||||||||||||
| Net income |
$ | 14,007 | $ | 5,800 | $ | 8,207 | 141.5 | % | $ | 22,579 | $ | 3,038 | $ | 19,541 | 643.2 | % | ||||||||||||||||
|
|
|
|
|
|
|
|
|
|
|
|
|
|
|
|
|
|||||||||||||||||
| Non-GAAP financial data |
||||||||||||||||||||||||||||||||
| Adjusted net sales |
$ | 353,046 | $ | 386,775 | $ | (33,729 | ) | (8.7 | )% | $ | 703,605 | $ | 767,125 | $ | (63,520 | ) | (8.3 | )% | ||||||||||||||
| Adjusted EBITDA |
58,361 | 36,113 | 22,248 | 61.6 | % | 106,414 | 63,263 | 43,151 | 68.2 | % | ||||||||||||||||||||||
| Adjusted EBITDA Margin |
16.5 | % | 9.3 | % | 15.1 | % | 8.2 | % | ||||||||||||||||||||||||
| * | Not meaningful |
Three and Six Months Ended March 25, 2016 Compared to March 27, 2015
Net sales
Net sales decreased $79.5 million, or 18.4%, to $353.0 million for the three months ended March 25, 2016, compared to $432.6 million for the three months ended March 27, 2015. The decrease was primarily due to declines in sales of $45.8 million related to the Fence and Sprinkler exit announced in the fourth quarter of fiscal 2015. These product lines were fully discontinued in the first quarter of fiscal 2016. Sales further decreased $21.0 million due to lower net average selling prices as a result of lower raw material prices during the period and $9.2 million due to lower volume. Volume declined primarily due to a reduction in mechanical pipe product demand due to a shift in timing for purchases from our customers to meet their demand in a particular end market. Lastly, net sales declined $2.3 million due to the impact of a stronger U.S. dollar on reported foreign currency sales and $1.2 million of decreased freight revenue.
Net sales decreased $147.6 million, or 17.2%, to $711.4 million for the six months ended March 25, 2016, compared to $859.0 million for the six months ended March 27, 2015. The decrease was primarily due to declines in sales of $84.0 million related to the Fence and Sprinkler exit, $38.6 million due to lower average selling prices as a result of lower raw material prices and $21.7 million due to lower volume. Volume declined primarily due to a change in the mix of our armored cable and fittings products sold to focus on higher margin products and a reduction in demand from our metal electrical conduit and fittings products. Lastly, net sales declined $5.5 million due to the impact of a stronger U.S. dollar and $1.0 million of decreased freight revenue. These declines were partially offset by $3.2 million of increased sales from our APPI and SCI businesses which were acquired in the first quarter of fiscal 2015.
56
Table of Contents
Cost of sales
Cost of sales decreased by $103.5 million, or 28.3%, to $261.6 million for the three months ended March 25, 2016, compared to $365.1 million for the three months ended March 27, 2015. The decrease was primarily due to lower costs resulting from the Fence and Sprinkler exit of $41.1 million, lower material costs of $39.0 million and $7.7 million of lower volume due to a change in product mix of our products sold. Additionally, freight and warehouse costs declined $7.5 million attributable to the decline in volume. A stronger U.S. dollar provided a favorable foreign currency translation impact of $5.1 million which lowered cost of sales. Additionally, market conditions for raw material prices did not require a downward adjustment for lower-of-cost-or-market during the three months-ended March 25, 2016. The new cost basis for inventory sold had a favorable impact decreasing cost of sales by $2.1 million. Lastly, our depreciation expense decreased by $1.5 million due to lower levels of property, plant, and equipment offset in part by an increase in other miscellaneous costs of $0.5 million.
Cost of sales decreased by $188.2 million, or 25.6%, to $547.6 million for the six month ended March 25, 2016, compared to $735.8 million for the six months ended March 27, 2015. The decrease was primarily due to $82.4 million of lower material costs, $77.6 million due to the Fence and Sprinkler exit, $12.6 million of lower freight and warehouse costs and $11.2 million of lower volume due to a change in the product mix of our products sold. Additionally, cost of sales decreased due to a favorable foreign exchange impact of $7.8 million due to the strengthening of the U.S. dollar and $3.3 million from lower depreciation expense. These decreases are partially offset by $2.9 million of increased costs from our APPI and SCI businesses, other miscellaneous costs of $2.1 million and $1.7 million due to increases in lower-of-cost-or-market adjustments to inventory.
Gross profit
Gross profit increased by $24.0 million, or 35.5%, to $91.4 million for the three months ended March 25, 2016, compared to $67.4 million for the three months ended March 27, 2015. The net increase was primarily attributable to the benefit of material costs declining in excess of the decline in sales prices and lower freight and warehouse costs offset in part by the impact of our exit of the Fence and Sprinkler product lines.
Gross profit increased by $40.6 million, or 33.0%, to $163.8 million for the six months ended March 25, 2016, compared to $123.2 million for the six months ended March 27, 2015. The net increase was primarily attributable to the benefit of material costs declining in excess of the decline in sales prices, lower freight and warehouse costs and contribution received from our acquisitions of APPI and SCI. The gross profit was offset in part by the impact of our exit of the Fence and Sprinkler product lines.
Selling, general and administrative expenses
Selling, general and administrative expenses increased $12.2 million, or 29.1%, to $54.2 million for the three months ended March 25, 2016 compared to $42.0 million for the three months ended March 27, 2015. The increase was primarily due to incremental stock-based compensation expense of $9.6 million due to an increase in the estimated fair value of a share of our common stock. Our stock-based awards are accounted for as liability awards and require mark-to-market adjustments each period to account for the fair value of the awards. Additionally, we incurred $2.1 million of increased transaction costs and $0.5 million across a variety of expense categories.
Selling, general and administrative expenses increased $13.2 million, or 15.6%, to $98.0 million for the six months ended March 25, 2016 compared to $84.8 million for the six months ended March 27, 2015. The increase was primarily due to incremental stock-based compensation expense of $10.2 million due to an increase in the estimated fair value of a share of our common stock and $2.3 million of increased transaction costs and $0.7 million across a variety of expense categories.
57
Table of Contents
Intangible asset amortization
Intangible asset amortization expenses increased $0.2 million, or 3.7%, to $5.6 million for the three months ended March 25, 2016, compared to $5.4 million for the three months ended March 27, 2015. The increase was due to current year amortization arising from intangible assets acquired from the purchases of APPI and SCI.
Intangible asset amortization expenses increased $0.6 million, or 5.3%, to $11.1 million for the six months ended March 25, 2016, compared to $10.5 million for the six months ended March 27, 2015. The increase was due to current year amortization arising from intangible assets acquired from the purchases of APPI and SCI.
Operating income
Operating income increased $11.6 million, or 57.6%, to $31.7 million for the three months ended March 25, 2016, compared to $20.1 million for the three months ended March 27, 2015. The increase was due primarily to expanded gross profit of $24.0 million offset in part by an increase in selling, general, and administrative expenses of $12.2 million and intangible asset amortization of $0.2 million.
Operating income increased $26.8 million, or 96.1%, to $54.7 million for the six months ended March 25, 2016, compared to $27.9 million for the six months ended March 27, 2015. The increase was due primarily to expanded gross profit of $40.6 million offset in part by an increase in selling, general, and administrative expenses of $13.2 million and intangible asset amortization of $0.6 million.
Interest expense, net
Interest expense, net, decreased $0.9 million, or 8.0%, to $10.6 million for the three months ended March 25, 2016 compared to $11.5 million for the three months ended March 27, 2015. Interest expense, net, decreased $2.0 million, or 8.8%, to $20.4 million from $22.4 million for the six months ended March 25, 2016 and March 27, 2015, respectively. These decreases were due primarily to higher interest expense in fiscal year 2015 from borrowings under the ABL Credit Facility. There were no amounts outstanding under the ABL Credit Facility during the three and six months ended March 25, 2016.
Gain on extinguishment of debt
On January 22, 2016, we redeemed $17.0 million of the Second Lien Term Loan Facility at a redemption price of 89.00% of the par value, and $2.0 million at a redemption price of 89.75% of the par value. We recorded a gain on the extinguishment of debt of $1.7 million during the three months ended March 25, 2016. There were no gains or losses recorded during the three or six months ended March 27, 2015.
Income tax expense (benefit)
Our income tax expense was $8.7 million for the three months ended March 25, 2016, compared to $2.8 million for the three months ended March 27, 2015. The increase was primarily a result of increased earnings in the U.S., which are subject to a higher tax rate, increased state tax expense, and nondeductible permanent items, partially offset by the benefit of the Section 199 Domestic Production Activities Deduction.
Our income tax expense was $13.3 million for the six months ended March 25, 2016, compared to $2.5 million for the six months ended March 27, 2015. The increase was primarily a result of increased earnings in the U.S., which are subject to a higher tax rate, and increased state expense, partially offset by the favorable benefit of the Section 199 Domestic Production Activities Deduction.
Adjusted EBITDA
Adjusted EBITDA increased by $22.2 million, or 65.6%, to $58.4 million for the three months ended March 25, 2016, compared to $36.1 million for the three months ended March 27, 2015. The increase was due
58
Table of Contents
primarily to higher gross profit driven by our ability to maintain an average selling price that declined less than the decrease in raw material costs along with lower freight and warehouse costs due to process improvements. Our average raw material costs decreased approximately 27% for the three and six months ended March 25, 2016 compared to the same periods in the prior year. The average selling prices of our products did not decline in the same proportion.
Adjusted EBITDA increased by $43.2 million, or 68.2%, to $106.4 million for the six months ended March 25, 2016, compared to $63.3 million for the six months ended March 27, 2015. The increase was due primarily to higher gross profit driven by our ability to maintain an average selling price that declined less than the decrease in raw material costs along with lower freight and warehouse costs due to process improvements. Our average raw material costs decreased approximately 27% for the three and six months ended March 25, 2016 compared to the same periods in the prior year. The average selling prices of our products did not decline in the same proportion.
Segment results
Electrical Raceway
| Three Months Ended | Six Months Ended | |||||||||||||||||||||||||||||||
| ($ in thousands) |
March 25, 2016 |
March 27, 2015 |
Change | % Change |
March 25, 2016 |
March 27, 2015 |
Change | % Change |
||||||||||||||||||||||||
| Net sales |
$ | 231,293 | $ | 251,279 | $ | (19,986 | ) | (8.0 | )% | $ | 454,898 | $ | 499,115 | $ | (44,217 | ) | (8.9 | )% | ||||||||||||||
| Adjusted EBITDA |
$ | 42,186 | $ | 23,792 | $ | 18,394 | 77.3 | % | $ | 76,619 | $ | 42,680 | $ | 33,939 | 79.5 | % | ||||||||||||||||
| Adjusted EBITDA margin |
18.2 | % | 9.5 | % | 16.8 | % | 8.6 | % | ||||||||||||||||||||||||
Net sales
Net sales declined $20.0 million, or 8.0%, to $231.3 million for the three months ended March 25, 2016, compared to $251.3 million for the three months ended March 27, 2015. The decrease was due primarily to lower average selling prices of $15.3 million, lower net volume of $4.3 million and a negative foreign currency translation impact of $0.8 million due to a strengthened U.S. dollar. This decrease is offset in part by increased other sales of $0.4 million.
Net sales declined $44.2 million, or 8.9%, to $454.9 million for the six months ended March 25, 2016, compared to $499.1 million for the six months ended March 27, 2015. The decrease was due primarily to lower average selling prices of $29.2 million, lower net volume of $17.1 million and a negative foreign currency translation impact of $2.1 million due to a strengthened U.S. dollar. This decrease is offset in part by increased sales of $3.5 million from our APPI and SCI businesses, other sales of $0.6 million and lower freight revenue of $0.1 million.
Adjusted EBITDA
Adjusted EBITDA for the three months ended March 25, 2016 increased $18.4 million, or 77.3%, to $42.2 million from $23.8 million. Adjusted EBITDA for the six months ended March 25, 2016 increased $33.9 million, or 79.5%, to $76.6 million from $42.7 million. The primary driver of the year-over-year improvements was our ability to maintain an average selling price that declined less than the decrease in raw material costs.
59
Table of Contents
Mechanical Products & Solutions
| Three Months Ended | Six Months Ended | |||||||||||||||||||||||||||||||
| ($ in thousands) |
March 25, 2016 |
March 27, 2015 |
Change | % Change |
March 25, 2016 |
March 27, 2015 |
Change | % Change |
||||||||||||||||||||||||
| Net sales |
$ | 122,245 | $ | 181,545 | $ | (59,300 | ) | (32.7 | )% | $ | 257,347 | $ | 360,348 | $ | (103,001 | ) | (28.6 | )% | ||||||||||||||
| Impact of Fence and |
— | (45,811 | ) | 45,811 | * | (7,816 | ) | (91,862 | ) | 84,046 | * | |||||||||||||||||||||
|
|
|
|
|
|
|
|
|
|
|
|
|
|
|
|
|
|||||||||||||||||
| Adjusted net sales |
$ | 122,245 | $ | 135,734 | $ | (13,489 | ) | (9.9 | )% | $ | 249,531 | $ | 268,486 | $ | (18,955 | ) | (7.1 | )% | ||||||||||||||
| Adjusted EBITDA |
$ | 22,324 | $ | 17,685 | $ | 4,639 | 26.2 | % | $ | 41,701 | $ | 30,556 | $ | 11,145 | 36.5 | % | ||||||||||||||||
| Adjusted EBITDA margin |
18.3 | % | 9.7 | % | 16.2 | % | 8.5 | % | ||||||||||||||||||||||||
| * | Not meaningful |
Net sales
Net sales declined $59.3 million, or 32.7%, to $122.2 million for the three months ended March 25, 2016, compared to $181.5 million for the months ended March 27, 2015. The decrease was primarily due to declines in sales of $45.8 million related to the Fence and Sprinkler exit. Net sales further declined $5.7 million due to lower average selling prices, $4.9 million due to lower volume, $1.5 million due to negative foreign currency translation impact from a strengthened U.S. dollar, $1.3 million from lower freight revenue and $0.1 million of lower other sales.
Net sales declined $103.0 million, or 28.6%, to $257.3 million for the six months ended March 25, 2016 compared to $360.3 million for the six months ended March 27, 2015. The decrease was primarily due to declines in sales of $84.0 million related to the Fence and Sprinkler exit, $9.5 million due to lower average selling prices and $4.7 million due to lower volume. Net sales also declined due to negative foreign currency translation impact of $3.4 million, lower freight revenue of $1.2 and $0.2 million of lower other sales.
Adjusted EBITDA
Adjusted EBITDA increased $4.6 million, or 26.2%, to $22.3 million for the three months ended March 25, 2016, compared to $17.7 million for the three months ended March 27, 2015. Adjusted EBITDA increased $11.1 million, or 36.5%, to $41.7 million from $30.6 million for the three months ended March 25, 2016. The expansion of our Adjusted EBITDA was due to our ability to maintain an average selling price that declined less than the decrease in raw material costs. In addition, lower freight and warehouse costs due to process improvements added to the Adjusted EBITDA increase.
60
Table of Contents
Results of Operations—Fiscal Years 2015, 2014 and 2013
| For the Year Ended | Change | % Change | ||||||||||||||||||||||||||
| ($ in thousands) |
September 25, 2015 |
September 26, 2014 |
September 27, 2013 |
September 25, 2015 vs September 26, 2014 |
September 26, 2014 vs September 27, 2013 |
September 25, 2015 vs September 26, 2014 |
September 26, 2014 vs September 27, 2013 |
|||||||||||||||||||||
| Net sales |
$ | 1,729,168 | $ | 1,702,838 | $ | 1,475,897 | $ | 26,330 | $ | 226,941 | 1.5 | % | 15.4 | % | ||||||||||||||
| Cost of sales |
1,456,375 | 1,475,728 | 1,264,348 | (19,353 | ) | 211,380 | (1.3 | ) | 16.7 | |||||||||||||||||||
|
|
|
|
|
|
|
|||||||||||||||||||||||
| Gross profit |
272,793 | 227,110 | 211,549 | 45,683 | 15,561 | 20.1 | 7.4 | |||||||||||||||||||||
| Selling, general and administrative |
185,815 | 180,783 | 160,749 | 5,032 | 20,034 | 2.8 | 12.5 | |||||||||||||||||||||
| Intangible asset amortization |
22,103 | 20,857 | 15,317 | 1,246 | 5,540 | 6.0 | 36.2 | |||||||||||||||||||||
| Asset impairment charges |
27,937 | 44,424 | 9,161 | (16,487 | ) | 35,263 | (37.1 | ) | 384.9 | |||||||||||||||||||
|
|
|
|
|
|
|
|||||||||||||||||||||||
| Operating income (loss) |
36,938 | (18,954 | ) | 26,322 | 55,892 | (45,276 | ) | * | * | |||||||||||||||||||
| Interest expense, net |
44,809 | 44,266 | 47,869 | 543 | (3,603 | ) | 1.2 | * | ||||||||||||||||||||
| Loss on extinguishment of debt |
— | 43,667 | — | (43,667 | ) | 43,667 | * | * | ||||||||||||||||||||
|
|
|
|
|
|
|
|||||||||||||||||||||||
| Loss from continuing operations before income taxes |
(7,871 | ) | (106,887 | ) | (21,547 | ) | 99,016 | (85,340 | ) | |||||||||||||||||||
| Income tax benefit |
(2,916 | ) | (32,939 | ) | (2,966 | ) | 30,023 | (29,973 | ) | 91.1 | * | |||||||||||||||||
|
|
|
|
|
|
|
|||||||||||||||||||||||
| Loss from continuing operations |
(4,955 | ) | (73,948 | ) | (18,581 | ) | 68,993 | (55,367 | ) | 93.3 | * | |||||||||||||||||
| Loss from discontinued operations, net of income tax expense of $0, $0, $2,791, respectively |
— | — | (42,654 | ) | — | 42,654 | — | * | ||||||||||||||||||||
|
|
|
|
|
|
|
|||||||||||||||||||||||
| Net loss |
$ | (4,955 | ) | $ | (73,948 | ) | $ | (61,235 | ) | $ | 68,993 | $ | (12,713 | ) | * | 20.8 | % | |||||||||||
|
|
|
|
|
|
|
|||||||||||||||||||||||
| Non-GAAP financial data |
||||||||||||||||||||||||||||
| Adjusted net sales |
$ | 1,550,575 | $ | 1,510,150 | $ | 1,277,175 | $ | 40,425 | $ | 232,975 | 2.7 | 18.2 | ||||||||||||||||
| Adjusted EBITDA |
163,950 | 126,597 | 111,559 | 37,353 | 15,038 | 29.5 | 13.5 | |||||||||||||||||||||
| Adjusted EBITDA Margin |
10.6 | % | 8.4 | % | 8.7 | % | ||||||||||||||||||||||
| * | Not meaningful. |
Fiscal 2015 Compared to Fiscal 2014
Net sales
Net sales increased $26.4 million, or 1.5%, to $1,729.2 million for fiscal 2015, compared to $1,702.8 million for fiscal 2014. The increase was due mainly to higher volume of $42.4 million from several key product categories. These volume increases represent market share growth due to investments in manufacturing capacity expansion to meet increased market demand and our ability to improve service delivery to our customers resulting in increased orders. Net sales also increased due to incremental revenue of $37.5 million generated by APPI and SCI, which were acquired in the first quarter of fiscal 2015. The increase in volume was offset by lower average selling prices of $40.2 million driven by declining input costs and a negative foreign currency translation impact of $13.3 million.
Cost of sales
Cost of sales decreased by $19.3 million, or 1.3%, to $1,456.4 million for fiscal 2015, compared to $1,475.7 million for fiscal 2014. The decrease in cost of sales was largely due to lower material costs of $78.6 million, favorable foreign currency translation impact of $11.1 million and lower direct and indirect manufacturing costs of $3.1 million. Additionally, we had productivity improvements driving down direct labor and production-related overhead by approximately $1.1 million. Offsetting these amounts in part were higher costs of sales of $30.9 million from our acquisitions of APPI and SCI. Excluding the impact from acquisitions, our remaining
61
Table of Contents
businesses incurred higher cost of sales of $28.5 million due to volume increases. In addition, we recorded a lower-of-cost-or-market adjustment during the current period due to the decline in raw material prices for steel and copper that was $8.2 million higher than a similar adjustment recorded in the previous period. Lastly, our freight and warehousing costs increased $7.0 million due to the increased product volume shipped during year.
Gross profit
Gross profit increased by $45.7 million, or 20.1%, to $272.8 million for fiscal 2015, compared to $227.1 million for fiscal 2014. The increase in gross profit was due primarily to our ability to maintain an average selling price that declined less than the decrease in raw material costs, contributions from our acquired businesses and productivity improvements.
Selling, general and administrative expenses
Selling, general and administrative expenses increased $5.0 million, or 2.8%, to $185.8 million for fiscal 2015, compared to $180.8 million for fiscal 2014. The increase was due to incremental stock compensation expense in fiscal 2015 of $5.1 million due to an increase in the estimated fair value of a share of our common stock. Our stock-based awards are accounted for as liability awards and require mark-to-market adjustments each period to account for the fair value of the awards. Additionally, we recorded restructuring charges of $2.4 million related to the exit of our Fence and Sprinkler product lines and the closure of a Philadelphia, Pennsylvania manufacturing facility. Lastly, we incurred other net increases of $0.3 million across a variety of expense categories. These increases were offset by lower foreign currency translation expenses of $1.4 million and lower consulting fees paid to our sponsor of $1.4 million.
Intangible asset amortization
Intangible asset amortization increased $1.2 million, or 6.0%, to $22.1 million for fiscal 2015, compared to $20.9 million for fiscal 2014. The increase is primarily attributable to incremental amortization from intangible assets acquired from the purchases of APPI and SCI.
Asset impairment
In fiscal 2015, we announced the exit from Fence and Sprinkler and the planned closure of the Philadelphia, Pennsylvania manufacturing facility. As such, we recorded asset impairments of $24.0 million related to long-lived assets and prepaid shop supplies written-down to their fair value.
Additionally, we recorded a $3.9 million impairment to goodwill related to our SCI acquisition. The impairment was triggered by a decline in net sales and earnings due to a shift in the mix of products sold to a key customer, which was not expected to be replaced. The customer operates in the oil and gas end market, which has recently experienced a significant downturn, and chose an alternative supplier outside the United States for certain of our higher-margin products. The decline in net sales and earnings occurred after the acquisition closed. We recorded this impairment within our Electrical Raceway reportable segment.
We concluded that the circumstances surrounding this customer constituted a triggering event in accordance with ASC 360—Property, Plant & Equipment. We compared the estimated undiscounted cash flows of the finite-lived customer relationship intangible asset to its carrying value to assess the recoverability. As the undiscounted cash flows related to the customer relationship intangible asset exceeded its carrying value, we did not proceed to the second step of the impairment test.
In fiscal 2014, we recorded impairment to goodwill of $43.0 million related to a reporting unit in our MP&S segment. Additionally, we recorded impairments of $0.9 million related to the Razor Ribbon and Columbia MBF trade names due to a contraction in the long-term growth projections of products sold under these trade names. The impairments of trade names were recorded in our MP&S reportable segment. Lastly, we recorded, $0.6 million impairment related to our closed facility in Reux, France to adjust the carrying value to its fair value.
62
Table of Contents
Operating income (loss)
Operating income (loss) increased by $55.9 million to income of $36.9 million for fiscal 2015, compared to a loss of $19.0 million for fiscal 2014. The increase was due to expanded gross profit of $45.7 million, lower asset impairment charges of $16.5 million. To a lesser extent, operating income was offset by higher selling, general and administrative expenses and amortization expense.
Interest expense, net
Interest expense, net increased by $0.5 million, or 1.1%, to $44.8 million for fiscal 2015, compared to $44.3 million for fiscal 2014. The increase was primarily due to lower interest income in the current year resulting from the collection of interest bearing deferred payments associated with the divestiture from our Brazilian operations during fiscal 2014.
Loss on extinguishment of debt
During fiscal 2014, we recognized a $43.7 million loss on the redemption of our Senior Notes which included an early redemption premium of $28.6 million, a write-off of $14.1 million of unamortized debt issuance costs, incremental interest expense of $0.8 million, and legal fees of $0.1 million. There were no losses on extinguishment of debt recorded in fiscal 2015.
Income tax benefit
For fiscal, 2015, we recorded a tax benefit of $2.9 million as compared to a benefit of $32.9 million for fiscal 2014. The lower tax benefit was due in part to higher operating income and from the tax benefit from the release of indemnified state uncertain tax positions offset by nondeductible expenses and a valuation allowance against deferred tax assets in foreign jurisdictions in which the deferred tax assets are not expected to be realized. In addition, the effective tax rate for fiscal 2014 reflected the tax impact of nondeductible goodwill impairment offset by the tax benefit from additional federal net operating losses recognized from the closure of a federal audit for prior periods and income of certain foreign subsidiaries deemed indefinitely reinvested.
Adjusted EBITDA
Adjusted EBITDA increased by $37.4 million, or 29.5%, to $164.0 million for fiscal 2015, compared to $126.6 million for fiscal 2014. The increase was due primarily to higher gross profit driven by our ability to maintain an average selling price that declined less than the decrease in raw material costs in both business segments and lower direct labor and production-related overhead costs due to productivity improvements. In addition, our acquisitions of APPI and SCI contributed $4.9 million of Adjusted EBITDA.
Segment results
Electrical Raceway
| ($ in thousands) |
September 25, 2015 |
September 26, 2014 |
Change | % Change | ||||||||||||
| Net Sales |
$ | 1,005,579 | $ | 967,766 | $ | 37,813 | 3.9 | % | ||||||||
| Adjusted EBITDA |
106,717 | 86,273 | 20,444 | 23.7 | ||||||||||||
| Adjusted EBITDA margin |
10.6 | % | 8.9 | % | ||||||||||||
Net sales
Net sales increased $37.8 million, or 3.9%, to $1,005.6 million from $967.8 million. The acquisitions of APPI and SCI contributed $37.5 million of incremental revenue. Both acquisitions closed in the first quarter of
63
Table of Contents
our fiscal 2015. Excluding the impact of our acquisitions, sales volume increased $27.1 million across multiple product categories. These increases were partially offset by lower average selling prices of $22.5 million and negative foreign currency translation impact of $4.3 million due to a strengthened U.S. dollar.
Adjusted EBITDA
Adjusted EBITDA increased $20.4 million, or 23.7%, to $106.7 million, from $86.3 million. The expansion of our Adjusted EBITDA was primarily attributable to a net positive impact of maintaining average selling prices in excess of the declines in our raw material costs. The average input of our raw material prices declined more than the decline in our average selling prices. Productivity improvements also contributed to the Adjusted EBITDA improvement by lowering direct labor and production-related overhead costs. Additionally, our acquisitions of APPI and SCI contributed Adjusted EBITDA of $4.9 million.
Mechanical Products & Solutions
| ($ in thousands) |
September 25, 2015 |
September 26, 2014 |
Change | % Change | ||||||||||||
| Net sales |
$ | 724,762 | $ | 736,050 | $ | (11,288 | ) | (1.5 | )% | |||||||
| Impact of Fence and Sprinkler exit |
(178,593 | ) | (192,688 | ) | 14,095 | 7.3 | ||||||||||
|
|
|
|
|
|||||||||||||
| Adjusted net sales |
$ | 546,169 | $ | 543,362 | $ | 2,807 | 0.5 | |||||||||
| Adjusted EBITDA |
$ | 79,553 | $ | 59,941 | $ | 19,612 | 32.7 | |||||||||
| Adjusted EBITDA margin |
14.6 | % | 11.0 | % | ||||||||||||
Net sales
Net sales decreased $11.3 million, or 1.5%, to $724.8 million, from $736.1 million. The decline was primarily attributable to lower average selling prices of $17.6 million from our steel products and the impact of foreign currency of $9.1 million due a strengthening U.S. dollar. Partially offsetting these impacts were increases of volume of $15.4 million.
Adjusted EBITDA
Adjusted EBITDA increased $19.7 million, or 32.7%, to $79.6 million, from $59.9 million. The expansion of our Adjusted EBITDA was primarily due to our ability to maintain an average selling price that declined less than the decrease in raw material costs. Our average material costs declined approximately 15% for fiscal 2015 as compared to fiscal 2014 and our average selling prices decrease at a lower rate. Productivity improvements also contributed to the Adjusted EBITDA improvement by lowering direct labor and production-related overhead costs.
Fiscal 2014 Compared to Fiscal 2013
Net sales
Net sales increased $226.9 million to $1,702.8 million, or 15.4%, for fiscal 2014, compared to $1,475.9 million for fiscal 2013. The increase was primarily due to $179.4 million of incremental revenue generated by Heritage Plastics and Ridgeline, which were acquired in the fourth quarter of fiscal 2013 and first quarter of fiscal 2014, respectively. Additionally, net higher average selling prices resulted in an increase of $15.5 million while higher volume provided an increase of $34.6 million. Foreign currency negatively impacted sales by $2.6 million.
Cost of sales
Cost of sales increased by $211.4 million, or 16.7%, to $1,475.7 million for fiscal 2014, compared to $1,264.3 million for fiscal 2013. The increase in cost of sales was due primarily to the incremental cost of sales
64
Table of Contents
incurred of $155.0 million at Heritage Plastics and Ridgeline which were acquired in the fourth quarter of fiscal 2013 and first quarter of fiscal 2014, respectively. Additionally, our costs increased due to higher volume and manufacturing costs, which totaled $61.7 million. Our increased manufacturing costs included unabsorbed overhead that was not considered to be attributable to normal production capacity and higher direct labor and production-related overhead costs primarily related to a week-long work stoppage at our Harvey, Illinois facility. We also incurred higher material costs of $23.5 million related to steel. Offsetting these increases in part were lower freight and warehousing costs of $23.5 million principally due to process improvements including optimizing the transportation mode for shipping our products to end customers. We also experienced a favorable impact of $2.3 million related to foreign currency translation and other improvements in direct costs of $3.0 million.
Gross profit
Gross profit increased by $15.6 million, or 7.4%, to $227.1 million for fiscal 2014, compared to $211.5 million for fiscal 2013. The increase in gross profit was due primarily to profits generated by the acquired businesses, higher average selling prices in excess of higher raw material costs for certain of our products, and higher volume. Partially offsetting these increases was the decline of our average selling prices of certain other products.
Selling, general and administrative expenses
Selling, general and administrative expenses increased $20.1 million, or 12.5%, to $180.8 million for fiscal 2014, compared to $160.7 million for fiscal 2013. The increase was due to $12.6 million related to newly acquired businesses, an increase of $6.2 million in stock option expense largely due to an increase in the estimated fair value of our common stock. Our stock based awards are accounted for as liability awards requiring mark to-market adjustments each period to account for the fair value of the awards. Additionally, our product liability expense increased $1.6 million due to further development of open claims and incurred-but-not-reported claims, offset by other decreases of $0.3 million across a variety of expense categories.
Intangible asset amortization
Intangible asset amortization increased $5.6 million, or 36.2%, to $20.9 million for fiscal 2014, compared to $15.3 million for fiscal 2013. The increase reflects the impact of amortization recorded in relation to the Ridgeline and Heritage Plastics’ acquisitions offset by lower amortization expense recorded in relation to acquisitions made in prior years.
Asset impairment
In fiscal 2014, we recorded impairment to goodwill of $43.0 million related to a reporting unit in our MP&S segment. The impairment was driven by changes in market conditions, the reporting unit’s actual results in fiscal 2014 that were below amounts estimated in fiscal 2013 and revisions to the unit’s growth projections. Our long-term forecasted demand for certain steel products, including our Fence and Sprinkler products which were discontinued in fiscal 2016, decreased during 2014 and was not expected to grow at or above rates projected for non-residential construction markets. The projected volume declines of these products further contracted an already low profit margin. Additionally, we recorded impairments of $0.9 million related to the Razor Ribbon and Columbia MBF trade names due to a contraction in the long-term growth projections of products sold under these trade names. The impairments of trade names were recorded in our MP&S reportable segment. Lastly, we recorded, $0.6 million impairment related to our closed facility in Reux, France to adjust the carrying value to its fair value.
For fiscal 2013, we recorded $9.2 million of asset impairment charges related to property, plant and equipment written-down to their fair value. Certain of these assets were held for sale.
65
Table of Contents
Operating income (loss)
Operating income (loss) changed by $45.3 million, to a loss of $19.0 million for fiscal 2014, compared to income of $26.3 million for fiscal 2013. The decrease was due primarily to higher selling, general and administrative expenses of $20.1 million, higher amortization expense of $5.5 million and higher asset impairment charges of $35.3 million, offset in part by higher gross profit of $15.6 million.
Interest expense, net
Interest expense, net decreased by $3.6 million, to $44.3 million for fiscal 2014, compared to $47.9 million for fiscal 2013. The decrease was due to net lower average interest rates despite increased borrowings. Our interest expense declined by $2.4 million. Additionally, we recognized higher interest income of $1.2 million from outstanding installment payments from the sale of our subsidiary in Brazil.
Loss on extinguishment of debt
During fiscal 2014, we recognized a $43.7 million loss on the redemption of our Senior Notes which included an early redemption premium of $28.6 million, a write-off of $14.1 million of unamortized debt issuance costs, incremental interest expense of $0.8 million, and additional legal fees of $0.1 million related to the Senior Notes.
Income tax benefit
For fiscal 2014 and fiscal 2013, we recognized tax benefits of $32.9 million and $3.0 million, respectively. The larger tax benefit recognized in fiscal 2014 was primarily attributable to a larger loss from continuing operations before income taxes, as well as income of permanently reinvested foreign subsidiaries offset by nondeductible goodwill impairment. The tax benefit recognized in fiscal 2013 reflected a one-time tax benefit from federal net operating losses recognized from the closure of a federal audit.
Loss from discontinued operations, net of income tax expense
Loss from discontinued operations, net of tax was $0 for fiscal 2014 compared to a loss of $42.7 million for fiscal 2013 related to the divestiture of our operations in Brazil.
Adjusted EBITDA
Adjusted EBITDA increased by $15.0 million, or 13.5%, to $126.6 million for fiscal 2014, compared to $111.6 million for fiscal 2013. The increase was due primarily to the impact of our Heritage Plastics and Ridgeline acquisitions, which contributed $17.2 million of incremental adjusted EBITDA. Additionally, the benefit of average selling prices increasing in excess of the increase in material costs contributed to our increased profitability.
Segment results
Electrical Raceway
| ($ in thousands) |
September 25, 2014 |
September 26, 2013 |
Change | % Change | ||||||||||||
| Net sales |
$ | 967,766 | $ | 740,095 | $ | 227,671 | 30.8 | % | ||||||||
| Adjusted EBITDA |
$ | 86,273 | $ | 66,845 | 19,428 | 29.1 | ||||||||||
| Adjusted EBITDA margin |
8.9 | % | 9.0 | % | ||||||||||||
Net sales
Net sales increased $227.7 million, or 30.8%, to $967.8 million from $740.1 million. The increase was attributable to $179.4 million of incremental revenue generated by our acquisitions Heritage Plastics and
66
Table of Contents
Ridgeline, which were acquired in the fourth quarter of our fiscal 2013 and the first quarter of fiscal 2014, respectively. Additionally, volume increased $52.8 million across multiple product categories. Partially offsetting these increases were lower average selling prices of $2.2 million and negative foreign currency translation impact of $2.3 million due to the strengthened U.S. dollar.
Adjusted EBITDA
Adjusted EBITDA increased $19.5 million, or 29.1%, to $86.3 million, from $66.8 million. The expansion in our Adjusted EBITDA was due primarily to the impact from our Heritage Plastics and Ridgeline acquisitions, and overall volume growth across a variety of our product categories. The average selling prices of certain products increased in excess of raw material costs.
Mechanical Products and Solutions
| ($ in thousands) |
September 25, 2014 |
September 26, 2013 |
Change | % Change | ||||||||||||
| Net sales |
$ | 736,050 | $ | 736,937 | $ | (887 | ) | (0.1 | )% | |||||||
| Impact of Fence and Sprinkler exit |
(192,688 | ) | (198,722 | ) | 6,034 | 3.0 | ||||||||||
|
|
|
|
|
|||||||||||||
| Adjusted net sales |
$ | 543,362 | $ | 538,215 | $ | 5,147 | 1.0 | |||||||||
| Adjusted EBITDA |
$ | 59,941 | $ | 63,415 | $ | (3,474 | ) | (5.5 | ) | |||||||
| Adjusted EBITDA margin |
11.0 | % | 11.8 | % | ||||||||||||
Net sales
Net sales declined $0.8 million, or 0.1%, to $736.1 million, from $736.9 million. The decline was attributable to lower volume of $18.1 million and a negative foreign currency translation impact of $0.4 million due to a strengthened U.S. dollar. Offsetting these negative impacts were higher average selling prices of $17.7 million.
Adjusted EBITDA
Adjusted EBITDA declined $3.5 million, or 5.5%, to $59.9 million, from $63.4 million. The main drivers of the year-over-year decline were increased raw material costs and unabsorbed overhead that was not considered to be attributable to normal production, as well as higher direct labor and production-related overhead costs primarily related to a week-long work stoppage at our Harvey, Illinois facility. While average selling prices increased, they did not increase in the same proportion as the 8% increase in material costs.
67
Table of Contents
Quarterly Results of Operations Data
The following tables set forth certain consolidated statement of operations data as well as Adjusted EBITDA data (including a reconciliation to net income (loss)) for each of the most recent eight fiscal quarters. We have prepared these quarterly data on a basis that is consistent with the financial statements included elsewhere in this prospectus. In the opinion of management, this financial information reflects all necessary adjustments, consisting only of normal recurring adjustments, necessary for a fair presentation of these data. This information is not a complete set of financial statements and should be read in conjunction with our financial statements and related notes included elsewhere in this prospectus. These results of historical periods are not necessarily indicative of the results of operations for a full year or any future period.
| Three Months Ended | ||||||||||||||||||||||||||||||||
| ($ in thousands) |
March 25, 2016 |
December 25, 2015 |
September 25, 2015 |
June 26, 2015 |
March 27, 2015 |
December 25, 2014 |
September 26, 2014 |
June 27, 2014 |
||||||||||||||||||||||||
| Net sales |
$ | 353,046 | $ | 358,375 | $ | 437,814 | $ | 432,367 | $ | 432,586 | $ | 426,401 | $ | 454,356 | $ | 445,880 | ||||||||||||||||
| Cost of sales |
261,636 | 285,966 | 366,980 | 353,619 | 365,140 | 370,636 | 397,166 | 388,852 | ||||||||||||||||||||||||
|
|
|
|
|
|
|
|
|
|
|
|
|
|
|
|
|
|||||||||||||||||
| Gross Profit |
91,410 | 72,409 | 70,834 | 78,748 | 67,446 | 55,765 | 57,190 | 57,028 | ||||||||||||||||||||||||
| Selling, general and administrative |
54,179 | 43,841 | 55,124 | 45,912 | 41,981 | 42,798 | 50,843 | 42,450 | ||||||||||||||||||||||||
| Intangible asset amortization |
5,572 | 5,517 | 6,328 | 5,249 | 5,373 | 5,153 | 5,218 | 5,232 | ||||||||||||||||||||||||
| Asset impairment charges |
— | — | 27,937 | — | — | — | 43,939 | 442 | ||||||||||||||||||||||||
|
|
|
|
|
|
|
|
|
|
|
|
|
|
|
|
|
|||||||||||||||||
| Operating income (loss) |
31,659 | 23,051 | (18,555 | ) | 27,587 | 20,092 | 7,814 | (42,810 | ) | 8,904 | ||||||||||||||||||||||
| Interest expense, net |
10,567 | 9,881 | 11,185 | 11,212 | 11,483 | 10,929 | 11,042 | 9,832 | ||||||||||||||||||||||||
| Loss on extinguishment of debt |
(1,661 | ) | — | — | — | — | — | — | 40,913 | |||||||||||||||||||||||
|
|
|
|
|
|
|
|
|
|
|
|
|
|
|
|
|
|||||||||||||||||
| Income (loss) from continuing operations before income taxes |
22,753 | 13,170 | (29,740 | ) | 16,375 | 8,609 | (3,115 | ) | (53,852 | ) | (41,841 | ) | ||||||||||||||||||||
| Income tax expense (benefit) |
8,746 | 4,598 | (2,689 | ) | (2,683 | ) | 2,809 | (353 | ) | (17,135 | ) | (15,879 | ) | |||||||||||||||||||
|
|
|
|
|
|
|
|
|
|
|
|
|
|
|
|
|
|||||||||||||||||
| Net income (loss) |
14,007 | 8,572 | (27,051 | ) | 19,058 | 5,800 | (2,762 | ) | (36,717 | ) | (25,962 | ) | ||||||||||||||||||||
| Depreciation and amortization |
13,249 | 13,493 | 16,092 | 14,349 | 14,308 | 14,716 | 14,943 | 14,601 | ||||||||||||||||||||||||
| Loss on extinguishment of debt |
(1,661 | ) | — | — | — | — | — | — | 40,913 | |||||||||||||||||||||||
| Interest expense, net |
10,567 | 9,881 | 11,185 | 11,212 | 11,483 | 10,929 | 11,042 | 9,832 | ||||||||||||||||||||||||
| Income tax expense (benefit) |
8,746 | 4,598 | (2,689 | ) | (2,683 | ) | 2,809 | (353 | ) | (17,135 | ) | (15,879 | ) | |||||||||||||||||||
| Restructuring & impairments |
775 | 1,294 | 32,061 | 475 | 154 | 13 | 45,500 | 930 | ||||||||||||||||||||||||
| Net periodic pension benefit cost |
110 | 110 | 144 | 145 | 144 | 145 | 342 | 342 | ||||||||||||||||||||||||
| Stock-based compensation |
9,998 | 2,045 | 11,061 | 661 | 377 | 1,424 | 6,170 | 829 | ||||||||||||||||||||||||
| ABF product liability |
213 | 212 | (1,899 | ) | 561 | 561 | 561 | 1,162 | 549 | |||||||||||||||||||||||
| Consulting fee |
875 | 875 | 875 | 875 | 875 | 875 | 875 | 979 | ||||||||||||||||||||||||
| Transaction costs |
2,776 | 655 | 2,009 | 2,876 | 637 | 517 | 1,322 | 499 | ||||||||||||||||||||||||
| Other |
(1,294 | ) | 5,507 | 9,975 | 2,560 | 499 | 1,271 | 5,875 | 3,777 | |||||||||||||||||||||||
| Impact of Fence and Sprinkler |
— | 811 | 2,236 | (3,401 | ) | (1,534 | ) | (186 | ) | 3,938 | (1,746 | ) | ||||||||||||||||||||
|
|
|
|
|
|
|
|
|
|
|
|
|
|
|
|
|
|||||||||||||||||
| Adjusted EBITDA |
$ | 58,361 | $ | 48,053 | $ | 53,999 | $ | 46,688 | $ | 36,113 | $ | 27,150 | $ | 37,317 | $ | 29,664 | ||||||||||||||||
|
|
|
|
|
|
|
|
|
|
|
|
|
|
|
|
|
|||||||||||||||||
Liquidity and Capital Resources
We believe we have sufficient liquidity to support our ongoing operations and to invest in future growth and create value for stockholders. Our cash and cash equivalents were $134.5 million as of March 25, 2016, of which $21.4 million was held at non-U.S. subsidiaries. Those cash balances at foreign subsidiaries may be subject to U.S. or local country taxes if the Company’s intention to permanently reinvest such income were to change and cash was repatriated to the U.S. Our cash and cash equivalents increased $53.9 million from September 25, 2015. Since the end of our fiscal 2014, we have reduced total debt by $60.1 million.
In general, we require cash to fund working capital, capital expenditures, debt repayment, interest payments and taxes. We have access to the ABL Credit Facility to fund operational needs. As of March 25, 2016, there were no outstanding borrowings under the ABL Credit Facility (excluding $17.9 million of letters of credit issued under the ABL Credit Facility), and the borrowing base was estimated to be $238.6 million. As outstanding letters of credit count
68
Table of Contents
as utilization of the ABL Credit Facility and reduce the amount available for borrowings, approximately $220.7 million was available under our ABL Credit Facility as of March 25, 2016. The agreements governing the Credit Facilities contain covenants that limit or restrict AII’s ability to incur additional indebtedness, repurchase debt, incur liens, sell assets, make certain payments (including dividends) and enter into transactions with affiliates. AII has been in compliance with the covenants under the agreements for all periods presented.
Our use of cash may fluctuate during the year and from year to year due to differences in demand and changes in economic conditions primarily related to the prices of commodities we purchase.
Capital expenditures have historically been necessary to expand and update the production capacity and improve the productivity of our manufacturing operations. Our ongoing liquidity needs are expected to be funded by cash on hand, net cash provided by operating activities and, as required, borrowings under the Credit Facilities. We expect that cash provided from operations and available capacity under the ABL Credit Facility will provide sufficient funds to operate our business, make expected capital expenditures and meet our liquidity requirements for at least the next twelve months, including payment of interest and principal on our debt. In fiscal 2015, our capital expenditures were $26.8 million. We expect our capital expenditures in fiscal 2016 to be approximately $28.1 million.
Limitations on Distributions and Dividends by Subsidiaries
Atkore and AII are each holding companies, and as such have no independent operations or material assets other than ownership of equity interests in their respective subsidiaries. Each company depends on its respective subsidiaries to distribute funds to them so that they may pay obligations and expenses, including satisfying obligations with respect to indebtedness. The ability of our subsidiaries to make distributions and dividends to us depends on their operating results, cash requirements and financial and general business conditions, as well as restrictions under the laws of our subsidiaries’ jurisdictions.
The agreements governing the Credit Facilities significantly restrict the ability of our subsidiaries, including AII, to pay dividends, make loans or otherwise transfer assets from AII and, in turn, to us. Further, AII’s subsidiaries are permitted under the terms of the Credit Facilities to incur additional indebtedness that may restrict or prohibit the making of distributions, the payment of dividends or the making of loans by such subsidiaries to AII and, in turn, to us. The First Lien Term Loan Facility and Second Lien Term Loan Facility require AII to meet a certain consolidated coverage ratio on an incurrence basis in connection with additional indebtedness. The ABL Credit Facility contains limits on additional indebtedness based on various conditions for incurring the additional debt. See “Description of Certain Indebtedness.”
Cash Flows
The table below summarizes cash flow information derived from our statements of cash flows for the periods indicated:
| Six Months Ended | Year Ended | |||||||||||||||||||
| ($ in thousands) |
March 25, 2016 |
March 27, 2015 |
September 25, 2015 |
September 26, 2014 |
September 27, 2013 |
|||||||||||||||
| Cash flows provided by (used in): |
||||||||||||||||||||
| Operating activities |
$ | 82,157 | $ | (73 | ) | $ | 141,073 | $ | 86,333 | $ | 35,424 | |||||||||
| Investing activities |
(8,511 | ) | (40,452 | ) | (46,641 | ) | (48,860 | ) | (87,252 | ) | ||||||||||
| Financing activities |
(19,973 | ) | 33,372 | (44,106 | ) | (57,584 | ) | 55,823 | ||||||||||||
Operating activities
During the six months ended March 25, 2016, $82.2 million was provided by operating activities, compared to $0.1 million used by operating activities during the six months ended March 27, 2015. The increase is due to improved operating income and lower investment in working capital, principally accounts receivable and inventory due to the Fence and Sprinkler exit.
69
Table of Contents
During fiscal 2015, operating activities provided $141.1 million of cash, compared to $86.3 million of cash provided by operating activities during fiscal 2014. The increase in cash from operating activities during fiscal 2015 compared to fiscal 2014, was due primarily to improved operating income and lower investment in working capital, principally inventory.
During fiscal 2014, operating activities provided $86.3 million of cash, compared to $35.4 million of cash provided by operating activities during fiscal 2013. The increase in cash from operating activities during fiscal 2014 compared to fiscal 2013, was due primarily to a lower net loss, excluding the impact of non-cash impairment charges impacting earnings and overall improvements in working capital.
Investing activities
During the six months ended March 25, 2016, we used $8.5 million for investing activities, compared to $40.5 million during the six months ended March 27, 2015. The majority of the cash used in the six months ended March 25, 2016 was to fund the acquisitions of APPI and SCI. In aggregate, we paid $31.3 million for both businesses. There were no acquisitions during the six months ended March 25, 2016. Additionally, we invested $9.0 million compared to $12.5 million during the six months ended March 25, 2016 and March 27, 2015, respectively for capital expenditures representing our enhancements of our manufacturing and distribution operations as well as replacement and maintenance of existing equipment and facilities. During the six months ended March 25, 2016, we received $0.5 million related to the sale of a building previously classified as an asset held for sale in Madison, Indiana during fiscal 2013 compared to $2.3 million received during the six months ended March 27, 2015 related to the divestiture of our joint venture in Saudi Arabia.
We used cash for investing activities of $46.6 million for fiscal 2015. The majority use of cash in the current year was to fund the acquisitions of APPI and SCI. In aggregate, we paid $30.5 million for both businesses. Additionally, we invested $26.8 million for capital expenditures representing enhancements of our manufacturing and distribution operations as well as replacement and maintenance of existing equipment and facilities.
We used cash for investing activities of $48.9 million for fiscal 2014, which was primarily to fund the $39.8 million acquisition of substantially all of the assets of EP Lenders, II, LLC d/b/a Ridgeline Plastics, and used $24.4 million for capital expenditures representing enhancements of our manufacturing and distribution operations as well as replacement and maintenance of existing equipment and facilities.
We used cash for investing activities of $87.3 million for fiscal 2013, which was primarily to fund the $102.5 million acquisition of substantially all of the assets of Heritage Plastics. Additionally, we invested $15.0 million toward capital investments representing enhancements of our manufacturing and distribution operations as well as replacement and maintenance of existing equipment and facilities. Discontinued investing activities provided $26.5 million from the sale of our Brazil operations.
Financing Activities
We used $20.0 million for financing activities during the six months ended March 25, 2016. For the six months ended March 25, 2016, AII redeemed $17.0 million of the Second Lien Term Loan Facility at a redemption price of 89.00% of the par value, and $2.0 million at a redemption price of 89.75% of the par value. We had $0 net borrowings under the Credit Facility during the six months ended March 25, 2016, compared to $36.3 million net borrowings under the Credit Facility during the six months ended March 27, 2015. The borrowings under the Credit Facility during fiscal year 2015 were mainly to fund the $31.3 million acquisition SCI and APPI.
70
Table of Contents
We used $44.1 million cash for financing activities during fiscal 2015. The cash was primarily used to repay the $40.0 million balance on the ABL Credit Facility. As of September 25, 2015, AII had no amounts outstanding under the ABL Credit Facility.
For fiscal 2014, we used $57.6 million for financing activities. The use of cash was primarily to repurchase and retire shares of our common stock that were previously held by Tyco for $250.0 million. We also made a net repayment of $19.0 million related to the ABL Credit Facility. These uses of cash were offset by net proceeds of $226.8 million related to the issuance of the long-term debt. We entered into a $420.0 million First Lien Term Loan Facility and a $250.0 million Second Lien Term Loan Facility.
For fiscal 2013, financing activities provided $55.8 million of cash primarily due to net borrowings of $59.0 million related to the ABL Credit Facility offset by reduced net borrowings under the line of credit at a foreign operation of $3.4 million.
The agreements governing the Credit Facilities contain significant covenants, including prohibitions on our ability to incur certain additional indebtedness and to make certain investments and to pay dividends. For all periods presented, AII was in compliance with all covenants of the Credit Facilities. AII was not subject to the minimum fixed charge coverage ratio during any period subsequent to the establishment of the Credit Facilities. See “Description of Certain Indebtedness” and Note 8 to our audited consolidated financial statements included elsewhere in this prospectus for further detail.
Critical Accounting Policies and Use of Estimates
The preparation of financial statements requires management to make estimates and assumptions relating to the reporting of results of operations, financial condition and related disclosure of contingent assets and liabilities at the date of the financial statements. Actual results may differ from those estimates under different assumptions or conditions. The following are our most critical accounting policies, which are those that require management’s most difficult, subjective and complex judgments, requiring the need to make estimates about the effect of matters that are inherently uncertain and may change in subsequent periods.
The following discussion is not intended to represent a comprehensive list of our accounting policies. For a detailed discussion of the application of these and other accounting policies, see Note 1 to our audited consolidated financial statements included elsewhere in this prospectus.
Revenue Recognition
We recognize revenue when persuasive evidence of an agreement exists, delivery has occurred or services have been rendered, the price to the buyer is fixed and determinable and collectability is reasonably assured. Revenues are recognized from product sales when title to the products is passed to the customer, which generally occurs at the point of shipping. Provisions for volume rebates are based upon contractual terms, our historical experience and expectations regarding future customer sales. The amounts recorded may require adjustments if actual experience differs from our estimates. Historically, these adjustments have not been material. Rebates are recognized as a reduction of sales if settled in cash or customer credits. Our provisions for early payment discounts and product returns are estimated using our historical experience to approximate future exposures.
Income Taxes
In determining income for financial statement purposes, we must make certain estimates and judgments. These estimates and judgments affect the calculation of certain tax liabilities and the determination of the recoverability of certain deferred tax assets, which arise from temporary differences between the tax and financial statement recognition of revenue and expense. Certain deferred tax assets are reviewed for recoverability and valued accordingly, considering available positive and negative evidence, including our past results, estimated future taxable income streams and the impact of tax planning strategies in the applicable tax paying jurisdiction. A valuation allowance is established to reduce deferred tax assets to the amount that is
71
Table of Contents
considered more likely than not to be realized. Valuations related to tax accruals and assets can be impacted by changes in accounting regulations, changes in tax codes and rulings, changes in statutory tax rates, and changes in our forecasted future taxable income. Any reduction in future taxable income, including but not limited to any future restructuring activities, may require that we record an additional valuation allowance against our deferred tax assets. An increase in the valuation allowance could result in additional income tax expense in such period and could have a significant impact on our future earnings.
In addition, the calculation of our tax liabilities involves dealing with uncertainties in the application of complex tax regulations in a multitude of jurisdictions across our global operations. Certain tax positions may be considered uncertain requiring an assessment of whether an allowance should be recorded. Our provision for uncertain tax positions provides a recognition threshold based on an estimate of whether it is more likely than not that a position will be sustained upon examination. We measure our uncertain tax position as the largest amount of benefit that is greater than 50 percent likely of being realized upon ultimate settlement. We record interest and penalties related to unrecognized tax benefits as a component of provision for income taxes.
We recognize potential liabilities and record tax liabilities for anticipated tax audit issues in the United States and other tax jurisdictions based on our estimate of whether, and the extent to which, additional taxes will be due. These tax liabilities are reflected net of related tax loss carry-forwards. We adjust these reserves in light of changing facts and circumstances; however, due to the complexity of some of these uncertainties, the ultimate resolution may result in a payment that is materially different from our current estimate of the tax liabilities. If our estimate of tax liabilities proves to be less than the ultimate assessment, an additional charge to expense would result. If payment of these amounts ultimately proves to be less than the recorded amounts, the reversal of the liabilities would result in tax benefits being recognized in the period when we determine the liabilities are no longer necessary.
Pension and Postretirement Benefits
Our pension expense and obligations are developed from actuarial valuations. Two critical assumptions in determining pension expense and obligations are the discount rate and expected long-term return on plan assets. We evaluate these assumptions at least annually. Other assumptions reflect demographic factors such as retirement, mortality and turnover and are evaluated periodically and updated to reflect our actual experience. Actual results may differ from actuarial assumptions. The following table summarizes the impact that a change in these assumptions would have on our operating income for fiscal 2015:
| (in millions) |
50 Basis Point Increase | 50 Basis Point Decrease | ||||||
| Discount rate |
$ | 129.8 | $ | 112.6 | ||||
| Return on assets |
7.3 | 6.3 | ||||||
Long-Lived Asset, Indefinite-Lived Intangibles and Goodwill Impairments
We review long-lived assets, including property, plant and equipment and finite-lived intangible assets, for impairment whenever events or changes in business circumstances indicate that the carrying amount of the asset may not be fully recoverable. We perform undiscounted operating cash flow analyses to determine if impairment exists. For purposes of recognition and measurement of an impairment of assets held for use, we group assets and liabilities at the lowest level for which cash flows are separately identified. If impairment is determined to exist, any related impairment loss is calculated based on fair value. Impairment losses on assets to be disposed of, if any, are based on the estimated proceeds to be received, less costs of disposal.
We assess the recoverability of goodwill and indefinite-lived intangible assets on a yearly basis, or more frequently, if triggering events occur. Our measurement date is the first day of the fourth fiscal quarter. This assessment employs a two-step approach. The first step (“Step 1”) compares the fair value of a reporting unit with its carrying amount, including goodwill. If a reporting unit’s carrying amount exceeds its fair value, a goodwill impairment may exist. The second part of the test (“Step 2”) compares the implied fair value of goodwill with its carrying amount.
72
Table of Contents
Assessing goodwill for impairment requires us to estimate future operating results and cash flows that require judgment by management. Using different estimates could impact the amount and timing of impairment. We determine the fair value of a reporting unit using three valuation approaches: (a) an income approach using a discounted cash flow analysis; (b) a market approach using a comparable company analysis; (c) a market approach using a transaction analysis.
For fiscal 2015, we recorded a $3.9 million non-cash charge for goodwill impairment related to our SCI reporting unit in the Electrical Raceway segment. This impairment was triggered due to a degradation of net sales and earnings in part due to a shift in the mix of products sold to a key customer. This customer had historically purchased a disproportionate amount of higher-margin product for use in a particular geographic end market. This represented a full impairment of goodwill related to SCI. A 10% decrease in the discounted cash flows utilized in Step 1 for each of the remaining reporting units would not have changed our determination that the fair value of each reporting unit was in excess of its carrying value.
The impairment testing for long-lived assets, indefinite-lived intangibles and goodwill involves the use of significant assumptions, estimates and judgments, and is subject to inherent uncertainties and subjectivity. The analysis estimates numerous factors, including future sales, gross profit, selling, general and administrative expense rates and capital expenditures. These estimates are based on our business plans and forecasts. For goodwill and indefinite-lived intangibles, these estimated cash flows are then discounted, which necessitates the selection of an appropriate discount rate. The discount rate used reflects the market-based estimates of the risks associated with the projected cash flows of the reporting unit.
Inventories
We account for inventory valuation for a majority of the Company using the LIFO method measured at the lower-of-cost-or-market value. We have adopted this accounting principle because the LIFO method of valuing inventories reflects how we monitor and manage our business and matches current costs and revenues. Valuation of inventory using the LIFO method is made at the end of our fiscal year based on inventory levels and costs at that time. Accordingly, interim LIFO calculations are based on estimates of expected year-end inventory levels and costs. Other inventories, consisting mostly of foreign inventories, are measured using FIFO costing methods. Inventory cost, regardless of valuation method, includes direct material, direct labor and overhead costs. In circumstances where inventory levels are in excess of anticipated market demand, where inventory is deemed technologically obsolete or not marketable due to its condition or where the inventory cost for an item exceeds its net realizable value, we record a charge to cost of goods sold and reduce the inventory to its net realizable value.
Product Liability
We are partially self-insured for product liability matters. We utilize third-party actuaries to assist us with measuring our exposure for these matters. Our product liability reserves represent both reported claims as well as an estimated for incurred but not reported claims. After a claim is filed, liability is estimated as facts associated with the claim become known. The establishment and update of liabilities for unpaid claims, including claims incurred but not reported, is based on the assessment by our claim administrator of each claim, an independent actuarial valuation of the nature and severity of total claims, and management’s estimate. We utilize a third-party claims administrator to pay claims, track and evaluate actual claims experience, and ensure consistency in the data used in the actuarial valuation. We assess product liability exposures for two different types of matters. The first type are claims and lawsuits alleging that the ABF and ABF II antimicrobial coating on our steel sprinkler pipe causes stress cracking in chlorinated polyvinyl pipe, or “CPVC,” when the two types of pipe are installed in the same system. The second are product liability exposures unrelated to ABF. We measure these liabilities separately from each other as they develop differently.
Stock-Based Compensation
Since fiscal 2011, we have granted certain employees stock options. We have recorded stock compensation expense for common stock options based on the estimated fair value on the grant date using the Black-Scholes
73
Table of Contents
option pricing model. Stock compensation expense is recorded within selling, general and administrative expenses with a corresponding increase in non-current liabilities recognized on a straight-line basis over the requisite service period. Stock options vest ratably over five years. At our discretion, options exercises may be net settled in cash. We have a history of net settling options in cash. Consequently, our stock-based awards are recognized as liability-based awards requiring us to remeasure the value of all outstanding options each reporting period.
Assumptions Underlying Option Pricing
The assumptions used in the Black-Scholes option-pricing model have been determined as follows:
| • | Common Equity Share Price. The implied common equity share price is used as a control point in order to determine the fair value each option grant. |
| • | Expected Volatility. Since we do not have a trading history for our common stock, the expected volatility was determined based on an analysis of reported data for a peer group of companies. The expected volatility of options granted has been determined using an average of the historical volatility measures of this peer group. We expect to continue to do so until such time as we have adequate historical data regarding the volatility of our traded stock price. |
| • | Expected Term. The expected term represents the period that our stock-based awards are expected to be outstanding. Because we have limited historic exercise behavior, we determined the expected term assumption using the “simplified” method, which is an average of the contractual term of the option and its ordinary vesting period. |
| • | Risk-free Interest Rate. The risk-free interest rate is based on U.S. Treasury yields in effect at the time of grant for the expected term of the option. |
| • | Expected Dividend Yield. We have not regularly paid, and do not anticipate paying or declaring, regular cash dividends on our common stock. Therefore, the expected dividend yield is assumed to be zero. |
The fair value of each employee stock option grant has been estimated on the grant date using the Black-Scholes option-pricing model with the following assumptions:
| Six Months Ended March 25, 2016 |
Fiscal Year Ended | |||||||
| September 25, 2015 |
September 26, 2014 |
September 27, 2013 | ||||||
| Expected volatility |
35% | 35% | 55% | 60% | ||||
| Expected term (in years) |
10 | 10 | 10 | 10 | ||||
| Range of risk-free interest rates |
1.24%-1.97% | 0.85%-1.74% | 1.23%-2.09% | 0.0%-0.85% | ||||
| Expected dividend yield |
0.00% | 0.00% | 0.00% | 0.00% | ||||
The Black-Scholes model requires various highly judgmental assumptions, including expected volatility and option term. If any of the assumptions used in the Black-Scholes model changes significantly, equity-based compensation expense may differ materially in the future from that recorded in the current period.
In addition, we estimate the expected forfeiture rate and only recognize expense for those options expected to vest. We estimate the forfeiture rate based on our historical experience. To the extent our actual forfeiture rate is different from our estimate, stock-based compensation expense is adjusted accordingly. A 10% change in the estimated fair value would have resulted in additional expense of $2.5 million.
Determination of Fair Value of Common Stock
We are a privately-held company with no active public market of our common stock. Therefore, our board of directors has estimated the fair value of our common stock at various dates, with input from management, for
74
Table of Contents
purposes of granting stock-based awards. We perform the valuation in order for our board of directors to make an assessment of the fair value of our common stock. The valuations conducted at each reporting period use various assumptions which include:
| • | our historical and current operating performance; |
| • | our expected future operating performance; |
| • | historical and projected enterprise values and trading multiples of guideline public companies; |
| • | comparable transactions by similar companies; |
| • | the lack of marketability of our common stock; and |
| • | the likelihood and associated timing of achieving a liquidity event, such as an initial public offering or a merger or acquisition of us, given prevailing market conditions. |
Since May 2011, we have performed quarterly equity valuations to assist the board in determining a reasonable estimate of the then-current fair value of our common stock for purposes of determining the fair value of our stock options on the grant date. In our equity valuations, the estimated fair value of our common stock has been determined by weighting equally three valuation approaches: (a) an income approach using a discounted cash flow analysis; (b) a market approach using a comparable company analysis; and (c) a market approach using a transaction (mergers and acquisitions) analysis. Such estimates will not be necessary to determine the fair value of new awards once a public trading market for our common shares has been established in connection with the completion of this offering.
The following table provides, by grant date, the number of stock options awarded during fiscal 2015 and the first and second quarters of fiscal 2016 and the exercise price for each set of grants, as well as the associated estimated fair value of our common stock and the fair value of the option in the reporting period in which such grants were made. Subsequent adjustments to the fair value of the options are made each reporting period in accordance with Accounting Standards Codification, or “ASC,” Topic 718, Compensation—Stock Compensation, or “ASC 718.”
| Grant Date |
Options Granted |
Exercise Price |
Implied Fair Value of Common Shares |
Fair Value of Option |
||||||||||||
| July 27, 2015 |
115,000 | $ | 12.50 | $ | 18.00 | $ | 9.58 | |||||||||
| July 31, 2015 |
30,000 | $ | 12.50 | $ | 18.00 | $ | 9.58 | |||||||||
| December 11, 2015 |
6,084 | $ | 10.00 | $ | 21.00 | $ | 13.18 | |||||||||
| January 26, 2016 |
4,713 | $ | 10.00 | $ | 21.00 | $ | 13.18 | |||||||||
On July 25, 2014, our board of directors modified the Atkore International Group Inc. Stock Incentive Plan, or the “Stock Incentive Plan.” The modification to the existing plan included an amendment providing for net cash settlement by us when an employee exercises the options granted to the employee under the plan. As a result of this modification to the Stock Incentive Plan, a substantive liability exists. Therefore, the accounting classification of the option awards was changed from equity to liability as of the date of the modification to the Stock Incentive Plan. The fair value of the option award liability will be remeasured at the end of each prospective reporting period until settlement.
Recent Accounting Pronouncements
On March 30, 2016, the Financial Accounting Standards Board, or “FASB,” issued Accounting Standards Update, or “ASU,” 2016-09, Improvements to Employee Share-Based Payment Accounting, which amends ASC 718. ASU 2016-09 simplifies several aspects of the accounting for share-based payment transactions, including the income tax consequences, classification of awards as either equity or liabilities, and classification on the statement of cash flows. ASU 2016-09 is effective for fiscal years beginning after December 15, 2016, our fiscal 2018. Early adoption is permitted. We are evaluating the effect of adopting this new guidance and its impact on our results of operations, cash flows, or financial position.
75
Table of Contents
On March 17, 2016, the FASB issued ASU 2016-08, Principal versus Agent Considerations (Reporting Revenue Gross versus Net) that amends the principal versus agent guidance in ASU 2014-09. ASU 2016-08 clarifies that the analysis must focus on whether the entity has control of the goods or services before they are transferred to the customer. The ASU also provides additional guidance about how to apply the control principle when services are provided and when goods or services are combined with other goods or services. The new standard effective date will coincide with ASU 2014-09. ASU 2014-09 will be effective beginning with annual periods beginning after December 15, 2017, our fiscal 2019. Early adoption is permitted. We are evaluating the effect of adopting this new guidance and its impact on our results of operations, cash flows, or financial position.
On February 25, 2016, the FASB issued ASU 2016-2, Leases (Topic 842). The ASU requires companies to use a “right of use” lease model that assumes that each lease creates an asset (the lessee’s right to use the leased asset) and a liability (the future rent payment obligations) which should be reflected on a lessee’s balance sheet to fairly represent the lease transaction and the lessee’s related financial obligations. We conduct some of our operations under leases that are accounted for as operating leases, with no related assets and liabilities on our balance sheet. The proposed changes would require that substantially all of our operating leases be recognized as assets and liabilities on our balance sheet. The ASU is effective for annual periods beginning after December 15, 2018, and interim periods therein. Early adoption will be permitted. We are evaluating the effect of adopting this new accounting guidance and its impact on our results of operations, cash flows or financial position.
In November 2015, the FASB issued ASU 2015-17, “Income Taxes (Topic 740): Balance Sheet Classification of Deferred Taxes.” The amendment is part of the FASB’s simplification initiative and requires entities to present deferred tax assets and deferred tax liabilities as non-current in a classified balance sheet rather than as current and non-current. The guidance is effective for public business entities for annual periods beginning after December 15, 2016, and interim periods within those years. Early adoption is permitted and entities are permitted to apply the amendments either prospectively or retrospectively. We adopted this guidance in fiscal 2015 and applied the amendments retrospectively.
In September 2015, the FASB issued ASU 2015-16, Business Combinations (Topic 805): Simplifying the Accounting for Measurement-Period Adjustments. The ASU requires an acquirer to recognize provisional amounts that are identified during the measurement period in the reporting period in which the adjustment amounts are determined rather than restating prior periods. The ASU is effective on a prospective basis for interim and annual periods beginning after December 15, 2015. The Company adopted this new standard beginning with the 2016 fiscal year, and it did not have a material impact on the financial statements.
In June 2015, the FASB issued ASU 2015-10, “Technical Corrections and Improvements.” The ASU is part of an ongoing project on the FASB’s agenda to facilitate updates to the ASC, non-substantive technical corrections, clarifications, and improvements that are not expected to have a significant effect on accounting practice or create a significant administrative cost to most entities. The ASU will apply to all reporting entities within the scope of the affected accounting guidance. The amendments requiring transition guidance are effective for all entities for fiscal years, and interim periods within those fiscal years, beginning after December 15, 2015. Early adoption is permitted, including adoption in an interim period. All other amendments will be effective upon the issuance of this Update. We are evaluating the effect of adopting this new accounting guidance and its impact on our results of operations, cash flows or financial position. We do not believe this update will have a material impact on the financial statements.
In May 2015, the FASB issued ASU 2015-07, “Fair Value Measurement (Topic 820): Disclosures for Investments in Certain Entities That Calculate Net Asset Value per Share (or Its Equivalent).” The update amends ASC 820, “Fair Value Measurement.” This ASU removes the requirement to categorize within the fair value hierarchy investments without readily determinable fair values in entities that elect to measure fair value using net asset value per share or its equivalent. The ASU requires that these investments continue to be shown in the investment disclosure amount to allow the disclosure to reconcile to the investment amount presented in the
76
Table of Contents
balance sheet. This update is effective for public business entities for fiscal years beginning after December 15, 2015, and interim periods within those fiscal years. A reporting entity should apply the amendments retrospectively to all periods presented. The retrospective approach requires that an investment for which fair value is measured using the net asset value per share practical expedient be removed from the fair value hierarchy in all periods presented in an entity’s financial statements. Earlier application is permitted. We are evaluating the effect of adopting this new accounting guidance and its impact on our results of operations, cash flows or financial position. We do not believe this update will have a material impact on the financial statements.
In April 2015, the FASB issued ASU 2015-05, “Intangibles—Goodwill and Other—Internal-Use Software (Subtopic 350-40): Customer’s Accounting for Fees Paid in a Cloud Computing Arrangement.” This ASU provides guidance to customers about whether a cloud computing arrangement includes a software license. If an arrangement includes a software license, the accounting for the license will be consistent with licenses of other intangible assets. If the arrangement does not include a license, the arrangement will be accounted for as a service contract. This update is effective for annual periods, including interim periods within those annual periods, beginning after December 15, 2015. Early adoption is permitted for all entities. We are evaluating the effect of adopting this new accounting guidance and its impact on our results of operations, cash flows or financial position. We do not believe this update will have a material impact on the financial statements.
In April 2015, the FASB issued ASU 2015-04, “Compensation—Retirement Benefits (Topic 715): Practical Expedient for the Measurement Date of an Employer’s Defined Benefit Obligation and Plan Assets.” The amendments allow companies and other organizations with fiscal years that do not end on the last day of a month to measure their defined benefit plans assets and liabilities as of the last day of the month closest to the end of the fiscal year. This update is effective for public business entities for financial statements issued for fiscal years beginning after December 15, 2015, and interim periods within those fiscal years. Earlier application is permitted. We adopted this new accounting guidance in fiscal 2015.
In April 2015, the FASB issued ASU 2015-03, “Simplifying the Presentation of Debt Issuance Costs.” The update changes the presentation of debt issuance costs in the financial statements. The new ASU update requires an entity to present such costs in the balance sheet as a direct deduction from the related debt liability rather than as an asset. Amortization of these costs is reported as interest expense. For public business entities, the ASU’s guidance is effective for fiscal years, and interim periods within those fiscal years, beginning after December 15, 2015. We adopted this new accounting guidance in fiscal 2015 retrospectively for all periods presented.
In February 2015, the FASB issued ASU 2015-02 “Amendments to the Consolidation Analysis.” This update amends the consolidation requirements in ASC 810, “Consolidation.” The amendments change the consolidation analysis required under GAAP. For public business entities, the amendments in the ASU are effective for fiscal years, and interim periods within those fiscal years, beginning after December 15, 2015. Early adoption, including adoption in an interim period, is permitted. We are evaluating the effect of adopting this new accounting guidance and its impact on our results of operations, cash flows or financial position. We do not believe this update will have a material impact on the financial statements.
In January 2015, the FASB issued ASU 2015-01, “Simplifying Income Statement Presentation by Eliminating the Concept of Extraordinary Items.” This update eliminates the concept of an extraordinary item from GAAP. As a result, an entity will no longer (1) segregate an extraordinary item from the results of ordinary operations; (2) separately present an extraordinary item on its income statement, net of tax, after income from continuing operations; or (3) disclose income taxes and earnings-per-share data applicable to an extraordinary item. However, the ASU does not affect the reporting and disclosure requirements for an event that is unusual in nature or that occurs infrequently. The update is effective for fiscal years, and interim periods within those fiscal years, beginning after December 15, 2015, our fiscal 2017. A reporting entity also may apply the amendments retrospectively to all prior periods presented in the financial statements. Early adoption is permitted provided that the guidance is applied from the beginning of the fiscal year of adoption. We are evaluating the effect of adopting this new accounting guidance and its impact on our results of operations, cash flows or financial position. We do not believe this update will have a material impact on the financial statements.
77
Table of Contents
In May 2014, the FASB issued ASU 2014-09, “Revenue from Contracts with Customers,” as a new Topic, ASC 606. The new revenue recognition standard provides a five-step analysis of transactions to determine when and how revenue is recognized. The core principle is that a company should recognize revenue to depict the transfer of promised goods or services to customers in an amount that reflects the consideration to which the entity expects to be entitled in exchange for those goods or services. On August 12, 2015, the FASB announced that it would defer for one year the effective date of the new standard for public and nonpublic entities. The revised effective date for public entities will be annual periods beginning after December 15, 2017. The revised effective date for nonpublic entities will be annual periods beginning after December 15, 2018, our fiscal 2019. Early adoption is permitted. We are evaluating the effect of adopting this new accounting guidance and its impact on our results of operations, cash flows or financial position.
In April 2014, the FASB issued ASU No. 2014-08, “Reporting Discontinued Operations and Disclosure of Disposals of Components of an Entity,” or “ASU 2014-08.” The amended guidance requires that a disposal representing a strategic shift that has (or will have) a major effect on an entity’s financial results or a business activity classified as held for sale should be reported as discontinued operations. The amendments also expand the disclosure requirements for discontinued operations and add new disclosures for individually significant dispositions that do not qualify as discontinued operations. The amendments are effective prospectively for fiscal years, and interim reporting periods within those years, beginning on or after December 15, 2014. The impact on the Company of adopting ASU 2014-08 will depend on the nature and size of future disposals, if any, of a component of the Company after the effective date. We adopted this new accounting guidance beginning in the first fiscal quarter of 2016 and did not have a material impact to the financial statements.
Contractual Obligations
The following table presents our contractual obligations and commitments as of September 25, 2015.
| Estimated Payments Due by Fiscal Year | ||||||||||||||||||||
| ($ in thousands) |
Less than 1 Year |
1-3 Years | 3-5 Years | More than 5 Years |
Total | |||||||||||||||
| First lien loan due April 9, 2021 |
$ | 5,250 | $ | 8,400 | $ | 8,400 | $ | 393,750 | $ | 415,800 | ||||||||||
| Second lien loan due October 9, 2021 |
— | — | — | 250,000 | 250,000 | |||||||||||||||
| Interest expense(a) |
39,622 | 77,806 | 74,518 | 29,210 | 221,156 | |||||||||||||||
| Purchase commitments(b) |
56,822 | 3,438 | — | — | 60,260 | |||||||||||||||
| Operating lease obligations |
7,303 | 12,868 | 5,937 | 7,856 | 33,964 | |||||||||||||||
|
|
|
|
|
|
|
|
|
|
|
|||||||||||
| Total(c) |
$ | 108,997 | $ | 102,512 | $ | 88,855 | $ | 680,816 | $ | 981,180 | ||||||||||
|
|
|
|
|
|
|
|
|
|
|
|||||||||||
| (a) | Interest expense is estimated based on outstanding loan balances assuming principal payments are made according to the payment schedule and interest rates as of September 25, 2015 (4.25% for the ABL Credit facility, 4.50% for the First Lien Term Loan Facility, and 7.75% on the Second Lien Term Loan Facility). |
| (b) | Represents purchases of raw materials in the normal course of business for which all significant terms have been confirmed. |
| (c) | As of September 25, 2015, we had $0.5 million of income tax liability, gross unrecognized tax benefits of $8.1 million and gross interest and penalties of $5.5 million. Of these amounts, $13.5 million is classified as a non-current liability in the consolidated balance sheet. At this time, we are unable to make a reasonably reliable estimate of the timing for such payments in future years; therefore, such amounts have been excluded from the above contractual obligations table. |
The ABL Credit Facility provides for a five-year senior secured revolving credit facility of up to $325.0 million. As of September 25, 2015, we had no amounts drawn under the ABL Credit Facility. We have the ability to continually refinance amounts drawn on the ABL Credit Facility through its maturity on October 23, 2018, subject to borrowing base limitations.
The estimated minimum required pension contribution to our pension plan in fiscal 2016 is $0.6 million.
78
Table of Contents
In the normal course of business, we are liable for contract completion and product performance. In the opinion of management, such obligations will not significantly affect our financial condition, results of operations or cash flows.
Off-Balance Sheet Arrangements
We do not have any off-balance sheet financing arrangements that we believe are reasonably likely to have a material current or future effect on our financial condition, revenues or expenses, results of operations, liquidity, capital expenditures or capital resources.
Quantitative and Qualitative Disclosures about Market Risk
In the normal course of conducting business, we are exposed to certain risks associated with potential changes in market conditions. These risks include fluctuations in foreign currency translation rates, interest rates and commodity prices, including price fluctuations related to our primary raw materials.
Interest Rate Risk
The Credit Facilities bear interest at a floating rate, generally LIBOR plus applicable margin. As a result, we are exposed to fluctuations in interest rates to the extent of our net borrowings under the Credit Facilities, which were $632.3 million at March 25, 2016. As of March 25, 2016, assuming LIBOR exceeded 1.00%, each one percentage point change in interest rates would result in an approximately $6.6 million change in the annual interest expense on our Term Loan Facilities. As of March 25, 2016, assuming availability was fully utilized, each one percentage point change in interest rates would result in an approximately $3.6 million change in annual interest expense on the ABL Credit Facility.
Credit Risk
We are exposed to credit risk on accounts receivable balances. This risk is mitigated due to our large, diverse customer base. In fiscal 2015 our ten largest customers (including buyers and distributors in buying groups) accounted for approximately 32% of our net sales. However, no single customer comprised more than 10% of our consolidated net sales in fiscal 2015, 2014 or 2013. We maintain provisions for potential credit losses and such losses to date have normally been within our expectations. We evaluate the solvency of our customers on an ongoing basis to determine if additional allowances for doubtful accounts receivable need to be recorded. We have historically not been exposed to a material amount of uncollectible receivable balances.
Commodity Price Risk
We are exposed to price fluctuations for our primary raw material commodities such as steel, copper and PVC resin. Our operating performance may be affected by both upward and downward price fluctuations. We are also exposed to fluctuations in petroleum costs as we deliver a substantial portion of the products we sell by truck. We seek to minimize the effects of inflation and changing prices through economies of purchasing and inventory management resulting in cost reductions and productivity improvements as well as price increases to maintain reasonable gross margins. Such commodity price fluctuations have from time to time produced volatility in our financial performance and could do so in the future.
Foreign Currency Risk
Because we conduct our business on an international basis in multiple currencies, we may be adversely affected by foreign exchange rate fluctuations. Although we report financial results in U.S. dollars, approximately 6% of our net sales and expenses are denominated in currencies other than the U.S. dollar, particularly Canadian dollars, British pounds sterling, Australian dollars, Chinese Yuan and New Zealand dollars. Fluctuations in exchange rates could therefore significantly affect our reported results from period to period as we translate results in local currencies into U.S. dollars. We generally do not use derivative instruments to hedge translation risks in the ordinary course of business including the risk related to earnings of foreign subsidiaries.
79
Table of Contents
Company Overview
We are a leading manufacturer of Electrical Raceway products primarily for the non-residential construction and renovation markets and MP&S for the construction and industrial markets. Electrical Raceway products form the critical infrastructure that enables the deployment, isolation and protection of a structure’s electrical circuitry from the original power source to the final outlet. MP&S frame, support and secure component parts in a broad range of structures, equipment and systems in electrical, industrial and construction applications. We believe we hold #1 or #2 positions in the United States by net sales in the vast majority of our products. The quality of our products, the strength of our brands, our reliable service capabilities and our scale and national presence provide what we believe to be a unique set of competitive advantages that positions us for profitable growth.
We manufacture a broad range of end-to-end integrated products and solutions that are critical to our customers’ businesses. Our broad product offering enables us to bundle and co-load a wide range of products, which simplifies the ordering and delivery processes and streamlines logistics, reducing costs for us and our customers. We primarily serve electrical contractors and OEMs both directly and through our established core customer base of electrical and industrial distributors. Our operational footprint, together with our national distribution network, provides important proximity to our customers and enables efficient and reliable delivery of our products. Our scale creates meaningful purchasing power with key suppliers and enables us to leverage common manufacturing technology and processes across our business.
We estimate that we operate in a $13 billion subset of the $78 billion U.S. electrical products market for our Electrical Raceway products and in a $3.8 billion U.S. addressable market for our MP&S products. Both of these markets are highly fragmented and present attractive opportunities for significant growth. As illustrated in the following charts, approximately 68% and 70% of our Adjusted net sales and net sales, respectively, in fiscal 2015 were derived from U.S. construction demand, which primarily consisted of new non-residential construction and MR&R spending on existing non-residential structures. Based on data from Dodge, new non-residential construction starts remain significantly below long-term historical average levels and have meaningful opportunity for growth going forward.
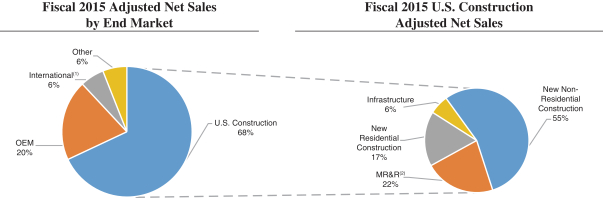
| (1) | International primarily includes Australia, Canada, China, New Zealand and United Kingdom. |
| (2) | MR&R includes non-residential and residential markets. |
80
Table of Contents
| (1) | International primarily includes Australia, Canada, China, New Zealand and United Kingdom. |
| (2) | MR&R includes non-residential and residential markets. |
Since our separation from Tyco in December 2010, we have undertaken a significant transformation of our business. We have acquired six businesses, which have strengthened and extended our capabilities and offerings across our entire product portfolio. We also divested four businesses and permanently closed other businesses that we considered non-core operations due to unfavorable competitive positions or cost structures. This proactive optimization of our portfolio has enabled us to focus on our core businesses, improve our mix of higher margin products, drive market share gains and improve overall profitability. In 2011, our net sales were comprised of 44% Electrical Raceway, 30% MP&S and 26% businesses we have since closed or divested. For LTM March 2016, our adjusted net sales were comprised of 64% Electrical Raceway and 36% MP&S.
In order to execute our business transformation we have significantly upgraded our management team, with over 90% of our executives and 70% of our senior leadership in new roles or new to the Company since 2011. Our executives have extensive experience with leading electrical and industrial corporations, including Danaher Corporation, Eaton Corporation plc, ITT Corporation, Legrand S.A., Pentair plc and Tyco. Our management team has also developed and implemented the ABS, a foundational set of principles, behaviors and beliefs based on driving excellence in strategy, people and processes. The deployment of ABS throughout our operations has provided the skillset, mindset and toolset for our employees to identify, execute and sustain a series of business initiatives that have contributed to our growth and profitability improvements since 2011. By implementing employee incentives that reinforce our organization’s engagement and alignment around ABS, we expect that we will be able to achieve future business improvements and drive profitable growth in excess of the growth rates of the markets in which we compete.
As a result of our transformational business initiatives, we have been able to deliver strong financial and operating performance from fiscal 2011 to LTM March 2016 as set forth below:
| • | We grew our Adjusted net sales and net sales at CAGRs of 3.9% and 2.1%, respectively, to $1,487.1 million and $1,586.1 million, respectively; |
| • | We increased our Adjusted EBITDA at a CAGR of 25.6% to $207.1 million and increased our net income by $53.0 million from a net loss position to net income of $14.6 million; and |
| • | We have driven approximately 800 basis points and 360 basis points of expansion in our Adjusted EBITDA margins and net income margins, respectively. |
For a reconciliation of net sales to Adjusted net sales and of net income (loss) to Adjusted EBITDA, see “Prospectus Summary—Summary Historical Consolidated Financial Data.”
81
Table of Contents
Our Reportable Segments
We operate through two reportable segments: Electrical Raceway and MP&S. Our segments benefit from common raw material usage, similar manufacturing processes and a complementary distribution network. Our scale and rigorous application of efficient manufacturing techniques across both segments enable us to be a low-cost manufacturer, which further adds to our competitive advantage.
Electrical Raceway: Through our Electrical Raceway segment, we manufacture products that deploy, isolate and protect a structure’s electrical circuitry from the original power source to the final outlet. These products are critical components of the electrical infrastructure for new construction and MR&R markets and include electrical conduit and fittings in rigid steel, aluminum and PVC as well as armored cable, flexible and liquidtight electrical conduits. We also manufacture a range of cable tray, cable ladder and wire basket products used to support armored cable and otherwise unprotected cable wiring.
Many of our Electrical Raceway products are core items that we believe must be stocked by U.S. electrical distributors as a staple of their inventory. Electrical conduit deploys, isolates and protects electrical wiring from the original power source to the final outlet within a building or structure. Armored cable is a pre-wired, flexible metal conduit installed inside buildings as part of the electrical branch system, typically between the electrical trunk and the power outlet. Cable trays and cable ladders are open raceway systems used to carry cables through industrial buildings or facilities. Flexible and liquidtight conduits are malleable products that protect electrical wires and cables, while allowing for connections between rigid systems and other electrically powered structures or equipment. Our conduit and cable products are complemented by an integrated offering of mounting systems, fittings and accessories, as well as products from our other businesses that collectively provide what we believe to be the most comprehensive solutions available from a single manufacturer for the Electrical Raceway market in the United States. As a result, we believe we have a meaningful competitive advantage over other providers. Our broad product offering, which includes a variety of base materials, allows us to meet contractors’ changing needs as they design and install electrical systems to comply with various building code requirements in different regions and environments throughout the United States. The vast majority of our Electrical Raceway net sales are made to electrical distributors, who then serve electrical contractors and we consider both to be customers. Our customers benefit from bundling and co-loading of our products, resulting in streamlined logistics and reduced costs.
Our Electrical Raceway products are manufactured at 15 of our U.S. facilities. Our manufacturing and operating scale creates meaningful purchasing leverage with our key suppliers of raw materials. We sell our products to a network of national and regional electrical distributors by utilizing an internal sales force, as well as independent sales agents. Our operational footprint, together with our national distribution network, provides important proximity to our customers, which enables us to deliver products quickly and reliably.
Mechanical Products & Solutions: Through our MP&S segment, we provide products and ancillary services that frame, support and secure component parts in a broad range of structures, equipment and systems in electrical, industrial and construction applications. Our principal products in this segment are metal framing products and in-line galvanized mechanical tube. We sell these products primarily to electrical and mechanical distributors and OEMs. We also provide ancillary value-add services such as engineering, pre-fabrication, product customization and installation that reduce design and on-site construction costs.
Through our metal framing business, we design, manufacture and install metal strut and fittings used to assemble mounting structures that support heavy equipment and electrical content in buildings and other structures. Approximately 40% of our U.S. net sales in strut and fittings are generally sold to mechanical and other broad-line industrial distributors, while the remaining 60% of our U.S. net sales in strut and fittings are used for mounting Electrical Raceway products and are sold to electrical distributors. Through our mechanical tubular products business, we manufacture and market in-line galvanized tubular products. We believe that we are one of only two companies in the United States that manufacture and market in-line galvanized tubular products on a national basis. We believe that approximately 90% of our net sales in this business are made
82
Table of Contents
directly or indirectly to OEM customers serving a wide range of industrial and construction end markets. Our international net sales, which are included in our MP&S segment, primarily consist of metal framing products that serve Electrical Raceway and mechanical support applications.
Our MP&S products are manufactured in eight locations in the United States, as well as in smaller plants for metal framing in the United Kingdom, Australia, New Zealand and China. We believe our scale and rigorous application of efficient manufacturing techniques enables us to be a low cost manufacturer and provide us with a significant competitive advantage.
| Electrical Raceway |
Mechanical Products & Solutions | |||||||||||
| Overview | Products that deploy, isolate and protect a structure’s electrical circuitry from the original power source to the final outlet | Products and services that frame, support and secure component parts in a broad range of structures, equipment and systems in electrical, industrial and construction applications | ||||||||||
| LTM March 2016 Adjusted Net Sales/Net Sales (1)(2) | $961.4 million/$961.4 million | $527.2 million/$621.8 million | ||||||||||
| LTM March 2016 Adjusted EBITDA (1)(3) |
$140.7 million | $90.7 million | ||||||||||
| % Adjusted EBITDA margin(3) | 14.6%/14.6% | 17.2%/14.6% | ||||||||||
| Estimated U.S. Market Size(4) | $13 billion | $3.8 billion | ||||||||||
| Estimated U.S. Market Share(4) | ~8% | ~12% | ||||||||||
| Leading Market Positions(5) |

|

|

|

|

| |||||||
| #1 Steel Conduit (35% share) | #1 PVC Conduit (37% share) | #1 Armored Cable (36% share) |
#2 Metal Framing & Related Fittings (21% share) | #1 In-line Galvanized Mechanical Tube (80% share) | ||||||||
| Core Products | • Electrical conduit and fittings
• Armored cable and fittings
• Flexible and liquidtight electrical conduit and fittings
• Cable tray, cable ladder and wire basket |
• Metal framing and related fittings
• In-line galvanized mechanical tube | ||||||||||
| Primary Market Channel | Electrical distribution | Electrical, industrial and specialized distribution and direct to OEMs | ||||||||||
| Principal Brands |

|

|
|

|

|
| ||||||

| (1) | Includes intersegment sales and excludes amounts attributable to Corporate. |
| (2) | For a reconciliation of LTM March 2016 segment net sales to segment Adjusted net sales see “Prospectus Summary—Selected Historical Consolidated Financial Data.” |
| (3) | For a reconciliation of LTM March 2016 segment Adjusted EBITDA to segment Adjusted EBITDA for the fiscal year ended September 25, 2015, see “Prospectus Summary—Selected Historical Consolidated Financial Data.” Adjusted EBITDA margin is calculated as segment Adjusted EBITDA as a percentage of Adjusted net sales and also as Adjusted EBITDA as a percentage of net sales. |
| (4) | Management estimates based on market data and industry knowledge. Market share is based on our U.S. Adjusted net sales relative to the estimated U.S. addressable market size. |
| (5) | Based on our Adjusted net sales relative to the estimated net sales of known competitors in addressable markets. Unless stated otherwise, market position refers to management’s estimate of our market position in the United States within the estimated addressable markets we serve. |
83
Table of Contents
Our Industries
Electrical Raceway
We estimate that we operate in a $13 billion subset of the $78 billion U.S. electrical products market for our Electrical Raceway products. We believe we hold leading positions in many of the Electrical Raceway product categories that we serve including #1 position by net sales in steel conduit and fittings, PVC conduit and fittings and armored cable and fittings. We believe we have an approximately 8% share of this $13 billion market, in which our existing product offering addresses an estimated $4 billion of the total market opportunity. As a result, we have a substantial opportunity to expand our presence in this market through the introduction of new products as well as through strategic acquisitions. The Electrical Raceway market is highly fragmented and is undergoing significant change as a result of consolidation among electrical distributors and manufacturers, product mix changes stemming from increasing demand for new building technology such as increased facility automation and adoption of LED lighting systems, and a demographic shift in the electrical installer base. We believe these changes are likely to drive the need for additional electrical content in building infrastructure, thereby driving growth in demand for our products. Some of the largest competitors in the Electrical Raceway market include ABB Ltd., Eaton Corporation plc, Pentair plc and Hubbell Incorporated. While most of our competitors manufacture products for only a few Electrical Raceway categories, we believe we provide a more complete offering of products and solutions, which gives us a distinct competitive advantage. Our broad product range enables us to provide customers and contractors with a complete Electrical Raceway solution for projects and add value by bundling and co-loading our products in coordinated shipments. The fragmentation of the market enhances the value of our comprehensive product offering and presents significant opportunity for us to continue to be a consolidator in the industry, broadening our product portfolio and providing greater value to our customers.
Mechanical Products & Solutions
Our MP&S segment serves a number of niche markets that we estimate to comprise an aggregate U.S. addressable market of approximately $3.8 billion, of which we believe we currently have approximately 12% market share. Our businesses in this segment include two principal product areas: metal framing and in-line galvanized mechanical tube.
We design, engineer, manufacture and install an extensive range of metal strut and fittings used to assemble various mounting structures that are used to support equipment and electrical content in buildings and on structures where a specific engineered load capacity is required. We believe we have the #2 position in the metal framing market in the United States with approximately 21% market share. Our primary competitors in the market include B-Line (part of Eaton Corporation plc), Thomas & Betts (part of ABB Ltd.) and Haydon Corporation, as well as a number of smaller manufacturers. Like our Electrical Raceway segment, demand in our metal framing business is primarily driven by non-residential construction trends.
We believe we have the #1 position in the United States in the in-line galvanized mechanical tube market, which is a subset of the broader market for mechanical tubular products. The broader market also includes non-galvanized, pre-galvanized and hot-dipped galvanized tubular products as well as drawn over mandrel, or “DOM,” tubular products. In-line galvanization provides superior anti-corrosive performance, aesthetic appearance and product strength when compared to tubular products using other anti-corrosive processes. We believe that we are one of only two companies in the United States that employs this technology and has the capability to manufacture and market its products on a national basis. In this business, we serve customers in utility grade solar power generation, agricultural and other industrial end markets for whom demand is correlated to overall economic growth and industrial production, as well as market-specific factors such as alternative energy tax credits for solar power.
Non-residential Construction
Demand for products in both our Electrical Raceway and MP&S segments is primarily driven by non-residential construction activity. Construction activity in this market depends on a number of factors, including the
84
Table of Contents
overall economic outlook, general business cycle, interest rates, availability of credit and demographic trends that influence the location and magnitude of construction related to new business activities. We believe we will benefit from the ongoing recovery in the non-residential construction market. According to Dodge, new non-residential construction starts were estimated to be 942 million square feet in 2015, which remains well below historical levels. Starts would need to increase approximately 18% from 2015 levels to reach the average of the five cyclical troughs since 1968 prior to the downturn that began in 2008, approximately 66% to reach the average of the five cyclical peaks over the same period and approximately 35% to achieve the market average since 1968.
Our Competitive Strengths
We believe that we have established a reputation as an industry leader in quality, delivery, value and innovation, primarily as a result of the following competitive strengths:
Leading market positions and strong brands. We believe we have leading market positions in the core products that we offer. Based on management estimates, we believe that approximately 85% of our Adjusted net sales in fiscal 2015 were derived from products for which we hold the #1 or #2 market positions by net sales in the United States. These leadership positions include the #1 positions by net sales in steel conduit and fittings, PVC conduit and fittings, armored cable and fittings and in-line galvanized mechanical tubes, and the #2 position by net sales in metal framing for cable and electrical supports. We go to market with an impressive portfolio of leading brands, including Allied Tube & Conduit, AFC Cable Systems, Heritage Plastics, Unistrut, Power-Strut and Cope. We believe that our leading market positions and strong brands are the result of the reliable performance and quality of our products, our ability to deliver superior service to address our customers’ needs and our well-established customer relationships.
Superior customer value proposition. We offer mission-critical products from a single integrated platform, enabling our customers to conveniently and efficiently purchase a broad range of solutions. Our Electrical Raceway products are core items that we believe must be stocked by U.S. electrical distributors as a staple of their inventory. We believe we maintain the broadest portfolio of products in our industry, enabling us to satisfy this demand and to deliver integrated source-to-outlet electrical solutions. Our ability to bundle and co-load a wide range of Electrical Raceway products for our customers simplifies the ordering and delivery processes and streamlines logistics, reducing costs for us and for our customers. Co-loading benefits our customers by decreasing costs, while bundling allows us to increase our customers’ overall spend by serving as their one-stop-shop. In addition, our ability to provide complete turnkey solutions for large construction and renovation projects creates labor savings for installers. Our MP&S segment employs difficult-to-replicate manufacturing technologies, such as in-line galvanizing, which provides advanced levels of corrosion protection and delivers higher strength levels in mechanical tubular products. We also draw upon our technical expertise and superior customer knowledge to offer ancillary value-added services, such as engineer-certified design and installation, that are not provided by our competitors. Our customer-centric business strategy has translated into strong, consistent performance in terms of product quality, on-time delivery and customer service, further enhancing our reliability and solidifying our customer value proposition. This is evidenced by the average tenure of our top 10 customers, which is approximately 20 years.
Compelling product portfolio with demonstrated ability to innovate and acquire new product capabilities. Since 2011, we have undertaken a series of strategic acquisitions, divestitures and business closures and have developed a number of key new products that have transformed our business into a unique and scalable franchise. These efforts to optimize our product portfolio have expanded our positions in attractive segments of the Electrical Raceway and MP&S markets, while reducing our exposure to less attractive, lower margin businesses and non-core geographies. Through acquisitions, we have expanded our PVC conduit and cable and conduit fittings offerings, enabling us to provide customers with complete Electrical Raceway product solutions. We have also introduced a number of successful new products, such as Luminary Cable, an innovative product that combines data and power transmission within a single armored cable. The success of our portfolio optimization initiatives demonstrates our ability to identify, execute and integrate acquisitions and introduce new products to meet customer demand, and we maintain and continue to pursue a robust pipeline of acquisition targets and
85
Table of Contents
additional new product development opportunities. Given the fragmented nature of the markets we serve and evolving customer needs, we believe there is significant opportunity to continue to leverage this strength to grow our business profitably going forward.
Strong platform for growth across attractive end-markets. We believe that we are well positioned to capitalize on industry growth and end-market opportunities, while leveraging our broadening product offering to secure a larger share of customer spend. Demand for our Electrical Raceway and MP&S products is primarily driven by non-residential construction activity, which remains significantly below historical levels according to Dodge. We believe the continuing recovery in new non-residential construction supports a strong platform for growth, and our meaningful participation in MR&R activity provides a steady base of demand for recurring sales of our products. In addition to the positive tailwinds associated with construction trends, we believe we are positioned to benefit from the expansion of higher-growth market segments particularly suited for our products, such as solar, healthcare and data centers, as well as broader energy-efficiency trends, such as increased facility automation and adoption of LED lighting systems, that are driving greater electrical content in buildings and greater demand for our products.
Significant scale providing barriers to entry. Our industry-leading scale creates significant sales, service, manufacturing and procurement advantages over our competitors. We have developed a large, carefully constructed network of highly trained Electrical Raceway and MP&S sales agents with loyal, long-term relationships with Atkore that represent our products in the market. Our positions on our agents’ line cards (product rosters that describe an agent’s offerings) are powerful and difficult to displace, which we believe creates a sustainable advantage. Our comprehensive, integrated distribution and logistics network, consisting of Electrical Raceway stocking agents, MP&S stocking agents and company-operated warehouse locations across the United States, enables us to provide timely and reliable delivery and support for our largest distributor customers and to respond more quickly than our competitors to changes in customer demand. We believe that our manufacturing and distribution network is strategically located to maximize the overlap with the states and regions with the highest amount of electrical distributor sales in the United States. Our high-volume manufacturing and warehousing operations, including our one million square foot facility in Harvey, Illinois, allow us to leverage shared technology, processes and fixed costs across our platform, creating significant operating efficiencies and cost advantages. We estimate the replacement cost of our production and distribution footprint is over $350 million, which represents a sizable impediment to new competition. Finally, our significant purchasing scale enables us to achieve favorable pricing, terms and delivery from our suppliers. On average, we are able to purchase our core raw materials at discounts to market indices such as the CRU Steel Index and the CDI PVC resin index for conduit.
Strong management team driving a highly efficient operating structure. We believe we have built a world-class management team with over 90% of our executives and 70% of our senior leadership in new roles or new to the Company since 2011. Our management team has established a rigorous metric-driven culture to focus on sustained performance. Through the development and implementation of ABS, the proprietary foundational system by which our Company operates, we have transformed our business into a highly efficient platform poised to deliver future growth and incremental operating efficiency. Our operational efficiency is evidenced by our Perfect Order Rate, or “POR” (which we define as the product of order line fill, order error rate and on time delivery), which has increased from 81% in fiscal 2011 to 92% in fiscal 2015, and our Defective Parts per Million, or “DPPM” (which we calculate as volume returned to us as defective per one million of volume shipped), which has decreased by 34% over the same period. We have also taken measures to ensure our products are optimally priced in the markets we serve, employing a disciplined internal pricing strategy and equipping our sales team with the critical information and tools to optimize pricing decisions. To that end, we have adopted a differentiated pricing approach for individual customers and markets to systematically target premium market pricing. Our market pricing is determined by regional and other applicable competitive dynamics and material cost variations. Aligned with this market strategy, our customer pricing considers size and location. Our rigorous internal processes support sustainability and continuous improvement of our business and drive accountability and high-level engagement by our employees.
86
Table of Contents
Strong margin and cash flow profile. Since fiscal 2011, we have meaningfully improved our financial performance, and we believe that we have significant margin expansion opportunities beyond the results achieved to date. Through our business improvement initiatives and product portfolio optimization activities, we increased our Adjusted EBITDA margins by 800 basis points from 5.9% in 2011 to 13.9% for LTM March 2016 and our net income margins by approximately 360 basis points from (2.7)% in 2011 to 0.9% for LTM March 2016. Our business model generates strong cash flow with limited maintenance capital expenditure requirements that typically approximate 2% of net sales. This has given us the flexibility to pursue accretive acquisition targets while simultaneously reducing the leverage on our balance sheet.
Our Strategies
Our goal is to be our customers’ first choice for Electrical Raceway and MP&S, and we intend to drive profitable growth in excess of the growth rates of the markets in which we operate through the following key strategies:
Increase market share by increasing sales to existing customers. We intend to further penetrate existing markets for our Electrical Raceway products and MP&S by strategically focusing our sales and marketing resources on our highly valued accounts. We have built a robust cross-selling sales organization that targets our largest distributor customers by marketing the benefits of ordering our entire product suite for both inventory stocking and for large projects. Our broad portfolio enables co-loading and bundling of our product solutions in an integrated manner. We intend to further grow our share of wallet with our largest and most valued customers by continuing to deliver cost savings, reliable customer service and the benefits of our single source platform.
Expand our product offering and improve our margin mix through new product development and acquisitions. We proactively develop new products and solutions that allow us to stay at the forefront of the needs of the Electrical Raceway and MP&S markets. We have a long history of innovation, which includes the introductions of Kwik-fit electrical conduit, Unistrut Defender and Luminary Cable. We expect to continue to invest in new product development to drive differentiation and growth. Further, our transformational portfolio optimization since 2011 has included a series of strategic acquisitions, divestitures and business closures that have expanded our positions in attractive segments of the Electrical Raceway and MP&S markets while reducing our exposure to less value-added, lower margin businesses and non-core geographies. Given the fragmented nature of the markets we serve and the sizes of our closest adjacent product categories, we intend to pursue our robust pipeline of opportunities to profitably grow our business in higher margin product categories going forward, primarily in conduit and cable fittings as well as metal framing, cable accessories and conduit.
Capitalize on projected growth in our end markets while expanding into segments with accelerating growth trends. Market forecasts suggest that non-residential construction starts will grow from 2015 levels, which remain below the average of the past five cyclical troughs and significantly below the average annual starts since 1968, according to Dodge. We believe our exposure to new construction will provide momentum for us to increase sales and earnings as construction starts increase, and our MR&R business will provide a stable sales base going forward. Other industry trends that we believe also support our continued growth include increased facility automation, the adoption of LED lighting systems, as well as the expanding need for data centers that require greater electrical circuitry and more of our products and solutions. We intend to place particular emphasis on markets with potential for greater-than-market growth for our products, such as commercial construction, data centers, healthcare and solar.
Continue to provide reliable service and delivery to our customers. Over the last several years, we have made substantial improvements in our service and delivery performance, including significant increases in our POR and reductions in our DPPM. We believe that reliability and quality are key differentiators for our customers when choosing a supplier. As a result of these business improvements, we have strengthened our value proposition to customers and increased our pricing power. We have identified several additional initiatives in manufacturing processes, supply chain, logistics and inventory management that we expect will further improve the quality of our products and our delivery performance. We believe our focus on continuous improvement will further enhance our value to customers and will translate into accelerated sales growth and profitability in the future.
87
Table of Contents
Continue our focus on excellence in processes and execution to drive margin expansion and cash flow improvements. ABS is the foundational system that drives our organizational focus on excellence in strategy, people and processes. ABS, with its key components of LDM and SDP, enables us to identify the key levers to further improve our business and subsequently manage and sustain the business improvements we realize. We believe there is a strong correlation between our implementation and execution of ABS and the business, volume, margin and cash flow conversion improvements we have made over the last four years. We have several initiatives currently underway to continue to improve our profitability and cash flow, including strengthening our Electrical Raceway go-to-market strategy, driving industry best delivery, enhancing our commercial excellence and accelerating innovation and new product development. These and other initiatives are focused on profitably growing our business by becoming our customers’ first choice for Electrical Raceway and MP&S, providing unmatched quality, delivery and value.
Company History
Atkore was incorporated in the State of Delaware in November 2010. Atkore is the sole stockholder of AIH, which is the sole stockholder of AII. Prior to December 2010, we operated as the Tyco Electrical and Metal Products, or “TEMP” business of Tyco International Ltd., or “Tyco.” Atkore was initially formed as a holding company to hold ownership of AIH and to effect the transactions described below.
In December 2010, pursuant to the terms of the Investment Agreement, or the “Investment Agreement” by and among the CD&R Investor, Tyco International Holdings S.à.r.l., or the “Tyco Seller,” Tyco and AIH, (i) the CD&R Investor acquired shares of a newly created class of our cumulative convertible preferred stock, or the “preferred stock” that initially represented 51% of our outstanding capital stock (on an as-converted basis); and (ii) we issued shares of our common stock to the Tyco Seller that initially represented the remaining 49% of our outstanding capital stock. We refer to the transactions described in this paragraph as the “Transactions.”
In April 2014, AII entered into the Term Loan Facilities and used the proceeds therefrom to redeem the Senior Notes and to pay a dividend to AIH, which in turn paid a dividend to us. We used the dividend proceeds to redeem all of the shares of our common stock then held by the Tyco Seller. Also in April 2014, the CD&R Investor converted shares of preferred stock held by it into shares of our common stock.
Since our separation from Tyco, we have undertaken a significant transformation of our business by proactively optimizing our portfolio to enable us to focus on our core businesses, improve our mix of higher margin products, drive market share gains and improve overall profitability.
Recent Acquisitions. In addition to our organic growth, we have transformed our Company through acquisitions in recent years, allowing us to expand our product offerings with existing and new customers. See “Management’s Discussion and Analysis—Business Factors Influencing our Results of Operations—Recent Acquisitions” for further detail.
Divestitures and Restructurings. Since 2011, we have continuously evaluated our operations to ensure that we are investing resources strategically. Our assessment has included existing operating performance, required investment to improve performance and the overall complexities of doing business in certain markets and geographic regions. After careful consideration, we streamlined our business through a combination of business divestitures, asset sales and the exit of certain product lines. See “Management’s Discussion and Analysis—Business Factors Influencing our Results of Operations—Divestitures and Restructuring” for further detail.
Our Products
Our principal Electrical Raceway products are used primarily in non-residential construction and renovation applications to deploy, isolate and protect a structure’s electrical circuitry from the original power source to the final outlet. These products include electrical conduit and fittings; armored cable and fittings; cable trays, mounting systems and fittings, which are critical components of the electrical infrastructure for new construction and MR&R markets. We believe we hold #3 positions in the United States by net sales for our flexible and liquidtight conduit & fittings
88
Table of Contents
products and our cable tray, cable ladder & fittings products. Our MP&S products and services frame, support and secure component parts in a broad range of structures, equipment and systems in electrical, industrial and construction applications. Our principal products in this segment are metal framing and in-line galvanized mechanical tube. Our metal framing products are used in the installation of electrical systems and various support structures. In total, we operate 27 manufacturing facilities and 25 distribution facilities that enable us to efficiently receive materials from our suppliers and deliver products to our customers. In fiscal 2015, 93% of our net sales were to customers located in the United States. Our global footprint has been streamlined in recent years to improve manufacturing capacity utilization across our facilities and to enhance the efficiency of our transportation and logistics networks.
An overview of our product offerings is provided below:
| Product Category |
Sample Products |
Brands |
Sample Product Images | |||||||
| Electrical Raceway |
|
Metal Electrical Conduit and Fittings |
Metal Conduit: • Electrical Metallic Tubing (EMT) • Intermediate Metal Conduit (IMC) • Galvanized Rigid Conduit (GRC) Metal Conduit Fittings: • Elbows • Couplings • Nipples • Conduit Bodies |
|
| |||||
| PVC Electrical Conduit & Fittings |
PVC Conduit: • Rigid Non-Metallic Conduit (RNC) PVC Conduit Fittings: • Elbows • Couplings • Conduit Bodies • Duct spacers |
|
| |||||||
| Flexible Electrical Conduit and Fittings | Flexible Electrical Conduit: • Flexible Metallic Conduit (FMC) • Liquidtight Flexible Metal Conduit (LFMC) • Liquidtight Flexible Non-Metallic Conduit (LNFC) • Flexible Metallic Tubing (FMT) Flexible Electrical Conduit Fittings: • Cord Connectors • Angle Connectors |
|
| |||||||
| Armored Cable and Fittings | Amored Cable: • Metal Clad Cable (MC) • Armor Clad Cable (AC) • Healthcare Facility Cable (HCF) Amored Cable Fittings: • Connectors • Service Entry Fittings |
|

| |||||||


89
Table of Contents
| Product Category |
Sample Products |
Brands |
Sample Product Images | |||||||
| Electrical Raceway |

|
Cable Tray & Cable Ladders | • Ladder Cable Tray • Hat Cable Tray • Channel Cable Tray • I Beam Cable Tray • Wire Basket Cable Tray |

|
| |||||
| MP&S |

|
Metal Framing & Fittings | • Channel • Channel Fittings • Pipe Clamps/Hangers • Concrete Inserts |
|

| |||||
| Construction Services | • Design, Fabrication and Installation Services • Modular support structures • Fall protection |

|

| |||||||
| Mechanical Pipe | • In-line galvanized mechanical tube • Non-galvanized tube • Fabrication services |

|

| |||||||
| Flexible Sprinkler Drops | • Commercial • Industrial/Duct • Cleanroom • Institutional • Cold storage |
|

| |||||||
| Barbed Tape | • Security Confinement • Power Station • Military / Border • Law Enforcement |

|

| |||||||


The table below shows the amount of net sales contributed by each of our product categories which accounted for 10 percent or more of our consolidated net sales in any of the last three fiscal years:
| Fiscal Year Ended | ||||||||||||
| ($ in thousands) |
September 25, 2015 | September 26, 2014 | September 27, 2013 | |||||||||
| Armored Cable & Fittings |
$ | 332,153 | $ | 341,912 | $ | 320,149 | ||||||
| Metal Electrical Conduit & Fittings |
320,367 | 300,594 | 275,817 | |||||||||
| Mechanical Pipe |
286,799 | 282,789 | 279,696 | |||||||||
| PVC Electrical Conduit & Fittings |
269,808 | 238,042 | 59,377 | |||||||||
| Metal Framing & Fittings |
174,976 | 176,047 | 178,772 | |||||||||
| Other |
166,472 | 170,766 | 163,364 | |||||||||
| Impact of Fence and Sprinkler |
178,593 | 192,688 | 198,722 | |||||||||
|
|
|
|
|
|
|
|||||||
| Net Sales |
$ | 1,729,168 | $ | 1,702,838 | $ | 1,475,897 | ||||||
|
|
|
|
|
|
|
|||||||
90
Table of Contents
We have a long history of innovation, as illustrated by the following new product introductions and expansions:
| • | 2009: Kwik Conduit and True Color expansion (metal conduit). |
| • | 2012: Unipier Rooftop Supt System (metal framing); Elbows, Couplings and Nipples (metal conduit); HCF Cure Line (armored cable) and Safety Rated Cable Tray (cable tray). |
| • | 2013: Value Series, Defender Line, Unistrut Commercial (metal framing); Mid-Span Splice Plates and Ventilated Channel (cable tray) and Luminary Cable (armored cable). |
| • | 2015: Wide-Slotted Channel, Cush-A-Clamp expansion and Heavy Duty Concrete Insert (metal framing) and Super Kwik Coupler (metal conduit). |
Marketing
Our products are primarily marketed by commissioned agents and sold directly to electrical and industrial distributors who resell our products under recognized brand names, including Allied Tube & Conduit, AFC Cable Systems, Heritage Plastics, Unistrut, Power-Strut and Cope, as well as certain other sub-brands that are used regionally or in niche markets. Our commissioned agents are selected, trained and managed by our regional sales teams and supported by product managers who ensure that agents are adequately knowledgeable and sufficiently trained to represent our brands to our distribution customers. We stimulate end-user demand by promoting our products and solutions directly to architects, electrical engineers, electrical contractors and electrical code authorities across the United States. We also work directly with electrical contractors, who install Electrical Raceway products on new construction or renovation projects to assist them in selecting the most effective electrical raceway solution. In certain of the markets we serve, we market directly to electrical and industrial distributors, OEMs and governmental entities.
Distribution
We primarily sell and distribute our products through electrical, industrial and specialty distributors and OEMs. For many of the over 12,000 electrical-distributor branches in the United States, our products are must-stock lines that form a staple of their business. We serve a diverse group of end markets, including new construction, MR&R and infrastructure, diversified industrials, alternative power generation, healthcare, data centers and government. End-users, which are typically electrical, industrial and mechanical contractors as well as OEMs, install our products during non-residential, residential and infrastructure construction and renovation projects or in assembly and manufacturing processes.
Distribution-based sales accounted for approximately 77% and 75% of our net sales and Adjusted net sales, respectively, for fiscal 2015. We distribute our products to electrical and industrial distributors from our manufacturing facilities as well as from over 50 dedicated distribution facilities owned by our agents. Our products are also stocked by electrical and industrial distributors who are located in major cities and towns across the United States. Some of our products are purchased by OEMs and used as part of their products and solutions in applications such as utility solar framing, conveyor systems and fabric cover buildings. OEM sales accounted for approximately 18% and 20% of our net sales and Adjusted net sales, respectively, for fiscal 2015.
Our company-owned distribution footprint is concentrated in North America (the United States and Canada), with additional facilities in Australia, China, New Zealand and the United Kingdom.
Products are generally delivered to the dedicated distribution centers from our manufacturing facilities and then subsequently delivered to the customer. In some instances, a product is delivered directly from our manufacturing facility to a customer or end-user. In many cases, our products are bundled and co-loaded when shipped. We contract with a wide range of transport providers to deliver our products, primarily via semi-tractor trailer.
Customers
Our sales and marketing processes are primarily focused on serving our immediate customers, including electrical, industrial and specialty distributors and OEMs. We believe customers view us as offering a strong
91
Table of Contents
value proposition based on our broad product offering, strong brands, short order cycle times, reliability and consistent product quality. For each of fiscal 2015, 2014 and 2013, approximately 93%, 92% and 91%, respectively, of our net sales were sold to customers located in the United States.
Our net sales by geographic area were as follows:
| Fiscal Year Ended | ||||||||||||
| (in millions) |
September 25, 2015 |
September 26, 2014 |
September 27, 2013 |
|||||||||
| United States |
$ | 1,605 | $ | 1,571 | $ | 1,338 | ||||||
| International |
124 | 132 | 138 | |||||||||
|
|
|
|
|
|
|
|||||||
| Total |
$ | 1,729 | $ | 1,703 | $ | 1,476 | ||||||
|
|
|
|
|
|
|
|||||||
In fiscal 2015, our top ten customers accounted for approximately 32% of net sales. No single customer, even after consolidating all branches of such customer, which often make independent purchasing decisions, accounted for more than 6% of our net sales in fiscal 2015, fiscal 2014 or fiscal 2013. Our customers include global electrical distributors (such as Consolidated Electrical Distributors, Inc., Graybar Electric Company, Rexel, Sonepar S.A. and Wesco International, Inc.), independent electrical distributors (such as Affiliated Distributors, Inc. and IMARK Group, Inc.) and industrial distributors and big-box retailers (such as The Home Depot, Inc., HDSupply Holdings, Inc., Fastenal Company, W.W. Grainger, Inc. and Menard, Inc.).
Suppliers and Raw Materials
We use a variety of raw materials in the manufacture of our products. Our primary raw materials are steel, copper and PVC resin. We believe that sources for these raw materials are well-established, generally available on world markets and are in sufficient quantity that we may avoid disruption to our business if we encountered an interruption from one of our existing suppliers. Our primary suppliers of steel are ArcelorMittal, AK Steel and Nucor; our primary suppliers of copper are AmRod and Freeport McMoran; and our primary suppliers of PVC resin are Axiall, Formosa and Oxy Vinyls. We strive to maintain strong relationships with our suppliers.
Seasonality
In a typical year, our operating results are impacted by seasonality. Weather can impact the ability to pursue non-residential construction projects at any time of year in any geography, but historically, our slowest quarters have been the first and second fiscal quarters of each fiscal year when frozen ground and cold temperatures in many parts of the country can impede the start and pursuit of construction projects. Sales of our products have historically been higher in the third and fourth quarters of each fiscal year due to favorable weather and longer daylight conditions during these periods. Seasonal variations in operating results may also be significantly impacted by inclement weather conditions, such as cold or wet weather, which can delay construction projects as well as by adverse economic conditions.
Manufacturing
We currently manufacture products in 27 facilities and operate a total footprint of approximately five million square feet of manufacturing and distribution space in six countries. Our headquarters are located in Harvey, Illinois, which is also the location of our largest manufacturing facility. Similar to our distribution footprint, our manufacturing footprint is currently concentrated in the United States, with additional facilities in Australia, China, New Zealand and the United Kingdom. In fiscal 2016, we closed a Philadelphia, Pennsylvania tube and conduit manufacturing plant, and we intend to continue to look for opportunities to achieve cost reductions through improved manufacturing efficiencies and, from time to time, the consolidation or migration of manufacturing facilities.
92
Table of Contents
With respect to our tube and conduit products, we believe we are a technology leader in the in-line galvanizing manufacturing process and have developed specialized equipment that enables us to produce a variety of low-cost high-quality galvanized tube products. Our subsidiary, Allied Tube & Conduit Corporation, or “Allied Tube,” developed an in-line galvanizing technique (Flo-Coat) in which zinc is applied in a continuous process when the tube and pipe are formed. The Flo-Coat galvanizing process provides superior zinc coverage of fabricated metal products for rust prevention and lower cost manufacturing than traditional hot-dip galvanization.
Competition
The industries in which we operate are highly competitive. Our principal competitors range from national manufacturers to smaller regional manufacturers and differ by each of our product lines. We also face competition from manufacturers in Canada, Mexico and several other international markets, depending on the particular product. We believe our customers purchase from us because we deliver quality products, timely delivery and value. Competition is generally on the basis of product offering, product innovation, quality, service and price.
There are many competitors in each of our segments. The main competitors in each of these segments are listed below:
Electrical Raceway: ABB Ltd., Eaton Corporation plc, Pentair plc and Hubbell Incorporated
Mechanical Products & Solutions:
| • | Metal Framing: B-Line (part of Eaton Corporation plc), Thomas & Betts (part of ABB Ltd.) and Haydon Corporation |
| • | Mechanical Tube: Wheatland Tube and Western Tube & Conduit |
Intellectual Property
Patents and other proprietary rights can be important to our business. We also rely on trade secrets, manufacturing know-how, continuing technological innovations, and licensing opportunities to maintain and improve our competitive position. We periodically review third-party proprietary rights, including patents and patent applications, in an effort to avoid infringement of third-party proprietary rights, identify licensing opportunities and monitor the intellectual property claims of others.
We own a portfolio of patents and trademarks and we are also a licensee of certain patents and a licensor of other patents. Patents for individual products extend for varying periods according to the date of patent filing or grant and the legal term of patents in the various countries where patent protection is obtained. We rely on both trademark registration and common law protection for trademarks. Trademark rights may potentially extend indefinitely and are dependent upon national laws and use of the trademarks.
While we consider our patents and trademarks to be valued assets, we do not believe that our competitive position is dependent on patent or trademark protection or that our operations are dependent upon any single patent or group of related patents. We nevertheless face intellectual property-related risks. For more information on these risks, see “Risk Factors—Risks Related to Our Business—We may not be able to adequately protect our intellectual property rights in foreign countries, and we may become involved in intellectual property disputes.” Other than licenses to commercially available third-party software, we do not believe that any of our licenses to third-party intellectual property are material to our business taken as a whole.
Management of Information Technology Systems
Historically, information technology has not been a significant differentiator for us in our markets, however, we believe that ease of doing business with us will become increasingly important to our growth. Currently, we operate our business using widely commercially available hardware and software products with well-developed support
93
Table of Contents
services. In addition to these widely available IT products, we rely on internally developed software called Allied 1 for our order entry, finished goods inventory, shipping and sales history system. This system has been used for nearly 30 years and has grown to meet our needs. We have invested more than $6.0 million in the past three fiscal years and installed and implemented a new general ledger and financial reporting system for the entire Company replacing a number of systems used in various parts of the Company. In addition, we have chosen to migrate our email service and various other information technology services to a cloud computing platform hosted by Microsoft.
Employees
As of March 25, 2016, we employed approximately 3,200 total full-time equivalent employees of whom approximately 12% are temporary or contract workers. Our employees are primarily located in the United States with about 11% employed at our international locations in Australia, Canada, China, New Zealand and the United Kingdom.
Approximately 34% of our employees are represented by a union under a collective bargaining agreement. All unions are either located in the United States or Canada with no unions or Worker’s Councils at any of our other locations abroad. From time to time our collective bargaining agreements expire and come up for re-negotiation, including three bargaining units this year. Our largest facilities in Harvey, Illinois and New Bedford, Massachusetts have contracts that expire in April 2017 and February 2018, respectively. We believe our relationship with our employees is good.
Regulatory Matters
Our facilities are subject to various federal, state, local and non-U.S. requirements relating to the protection of human health, safety and the environment. Among other things, these laws govern the use, storage, treatment, transportation, disposal and management of hazardous substances and wastes; regulate emissions or discharges of pollutants or other substances into the air, water, or otherwise into the environment; impose liability for the costs of investigating and remediating, and damages resulting from, present and past releases of hazardous substances and protect the health and safety of our employees.
The cost of compliance with environmental, health and safety laws and capital expenditures required to meet regulatory requirements is not anticipated to have a material effect on our financial condition, results of operations, cash flows or competitive position.
In October 2013, the State of Illinois filed a complaint against our subsidiary Allied Tube, alleging violations of the Illinois Environmental Protection Act relating to discharges to a storm sewer system that terminates at Allied Tube’s Harvey, Illinois manufacturing facility. The State sought an injunction ordering Allied Tube to take immediate corrective action to abate the alleged violations and civil penalties as permitted by applicable law. Allied Tube has reviewed management practices and made improvements to its diesel fuel storage and truck maintenance areas to resolve the State’s claims. We are discussing with the State entering into a consent order that would require Allied Tube to pay a relatively small penalty, install equipment and take certain additional remedial actions to resolve the State’s claims.
In August 2014, we received from the Illinois Environmental Protection Agency, or the “IEPA,” the terms of a proposed new stormwater discharge permit for our Harvey, Illinois manufacturing facility. Because the facility currently does not meet the zinc limit set forth in the proposed permit, we are in negotiations with the IEPA to agree upon mutually acceptable discharge limits and the effective date of the new permit. In the meantime, the facility is operating under an extension of the terms of our existing stormwater discharge permit. Our negotiations with the IEPA may result in an obligation to install certain pollution control equipment to help reduce the amount of zinc in our stormwater discharge.
94
Table of Contents
We are working with the City of Phoenix to address proposed wastewater discharge limits for our Phoenix, Arizona facility. We do not currently expect that any such obligations would have a material effect on our financial condition, results of operations, cash flows or competitive position.
We are continually investigating, remediating or addressing contamination at our current and former facilities. For example, we are currently monitoring groundwater contamination at our Wayne, Michigan facility. Future remediation activities may be required to address contamination at or migrating from the Wayne, Michigan site. Many of our current and former facilities have a history of industrial usage for which additional investigation and remediation obligations could arise in the future and which could materially adversely affect our business, financial condition, results of operations or cash flows.
Properties
Our corporate headquarters are located in owned premises at 16100 South Lathrop Avenue, Harvey, Illinois. We and our operating companies own and lease a variety of facilities, principally in the United States, for manufacturing, distribution and light assembly. Our manufacturing, distribution and assembly centers are strategically located to optimize route efficiency, market coverage and overhead. The following chart identifies the number of owned and leased facilities, other than the headquarter properties listed above, used by each of our reportable segments as of March 25, 2016. We believe that these facilities, when considered with the corporate headquarters, offices, and warehouses are suitable and adequate to support the current needs of our business.
| Reportable Segment |
Owned Facilities |
Leased Facilities |
||||||
| Electrical Raceway |
7 | 12 | ||||||
| Mechanical Products & Solutions |
7 | 26 | ||||||
We believe that our facilities are well-maintained and are sufficient to meet our current and projected needs. We also have an ongoing process to continually review and update our real estate portfolio to meet changing business needs. Our two principal facilities are located in Harvey, Illinois and New Bedford, Massachusetts. Our owned facility in Harvey, Illinois supports both our Electrical Raceway and MP&S segments. Our owned facility in New Bedford, Massachusetts supports our Electrical Raceway segment.
Legal Proceedings
In the ordinary course of conducting business activities, we and our subsidiaries become involved in judicial, administrative and regulatory proceedings involving both private parties and governmental authorities. These proceedings include insured and uninsured matters that are brought on an individual, collective, representative and class action basis, or other proceedings involving product liability, product warranty, contract disputes, environmental concerns, intellectual property matters and other matters.
For example, we have received claims and been named as a defendant in lawsuits alleging that our ABF and ABF II anti-microbial coated steel sprinkler pipe, which we have not manufactured for several years, is incompatible with CPVC and caused stress cracking in such pipe manufactured by third parties when installed together, which we refer to collectively as the “Special Products Claims.” Approximately a dozen Special Products Claims are under investigation or are in litigation, including Wind Condominium Association, Inc., et al. v. Allied Tube & Conduit Corporation, et al., a putative class action claim filed on November 16, 2015 in the Southern District of Florida, which defines a “National Class” and a “Florida Subclass” consisting of all condominium associations and building owners who had ABF and/or ABF II installed in combination with CPVC from January 1, 2003 through December 31, 2010 nationwide and in Florida, respectively. The plaintiffs seek to recover monetary damages for the replacement and repair of fire suppression systems and any damaged real property or personal property, as well as consequential and incidental damages.
95
Table of Contents
At this time, we do not expect the outcome of the Special Products Claims proceedings, or any other proceeding, either individually or in the aggregate, to have a material effect on our financial statements, and we believe that our reserves are adequate for all claims, including for Special Products Claims contingencies. However, it is possible that additional reserves could be required in the future that could have a material effect on our financial statements. This additional loss or range of losses cannot be recorded at this time, as it is not reasonably estimable. See “Certain Relationships and Related Party Transactions—Investment Agreement—Indemnification” for information with respect to certain contractual indemnification rights we have with respect to Special Products Claims. See also Note 16 to our audited consolidated financial statements and Note 15 to our unaudited condensed consolidated financial statements included elsewhere in this prospectus.
96
Table of Contents
The following table sets forth certain information concerning our executive officers and directors. The respective age of each individual in the table below is as of April 1, 2016.
| Name |
Age |
Position | ||
| Philip W. Knisely |
61 | Chairman | ||
| John P. Williamson |
55 | President and Chief Executive Officer, Director | ||
| James A. Mallak |
60 | Vice President and Chief Financial Officer | ||
| Kevin P. Fitzpatrick |
52 | Vice President, Global Human Resources | ||
| Daniel S. Kelly |
55 | Vice President, General Counsel and Secretary | ||
| Peter J. Lariviere |
55 | Vice President and President, Cable Solutions | ||
| Michael J. Schulte |
49 | Vice President and President, Mechanical Products & Solutions | ||
| William E. Waltz |
52 | Vice President and President, Conduit & Fittings | ||
| James G. Berges |
68 | Director | ||
| Jeri L. Isbell |
58 | Director | ||
| Scott H. Muse |
59 | Director | ||
| Nathan K. Sleeper |
42 | Director | ||
| William R. VanArsdale |
64 | Director | ||
| A. Mark Zeffiro |
50 | Director | ||
| Jonathan L. Zrebiec |
36 | Director |
Philip W. Knisely became a director in, and has served as Chairman of our board of directors since, December 2010. Mr. Knisely has been an operating advisor to CD&R since 2010. In 2010, he retired from Danaher Corporation, a leading manufacturer of medical equipment and environmental and professional instrumentation, where he served for ten years as Executive Vice President and Corporate Officer. Prior to Danaher, Mr. Knisely co-founded Colfax Corporation, a designer, manufacturer, and distributor of fluid handling products, serving as President and Chief Executive Officer. Previously, Mr. Knisely was President and Chief Executive Officer of AMF Industries, a privately held diversified manufacturer, and spent ten years at Emerson Electric. He serves as a director of Beacon Roofing Supply, Inc. and previously served on the board of directors of Diversey Inc. and Roofing Supply Group Inc. He serves on the board of trustees of the Darden School Foundation at the University of Virginia, where he received his M.B.A. Mr. Knisely was also a GM Fellowship Scholar at General Motors Institute, where he earned a B.S. in Industrial Engineering. Mr. Knisely brings to our board his extensive management, operations and business experience, as well as his leadership, financial and core business skills, all of which qualify him to serve on our board of directors.
John P. Williamson has served as our President and Chief Executive Officer and as a director since June 2011. Prior to joining Atkore, Mr. Williamson spent six years with ITT Corporation, most recently as President of the Water & Wastewater Division, a global manufacturing company headquartered in Stockholm, Sweden. Prior to that, he was President of the Residential and Commercial Water Division and ITT Corporate Vice President and Director for Operational Excellence. Before joining ITT Corporation, Mr. Williamson was employed for more than 17 years within several operating divisions of Danaher Corporation. Until 2005, Mr. Williamson was the Senior Vice President of Global Operations for Fluke Corporation. Mr. Williamson also served as President of Jennings Technology Corporation. Additionally, he held leadership and management positions at Veeder-Root Company, Danaher Controls, Dynapar and Disc Instruments. Mr. Williamson began his career with Connector Technology, Inc. in 1981. Mr. Williamson is a member of the Board of Governors of the National Electrical Manufacturers Association. Mr. Williamson earned a B.A. in Business Administration from California State University, Fullerton and holds a Certificate in Strategic Marketing Management from Harvard Business School. Mr. Williamson’s intimate knowledge of our day-to-day operations as President and Chief Executive Officer and his significant prior experience in our industry qualify him to serve on our board of directors.
97
Table of Contents
James A. Mallak has served as our Vice President and Chief Financial Officer since March 2012. From March 2008 to March 2012, Mr. Mallak served as Managing Director at Alvarez & Marsal, a global professional services firm. From 2004 to 2007, Mr. Mallak was the Chief Financial Officer at Tower Automotive Inc. Mr. Mallak also served as Executive Vice President and Chief Financial Officer for two operating segments of Textron, Inc., a global manufacturer for the aerospace and defense, automotive and transportation, as well as industrial manufacturing industries. Additionally, he held several financial positions with ITT Corporation. Mr. Mallak holds a B.A. in Accounting from Michigan State University and an M.B.A. from the Eli Broad College of Business at Michigan State University.
Kevin P. Fitzpatrick has served as our Vice President for Global Human Resources since January 2012. Prior to that, Mr. Fitzpatrick served as Vice President of Human Resources for A.M. Castle & Company, a global distributor of specialty metals and supply chain services for aerospace, oil and gas, heavy equipment and other industries, from 2009 to 2012. Mr. Fitzpatrick also served as Vice President, North American Human Resources and Administration for UPM Kymmene Corporation, a global forest products manufacturer, from 2001 to 2009. His past experience includes leadership roles in other manufacturing companies, where he was responsible for compensation and benefits, labor relations, talent acquisition and management, training, and employment matters. Mr. Fitzpatrick holds a B.A. from the University of Wisconsin, Whitewater, an M.B.A. from Northwestern University Kellogg School of Management and a J.D. from Marquette University Law School.
Daniel S. Kelly has served as our Vice President, General Counsel and Secretary since September 2013. Prior to joining Atkore, he spent 20 years working in strategic legal roles within ITT Corporation and its spinoff, Xylem, Inc., which manufactures equipment that transports, treats and tests water and wastewater. From 2011 to 2013, Mr. Kelly served Deputy General Counsel and acting General Counsel of Xylem, Inc. From 2010 to 2011, he was Vice President and General Counsel at ITT Fluid and Motion Control, covering ITT’s commercial business worldwide and from 2008 to 2010 served as Vice President and General Counsel at ITT Defense Electronics & Services. Mr. Kelly also spent three years at ITT headquarters as Deputy General Counsel, Director Field Legal Support. Mr. Kelly earned a B.S. from Georgetown University and a J.D. from Loyola University of Chicago School of Law.
Peter J. Lariviere has served as our Vice President and President of Cable Solutions since September 2015, after joining Atkore as Chief Operating Officer in September 2013, with responsibility for manufacturing, engineering, sourcing, distribution and logistics and serving as President, AFC Cable business unit from January 2015 until September 2015. Mr. Lariviere was previously President of Storage and Workplace Solutions, a division of Stanley Black and Decker, from 2010 until 2013. Prior to that, Mr. Lariviere was Chief Executive Officer at Lista International Corporation. Mr. Lariviere also held several positions at Amesbury Group Inc., including Senior Vice President-Window Hardware Division and Group Vice President. Mr. Lariviere holds a B.S. from the University of Massachusetts and an M.B.A. from New Hampshire College. He also is a graduate of the Executive Management Program at University of North Carolina, Kenan-Flagler Business School.
Michael J. Schulte has served as our Vice President and President of Mechanical Products & Solutions since September 2015, after joining Atkore as President, Metal Framing and Cable Management in May 2014. From 1990 until joining Atkore in 2014, Mr. Schulte spent the majority of his career in executive positions at various divisions of Danaher Corporation, including President-Gilbarco North America and President-Hennessy Industries. Mr. Schulte also worked at Danaher Motion Group, including Group Senior Vice President Global Sales & Marketing/President of Dover Motion. During his tenure there, Mr. Schulte also held positions of President-Linear Motion Systems, Europe President-Danaher Motion and VP/GM of Servo & Stepper Drives. Mr. Schulte started with Danaher in the Sensors and Controls division holding positions of Materials Manager, Plant Manager, Marketing Manager, and Vice President/General Manager. Before Danaher Corporation, Mr. Schulte worked at the Boston Consulting Group after beginning his career as District Sales and Service Manager at Oldsmobile Division, General Motors Corporation. Mr. Schulte holds a B.S. from GMI Engineering & Management Institute and an M.B.A. from Harvard Business School.
William E. Waltz has served as our Vice President and President of Conduit & Fittings since September 2015, after joining Atkore as President, Plastic Pipe and Conduit business unit in 2013. From 2009 until joining
98
Table of Contents
Atkore in 2013, Mr. Waltz was Chairman and Chief Executive Officer at Strategic Materials, Inc., North America’s largest glass recycling company. Prior to that, he spent 15 years in various divisions of Pentair plc, a water technologies and industrial products company, including leadership roles of President—Pentair Flow Technologies, Vice President and General Manager of Pentair Water Treatment Division, Vice President and General Manager for Aurora Pump, Vice President of Sourcing and International Operations; as well as Director of Pentair’s Commercial & Industrial business unit. Mr. Waltz began his career at General Electric Company. Mr. Waltz holds a B.S. from Pennsylvania State University, an M.S. in Computer Science from Villanova University, an M.B.A. from Northwestern University, Kellogg Graduate School of Management and is a graduate of General Electric’s Information Systems Management Program.
James G. Berges became a director in 2010. Mr. Berges has been an operating partner of CD&R since 2006. Mr. Berges was President of Emerson Electric Co. from 1999 and served as director of Emerson Electric Co. from 1997 until his retirement in 2005. Emerson Electric Co. is a global manufacturer of products, systems and services for industrial automation, process control, HVAC, electronics and communications, and appliances and tools. Mr. Berges currently serves as a director of PPG Industries, Inc. and NCI Building Systems, Inc. and chairman of the board of Hussmann International, Inc. He previously served on the boards of directors of Diversey, Inc. as Chairman of the board of Sally Beauty Holdings, Inc. and on the board of directors of HD Supply Holdings, Inc. (serving as Chairman of the board for most of the time). Mr. Berges holds a B.S. in Electrical Engineering from the University of Notre Dame. Mr. Berges’ former leadership role at a global manufacturer provides our board valuable insight into the numerous operational, financial and strategic issues we face. Further, Mr. Berges’ service on the boards of other public and private companies provides our board insight into the challenges currently faced by companies in a variety of markets.
Jeri L. Isbell became a director in 2015. Ms. Isbell is Vice President of Human Resources and Corporate Communications for Lexmark International, Inc., a manufacturer of imaging and output technology and provider of enterprise services, a position she has held since February 2003. Prior to that, Ms. Isbell held a number of leadership positions at Lexmark, including Vice President, Compensation and Employee Programs and Vice President, Finance and U.S. Controller. Prior to joining Lexmark in 1991, Ms. Isbell held various positions at IBM. Ms. Isbell holds a B.B.A. in Accounting from Eastern Kentucky University and an M.B.A. from Xavier University. She is a certified public accountant. Ms. Isbell’s human resources and communications leadership positions provide our board with insight into key issues and market practices in these areas for public companies.
Scott H. Muse became a director in 2015. From 2002 until he retired in 2014, Mr. Muse served as President of Hubbell Lighting Inc., a leading manufacturer of lighting fixtures and controls and Group Vice President of Hubbell Inc., the parent company of Hubbell Lighting, an international manufacturer of electrical and electronic products for non-residential and residential construction, industrial and utility applications. Prior to that, Mr. Muse was President and Chief Executive Officer of Lighting Corporation of America from 2000 to 2002 and President of Progress Lighting from 1993 to 2000. Additionally, he held leadership and management positions at Thomas Industries, American Electric and Thomas & Betts. Mr. Muse began his career in the electrical manufacturing industry in 1979. Mr. Muse holds a B.S. in Business Administration from Georgia Southern University. Mr. Muse’s extensive knowledge and experience in business, leadership, sales, marketing and operations management provide our board with insight into the challenges and opportunities in the electrical manufacturing sector.
Nathan K. Sleeper became a director in 2010. Mr. Sleeper is a partner of CD&R and serves on CD&R’s Management and Investment Committees. Prior to joining CD&R in 2000, he worked in the investment banking division of Goldman, Sachs & Co. and at investment firm Tiger Management Corp. Mr. Sleeper is a director of Beacon Roofing Supply, Inc., Brand Energy & Infrastructure Services, Inc., CHC Group Ltd., Hussmann International, Inc., NCI Building Systems, Inc. and Wilsonart International Holdings LLC. Mr. Sleeper previously served as a director of Culligan Ltd, HD Supply Holdings, Inc., Hertz Global Holdings, Roofing Supply Group, Inc. and U.S. Foods, Inc. Mr. Sleeper holds a B.A. from Williams College and an M.B.A. from Harvard Business School. Mr. Sleeper’s broad experience in the financial and investment communities brings to our board important insights into business strategy and areas to improve our financial performance.
99
Table of Contents
William R. VanArsdale became a director in 2015. From 2004 until his retirement on August 1, 2015, Mr. VanArsdale served as Group President of Eaton Corporation plc, a diversified power management company, where he led the hydraulics, filtration and golf grip business units. From 2001 to 2004, Mr. VanArsdale was President of Electrical Components Operation at Eaton, where he was also Operations Vice President of Global Sales and Service from 1999 to 2001. Prior to that, he spent 12 years in various leadership roles at Rockwell Automation. Mr. VanArsdale holds a B.S. in Electrical Engineering from Villanova University. Mr. VanArsdale’s broad operations, sales and leadership experience in the manufacturing sector provide our board with insight into challenges and opportunities for the manufacturing sector.
A. Mark Zeffiro became a director in 2015. Mr. Zeffiro is President and Chief Executive Officer at Horizon Global Corporation, a designer, manufacturer and distributor of custom-engineered towing, trailering, cargo management products and accessories. In July 2015, Horizon Global was formed as a stand-alone, publicly traded company from a division of TriMas Corporation, where Mr. Zeffiro was Group President. Prior to that, Mr. Zeffiro spent seven years as the Chief Financial Officer at TriMas with responsibility for investor relations, financial planning, external reporting, business analysis, treasury, tax and corporate capital. Mr. Zeffiro also spent four years at Black and Decker Corporation as Vice President of Finance for Global Consumer Products Group and Vice President of Finance for the U.S. Consumer Products Group. Mr. Zeffiro began his career at General Electric Company, where he held roles of progressive responsibility during his 15-year tenure, culminating in the position of chief financial officer of the Americas and Global Imaging Equipment division within the GE Medical Systems Group. Mr. Zeffiro earned a B.S. in Quantitative Analytics from Bentley College. Mr. Zeffiro’s current and past leadership positions provide our board with insight into improving financial and operational performance at public companies.
Jonathan L. Zrebiec became a director in 2010. Mr. Zrebiec is a financial principal of CD&R, which he joined in 2004. Prior to joining CD&R, he was employed by Goldman, Sachs & Co. in the Investment Banking Division. He currently serves as a director of Brand Energy & Infrastructure Services, Inc., Hussmann International, Inc., NCI Building Systems, Inc. and Wilsonart International Holdings LLC and previously served as a director of Roofing Supply Group, LLC. Mr. Zrebiec holds a B.S. in Economics from the University of Pennsylvania and an M.B.A. from Columbia Business School. Mr. Zrebiec’s experience in the financial and investing community provides our board with insight into business strategy, improving financial performance, and the economic environment in which we operate.
Corporate Governance
Board Composition and Director Independence
Our board of directors is currently composed of nine directors. Our amended and restated certificate of incorporation will provide for a classified board of directors, with members of each class serving staggered three-year terms, which we expect to be as follows:
| • | Our Class I directors will be Messrs. Knisely, Williamson and Zeffiro, and their terms will expire at the annual meeting of stockholders to be held in 2017. |
| • | Our Class II directors will be Messrs. Berges and Zrebiec and Ms. Isbell, and their terms will expire at the annual meeting of stockholders to be held in 2018. |
| • | Our Class III directors will be Messrs. Muse, Sleeper and VanArsdale, and their terms will expire at the annual meeting of stockholders to be held in 2019. |
Any additional directorships resulting from an increase in the number of directors will be distributed among the three classes so that, as nearly as possible, each class will consist of one-third of the directors. See “Description of Capital Stock—Anti-Takeover Effects of our Certificate of Incorporation and By-Laws—Classified Board of Directors.”
100
Table of Contents
Prior to the completion of this offering, we and the CD&R Investor will enter into a stockholders agreement, or the “stockholders agreement,” pursuant to which, among other matters, the CD&R Investor will have the right to designate nominees for our board of directors, whom we refer to as the CD&R Designees, subject to the maintenance of specified ownership requirements. See “Certain Relationships and Related Party Transactions—Stockholders Agreement.”
Our board of directors is led by our non-executive Chairman, Mr. Knisely, a CD&R Designee. The stockholders agreement will provide that a CD&R Designee will serve as our Chairman of the board of directors as long as the CD&R Investor beneficially owns at least 25% of the outstanding shares of our common stock.
The number of members on our board of directors may be fixed by resolution adopted from time to time by the board of directors. Subject to our stockholders agreement, any vacancies or newly created directorships may be filled only by the affirmative vote of a majority of directors then in office, even if less than a quorum, or by a sole remaining director. Each director shall hold office until his or her successor has been duly elected and qualified, or until his or her earlier death, resignation or removal.
We have four independent directors on our board. With respect to any vacancy of a CD&R Designee, the CD&R Investor will have the right to designate a new director for election by a majority of the remaining directors then in office.
Our board of directors has determined that Messrs. Muse, Van Arsdale and Zeffiro and Ms. Isbell are “independent” as defined under NYSE and the Exchange Act rules and regulations.
Controlled Company
After the completion of this offering, we anticipate that the CD&R Investor will control a majority of the voting power of our outstanding common stock. The CD&R Investor will own approximately % of our common stock after the completion of this offering (or approximately % if the underwriters exercise in full their option to purchase additional shares from the selling stockholder). Accordingly, we expect to qualify as a “controlled company” within the meaning of NYSE corporate governance standards. Under NYSE rules, a company of which more than 50% of the voting power is held by an individual, group or another company is a “controlled company” and may elect not to comply with certain NYSE corporate governance standards, including:
| • | the requirement that a majority of the board of directors consist of independent directors; |
| • | the requirement that our nominating and governance committee be composed entirely of independent directors with a written charter addressing the committee’s purpose and responsibilities; |
| • | the requirement that we have a compensation committee that is composed entirely of independent directors with a written charter addressing the committee’s purpose and responsibilities; and |
| • | the requirement for an annual performance evaluation of the nominating and governance and compensation committees. |
Following this offering, we intend to utilize these exemptions. Accordingly, you may not have the same protections afforded to stockholders of companies that are subject to all of NYSE corporate governance rules and requirements. The “controlled company” exception does not modify audit committee independence requirements of Rule 10A-3 under the Exchange Act and NYSE rules. See “Risk Factors— Risks Related to Our Common Stock and This Offering —We expect to be a “controlled company” within the meaning of NYSE rules and, as a result, we will qualify for, and currently intend to rely on, exemptions from certain corporate governance requirements. You will not have the same protections afforded to stockholders of companies that are subject to such requirements.”
101
Table of Contents
If at any time we cease to be a “controlled company” under NYSE rules, our board of directors will take all action necessary to comply with the applicable NYSE rules, including appointing a majority of independent directors to our board of directors and establishing certain committees composed entirely of independent directors, subject to a permitted “phase-in” period.
Board Committees
Upon the listing of our common stock, our board of directors will maintain an Audit Committee, a Compensation Committee, a Nominating and Governance Committee and an Executive Committee. Under NYSE rules, we will be required to have one independent director on our Audit Committee during the 90-day period beginning on the date of effectiveness of the registration statement filed with the SEC in connection with this offering. After such 90-day period and until one year from the date of effectiveness of the registration statement, we are required to have a majority of independent directors on our Audit Committee. Thereafter, our Audit Committee is required to be composed entirely of independent directors. As a NYSE controlled company, we are not required to have independent Compensation or Nominating and Governance Committees. The following is a brief description of our committees.
Audit Committee
Our Audit Committee will be responsible, among its other duties and responsibilities, for overseeing our accounting and financial reporting processes, the audits of our financial statements, the qualifications and independence of our independent registered public accounting firm, the effectiveness of our internal control over financial reporting and the performance of our internal audit function and independent registered public accounting firm. Our Audit Committee will be responsible for reviewing and assessing the qualitative aspects of our financial reporting, our processes to manage business and financial risks, and our compliance with significant applicable legal, ethical and regulatory requirements. Our Audit Committee will be directly responsible for the appointment, compensation, retention and oversight of our independent registered public accounting firm. The charter of our Audit Committee will be available without charge on the investor relations portion of our website upon the listing of our common stock.
Prior to the completion of this offering, we expect the members of our Audit Committee to be Mr. Zeffiro (Chairperson), Ms. Isbell and Mr. Muse. We expect that our board of directors will designate Mr. Zeffiro as an “audit committee financial expert,” and each of the three members will be determined to be “financially literate” under NYSE rules.
Compensation Committee
Our Compensation Committee will be responsible, among its other duties and responsibilities, for reviewing and approving all forms of compensation to be provided to, and employment agreements with, the executive officers and directors of our company and its subsidiaries (including the Chief Executive Officer, subject to final approval by our board of directors), establishing the general compensation policies of our company and its subsidiaries and reviewing, approving and overseeing the administration of the employee benefits plans of our company and its subsidiaries. Our Compensation Committee will also periodically review management development and succession plans. The charter of our Compensation Committee will be available without charge on the investor relations portion of our website upon the listing of our common stock.
Prior to the completion of this offering, we expect the members of our Compensation Committee to be Ms. Isbell (Chairperson) and Messrs. Knisely and VanArsdale. In light of our status as a “controlled company” within the meaning of the corporate governance standards of NYSE following this offering, we are exempt from the requirement that our Compensation Committee be composed entirely of independent directors under listing standards applicable to membership on the Compensation Committee, with a written charter addressing the committee’s purpose and responsibilities and the requirement that there be an annual performance evaluation of the Compensation Committee. We intend to establish a sub-committee of our Compensation Committee consisting of
102
Table of Contents
and for purposes of approving any compensation that we may wish to qualify as “performance-based compensation” under Section 162(m) of the U.S. Internal Revenue Code of 1986, as amended, or the “Code.”
Nominating and Governance Committee
Our Nominating and Governance Committee will be responsible, among its other duties and responsibilities, for identifying and recommending candidates to the board of directors for election to our board of directors, reviewing the composition of the board of directors and its committees, developing and recommending to the board of directors corporate governance guidelines that are applicable to us, and overseeing board of directors evaluations. The charter of our Nominating and Governance Committee will be available without charge on the investor relations portion of our website upon the completion of this offering.
Prior to the completion of this offering, we expect the members of our Nominating and Governance Committee to be Messrs. Knisely (Chairperson), Williamson, Muse and VanArsdale. In light of our status as a “controlled company” within the meaning of the corporate governance standards of NYSE following this offering, we are exempt from the requirement that our Nominating and Governance Committee be composed entirely of independent directors, with a written charter addressing the committee’s purpose and responsibilities and the requirement that there be an annual performance evaluation of the Nominating and Governance Committee.
Executive Committee
The Executive Committee will be responsible, among its other duties and responsibilities, for assisting the board of directors with its responsibility and, except as may be limited by law, our certificate of incorporation or by-laws, to act as specifically assigned by the board of directors between board meetings or when it is otherwise impracticable for the full board of directors to act. Prior to the completion of this offering, we expect the members of our Executive Committee to be Messrs. Knisely (Chairperson), Sleeper and Williamson.
Director Compensation
In fiscal 2015, certain of our directors received compensation for their services as directors. These matters are further described below in the section entitled “Executive and Director Compensation—Director Compensation.”
Compensation Committee Interlocks and Insider Participation
During fiscal 2015, our Compensation Committee comprised Messrs. Sleeper (Chairperson) and Knisely. Messrs. Sleeper and Knisely are affiliates of CD&R. See “Certain Relationships and Related Party Transactions” for a discussion of agreements between us and the CD&R Affiliates. No member of our Compensation Committee was a former or current officer or employee of the Company or any of its subsidiaries in fiscal 2015. In addition, during fiscal 2015 none of our executive officers served as a director or as a member of the compensation committee of a company that had an executive officer serve as a director or as a member of our Compensation Committee.
Code of Business Conduct and Ethics and Financial Code of Ethics
We have a Code of Business Conduct and Ethics that applies to all of our officers, employees and directors and our board of directors has adopted a Financial Code of Ethics that will apply to our Chief Executive Officer, Chief Financial Officer, corporate officers with financial, accounting and reporting responsibilities, including the Corporate Controller, Treasurer and chief accounting officers, and any other person performing similar tasks or functions. The Financial Code of Ethics and the Code of Business Conduct and Ethics each address matters such as conflicts of interest, confidentiality, fair dealing and compliance with laws and regulations. The Financial Code of Ethics and the Code of Business Conduct and Ethics will be available without charge on the investor relations portion of our website upon the listing of our common stock.
103
Table of Contents
EXECUTIVE AND DIRECTOR COMPENSATION
Compensation Discussion and Analysis
Introduction
The Compensation Discussion and Analysis section discusses and analyzes the executive compensation program for our named executive officers for fiscal 2015. Our named executive officers for this fiscal year were: Mr. John Williamson, President and Chief Executive Officer, or “CEO;” Mr. James Mallak, Vice President and Chief Financial Officer; Mr. Michael Schulte, Vice President and President, Mechanical Products & Solutions; Mr. William Waltz, Vice President and President, Conduit & Fittings; Mr. Kevin Fitzpatrick, Vice President, Global Human Resources; and one former executive officer whose employment terminated during the fiscal year, Mr. William Taylor, Former President, Allied Tube & Conduit. We refer to these individuals below collectively as the “named executive officers,” or “NEOs.”
As noted above, the Compensation Discussion and Analysis section describes our historical executive compensation program for our NEOs in fiscal 2015. Since the end of fiscal 2015, Mr. Schulte’s and Mr. Waltz’s titles changed to reflect the re-segmentation of our business units. See “Management.” No changes in compensation are currently expected as a result of these title changes, other than in connection with the normal compensation review process discussed below. In addition, we expect that, after our initial public offering, our Compensation Committee will set compensation policies that may be different from the policies that applied to our executive officers before our public offering, including to comply with laws that are applicable to public companies.
Compensation Overview and Philosophy
The purpose of our compensation program is to motivate employees to create long-term shareholder value in exchange for meaningful financial rewards. The programs support the attraction, retention and motivation of talented employees who are committed to delivering the levels of quantitative and qualitative performance that we require, as discussed below.
This pay-for-performance model includes a total compensation package consisting of base salary and short- and long-term incentives. Total compensation for our NEOs is targeted to provide compensation at the market median if we achieve our financial and operating business plans. Our compensation program also allows for above or below median total compensation when justified by individual and Company results. We also provide benefits that are intended to be at substantially the same levels as the companies with which we compete for talent.
Five key principles guide the evolution of the philosophy of our compensation programs for all of our employees, including our named executive officers:
| • | Performance based—A significant portion of compensation should be at risk and tied to corporate, business unit and individual performance. At risk compensation is only paid based on the achievement of specific pre-established performance goals. Annual incentive payouts are subject to further adjustment based upon business unit and/or individual performance. We also view stock options, which only have value if our stock price rises, as inherently performance-based and at risk even when vesting is based solely on continued service. |
| • | Attract and retain talent—The total compensation package is competitive with the general industry peer group and at a level appropriate to attract, retain and motivate highly qualified executives capable of leading us to greater performance. Base salary and annual incentives provide a competitive annual total cash compensation opportunity in the short term and equity incentives provide a competitive opportunity over the long term. All of these elements serve to support our desire to attract and retain executive talent and are reviewed for competitiveness annually. We have concluded that we can |
104
Table of Contents
| compete successfully for talent by targeting total compensation (i.e., base salary, annual incentives and long-term incentives) at market median levels, with the opportunity to earn more or less than median levels based on our performance. |
| • | Aligned with stockholder interests—The interests of executives should align with the interests of our stockholders by using performance measures that correlate well with the creation of stockholder value. Our short-term and long-term incentive plans are both designed to use financial performance measures that correlate well with stockholder value. |
| • | Balanced—Compensation plan designs promote a balance between annual and long-term business results. While we believe the creation of stockholder value long term is extremely important, we also believe that the achievement of our annual goals is the best way to contribute to our sustainable, long-term success. |
| • | Supportive of our mission and values—Compensation supports our mission to be the customers’ first choice for Electrical Raceway and Mechanical Products & Solutions, by providing unmatched quality, delivery, and value based on sustainable excellence in strategy, people and processes. We inherently believe that we are most successful when we focus on living our values of accountability, teamwork, integrity, respect and excellence. We achieve this goal primarily by having annual incentives that can decrease or increase based on the subjective assessment of qualitative performance goals. |
Compensation Strategy
Compensation is intended to reward employees to exert discretionary effort, apply appropriate risk analysis in decision making, and continuously improve the performance of the business. A substantial amount of executive compensation is variable and tied to the achievement of both annual and long-term incentive plan goals. To support our pay-for-performance philosophy, performance is evaluated as follows:
| • | Corporate Performance—Our Annual Incentive Plan, or the “AIP,” is designed to reward the achievement of annual numerical financial goals and qualitative goals. These goals are included in the annual operating plan prepared by management and approved by our board of directors. The annual design and performance metrics apply to all executives and most other eligible employees who are eligible for annual bonuses from us. |
| • | Business Unit Performance—The CEO reviews the performance of each business unit on the achievement of goals included in our annual operating plan consisting of both financial and qualitative measures. Based on this assessment, the CEO has been delegated the discretion by the Compensation Committee to adjust the annual incentive pool upward or downward to reflect the business unit’s performance. Generally, in the case of a business unit adjustment impacting an executive, including any of our named executive officers, the Compensation Committee will approve any such adjustment upon receiving a recommendation from the CEO (other than with respect to his own compensation). |
| • | Individual Performance—Our performance review process applies to all salaried employees, including the CEO and our other named executive officers. An employee’s performance is evaluated against the expectations of his or her position and the annual operating plan. Individual performance goals are established at the beginning of each fiscal year and individual performance goals are aligned with our annual operating plan. Performance under the plan is evaluated at least annually. For our named executive officers other than the CEO, the CEO will make a recommendation to the Compensation Committee for its approval due to his direct supervision of these individuals. For the CEO, these determinations are made by the Compensation Committee, subject to the final approval of our board of directors. |
105
Table of Contents
Total compensation is targeted at the median of comparable market data. As with our compensation philosophy generally, this strategy is intended to evolve with the business but consistently includes the following elements:
| • | definition of the market for executive compensation tied to survey data sources (which, as described below, has not historically been determined by reference to a peer group); |
| • | determination of an appropriate pay mix for total direct compensation, consisting of defined levels of base salary, as well as short and/or long-term incentives; |
| • | a direct link between incentives and business results; |
| • | the requirement that an NEO acquire stock having a value that represents a meaningful commitment to him or her; and |
| • | group welfare benefits and retirement plans which are comparable to the plans of peers with which we compete for talent, and which are cost-efficient. |
An annual performance management process is used to establish individual goals and objectives, including for our named executive officers. Managers are required to jointly develop these individual goals and objectives with employees to ensure understanding of and accountability for the desired business results.
Process for Setting Executive Compensation
The Compensation Committee is responsible for reviewing and approving the compensation of our named executive officers and other senior management (other than the CEO) as recommended by the CEO. The Chairman of the board of directors and the Compensation Committee evaluate the CEO’s performance and, based upon the results of this performance evaluation, make a recommendation to the full board of directors to determine the CEO’s compensation.
The Compensation Committee’s annual process considers our financial performance, as well as the relative performance of the executive officers throughout the fiscal year. The timing of these determinations is set in order to enable the Compensation Committee to examine and consider our financial performance, as well as the relative performance of the executive officers, during the previous fiscal year in establishing the upcoming fiscal year’s compensation and performance goals. Throughout this process, the Compensation Committee receives input from members of management. We did not use an executive compensation consultant in fiscal 2015 but have engaged Frederic W. Cook & Co., Inc. to use on an ongoing basis as of fiscal 2016.
The Role of Management
The CEO recommends to the Compensation Committee compensation packages for executives who report directly to him, including the named executive officers other than himself. The Vice President of Global Human Resources also provides input to the CEO and to the Compensation Committee on compensation for each of the executives other than himself. In fiscal 2015, prior to each Compensation Committee meeting, the CEO and the Vice President of Global Human Resources were primarily responsible for preparing the materials that management presented to the Compensation Committee.
Elements of Compensation
For fiscal 2015, the principal components of compensation for our named executive officers were the following, each as described in greater detail below:
| • | base salary; |
| • | annual incentive compensation paid in the form of cash bonuses; |
| • | long-term equity incentive compensation in the form of stock options; and |
| • | other benefits (primarily our retirement savings plan and our group health and welfare plans). |
106
Table of Contents
Base Salary
Base salary represents the fixed portion of our named executive officers’ total compensation. Although the Compensation Committee believes that a substantial portion of each executive officer’s total compensation should be “at risk,” the Compensation Committee also recognizes the importance of setting base salaries at levels that will attract, retain and motivate top talent. In setting annual base salary levels, the Compensation Committee takes into account competitive considerations, individual performance, and time in position, internal pay equity, and the impact on our selling, general and administrative expenses. In fiscal 2015, decisions regarding executive salaries were determined primarily by a review of salary data for the 50th percentile in the external market for similarly sized companies from a revenue perspective. In fiscal 2015, we utilized generalized survey data from the AON Hewitt TCM Executive Total Compensation survey, focusing on a data cut of companies with $1 billion to $2 billion in revenue as our primary benchmark data. This survey data included only blended data that did not identify specific companies.
Executives’ salaries vary based on a review of individual performance and the other above referenced criteria. As of the end of fiscal 2015, base salaries for our active named executive officers were as follows: Mr. Williamson, $700,000; Mr. Mallak, $425,000; Mr. Schulte, $400,000; Mr. Waltz, $400,000 and Mr. Fitzpatrick, $340,000. As of the date of Mr. Taylor’s termination of employment during fiscal 2015, his annual base salary was $384,000. As of the end of fiscal 2015, Mr. Williamson’s base salary of $700,000 was 83% of the market 50th percentile. All other NEO base salaries as a group were measured at 98% of the market 50th percentile.
Annual Incentive Plan Compensation
Our AIP is designed primarily to reward growth in financial metrics such as Economic EBITDA and improvement in the number of working capital days (as defined below). Economic EBITDA was used in fiscal 2015 for AIP purposes and generally consists of earnings before interest, taxes, depreciation and amortization, adjusted to exclude: (1) interest expense, net of interest income; (2) income tax expense (benefit); (3) depreciation; (4) amortization; (5) unusual or non-recurring gains and losses; (6) consulting fees paid to our owners; and (7) steel and copper price volatility throughout the year, which adjusts the cost of sales to substitute an estimate of current period, current market steel and copper materials cost for the accounting cost, which is done on FIFO basis. Use of the FIFO costing method results in higher spreads when steel and copper costs are rising and lower spreads when steel and copper costs are falling, and it was the Compensation Committee’s determination that, without this adjustment, this difference may be significant and may result in a distorted evaluation of our performance for AIP purposes. The use of Economic EBITDA for fiscal 2015 AIP purposes eliminates a significant portion of this volatility and aligned our incentives under the AIP with our method of accounting generally. Economic EBITDA is a non-GAAP measure which management believes is a helpful indicator of operating performance. Because it is not a measurement of performance under GAAP, Economic EBITDA should not be considered as an alternative to net income (loss) or any other performance measure derived in accordance with GAAP or as an alternative to net cash provided by operating activities as measures of liquidity.
Beginning in fiscal 2016, the use of Economic EBITDA has been phased out, and Adjusted EBITDA will be used to measure performance.
“Working capital days” improvement is a measure intended to reflect the improvement, from one fiscal year to the next, of our short term financial health and efficiency. Working capital days, both on a corporate and business unit level, is defined as the sum of “Days Sales Outstanding” (i.e., accounts receivable) and “Days Inventory on Hand” (i.e., the number of days it takes to sell our average balance of inventory) minus “Days Sales Outstanding in Account Payables” (i.e., accounts payable).
In addition, each executive has a portion of his or her AIP compensation based on personal performance factors, including, by way of example, cost management, strategic initiatives and talent development. The personal performance factors of each NEO are individually set, and, based on these personal performance factors,
107
Table of Contents
an NEO’s calculated annual incentive payout can be modified down (including to zero, so that no bonus is earned) or up to as much as 200% of the bonus that could have been earned in the absence of the personal performance factors. For fiscal 2015, each NEO’s personal performance factors were measured against objectives including cost management, strategic initiatives and talent development. These metrics measure the success of the most important elements of our business strategy and require us to balance increases in revenue with financial discipline to produce strong margins and a high level of cash flow. For fiscal 2015, the financial metrics applicable to the named executive officers were weighted as follows:
| Metric |
CEO and Chief Financial Officer (%) |
Business Unit Presidents (%) |
Other Executive Officers (%) |
|||||||||
| Atkore Economic EBITDA |
75 | 25 | 75 | |||||||||
| Atkore Working Capital Days |
25 | — | 25 | |||||||||
| Business Unit Economic EBITDA |
— | 50 | — | |||||||||
| Business Unit Working Capital Days |
— | 25 | — | |||||||||
For fiscal 2015, the actual financial numbers assigned to Economic EBITDA and change in working capital days were as follows ($ in millions):
| Metric |
Threshold ($) | Target ($) | Maximum ($)(1) | Actual | ||||||||||||
| Atkore Economic EBITDA |
120.0 | 150.0 | 187.5 | 195.0 | ||||||||||||
| Atkore Working Capital Days |
72.1 | 68.7 | 63.2 | 71.2 | ||||||||||||
| Business Unit Economic EBITDA: |
||||||||||||||||
| Metal Framing & Cable Management |
25.8 | 34.4 | 43.0 | 31.9 | ||||||||||||
| Plastic Pipe & Conduit |
27.0 | 36.0 | 45.0 | 30.9 | ||||||||||||
| Allied Tube & Conduit |
55.5 | 74.0 | 92.5 | 95.9 | ||||||||||||
| Business Unit Working Capital Days: |
||||||||||||||||
| Metal Framing & Cable Management |
75.5 | 71.9 | 66.1 | 76.0 | ||||||||||||
| Plastic Pipe & Conduit |
65.3 | 62.2 | 57.2 | 64.3 | ||||||||||||
| Allied Tube & Conduit |
69.6 | 66.3 | 61.0 | 68.0 | ||||||||||||
| Payout Percentage |
50 | % | 100 | % | 200 | % | ||||||||||
| (1) | Maximum achievement for the financial metric listed are uncapped at the Atkore Corporate and Business Unit levels. Maximum payout percentage is shown at 200% to show the potential range of payouts, although there is no cap on AIP achievement based on financial metrics. |
For fiscal 2015, the personal performance factor component was weighted as follows:
| Minimum | Target | Maximum | ||||||||||
| Personal Performance Factor |
0 | % | 100 | % | 200 | % | ||||||
For fiscal 2015, the Compensation Committee considered the following factors in determining the personal performance factor component for our named executive officers under the AIP: (i) input from the CEO; (ii) personal observation of performance; and (iii) the named executive officer’s achievement of individual objectives, which included cost management, strategic initiatives and talent development. For fiscal 2015, personal performance factors for the executive leadership team averaged 100%; with no member of the executive leadership team receiving greater than 5% above or below the target of 100%. As a result, for fiscal 2015, the qualitative evaluation of performance did not have a meaningful impact on any NEO’s annual bonus.
The table below shows the threshold, target and maximum bonus payments set for the named executive officers under the AIP for fiscal 2015, as well as the actual bonus payments that each of the named executive officers received.
108
Table of Contents
Fiscal 2015 AIP Bonus Summary
The following tables summarize the calculation of the AIP bonuses earned by our NEOs for fiscal 2015:
| Named Executive |
Target Bonus Opportunity as % of Base Salary |
Atkore Economic EBITDA Achievement (%)(1) |
Business Unit Economic EBITDA Achievement (%)(1) |
Atkore Working Capital Days Achievement (%)(1) |
Business Unit Working Capital Days Achievement (%)(1) |
Bonus Payout % before Personal Performance Factor |
Personal Performance Factor (%) |
Final Bonus Earned as a % of Target |
||||||||||||||||||||||||
| John P. Williamson |
125 | 220.002 | — | 63.744 | — | 180.938 | 100 | 180.938 | ||||||||||||||||||||||||
| James A. Mallak |
60 | 220.002 | — | 63.744 | — | 180.938 | 100 | 180.938 | ||||||||||||||||||||||||
| Michael J. Schulte |
50 | 220.002 | 99.933 | — | 0.000 | 104.967 | 105 | 110.215 | ||||||||||||||||||||||||
| William E. Waltz |
50 | 220.002 | 80.006 | — | 66.067 | 111.520 | 100 | 111.520 | ||||||||||||||||||||||||
| Kevin P. Fitzpatrick |
50 | 220.002 | — | 63.744 | — | 180.938 | 102 | 184.556 | ||||||||||||||||||||||||
| William E. Taylor(2) |
50 | 220.002 | 214.514 | — | 74.494 | 180.881 | 100 | 180.881 | ||||||||||||||||||||||||
| Named Executive Officer |
Target Bonus Opportunity as % of Base Salary |
Actual ($) |
||||||
| John P. Williamson |
125 | 1,583,204 | ||||||
| James A. Mallak |
60 | 461,391 | ||||||
| Michael J. Schulte |
50 | 220,431 | ||||||
| William E. Waltz |
50 | 223,041 | ||||||
| Kevin P. Fitzpatrick |
50 | 313,746 | ||||||
| William E. Taylor(1) |
50 | 254,036 | ||||||
| (1) | The percentages equate to the actual achievement of the relevant financial metric shown in the table of financial metrics in the “—Annual Incentive Plan Compensation” section above. The financial metrics were extrapolated (in the case of Economic EBITDA) or interpolated (in the case of the other two performance metrics) from the percentages that correspond to threshold, target or maximum achievement levels. For example, for all of our NEOs, the 220.002% listed for Economic EBITDA is based on the actual achievement of this metric of $195 million, which has been extrapolated from the 200% payout percentage that would have resulted from achievement of $187.5 million. The business units by which our NEOs’ performance was evaluated were: Mr. Schulte, Metal Framing & Cable Management; Mr. Waltz, Plastic Pipe & Conduit; and Mr. Taylor, Allied Tube & Conduit. |
| (2) | Mr. Taylor’s separation agreement included provisions as to the calculations of his AIP payout for fiscal 2015. These provisions include a payment equal to 50% (26 weeks) of the actual bonus that Mr. Taylor would have received, if any, had he remained President of Allied Tube & Conduit Business Unit and employed with us through the payment date for the 2015 AIP. Mr. Taylor’s achievement based on personal performance factors will be credited at 100%. This amount equaled approximately $173,814. In addition, pursuant to the terms of his separation agreement, in the event that the CEO requested, and Mr. Taylor rendered, consulting services beyond his separation date of April 17, 2015, Mr. Taylor would have received additional compensation through an increase in the number of weeks that the AIP payout was prorated for (beyond the 26 weeks required under the separation agreement) by one additional week for every week of consulting services up to a maximum of 52 weeks (or an additional 26 weeks). Because Mr. Taylor provided an additional 12 weeks of consulting services beyond his April 17, 2015 separation date at the request of the CEO, Mr. Taylor received a 2015 AIP bonus payout prorated for 38 weeks of the year. This additional amount equaled approximately 80,222, for a combined AIP bonus payout as reflected in the table above. |
Long-Term Incentives
On May 16, 2011, our board of directors adopted the Atkore International Group Inc. Stock Incentive Plan. A maximum of 6,000,000 shares of our common stock are reserved for issuance under the Stock Incentive Plan. On May 22, 2014, our board of directors authorized an additional 500,000 shares of common stock to be reserved for issuance under the Stock Incentive Plan. The Stock Incentive Plan provides for stock purchases and grants of other equity awards including non-qualified stock options, restricted stock, and restricted stock units, to officers and key employees. As of September 25, 2015, there were 323,401 shares of common stock outstanding as a result of stock purchases under the Stock Incentive Plan and 4,924,388 shares underlying outstanding stock options issued under the Stock Incentive Plan.
Our board of directors has approved the issuance of stock options to align executives’ compensation to the return earned by shareholders, thereby incentivizing executives to increase shareholder value and to reflect the increase in our stock price. Options have an exercise price equal to $10.00 on the grant date for all options granted prior to May 7, 2014. All options granted on or after May 7, 2014 and prior to December 18, 2015 have an exercise price equal to $12.50 on the grant date. All options granted on or after December 18, 2015 and prior to February 9, 2016 have an exercise price equal to $18.00 on the grant date. All options granted on or after
109
Table of Contents
February 9, 2016 have an exercise price of $21.00. All options granted vest ratably over five years unless earlier forfeited and have a term of ten years. During fiscal 2013, the Compensation Committee approved a grant strategy for the NEOs to provide new hire and one time grants to align management and shareholder interests over multiple years. The Compensation Committee intends a shift back to an annual equity grant strategy post-initial public offering. The cost of stock options is based on the fair market value of our shares on the date of grant and is charged to selling, general and administrative expenses over the respective vesting periods.
Under the Stock Incentive Plan, an executive’s unvested stock options are canceled upon the termination of his or her employment, except for terminations due to death or disability. Upon death or disability, unvested stock options vest immediately and remain exercisable for the period specified below. In the case of a termination for “cause” (as defined in the Stock Incentive Plan), the executive’s unvested and vested stock options are canceled as of the effective date of the termination. Following a termination of employment other than for cause, vested options are canceled unless the executive exercises them within 90 days (180 days if the termination was due to death, disability or retirement) or, if sooner, prior to the options’ normal expiration date.
If we experience a “change in control” (as defined in the Stock Incentive Plan), the vesting of stock options will generally accelerate, and the options will be canceled in exchange for a cash payment equal to the change in control price per share minus the exercise price of the applicable option, unless our board of directors elects to allow alternative awards in lieu of acceleration and payment. Our board of directors also has the discretion to accelerate the vesting of options at any time and from time to time.
Equity Awards Procedure
The Compensation Committee generally intends to make equity grants at approximately the same time each year (during the first fiscal quarter) following our release of financial information; however, the Compensation Committee may choose to make equity awards outside an annual broad-based grant (i.e., for new hires, employee promotions, company acquisitions or for employee retention purposes). It is the Compensation Committee’s practice not to grant equity awards when the Company or its subsidiaries possess material non-public information. Stock options may be granted only with an exercise price at or above the fair market value of our stock by using the Black-Scholes option pricing model. None of our named executive officers received a grant of equity compensation during fiscal 2015.
Benefit Plans
Our benefit programs are established based upon an assessment of competitive market factors and a determination of what is needed to attract, retain and motivate high-caliber executives. Our primary benefits for our named executive officers include participation in our broad-based plans: tax-qualified defined contribution 401(k) retirement savings plan, health and dental plans and various insurance plans, including disability and life insurance. Specific to our 401(k) retirement savings plan, we match the contributions of each of our employees, including our named executive officers, at a rate of 50% of the first 6% of the employee’s contributions. Employees and named executive officers are immediately vested in both their individual contributions and company matching contributions. Our executive officers do not currently participate in or have a vested right to any defined benefit pension plans, supplemental executive retirement plans, or “SERP,” or other deferred compensation plans.
Perquisites
The perquisites that we provide to our named executive officers are not material and are not considered by our Compensation Committee in determining compensation levels of our named executive officers. These include housing allowances, cell phone stipends, group term life insurance covered, relocation expenses, employee referral bonuses and spot awards (although no named executive officer received an employee referral bonus or a spot award in fiscal 2015). For a description of the perquisites paid to our named executive officers please see the Summary Compensation Table below.
110
Table of Contents
Employment and Severance Agreements
AII (and in the case of Mr. Williamson, AII and the Company) has entered into employment agreements with or has extended offer letters to our named executive officers for recruitment and retention purposes. The specific terms of these agreements are described below under the heading “Employment Agreements” following the “Option Exercises and Stock Vested in Fiscal 2015” table. Mr. Williamson’s employment agreement includes a severance arrangement negotiated in connection with his decision to become our CEO. In addition, the Compensation Committee has entered into separate severance agreements with each of Messrs. Mallak, Fitzpatrick and Waltz. Mr. Taylor entered into a separation agreement with us upon his departure in fiscal 2015. The details of these agreements are described under the heading “Severance Agreements” following the “—Potential Payments upon Termination or Change in Control” table. The Compensation Committee has adopted a company severance policy covering all exempt and non-exempt salaried employees, which is described below under the heading “—Severance Policy” following the “—Potential Payments upon Termination or Change in Control” table. The Compensation Committee views these employment and severance arrangements as necessary and desirable both for recruitment and retention purposes.
Tax Deductibility of Compensation and other Company Policies
Section 162(m) of the Code imposes a $1 million limit on the amount that a public company may deduct for compensation paid to the company’s chief executive officer and three other most highly compensated executive officers (other than the principal financial officer) employed as of the end of the year. This limitation does not apply to compensation that is paid only if the executive’s performance meets pre-established objective goals based on performance criteria approved by our stockholders. In addition, certain transition relief is provided to a public company during which this deduction limitation will not apply. We intend to utilize this transition relief, and thereby to preserve the deductibility of compensation that we pay to our named executive officers, to the maximum extent practicable. However, because we believe that the primary drivers for determining the amount and form of executive compensation must be the retention and motivation of superior executive talent, we will also consider awarding compensation that may not be fully deductible if we determine that the nondeductible compensation is nonetheless in our best interests and the best interests of our stockholders.
In addition, in becoming a public company, we also intend to consider the appropriate policies for us as a public company, including, for example, equity grant procedures, stock ownership guidelines and insider trading policies. We also intend to comply with all compensatory policies required of us as a public company under applicable law, such as SEC-mandated clawback and other policies.
Analysis of Risk as Related to Compensation Philosophy & Practice
With oversight from the Compensation Committee, we review our executive compensation structure to determine whether our compensation policies and practices encourage our executive officers and employees to take unnecessary or excessive risks and whether these policies and practices properly mitigate risk. As described above, our compensation structure is designed to incentivize executives and employees to achieve our financial and strategic goals as well as individual performance goals that promote long-term shareholder returns. The compensation architecture balances this design with multiple elements intended to discourage excessive risk-taking by executives and employees to obtain short-term benefits that may be harmful to us and our shareholders in the long term. We believe our compensation program is reasonable from a risk taking perspective and that it appropriately includes (i) a balance of performance measures, including profitability and growth metrics and strategic and qualitative factors, (ii) specific individual performance goals, (iii) reasonable and limited positive potential and (iv) a longer term orientation through the use of equity awards. Based on the foregoing, we believe that our compensation programs do not create risks that are reasonably likely to have a material adverse effect on our business or results of operations.
111
Table of Contents
Executive Compensation
The following table shows information regarding the total compensation paid to the named executive officers for each of our last three completed fiscal years. The compensation reflected for each individual was for their services provided in all capacities to us. Our fiscal 2015 ended on September 25, 2015.
Summary Compensation Table
| Name and Principal Position |
Year | Salary ($) |
Bonus ($) |
Option Awards(3) ($) |
Non-Equity Incentive Plan Compensation(4) ($) |
All Other Compensation(5) ($) |
Total ($) |
|||||||||||||||||||||
| John P. Williamson |
2015 | 646,154 | — | — | 1,583,204 | 9,595 | 2,238,953 | |||||||||||||||||||||
| President and Chief Executive Officer |
2014 | 586,538 | — | 1,327,500 | (6)(7) | 352,800 | 9,042 | 2,275,880 | ||||||||||||||||||||
| 2013 | 556,154 | — | 924,000 | 372,600 | 7,500 | 1,860,254 | ||||||||||||||||||||||
| James A. Mallak |
2015 | 415,594 | — | 461,391 | 12,141 | 889,126 | ||||||||||||||||||||||
| Vice President and |
2014 | 400,111 | 566,800 | (6)(7) | 136,588 | 9,760 | 1,113,259 | |||||||||||||||||||||
| 2013 | 383,654 | — | 554,400 | 153,090 | 12,611 | 1,103,755 | ||||||||||||||||||||||
| William E. Waltz(1) |
2015 | 363,992 | — | — | 223,041 | 10,414 | 597,447 | |||||||||||||||||||||
| President, Plastic Pipe and Conduit |
2014 | 353,231 | — | 510,000 | (6)(8) | 150,000 | 15,843 | 1,029,074 | ||||||||||||||||||||
| 2013 | 175,985 | 100,000 | 432,900 | 25,546 | 3,965 | 738,396 | ||||||||||||||||||||||
| Michael J. Schulte(1) |
2015 | 386,539 | — | — | 220,431 | 9,638 | 616,608 | |||||||||||||||||||||
| President, Mechanical Framing and Cable Management |
2014 | 137,019 | 40,000 | 1,194,340 | 71,798 | 2,127 | 1,445,284 | |||||||||||||||||||||
| 2013 | — | — | — | — | — | — | ||||||||||||||||||||||
| Kevin P. Fitzpatrick |
2015 | 330,779 | — | — | 313,746 | 10,185 | 654,710 | |||||||||||||||||||||
| Vice President, Global Human Resources |
2014 | 318,634 | — | 524,400 | (6)(7) | 94,925 | 9,130 | 947,089 | ||||||||||||||||||||
| 2013 | 306,923 | — | 554,400 | 100,485 | 8,820 | 970,628 | ||||||||||||||||||||||
| William E. Taylor(2) |
2015 | 211,405 | — | — | — | 583,219 | 794,624 | |||||||||||||||||||||
| Former President, Allied Tube & Conduit |
2014 | 376,440 | — | 432,300 | (6)(7) | 79,104 | 56,159 | 944,003 | ||||||||||||||||||||
| 2013 | 237,979 | — | 712,650 | 77,559 | 30,865 | 1,059,053 | ||||||||||||||||||||||
| (1) | Mr. Schulte’s and Mr. Waltz’s current titles are Vice President and President, Mechanical Products & Solutions, and Vice President and President, Conduit & Fittings, respectively. |
| (2) | Mr. Taylor separated from the Company effective April 17, 2015. |
| (3) | Amounts reflect the aggregate grant date fair value of stock options granted in the year computed in accordance with FASB ASC Topic 718. Assumptions used in the calculation of these values are included in Note 12 to our consolidated financial statements included elsewhere in this prospectus. |
| (4) | Amounts reflect annual cash incentive compensation earned under the AIP for the relevant fiscal year. For more information, see above for the section titled “—Compensation Discussion and Analysis” under the heading “—Annual Incentive Plan Compensation.” |
| (5) | Amounts represent certain perquisites, retirement plan contributions and severance payments as shown in the following table. |
| (6) | During fiscal 2014, our board of directors modified the Stock Incentive Plan. The modification provides us with discretion to net settle stock option awards in cash. The modification triggered a change from equity accounting to liability accounting for all outstanding options regardless of the year of grant. |
| (7) | Amounts represent the change in fair value of all options held as a result of the modification referred to in footnote 6 regardless of the year of grant, computed in accordance with FASB ASC Topic 718. |
| (8) | Of this aggregate figure, $359,200 relates to a grant of options to Mr. Waltz, and the remaining $150,800 results from the change in the fair value of the options held by Mr. Waltz as a result of the modification referred to in footnote 6. |
112
Table of Contents
All Other Compensation
| Name |
Year | Perquisites(1) ($) |
Retirement Plan Contributions(2) ($) |
Severance ($) |
Total ($) |
|||||||||||||||
| John P. Williamson |
2015 | 1,645 | 7,950 | — | 9,595 | |||||||||||||||
| 2014 | 1,092 | 7,950 | — | 9,042 | ||||||||||||||||
| 2013 | — | 7,500 | — | 7,500 | ||||||||||||||||
| James A. Mallak |
2015 | 4,191 | 7,950 | — | 12,141 | |||||||||||||||
| 2014 | 1,810 | 7,950 | — | 9,760 | ||||||||||||||||
| 2013 | 3,669 | 8,942 | — | 12,611 | ||||||||||||||||
| William E. Waltz |
2015 | 2,464 | 7,950 | — | 10,414 | |||||||||||||||
| 2014 | 6,693 | 9,150 | — | 15,843 | ||||||||||||||||
| 2013 | 1,946 | 2,019 | — | 3,965 | ||||||||||||||||
| Michael J. Schulte |
2015 | 606 | 9,032 | — | 9,638 | |||||||||||||||
| 2014 | 180 | 1,947 | — | 2,127 | ||||||||||||||||
| 2013 | — | — | — | — | ||||||||||||||||
| Kevin P. Fitzpatrick |
2015 | 2,335 | 7,850 | — | 10,185 | |||||||||||||||
| 2014 | 1,250 | 7,880 | — | 9,130 | ||||||||||||||||
| 2013 | 420 | 8,400 | — | 8,820 | ||||||||||||||||
| William E. Taylor |
2015 | 30,377 | 1,404 | 551,438 | (3) | 583,219 | ||||||||||||||
| 2014 | 51,918 | 4,241 | — | 56,159 | ||||||||||||||||
| 2013 | 28,846 | 2,019 | — | 30,865 | ||||||||||||||||
| (1) | Amounts listed in the “perquisites” column for Mr. Taylor include $28,846 in payments used as reimbursement for expenses related to local housing expenses in and around Chicago, IL and $1,531 related to group life insurance coverage. For Messrs. Mallak, Fitzpatrick, Waltz and Schulte, the amounts listed in the “perquisites” column include payments and benefits relating to cell phone stipends, group term life insurance coverage and relocation expenses. |
| (2) | Amounts reflect matching contributions made on behalf of each executive to our tax-qualified 401(k) retirement savings plan. |
| (3) | Amount reflects (1) Mr. Taylor’s cash severance entitlement of $288,280 paid or accrued in fiscal 2015 in connection with his termination of employment in accordance with his separation agreement, (2) a pro rata AIP entitlement of $254,036 and (3) $9,122 for the estimated value of benefit continuation. |
113
Table of Contents
Grants of Plan-Based Awards in Fiscal 2015
The following table summarizes cash-based awards for each of the named executive officers that were granted during fiscal 2015 by us. No equity awards were granted to the named executive officers in fiscal 2015:
| Non-Equity Incentive Plan Awards(1) |
||||||||||||
| Name |
Threshold ($) |
Target ($) |
Maximum ($) |
|||||||||
| John P. Williamson |
437,500 | 875,000 | 1,750,000 | |||||||||
| James A. Mallak |
127,500 | 255,000 | 510,000 | |||||||||
| William E. Waltz |
100,000 | 200,000 | 400,000 | |||||||||
| Michael J. Schulte |
100,000 | 200,000 | 400,000 | |||||||||
| Kevin P. Fitzpatrick |
85,000 | 170,000 | 340,000 | |||||||||
| William E. Taylor |
96,093 | 192,187 | 384,373 | |||||||||
| (1) | Amounts in these columns represent potential annual performance bonuses that the named executive officers could have earned under the AIP for fiscal 2015. The maximum amount shown is based solely on 200% of target payout. Because financial metrics utilized in the plan are uncapped and personal performance factors can increase an individual’s payout, the actual amount earned could be greater than the amounts shown. |
Outstanding Equity Awards at 2015 Fiscal Year-End
The following table shows, for each of the named executive officers, all equity awards that were outstanding as of September 25, 2015.
| Name |
Option Grant Date | Number of Securities Underlying Unexercised Options Exercisable(#) |
Number of Securities Underlying Unexercised Options Unexercisable(#)(1) |
Option Exercise Price ($) |
Option Expiration Date |
|||||||||||||||
| John P. Williamson |
6/10/2011 | 320,000 | 80,000 | 10.00 | 6/10/2021 | |||||||||||||||
| 12/7/2011 | 48,000 | 32,000 | 10.00 | 12/7/2021 | ||||||||||||||||
| 12/7/2012 | 140,000 | 210,000 | 10.00 | 12/7/2022 | ||||||||||||||||
| James A. Mallak |
7/30/2012 | 54,000 | 36,000 | 10.00 | 7/30/2022 | |||||||||||||||
| 12/7/2012 | 84,000 | 126,000 | 10.00 | 12/7/2022 | ||||||||||||||||
| William E. Waltz |
2/24/2014 | 12,000 | 18,000 | 10.00 | 2/24/2024 | |||||||||||||||
| 2/24/2014 | 40,000 | 60,000 | 10.00 | 2/24/2024 | ||||||||||||||||
| 5/22/2014 | 16,000 | 64,000 | 12.50 | 5/22/2024 | ||||||||||||||||
| Michael J. Schulte |
5/12/2014 | 19,200 | 76,800 | 12.50 | 5/12/2024 | |||||||||||||||
| 5/12/2014 | 34,000 | 136,000 | 12.50 | 5/12/2024 | ||||||||||||||||
| Kevin P. Fitzpatrick |
4/11/2012 | 54,000 | 36,000 | 10.00 | 4/11/2022 | |||||||||||||||
| 12/7/2012 | 84,000 | 126,000 | 10.00 | 12/7/2022 | ||||||||||||||||
| William E. Taylor(2) |
N/A | N/A | N/A | N/A | N/A | |||||||||||||||
| (1) | The Company’s stock options vest ratably over 5 years. |
| (2) | As of fiscal year end 2015, Mr. Taylor holds no exercisable, unexercisable or unearned stock options. |
114
Table of Contents
Option Exercises and Stock Vested in Fiscal 2015
The following table shows, for each of the named executive officers, the amounts realized from options that were exercised during fiscal 2015:
| Option Awards | ||||||||
| Name |
Number of Shares Acquired on Exercise (#) |
Value Realized on Exercise ($) |
||||||
| John P. Williamson |
— | — | ||||||
| James A. Mallak |
— | — | ||||||
| William E. Waltz |
— | — | ||||||
| Michael J. Schulte |
— | — | ||||||
| Kevin P. Fitzpatrick |
— | — | ||||||
| William E. Taylor(1) |
102,000 | 255,000 | ||||||
| (1) | Mr. Taylor exercised his vested stock options in a cashless exercise on April 20, 2015. All unvested stock options held by Mr. Taylor as of the date of his separation were forfeited at such time. |
Employment Agreements and Offer letters
John P. Williamson. On May 23, 2011, the Company and AII entered into an employment agreement with Mr. Williamson in connection with his commencement of employment on June 1, 2011 as President and Chief Executive Officer of AII and the Company and a director of the Company. The agreement provides for an annual base salary of not less than $500,000 and eligibility for annual incentive bonuses, subject to meeting performance goals set annually by the Compensation Committee. The agreement also provided for a cash signing bonus of $1,000,000. Currently, Mr. Williamson has purchased 100,000 shares of common stock and has been granted 830,000 options.
James A. Mallak. On February 29, 2012, AII appointed Mr. Mallak as Chief Financial Officer and Principal Accounting Officer effective March 5, 2012. In connection with his appointment, Mr. Mallak and AII entered into an offer letter on February 17, 2012, which provides for an annual base salary of $375,000 and eligibility for annual incentive bonuses, subject to meeting performance goals set annually by the Compensation Committee. Mr. Mallak also received a cash signing bonus of $150,000. Currently, Mr. Mallak has purchased 30,000 shares of common stock and has been granted 300,000 options.
William E. Waltz. On July 6, 2013, AII entered into an offer letter with Mr. Waltz in connection with his appointment as President, PVC Atkore International. The offer letter provides for an annual base salary of $350,000 and eligibility for annual incentive bonuses, subject to meeting performance goals set annually by the Compensation Committee. Mr. Waltz also received a cash signing bonus of $100,000. Currently, Mr. Waltz has purchased 10,000 shares of common stock and has been granted 210,000 options.
Michael J. Schulte. On May 12, 2014, AII entered into an offer letter with Mr. Schulte in connection with his appointment as President, Unistrut International. The offer letter provides for an annual base salary of $375,000 and eligibility for annual incentive bonuses, subject to meeting performance goals set annually by the Compensation Committee. Mr. Schulte also received a cash signing bonus of $40,000; however, if Mr. Schulte terminates his employment within the first two years, he must repay the signing bonus in full. Currently, Mr. Schulte has purchased 32,000 shares of common stock and has been granted 266,000 options.
Kevin P. Fitzpatrick. On December 7, 2011, AII entered into an offer letter with Mr. Fitzpatrick in connection with his appointment as global vice president of human resources. The offer letter provides for an annual base salary of $300,000 and eligibility for annual incentive bonuses, subject to meeting performance goals set annually by the Compensation Committee. Mr. Fitzpatrick also received a cash signing bonus of $200,000. Currently, Mr. Fitzpatrick has purchased 30,000 shares of common stock and has been granted 300,000 options.
115
Table of Contents
Pension Benefits and Non-Qualified Deferred Compensation
Our named executive officers do not currently participate in any tax-qualified or non-qualified defined benefit pension plans, and we do not currently sponsor any non-tax qualified deferred compensation plans. Our named executive officers do participate in our tax-qualified 401(k) retirement savings plan, under which we match the contributions of each of our employees, including our named executive officers, at a rate of 50% of the first 6% contributed by each employee. Employees and named executive officers are immediately vested in the matching contributions. Matching contribution amounts can be found in the “All Other Compensation” table under the heading “Retirement Plan Contributions.” In connection with our initial public offering, we intend to adopt a non-qualified supplemental defined contribution plan to provide a supplemental matching contribution to those of our executives (including our named executive officers) who are limited in their ability to defer compensation under our qualified 401(k) retirement savings plan due to compensation limits under the Code.
Potential Payments upon Termination or Change in Control
The following table summarizes the severance benefits that would have been payable to each of the named executive officers upon termination of their employment or the occurrence of a change in control, assuming that the triggering event or events occurred on September 25, 2015. The specific benefits that would have been payable are further described in the footnotes and narrative discussion following the table. For purposes of Mr. Taylor, the table includes the cash severance pay and the value of the termination benefits to which he is entitled under his separation agreement, whether payable in or following fiscal 2015.
| Name / Form of Compensation |
Change in Control ($) |
With Cause ($) |
Without Cause or With Good Reason ($) |
Resignation ($) |
Death or Disability ($) |
Retirement ($) |
||||||||||||||||||
| John P. Williamson(1) |
||||||||||||||||||||||||
| Severance |
— | — | 3,150,000 | — | — | — | ||||||||||||||||||
| Benefit & Perquisite Continuation |
— | — | 33,495 | — | 19,495 | — | ||||||||||||||||||
| Accelerated Vesting of Equity Awards(3) |
2,075,000 | — | — | 805,000 | — | |||||||||||||||||||
| James A. Mallak(1) |
||||||||||||||||||||||||
| Severance |
— | — | 425,000 | — | — | — | ||||||||||||||||||
| Benefit & Perquisite Continuation |
— | — | 23,497 | — | — | — | ||||||||||||||||||
| Accelerated Vesting of Equity Awards(3) |
750,000 | — | — | — | 405,000 | — | ||||||||||||||||||
| William E. Waltz(1) |
||||||||||||||||||||||||
| Severance |
— | — | 400,000 | — | — | — | ||||||||||||||||||
| Benefit & Perquisite Continuation |
— | — | 31,657 | — | — | — | ||||||||||||||||||
| Accelerated Vesting of Equity Awards(3) |
325,000 | — | — | — | 195,000 | — | ||||||||||||||||||
| Michael J. Schulte(2) |
||||||||||||||||||||||||
| Severance |
— | — | 200,000 | — | — | — | ||||||||||||||||||
| Benefit & Perquisite Continuation |
— | — | 30,886 | — | — | — | ||||||||||||||||||
| Accelerated Vesting of Equity Awards(3) |
— | — | — | — | — | — | ||||||||||||||||||
| Kevin P. Fitzpatrick(1) |
||||||||||||||||||||||||
| Severance |
— | — | 340,000 | — | — | — | ||||||||||||||||||
| Benefit & Perquisite Continuation |
— | — | 31,697 | — | — | — | ||||||||||||||||||
| Accelerated Vesting of Equity Awards(3) |
750,000 | — | — | — | 405,000 | — | ||||||||||||||||||
| William E. Taylor |
||||||||||||||||||||||||
| Severance |
— | — | 542,316 | — | — | — | ||||||||||||||||||
| Benefit & Perquisite Continuation |
— | — | 9,122 | — | — | — | ||||||||||||||||||
| (1) | Under the terms of his employment agreement, if Mr. Williamson is terminated without “cause” or for “good reason” (as defined in his employment agreement), he is eligible to receive 200% of his base salary |
116
Table of Contents
| and 200% of his target bonus, to be paid over 24 months, as well as continued health and welfare insurance benefits at active employee rates for 18 months post-termination. If Mr. Williamson is terminated due to death or disability, he or his beneficiaries are eligible for continued participation in our health and welfare benefit plans for 18 months post-termination. |
Under the terms of his offer letter, if Mr. Mallak’s employment is involuntarily terminated, he is eligible to receive a severance payment equal to one year of his base salary, which would be paid in accordance with the Severance Policy (as defined below).
Under the terms of their respective severance agreements, if any of Messrs. Fitzpatrick, Mallak or Waltz is terminated without “cause” or for “good reason” (as defined in their respective severance agreements), they are each eligible to receive a severance payment equal to their respective base salary, to be paid in 12 equal monthly installments on dates corresponding to our standard pay practices, and a prorated portion of their respective bonus, as well as continued participation in our health and welfare benefit plans until the earlier of the end of their respective 12-month severance pay period or the date such person becomes eligible for coverage under another employer health plan.
For all the NEOs other than Mr. Taylor, the “Benefit & Perquisite Continuation” row includes the estimated cost of outplacement services that would be provided to the NEO ($14,000 in the case of Mr. Williamson, and $10,500 for the other NEOs). Mr. Taylor did not utilize outplacement services and consequently no amount for outplacement services has been included for him.
| (2) | Under the Severance Policy (described below), as of the last day of fiscal 2015, Mr. Schulte was eligible to receive 26 weeks of severance payments and 26 weeks of continuing health and welfare benefits coverage, as well as outplacement services. |
| (3) | Under the Stock Incentive Plan, unvested stock options are cancelled upon termination of employment, except for termination due to death or disability. Upon a “change in control” (as defined in the Stock Incentive Plan) or upon a death or disability termination, the vesting of stock options will generally accelerate, and, in the case of a change in control, the options will be cancelled in exchange for a cash payment equal to the change in control price minus the exercise price of the applicable option, unless our board of directors elects to allow alternative awards in lieu of acceleration and payment. For more information, see “—Long Term Incentives” in the section “—Compensation Discussion and Analysis.” The amounts set forth in this row include, for each named executive officer, in the “change in control column”, the number of vested and unvested options held by the executive officer as of the end of fiscal 2015 multiplied by the fair market value of our common stock as of that date, which was $12.50; and in the “death or disability” column, the number of unvested options held by the executive officer as of the end of fiscal 2015 multiplied by the fair market value of our common stock as of that date. |
Severance Agreements
We and AII are parties to a severance arrangement with Mr. Williamson as part of his employment agreement. If Mr. Williamson’s employment is terminated without “cause” or due to “good reason” (as each is defined in his employment agreement), then, subject to his execution of a general release of claims, he will be entitled to (i) receive a severance payment equal to 200% of his target bonus plus 200% of his then-current base salary, to be paid out in equal installments during the 24 months following the termination of his employment, and (ii) participate in our health and welfare insurance plans at active employee rates for 18 months post-termination. If his employment is terminated due to his death or disability, he, or his beneficiaries, will be entitled to participate in our health and welfare insurance plans at active employee rates during the 18 months following termination. Mr. Williamson is subject to noncompetition restrictions during the term of his employment and for a one-year period after his employment ends for any reason, and he is subject to non-solicitation restrictions during the term of his employment and for a two-year period after his employment ends for any reason.
117
Table of Contents
AII has also entered into a severance agreement with each of Messrs. Fitzpatrick, Mallak and Waltz. Each severance agreement provides for severance payments and benefits to the respective named executive officer if his employment is terminated by AII and its affiliates without “cause” or if any such named executive officer terminates his employment for “good reason” (as each is defined in their respective severance agreements), subject to their respective execution of a general release and waiver of claims. The severance payment and benefits under their respective severance agreements include (i) a cash severance payment in an amount equal to one times annual base salary in effect immediately prior to their respective termination, to be paid in equal installments on our standard payroll schedule; (ii) a pro-rated portion of any discretionary bonuses that each would have been eligible to receive had their respective employment continued through the end of the fiscal year in which their respective termination occurs (provided that all applicable performance measures for payment of such bonuses have actually been met); and (iii) health benefits coverage continued until the earlier of the end of their respective severance pay period or the date such named executive officer becomes eligible for coverage under another employer health plan. Additionally, Mr. Fitzpatrick, Mr. Mallak and Mr. Waltz are subject to non-competition and non-solicitation restrictions for one year post-termination, as well as ongoing obligations of confidentiality and non-disparagement.
Severance Policy
On May 9, 2012, the Compensation Committee adopted a severance policy, or the “Severance Policy,” which applies to all U.S. exempt and non-exempt salaried employees and international employees to the extent permitted by applicable law. The Severance Policy does not apply to those employees covered by a collective bargaining agreement or an employment contract that supersedes the Severance Policy. The Severance Policy generally provides for severance payments and benefits to covered employees with at least six months of continuous service who are involuntary terminated due to (i) lack of work or reductions in workforce; (ii) facility closure or sale, unless the employee is offered a reasonably comparable position, compensation and benefits by us or a successor company; (iii) the employee’s refusal to relocate to a job which is more than 50 miles away from the employee’s then current worksite; and (iv) any other reason determined to warrant severance payments and benefits. Covered employees who are terminated for poor performance despite their reasonable efforts are eligible to receive half of the severance payments and benefits described below. The Severance Policy does not apply to employees who are voluntarily terminated, temporarily laid-off, or who are terminated for “cause” (as defined in the Severance Policy). Prior to receiving any severance payments and benefits, the employee must execute a legal release and non-compete agreement. The severance payments and termination benefits available under the Severance Policy are based upon the employee’s compensation band level and length of service from the employee’s most recent date of hire. Depending on their compensation band level, separated employees are eligible to receive between one and two weeks of severance payments and benefits for each full year of service, subject to certain minimum and maximum severance periods for each compensation band level. Compensation band level is determined by the employee’s then-current job position. We will also pay the employer portion of the cost of continuation coverage under COBRA for the employee’s medical, prescription drug and dental benefits for a period equal to the applicable severance period or until the employee is eligible for alternative coverage, whichever occurs first. Additionally, we typically will provide outplacement services to separated employees. Mr. Schulte is the only NEO who participates in the Severance Policy.
Taylor Separation Agreement
In connection with his termination, effective April 17, 2015, Mr. Taylor entered into a severance agreement with AII. The severance agreement entitled Mr. Taylor to: (i) severance pay in the form of salary continuation from April 18, 2015 through January 15, 2016 (39 weeks); (ii) participate in our health and welfare insurance plans at active employee rates through January 15, 2016; (iii) a prorated portion (i.e., 50%, or 26 weeks) of his 2015 AIP assuming actual plan achievement and personal performance equal to 100%; and (iv) an additional week of 2015 AIP payment for each week that Mr. Taylor rendered transitional services to us as a consultant after April 18, 2015 (as to which Mr. Taylor rendered 12 weeks of services). These severance benefits are subject to Mr. Taylor’s continued compliance with non-solicitation restrictions through April 17, 2016, as well as ongoing obligations of confidentiality and non-disparagement.
118
Table of Contents
Changes to the Compensation Program in Connection with the Initial Public Offering
The following is a summary of the long- and short-term incentive plans we intend for our board of directors to adopt and our stockholders to approve in connection with this offering. The following description of the material terms and conditions of these plans is qualified by reference to the full text of the respective plans.
Omnibus Incentive Plan
Background. As described above (see “—Compensation Discussion and Analysis—Long-Term Incentives”), since 2011 we have provided our officers and other employees with long-term equity incentives under the Stock Incentive Plan. Prior to the completion of this offering, we intend for our board of directors to adopt and our stockholders to approve the Atkore International Group Inc. 2016 Omnibus Incentive Plan, or the “Omnibus Incentive Plan,” pursuant to which we will make grants of incentive compensation to our directors, officers and other employees after the adoption of the Omnibus Incentive Plan. When we adopt the Omnibus Incentive Plan, the Stock Incentive Plan will terminate and we will make no more awards thereunder. However, awards previously granted under the Stock Incentive Plan will be unaffected by the termination of the Stock Incentive Plan. The following are the material terms of the Omnibus Incentive Plan.
Administration. Our board of directors has the authority to interpret the terms and conditions of the Omnibus Incentive Plan, to determine eligibility for and terms of awards for participants and to make all other determinations necessary or advisable for the administration of the Omnibus Incentive Plan. The board of directors will delegate its authority to the Compensation Committee, referred to below as the “Administrator.” To the extent consistent with applicable law, the Administrator may further delegate the ability to grant awards to our Chief Executive Officer or other of our officers. In addition, subcommittees may be established to the extent necessary to comply with Section 162(m) of the Code or Rule 16b-3 under the Exchange Act. The Omnibus Incentive Plan is intended to qualify for transition relief available to newly public companies under Section 162(m) of the Code.
Eligible Award Recipients. Our directors, officers, other employees and consultants are eligible to receive awards under the Omnibus Incentive Plan.
Awards. Awards under the Omnibus Incentive Plan may be made in the form of stock options, which may be either incentive stock options or non-qualified stock options; stock purchase rights; restricted stock; restricted stock units; performance shares; performance units; stock appreciation rights, or “SARs”; dividend equivalents; deferred share units; and other stock-based awards.
Shares Subject to the Omnibus Incentive Plan. Subject to adjustment as described below, a total of 2.75 million shares of our common stock will be available for issuance under the Omnibus Incentive Plan. This figure represents approximately 6% of our outstanding common stock on a fully diluted basis as of May 5, 2016. As of May 5, 2016, there were approximately 4.9 million shares subject to outstanding stock options under the Stock Incentive Plan. Shares issued under the Omnibus Incentive Plan may be authorized but unissued shares or shares reacquired by us. All of the shares under Omnibus Incentive Plan may be granted as incentive stock options within the meaning of the Code. During any period that Section 162(m) of the Code is applicable to us, (1) the maximum number of stock options, SARs or other awards based solely on the increase in the value of common stock that a participant may receive in any calendar year is 750,000; (2) a participant may receive a maximum of 500,000 performance shares, shares of performance-based restricted stock and restricted stock units in any calendar year; and (3) the maximum dollar value that may be earned in connection with the grant of performance units during any calendar year may not exceed $5 million. In addition, in any calendar year, the fair market value of shares subject to awards granted to any non-employee director, and the cash paid to any non-employee director, may not exceed $500,000 in the aggregate (excluding for this purposes any additional compensation payable to a non-executive chairman for services in that capacity).
119
Table of Contents
Any shares covered by an award, or portion of an award, granted under the Omnibus Incentive Plan that terminates, is forfeited, is repurchased, expires or lapses for any reason will again be available for the grant of awards under the Omnibus Incentive Plan. Additionally, any shares tendered or withheld to satisfy the grant or exercise price or tax withholding obligations pursuant to any award under the Omnibus Incentive Plan, and the shares subject to any award that is settled in cash, will again be available for issuance. The Omnibus Incentive Plan permits us to issue replacement awards to employees of companies acquired by us, but those replacement awards would not count against the share maximum listed above, and any forfeited replacement awards would not be eligible to be available for future grant. Shares subject to outstanding awards under the Stock Incentive Plan would not be available for future grant under any circumstances.
Terms and Conditions of Options and Stock Appreciation Rights. An “incentive stock option” is an option that meets the requirements of Section 422 of the Code, and a “non-qualified stock option” is an option that does not meet those requirements. A stock appreciation right, or “SAR,” is the right of a participant to a payment, in cash, shares of common stock, or a combination of cash and shares equal to the amount by which the market value of a share of common stock exceeds the exercise price of the stock appreciation right. An option or SAR granted under the Omnibus Incentive Plan will be exercisable only to the extent that it is vested on the date of exercise. Unless otherwise determined by the Administrator, no option or SAR may be exercisable more than ten years from the grant date. The Administrator may include in the option agreement the period during which an option may be exercised following termination of employment or service. SARs may be granted to participants in tandem with options or separately. Tandem SARs will generally have substantially similar terms and conditions as the options with which they are granted.
The exercise price per share under each non-qualified option and SAR granted under the Omnibus Incentive Plan may not be less than 100% of the fair market value of our common stock on the option grant date. For so long as our common stock is listed on the NYSE, the fair market value of the common stock will be equal to the closing price of our common stock on the NYSE on the option grant date. If no sales of common stock were reported on the option grant date, the fair market value will be deemed equal to the closing price on the NYSE for the last preceding date on which sales of our common stock were reported. If our common stock is not listed on any stock exchange or traded in the over-the-counter market, fair market value will be as determined in good faith by the Administrator in a manner consistent with Section 409A of the Code. For awards granted on or with a date of determination that is the date of the pricing of the initial public offering, the fair market value of the common stock would be equal to the initial public offering price. The Omnibus Incentive Plan includes a general prohibition on the repricing of out-of-the-money options and SARs without shareholder approval.
Terms and Conditions of Restricted Stock and Restricted Stock Units. Restricted stock is an award of common stock on which certain restrictions are imposed over specified periods that subject the shares to a substantial risk of forfeiture. A restricted stock unit is a unit, equivalent in value to a share of common stock, credited by means of a bookkeeping entry in our books to a participant’s account, which is settled in stock or cash upon or after vesting. Subject to the provisions of the Omnibus Incentive Plan, our Administrator will determine the terms and conditions of each award of restricted stock or restricted stock units, including the restricted period for all or a portion of the award, and the restrictions applicable to the award. Restricted stock and restricted stock units granted under the Omnibus Incentive Plan will vest based on a period of service specified by our Administrator or the occurrence of events specified by our Administrator.
Terms and Conditions of Performance Shares and Performance Units. A performance share is a grant of a specified number of shares of common stock, or a right to receive a specified number of shares of common stock after the date of grant, subject to the achievement of predetermined performance conditions. A performance unit is a unit, equivalent in value to a share of common stock, that represents the right to receive a share of common stock or the equivalent cash value of a share of common stock if predetermined performance conditions are achieved. Vested performance units may be settled in cash, stock or a combination of cash and stock, at the discretion of the Administrator. Performance shares and performance units will vest based on the achievement of pre-determined performance goals established by the Administrator and specified in the applicable award
120
Table of Contents
agreements, and such other conditions, restrictions and contingencies as the Administrator may determine. The performance goals available to the Administrator for awards intended to qualify as performance-based compensation pursuant to Section 162(m) of the Code are the same as those listed below with respect to our Annual Incentive Plan. At any time when Section 162(m) of the Code is not applicable to us and the Omnibus Incentive Plan and for persons whose compensation is not subject to Section 162(m) of the Code, performance goals may be based on such other criteria as may be determined by the Administrator.
Terms and Conditions of Deferred Share Units. A deferred share unit is a unit credited to a participant’s account in our books that represents the right to receive a share of common stock or the equivalent cash value of a share of common stock upon a predetermined settlement date. Deferred share units may be granted by the Administrator independent of other awards or compensation. Unless the Administrator determines otherwise, deferred share units would be fully vested when granted.
Other Stock-Based Awards. The Administrator may make other equity-based or equity-related awards not otherwise described by the terms of the Omnibus Incentive Plan, including formula grants to our non-employee directors under our director compensation program.
Dividend Equivalents. A dividend equivalent is the right to receive payments in cash or in stock, based on dividends with respect to shares of stock. Dividend equivalents may be granted to participants in tandem with another award or as freestanding awards.
Termination of Employment. Except as otherwise determined by the Administrator, in the event a participant’s employment terminates for any reason other than “cause” (as defined in the Omnibus Incentive Plan), all unvested awards will be forfeited and all options and SARs that are vested and exercisable will remain exercisable until a specified period of time following the date of the participant’s termination of employment. In the event of a participant’s termination for cause, all unvested or unpaid awards, including all options and SARs, whether vested or unvested, will immediately be forfeited and canceled.
Other Forfeiture Provisions. A participant will be required to forfeit and disgorge any awards granted or vested and all gains earned or accrued due to the exercise of stock options or SARs or the sale of any Company Common Stock to the extent required by applicable law, including Section 304 of the Sarbanes-Oxley Act and Section 10D of the Exchange Act, or pursuant to such policies as to forfeiture and recoupment as may be adopted by the Administrator, the board of directors or us and communicated to participants.
Change in Capitalization or Other Corporate Event. The number or amount of shares of stock, other property or cash covered by outstanding awards, the number and type of shares of stock that have been authorized for issuance under the Omnibus Incentive Plan, the exercise or purchase price of each outstanding award, and the other terms and conditions of outstanding awards, will be subject to adjustment by the Administrator in the event of any stock dividend, extraordinary dividend, stock split or share combination or any recapitalization, merger, consolidation, exchange of shares, spin-off, liquidation or dissolution of the Company or other similar transaction affecting our common stock. Any such adjustment would not be considered repricing for purposes of the prohibition on repricing described above.
Effect of a Change in Control. Except as otherwise determined by the Administrator, upon a future change in control of the Company, unless prohibited by applicable law (including if such action would trigger adverse tax treatment under Section 409A of the Code), no accelerated vesting or cancellation of awards would occur if the awards are assumed and/or replaced in the change in control with substitute awards having the same or better terms and conditions (except that any substitute awards must fully vest on a participant’s involuntary termination of employment without “cause” or constructive termination of employment, in each case occurring within two years following the date of the change in control). To the extent that any awards are not assumed and/or replaced in this manner, then those awards would fully vest and be cancelled for the same per share payment made to the shareholders in the change in control (less, in the case of options and SARs, the applicable exercise or base price). The Administrator has the ability to prescribe different treatment of awards in the award agreements.
121
Table of Contents
Clawback. We may cancel, reduce or require an employee to forfeit any awards granted under the Omnibus Incentive Plan or require an employee to reimburse and disgorge to us any amounts received pursuant to awards granted under the Omnibus Incentive Plan, to the extent permitted or required by applicable law or regulations in effect on or after the effective date of the Omnibus Incentive Plan.
Expiration Date. The Omnibus Incentive Plan as a ten-year term and will expire at the end of that term unless further approval of our shareholders of the Omnibus Incentive Plan (or a successor plan) is obtained. However, the expiration of the Omnibus Incentive Plan would have no effect on outstanding awards previously granted.
Annual Incentive Plan
Background. As described above (see “—Compensation Discussion and Analysis—Annual Incentive Plan Compensation”), we maintain the Annual Incentive Plan, or the “Prior AIP,” pursuant to which we provide our executive officers and other key employees with the opportunity to earn performance-based annual cash bonuses. Prior to the completion of the offering, we intend to adopt the Atkore International Group Inc. Annual Incentive Plan, or the “AIP,” which is intended to replace and succeed the Prior AIP. Upon the completion of this offering, awards granted under the Prior AIP relating to fiscal year 2016 will be assumed into the AIP and treated as awards granted under the AIP. Following the completion of the offering, the AIP will provide annual cash incentives to our executive officers and certain other key employees. The material terms of the AIP are described below.
Purpose. The AIP is designed to retain and motivate our and our subsidiaries’ officers and other key employees who are designated by the Compensation Committee by providing them with an opportunity to earn cash incentives based on our attainment of certain specified performance goals. The AIP is designed to meet the requirements of the performance-based compensation exemption for purposes of Section 162(m) of the Code, to the extent applicable. The AIP is also intended to qualify for transition relief available to newly public companies under Section 162(m) of the Code.
Administration. The AIP is administered by our Compensation Committee, which may delegate authority under the AIP to our Chief Executive Officer or any other of our executive officers, except that the Compensation Committee may not delegate its responsibilities with respect to awards to any employee whose compensation is subject to Section 162(m) of the Code.
Eligible Employees. All of our officers and other key employees are eligible to participate in the AIP.
Performance Goals. The Compensation Committee will select those of our employees who will participate in the AIP for a specified performance period and will establish the applicable performance goals for such performance period no later than 90 days after the beginning of the performance period, or if earlier, the date on which 25% of the performance period has been completed. It is expected that the performance period will be our fiscal year, unless our Compensation Committee determines to use another period. As to any award intended to qualify as performance based compensation under Section 162(m) of the Code, the performance goals must include one or more of the following objective performance measures: (a) net or operating income (before or after taxes); (b) any earnings measure, including EBITDA; (c) any measure based on net income or net loss; (d) basic or diluted earnings per share or improvement in basic or diluted earnings per share; (e) sales (including, but not limited to, total sales, net sales or revenue growth); (f) net operating profit; (g) financial return measures (including, but not limited to, return on assets, capital, invested capital, equity, sales, or revenue); (h) cash flow measures (including, but not limited to, operating cash flow, free cash flow, cash flow return on equity, and cash flow return on investment); (i) productivity ratios (including but not limited to measuring liquidity, profitability or leverage); (j) share price (including, but not limited to, growth measures and total shareholder return); (k) expense/cost management targets; (l) margins (including, but not limited to, operating margin, net income margin, cash margin, gross, net or operating profit margins, or margins based on EBITDA (whether or not
122
Table of Contents
adjusted)); (m) operating efficiency; (n) market share or market penetration; (o) customer targets (including, but not limited to, customer growth or customer satisfaction); (p) working capital targets or improvements; (q) economic value added; (r) balance sheet metrics (including, but not limited to, inventory, inventory turns, receivables turnover, net asset turnover, debt reduction, retained earnings, year-end cash, cash conversion cycle, ratio of debt to equity or to earnings or EBITDA); (s) workforce targets (including but not limited to diversity goals, employee engagement or satisfaction, employee retention and workplace health and safety goals); (t) implementation, completion or attainment of measurable objectives with respect to research and development, key products or key projects, lines of business, acquisitions and divestitures and strategic plan development and/or implementation; (u) comparisons with various stock market indices, peer companies or industry groups or classifications with regard to one more of these criteria, or (v) for any period of time in which Section 162(m) is not applicable to the Company and the Plan, or at any time in the case of persons who are not “covered employees” under Section 162(m) of the Code, such other criteria as may be determined by the Committee. Performance goals may be established on a Company-wide basis or with respect to one or more business units, divisions, subsidiaries, or products and may be expressed in absolute terms, or relative to (i) current internal targets or budgets, (ii) the past performance of the Company (including the performance of one or more subsidiaries, divisions, or operating units), (iii) the performance of one or more similarly situated companies, (iv) the performance of an index covering a peer group of companies, or (v) other external measures of the selected performance criteria. In the case of earnings-based measures, performance goals may include comparisons relating to capital (including, but limited to, the cost of capital), shareholders’ equity, shares outstanding, assets or net assets, or any combination thereof. The Compensation Committee may provide for a threshold level of performance below which no amount of compensation will be paid and a maximum level of performance above which no additional amount of compensation will be paid under the AIP, and it may provide for the payment of differing amounts of compensation for different levels of performance. Performance goals may also be subject to such other conditions as the Compensation Committee may determine appropriate.
Maximum Award; Discretion. The maximum amount payable to any participant under the AIP during any given twelve-month performance period is $4 million, and this figure is proportionately increased or decreased for longer or shorter performance periods. In all cases, our Compensation Committee has the sole and absolute discretion to reduce the amount of any payment under the AIP that would otherwise be made to any participant or to decide that no payment shall be made.
Payment. Payment of awards will be made in cash, and with respect to employees whose compensation is subject to Section 162(m), as soon as practicable after our Compensation Committee certifies that one or more of the applicable performance goals have been attained for a performance period. Awards will be paid no later than the 15th day of the third month following the end of the year to which the performance period relates. In order to receive payment of an award, an employee must be employed by us on the date of payment unless the board of directors or Compensation Committee determines otherwise.
Clawback. We may cancel, reduce or require an employee to forfeit any awards granted under the AIP or require an employee to reimburse and disgorge to us any amounts received pursuant to awards granted under the AIP, to the extent permitted or required by applicable law or regulations in effect on or after the effective date of the AIP.
Amendment or Termination. The board or of directors the Compensation Committee may at any time amend, suspend, discontinue or terminate the AIP, provided, however, that such action shall not be effective without the approval of the shareholders of the Company to the extent necessary to continue to qualify the amounts payable to employees as performance-based compensation under Section 162(m) of the Code.
Director Compensation
For so long as the consulting agreement with CD&R, as described in “Certain Relationships and Related Transactions—Consulting Agreements” remains in effect, no director affiliated with CD&R is compensated by
123
Table of Contents
the Company for any services as a director. Subject to limitations set forth in the consulting agreement, the Company reimburses its directors for reasonable out-of-pocket expenses incurred by them for attending meetings of our board of directors and committees thereof. During fiscal 2015, we appointed an independent outside director as described above. We intend to compensate our non-employee directors who are not affiliated with CD&R as follows: an annual cash retainer of $75,000 and an annual equity award of Restricted Stock Units, or “RSUs,” with a value at the time of grant of $85,000. In addition, the chairperson of the Audit Committee receives an additional annual cash retainer of $20,000 and the chairperson of the Compensation Committee receives an additional annual cash retainer of $15,000, and the chairperson of the Nominating and Governance Committee receives an additional annual cash retainer of $10,000. RSUs will generally be subject to a one-year vesting schedule based on the director’s continued services to us.
| Name |
Fees Earned or Paid in Cash ($) |
Stock Awards ($)(2) |
Option Awards ($) |
Non-Equity Incentive Plan Compensation ($) |
All Other Compensation ($) |
Total ($) |
||||||||||||||||||
| A. Mark Zeffiro(1) |
95,000 | 100,000 | — | — | — | 195,000 | ||||||||||||||||||
| (1) | Fees earned by or paid to Mr. Zeffiro include a $75,000 cash retainer for his service on our board of directors and a $20,000 cash retainer for his service as the Chairperson of our Audit Committee. All cash fees were paid in full upon Mr. Zeffiro’s appointment to the board. |
| (2) | Mr. Zeffiro was granted 8,000 RSUs at a per share value of $12.50. The RSUs were immediately vested upon grant. |
124
Table of Contents
PRINCIPAL AND SELLING STOCKHOLDERS
The following table sets forth information as of April 1, 2016 with respect to the ownership of our common stock by:
| • | each person known to own beneficially more than five percent of our common stock, including the selling stockholder; |
| • | each of our directors; |
| • | each of our named executive officers; and |
| • | all of our current executive officers and directors as a group. |
The amounts and percentages of shares beneficially owned are reported on the basis of regulations of the SEC governing the determination of beneficial ownership of securities. Under SEC rules, a person is deemed to be a “beneficial owner” of a security if that person has or shares voting power or investment power, which includes the power to dispose of or to direct the disposition of such security. A person is also deemed to be a beneficial owner of any securities of which that person has a right to acquire beneficial ownership within 60 days. Securities that can be so acquired are deemed to be outstanding for purposes of computing such person’s ownership percentage, but not for purposes of computing any other person’s percentage. Under these rules, more than one person may be deemed to be a beneficial owner of the same securities, and a person may be deemed to be a beneficial owner of securities as to which such person has no economic interest.
Percentage computations are based on approximately 45,590,049 shares of our common stock outstanding as of April 1, 2016. The numbers of shares on the following table have not yet been adjusted to reflect our anticipated stock split prior to completion of this offering.
Except as otherwise indicated in these footnotes, each of the beneficial owners listed has, to our knowledge, sole voting and investment power with respect to the indicated shares of common stock. Unless otherwise set forth in the footnotes to the table, the address for each listed stockholder is c/o Atkore International Group Inc., 16100 South Lathrop Avenue, Harvey, Illinois 60426.
| Shares Beneficially Owned Before the Offering and After the Offering Assuming the Underwriters’ Option is Not Exercised(1) |
Shares Beneficially Owned After the Offering Assuming the Underwriters’ Option is Exercised in Full |
|||||||||||||||||||||||
| Name of Beneficial Owner |
Number of Shares Owned |
Percent of Class Before the Offering (%) |
Shares Offered Hereby |
Percent of Class After the Offering (%) |
Number | Percent (%) |
||||||||||||||||||
| CD&R Allied Holdings, L.P.(2) |
45,263,049 | 99.3 | ||||||||||||||||||||||
| Philip W. Knisely(3) |
— | — | — | — | — | — | ||||||||||||||||||
| John P. Williamson(4) |
774,000 | 1.7 | — | 1.7 | 774,000 | 1.7 | ||||||||||||||||||
| James A. Mallak(4) |
228,000 | * | — | * | 228,000 | * | ||||||||||||||||||
| William E. Waltz(4) |
94,000 | * | — | * | 94,000 | * | ||||||||||||||||||
| Michael J. Schulte(4) |
138,400 | * | — | * | 138,400 | * | ||||||||||||||||||
| Kevin P. Fitzpatrick(4) |
228,000 | * | — | * | 228,000 | * | ||||||||||||||||||
| James G. Berges(3) |
— | — | — | — | — | — | ||||||||||||||||||
| Jeri L. Isbell(5) |
5,556 | * | — | * | 5,556 | * | ||||||||||||||||||
| Scott H. Muse(5) |
5,556 | * | — | * | 5,556 | * | ||||||||||||||||||
| Nathan K. Sleeper(3) |
— | — | — | — | — | — | ||||||||||||||||||
| William VanArsdale(5) |
5,556 | * | — | * | 5,556 | * | ||||||||||||||||||
| A. Mark Zeffiro(5) |
8,000 | * | — | * | 8,000 | * | ||||||||||||||||||
| Jonathan L. Zrebiec(3) |
— | — | — | — | — | — | ||||||||||||||||||
| All current directors and executive officers as a group (15 persons)(4)(5) |
1,633,068 | 3.5 | — | 3.5 | 1,633,068 | 3.5 | ||||||||||||||||||
125
Table of Contents
| * | Less than one percent. |
| (1) | The selling stockholder has granted the Underwriters an option to purchase up to an additional shares. |
| (2) | CD&R Associates VIII, Ltd., or “CD&R Holdings GP,” as the general partner of CD&R Investor, CD&R Associates VIII, L.P., as the sole stockholder of CD&R Holdings GP, and CD&R Investment Associates VIII, Ltd., as the general partner of CD&R Associates VIII, L.P., may each be deemed to beneficially own the shares of the Company’s common stock. Each of CD&R Holdings GP, CD&R Associates VIII, L.P. and CD&R Investment Associates VIII, Ltd. expressly disclaims beneficial ownership of the shares of the Company’s common stock in which CD&R Investor has beneficial ownership. CD&R Investment Associates VIII, Ltd. is managed by a two-person board of directors. Donald J. Gogel and Kevin J. Conway, as the directors of CD&R Investment Associates VIII, Ltd., may be deemed to share beneficial ownership of the shares of the Company’s common stock in which CD&R Investor has beneficial ownership. Such persons expressly disclaim such beneficial ownership. Investment and voting decisions with respect to the shares of the Company’s common stock held by CD&R Investor are made by an investment committee of limited partners of CD&R Associates VIII, L.P., the “Investment Committee.” The CD&R investment professionals who have effective voting control of the Investment Committee are Michael G. Babiarz, Vindi Bagna, James G. Berges, John C. Compton, Kevin J. Conway, Thomas C. Franco, Kenneth A. Giuriceo, Donald J. Gogel, Jillian C. Griffiths, Marco Herbst, John Krenicki, Jr., David A. Novak, Paul S. Pressler, Christian Rochat, Ravi Sachdev, Richard J. Schnall, Nathan K. Sleeper, Sonja Terraneo and David H. Wasserman. All members of the Investment Committee expressly disclaim beneficial ownership of the shares shown as beneficially owned by CD&R Investor. The address for each of CD&R Investor, CD&R Holdings GP, CD&R Associates VIII, L.P., and CD&R Investment Associates VIII, Ltd. is c/o Maples Corporate Services Limited, PO Box 309, Ugland House, South Church Street, George Town, Grand Cayman, KY1-1104, Cayman Islands. |
| (3) | Does not include common stock held by CD&R Allied Holdings, L.P. Messrs. Knisely, Berges, Sleeper and Zrebiec are directors of Atkore. Messrs. Berges, Sleeper and Zrebiec are principals of CD&R and Mr. Knisely is an operating advisor to CD&R funds. They expressly disclaim beneficial ownership of the shares held by CD&R Investor. The address for Messrs. Knisely, Berges, Sleeper and Zrebiec is c/o Clayton, Dubilier & Rice, LLC, 375 Park Avenue, New York, New York 10152. |
| (4) | Includes shares which the current executive officers have the right to acquire prior to May 31, 2016 through the exercise of stock options or vesting of RSUs: Mr. Williamson, 674,000, Mr. Mallak, 198,000, Mr. Waltz, 84,000, Mr. Schulte, 106,400, and Mr. Fitzpatrick, 198,000. All current executive officers as a group have the right to acquire 1,396,400 shares prior to May 31, 2016 through the exercise of stock options or vesting of RSUs. |
| (5) | Includes RSUs granted to the directors for board service that were immediately vested upon grant: Ms. Isbell, 5,556 RSUs, Mr. Muse, 5,556 RSUs, Mr. VanArsdale, 5,556 RSUs, and Mr. Zeffiro, 8,000 RSUs. |
126
Table of Contents
CERTAIN RELATIONSHIPS AND RELATED PARTY TRANSACTIONS
Policies and Procedures for Related Person Transactions
Prior to the completion of this offering, we expect that our board of directors will approve policies and procedures with respect to the review and approval of certain transactions between us and a “Related Person,” or a “Related Person Transaction,” which we refer to as our “Related Person Transaction Policy.” Pursuant to the terms of the Related Person Transaction Policy, our board of directors, acting through our Audit Committee, must review and decide whether to approve or ratify any Related Person Transaction. Any Related Person Transaction is required to be reported to our legal department, which will then determine whether it should be submitted to our Audit Committee for consideration. The Audit Committee must then review and decide whether to approve any Related Person Transaction.
For the purposes of the Related Person Transaction Policy, a “Related Person Transaction” is a transaction, arrangement or relationship (or any series of similar transactions, arrangements or relationships) in which we (including any of our subsidiaries) were, are or will be a participant and the amount involved exceeds $120,000, and in which any Related Person had, has or will have a direct or indirect interest.
A “Related Person,” as defined in the Related Person Transaction Policy, means any person who is, or at any time since the beginning of our last fiscal year was, a director or executive officer of Atkore or a nominee to become a director of Atkore; any person who is known to be the beneficial owner of more than five percent of our common stock; any immediate family member of any of the foregoing persons, including any child, stepchild, parent, stepparent, spouse, sibling, mother-in-law, father-in-law, son-in-law, daughter-in-law, brother-in-law, or sister-in-law of the director, executive officer, nominee or more than five percent beneficial owner, and any person (other than a tenant or employee) sharing the household of such director, executive officer, nominee or more than five percent beneficial owner; and any firm, corporation or other entity in which any of the foregoing persons is a general partner or, for other ownership interests, a limited partner or other owner in which such person has a beneficial ownership interest of ten percent or more.
Stockholders Agreement
Prior to the completion of this offering, we expect to enter into a stockholders agreement with the CD&R Investor. The stockholders agreement will grant the CD&R Investor the right to designate for nomination for election to our board of directors a number of CD&R Designees equal to:
| • | at least a majority of the total number of directors comprising our board of directors at such time as long as the CD&R Investor beneficially owns at least 50% of the outstanding shares of our common stock; |
| • | at least 40% of the total number of directors comprising our board of directors at such time as long as the CD&R Investor beneficially owns at least 40% but less than 50% of the outstanding shares of our common stock; |
| • | at least 30% of the total number of directors comprising our board of directors at such time as long as the CD&R Investor beneficially owns at least 30% but less than 40% of the outstanding shares of our common stock; |
| • | at least 20% of the total number of directors comprising our board of directors at such time as long as the CD&R Investor beneficially owns at least 20% but less than 30% of the outstanding shares of our common stock; and |
| • | at least 5% of the total number of directors comprising our board of directors at such time as long as the CD&R Investor beneficially owns at least 5% but less than 20% of the outstanding shares of our common stock. |
127
Table of Contents
For purposes of calculating the number of CD&R Designees that the CD&R Investor is entitled to nominate pursuant to the formula outlined above, any fractional amounts would be rounded up to the nearest whole number and the calculation would be made on a pro forma basis after taking into account any increase in the size of our board of directors.
With respect to any vacancy of a CD&R-designated director, the CD&R Investor will have the right to designate a new director for election by a majority of the remaining directors then in office.
The stockholders agreement will provide that a CD&R Designee will serve as the Chairman of our board of directors as long as the CD&R Investor beneficially owns at least 25% of the outstanding shares of our common stock.
The stockholders agreement will also grant to the CD&R Investor certain other rights, including specified information and access rights.
Registration Rights Agreement
In connection with this offering, we will enter into a registration rights agreement with the CD&R Investor. The registration rights agreement will grant to the CD&R Investor the right to cause us, at our expense, to use our reasonable best efforts to register shares held by the CD&R Investor for public resale, subject to specified limitations. If we register any of our common stock following our initial public offering, the CD&R Investor and the other parties to the registration rights agreement will also have the right to require us to use reasonable best efforts to include shares of our common stock held by them, subject to specified limitations, including as determined by the underwriters. The registration rights agreement will provide for us to indemnify the CD&R Investor and its affiliates in connection with the registration of our common stock.
Investment Agreement
Prior to December 2010, we were operated as the TEMP business of Tyco. In December 2010, pursuant to the terms of the Investment Agreement by and among the CD&R Investor, the Tyco Seller, Tyco and AIH, (i) the CD&R Investor acquired shares of a newly created class of our cumulative convertible preferred stock that initially represented 51% of our outstanding capital stock (on an as-converted basis) and (ii) we issued shares of our common stock to the Tyco Seller that initially represented the remaining 49% of our outstanding capital stock. On April 9, 2014, we acquired all of the shares of our common stock held by the Tyco Seller for an aggregate cash purchase price of approximately $250.0 million.
Indemnification
Under the terms and subject to the conditions and restrictions in respect of indemnification claims set forth in the Investment Agreement, we agreed to indemnify the Tyco Seller, its affiliates and each of its and its affiliates’ representatives from and against any and all, or in the case of the third bullet below, 85% of, losses to the extent arising out of the following:
| • | the operations and liabilities of TEMP and Atkore before or after the closing of the Transactions (except to the extent that Atkore or the CD&R Investor is otherwise entitled to indemnification); |
| • | certain pending, threatened and future litigation claims relating to the alleged incompatibility of our ABF II anti-microbial coated sprinkler pipe with chlorinated PVC pipes or fittings, or the “Special Products Claims,” where there is no claim that the Tyco Seller or its affiliates provided the applicable chlorinated PVC pipes or fittings or installation services, subject in the case of future Special Products Claims not existing as of the date of the Investment Agreement to a cap of $13 million in respect of cumulative Atkore losses, other than losses paid prior to the closing of the Transactions, arising out of all future Special Products Claims not existing as of the date of the Investment Agreement, or the “Special Products Deductible”; |
128
Table of Contents
| • | Special Products Claims, where there is a claim that the Tyco Seller or its affiliates provided the applicable chlorinated PVC pipes or fittings or installation services, subject, in respect of future Special Products Claims not existing as of the date of the Investment Agreement, to the Special Products Deductible; |
| • | the failure by Atkore to comply with its covenants or agreements in the Investment Agreement to be performed in whole or in part following the closing of the Transactions; and |
| • | post-closing taxes of Atkore. |
Under the terms and subject to the conditions, restrictions and limitations in respect of indemnification claims set forth in the Investment Agreement, Tyco and the Tyco Seller agreed to indemnify us and each of our and our affiliates’ representatives from and against any and all, or in the case of the sixth bullet below, 15% of, losses to the extent arising out of the following:
| • | inaccuracies of or breaches by the Tyco Seller of its representations and warranties made in the Investment Agreement; |
| • | the failure by the Tyco Seller to comply with its covenants or agreements in the Investment Agreement; |
| • | the operations and liabilities of Tyco and its affiliates (other than in respect of TEMP) before or after the closing of the Transactions (except to the extent that the Tyco Seller is otherwise entitled to indemnification); |
| • | any modification to the reorganization steps to be performed prior to the closing of the Transactions and set forth in the Investment Agreement and the schedules thereto; |
| • | future Special Products Claims not existing as of the date of the Investment Agreement in excess of the Special Products Deductible; |
| • | Special Products Claims, where there is a claim that Tyco Seller or its affiliates provided the applicable chlorinated PVC pipe or fittings or installation services; and |
| • | pre-closing taxes of Atkore or its subsidiaries. |
Since fiscal 2011, we have made total payments of approximately $6 million with respect to claims existing as of the date of the Investment Agreement which are not subject to the $13 million Special Products Deductible, all of which were made to third parties. Costs relating to claims not existing as of the date of the Investment Agreement are subject to the Special Products Deductible and we estimate that since fiscal 2011 we have made total payments of approximately $2 million with respect to such claims, all of which were also made to third parties.
Repurchase of Common Stock Held by Tyco and Conversion of Preferred Stock Held by CD&R Investor
On April 9, 2014, we acquired all of the shares of our common stock held by the Tyco Seller for an aggregate cash purchase price of approximately $250.0 million. As a result of the sale of the Tyco Seller’s ownership interest, Tyco and its subsidiaries are no longer considered related parties and are not reported as such for periods after April 9, 2014.
Also on April 9, 2014, the CD&R Investor converted shares of preferred stock held by it into shares of our common stock.
Consulting Agreements
In connection with the closing of the Transactions, we, AIH and AII entered into separate consulting agreements with CD&R and Tyco International Management Company, LLC, or the “Tyco Manager.” The consulting agreement with the Tyco Manager was terminated on April 9, 2014 as a result of our repurchasing all of our common stock held by the Tyco Seller.
Pursuant to the consulting agreement with CD&R, CD&R provides us with financial, investment banking, management, advisory and other services. The annual consulting fee payable to CD&R under the consulting agreement is currently $3.5 million, plus out-of-pocket expenses. We are also required to pay CD&R a fee equal to 1.0% of the transaction value of certain financing and acquisition or disposition transactions completed by us, plus out-of-pocket expenses, or such lesser amount as CD&R and we may agree.
129
Table of Contents
Prior to April 9, 2014, we paid a $6.0 million annual consulting fee to CD&R and Tyco based on their pro rata ownership percentages. The fee paid to Tyco in fiscal 2014 was prorated through April 9, 2014. Subsequently, CD&R’s annual advisory fee was reduced to $3.5 million. We recorded aggregate consulting fees related to the consulting agreements of $3.5 million, $4.9 million and $6.0 million for fiscal 2015, 2014 and 2013, respectively.
In connection with this offering, we will enter into a termination agreement with CD&R, pursuant to which the parties will agree to terminate the ongoing consulting fee described above. Pursuant to the termination agreement, we intend to pay CD&R a termination fee of $12.8 million, payable upon consummation of this offering. Thereafter, the annual consulting fee will terminate. No transaction fee will be payable to CD&R under the consulting agreement as a result of this offering.
Indemnification Agreements
In connection with the closing of the Transactions, we, AIH and AII entered into separate indemnification agreements, or the “Indemnification Agreements,” with (i) CD&R and the CD&R Investor, referred to collectively as the CD&R Affiliates and (ii) with Tyco, the Tyco Seller and the Tyco Manager, referred to collectively as the Tyco Affiliates. In addition, we entered into separate indemnification agreements with each of our directors.
Under the Indemnification Agreements, we, AIH and AII, subject to specified limitations, jointly and severally agreed to indemnify the CD&R Affiliates, the Tyco Affiliates and certain of their respective affiliates against specified liabilities arising out of performance of the consulting agreement and certain other claims and liabilities. Under the indemnification agreements with our directors, we, subject to specified limitations, jointly and severally agreed to indemnify the directors against certain liabilities arising out of their service as one of our directors.
Our indemnification obligations under the Indemnification Agreements are primary to any similar rights to which any indemnitee may be entitled under any other agreement or document.
Prior to the completion of this offering, we will enter into indemnification agreements with our directors. The indemnification agreements will provide the directors with contractual rights to the indemnification and expense advancement rights. See “Description of Capital Stock—Limitations on Liability and Indemnification.”
Transactions with Other Related Parties
During fiscal 2013 and fiscal 2014, affiliates of CD&R owned up to approximately 28% and 19%, and 19% and 9% equity positions respectively, in two of our customers to which we sold an aggregate of $82.4 million and $105.7 million of products in fiscal 2013 and fiscal 2014, respectively. The CD&R affiliates began to sell down their equity positions in both of these customers during fiscal 2013 and completed their respective exits in fiscal 2015 and fiscal 2014. Management believes that sales to these customers were conducted on an arm’s-length basis at prices that an unrelated third party would pay.
In addition, during fiscal 2013 and fiscal 2014, we sold an aggregate of $5.9 million and $10.1 million of products, respectively, to Tyco and its affiliates. As a result of the sale of Tyco’s ownership interest in us on April 9, 2014, Tyco was no longer a related party after that date. See Note 3 to our audited consolidated financial statements included elsewhere in this prospectus.
130
Table of Contents
In connection with this offering, we will amend and restate our certificate of incorporation and by-laws. The following descriptions of our capital stock, amended and restated certificate of incorporation and amended and restated by-laws are intended as summaries only and are qualified in their entirety by reference to our amended and restated certificate of incorporation and amended and restated by-laws, which will become effective upon the listing of our common stock on NYSE and will be filed as exhibits to the registration statement of which this prospectus forms a part.
General
Our authorized capital stock will consist of shares of common stock, par value $0.01 per share and shares of preferred stock, par value $1.00 per share. Upon the closing of this offering, there will be shares of our common stock issued and outstanding, not including shares of our common stock issuable upon exercise of outstanding stock options.
Common Stock
Holders of common stock will be entitled:
| • | to cast one vote for each share held of record on all matters submitted to a vote of the stockholders; |
| • | to receive, on a pro rata basis, dividends and distributions, if any, that our board of directors may declare out of legally available funds, subject to preferences that may be applicable to preferred stock, if any, then outstanding; and |
| • | upon our liquidation, dissolution or winding up, to share equally and ratably in any assets remaining after the payment of all debt and other liabilities, subject to the prior rights, if any, of holders of any outstanding shares of preferred stock. |
Our ability to pay dividends on our common stock is subject to our subsidiaries’ ability to pay dividends to us, which is in turn subject to the restrictions set forth in the Credit Facilities. See “Dividend Policy.”
The holders of our common stock will not have any preemptive, cumulative voting, subscription, conversion, redemption or sinking fund rights. The common stock will not be subject to future calls or assessments by us. The rights and privileges of holders of our common stock are subject to any series of preferred stock that we may issue in the future, as described below.
Before the date of this prospectus, there has been no public market for our common stock.
As of , 2016, we had shares of common stock outstanding and holders of record of common stock. The number of shares has not yet been adjusted to reflect our anticipated stock split prior to the completion of this offering.
Preferred Stock
Under our amended and restated certificate of incorporation, our board of directors will have the authority, without further action by our stockholders, to issue up to shares of preferred stock in one or more series and to fix the powers, designations, preferences and the relative participating, optional or other special rights and qualifications, limitations and restrictions of each series, including dividend rights, dividend rates, conversion rights, voting rights, terms of redemption, liquidation preferences and the number of shares constituting any series. Upon the completion of this offering, no shares of our authorized preferred stock will be outstanding. Because the board of directors will have the power to establish the preferences and rights of the shares of any
131
Table of Contents
additional series of preferred stock, it may afford holders of any preferred stock preferences, powers and rights, including voting and dividend rights, senior to the rights of holders of our common stock, which could adversely affect the holders of the common stock and could delay, discourage or prevent a takeover of us even if a change of control of our company would be beneficial to the interests of our stockholders.
Annual Stockholders Meeting
Our amended and restated by-laws will provide that annual stockholder meetings will be held at a date, time and place, if any, as exclusively selected by our board of directors. To the extent permitted under applicable law, we may conduct meetings by remote communications, including by webcast.
Voting
The affirmative vote of a plurality of the shares of our common stock present, in person or by proxy, at the meeting and entitled to vote on the election of directors will decide the election of any directors, and the affirmative vote of a majority of the shares of our common stock present, in person or by proxy, at the meeting and entitled to vote at any annual or special meeting of stockholders will decide all other matters voted on by stockholders, unless the question is one upon which, by express provision of law, under our amended and restated certificate of incorporation, or under our amended and restated by-laws, a different vote is required, in which case such provision will control.
Anti-Takeover Effects of Our Certificate of Incorporation and By-Laws
The provisions of our amended and restated certificate of incorporation and amended and restated by-laws summarized below may have an anti-takeover effect and may delay, defer or prevent a tender offer or takeover attempt that you might consider in your best interest, including an attempt that might result in your receipt of a premium over the market price for your shares. These provisions are also designed, in part, to encourage persons seeking to acquire control of us to first negotiate with our board of directors, which could result in an improvement of their terms.
Authorized but Unissued Shares of Common Stock. Under the DGCL, our board of directors has the authority to issue the remaining shares of our authorized and unissued common stock without additional stockholder approval, subject to compliance with applicable NYSE requirements. While the additional shares are not designed to deter or prevent a change of control, under some circumstances we could use the additional shares to create voting impediments or to frustrate persons seeking to effect a takeover or otherwise gain control by, for example, issuing those shares in private placements to purchasers who might side with our board of directors in opposing a hostile takeover bid.
Authorized but Unissued Shares of Preferred Stock. Under our amended and restated certificate of incorporation, our board of directors will have the authority, without further action by our stockholders, to issue up to shares of preferred stock in one or more series and to fix the powers, designations, preferences and the relative participating, optional or other special rights and qualifications, limitations and restrictions of each series, including dividend rights, dividend rates, conversion rights, voting rights, terms of redemption, liquidation preferences and the number of shares constituting any series. The existence of authorized but unissued preferred stock could reduce our attractiveness as a target for an unsolicited takeover bid since we could, for example, issue shares of preferred stock to parties who might oppose such a takeover bid or shares that contain terms the potential acquiror may find unattractive. This may have the effect of delaying or preventing a change of control, may discourage bids for the common stock at a premium over the market price of the common stock, and may adversely affect the market price of, and the voting and other rights of the holders of, our common stock.
Classified Board of Directors. Upon the listing of our common stock, in accordance with the terms of our amended and restated certificate of incorporation, our board of directors will be divided into three classes,
132
Table of Contents
Class I, Class II and Class III, with members of each class serving staggered three-year terms. Under our amended and restated certificate of incorporation, our board of directors will consist of such number of directors as may be determined from time to time by resolution of the board of directors, but in no event may the number of directors be less than one. Any additional directorships resulting from an increase in the number of directors will be distributed among the three classes so that, as nearly as possible, each class will consist of one-third of the directors. Our amended and restated certificate of incorporation will also provide that any vacancy on our board of directors, including a vacancy resulting from an enlargement of our board of directors, may be filled only by the affirmative vote of a majority of our directors then in office, even if less than a quorum, or by a sole remaining director, subject to our stockholders agreement with respect to the director designation rights of the CD&R Investor. Any director elected to fill a vacancy will hold office until such director’s successor shall have been duly elected and qualified or until such director’s earlier death, resignation or removal. Our classified board of directors could have the effect of delaying or discouraging an acquisition of us or a change in our management.
Removal of Directors. Our amended and restated certificate of incorporation will provide that directors may be removed with or without cause at any time upon the affirmative vote of holders of at least a majority of the outstanding shares of common stock then entitled to vote at an election of directors until the CD&R Investor ceases to beneficially own at least 40% of the outstanding shares of our common stock. Thereafter, our amended and restated certificate of incorporation will provide that directors may be removed only for cause upon the affirmative vote of holders of at least a majority of the outstanding shares of common stock then entitled to vote at an election of directors.
Special Meetings of Stockholders. Our amended and restated certificate of incorporation will provide that a special meeting of stockholders may be called only by the Chairman of our board of directors or by a resolution adopted by a majority of our board of directors. Special meetings may also be called by our corporate secretary at the request of the holders of at least a majority of the outstanding shares of our common stock until the CD&R Investor ceases to beneficially own at least 40% of the outstanding shares of our common stock. Thereafter, stockholders will not be permitted to call a special meeting of stockholders.
Stockholder Advance Notice Procedure. Our amended and restated by-laws will establish an advance notice procedure for stockholders to make nominations of candidates for election as directors or to bring other business before an annual meeting of our stockholders. The amended and restated by-laws will provide that any stockholder wishing to nominate persons for election as directors at, or bring other business before, an annual meeting must deliver to our corporate secretary a written notice of the stockholder’s intention to do so. These provisions may have the effect of precluding the conduct of certain business at a meeting if the proper procedures are not followed. We expect that these provisions may also discourage or deter a potential acquirer from conducting a solicitation of proxies to elect the acquirer’s own slate of directors or otherwise attempting to obtain control of our company. To be timely, the stockholder’s notice must be delivered to our corporate secretary at our principal executive offices not less than 90 days nor more than 120 days before the first anniversary date of the annual meeting for the preceding year; provided, however, that in the event that the annual meeting is set for a date that is more than 30 days before or more than 70 days after the first anniversary date of the preceding year’s annual meeting, a stockholder’s notice must be delivered to our corporate secretary (x) not less than 90 days nor more than 120 days prior to the meeting or (y) no later than the close of business on the 10th day following the day on which a public announcement of the date of the meeting is first made by us.
No Stockholder Action by Written Consent. Our amended and restated certificate of incorporation will provide that stockholder action may be taken only at an annual meeting or special meeting of stockholders, provided that stockholder action may be taken by written consent in lieu of a meeting until the CD&R Investor ceases to beneficially own at least 40% of the outstanding shares of our common stock.
Amendments to Certificate of Incorporation and By-Laws. Our amended and restated certificate of incorporation will provide that our amended and restated certificate of incorporation may be amended by both the
133
Table of Contents
affirmative vote of a majority of our board of directors and the affirmative vote of the holders of a majority of the outstanding shares of our common stock then entitled to vote at any annual or special meeting of stockholders; provided that, at any time when the CD&R Investor beneficially owns less than 40% of the outstanding shares of our common stock, specified provisions of our amended and restated certificate of incorporation may not be amended, altered or repealed unless the amendment is approved by the affirmative vote of the holders of at least 66 2⁄3% of the outstanding shares of our common stock then entitled to vote at any annual or special meeting of stockholders, including the provisions governing:
| • | liability and indemnification of directors; |
| • | corporate opportunities; |
| • | elimination of stockholder action by written consent if the CD&R Investor ceases to beneficially own at least 40% of the outstanding shares of our common stock; |
| • | prohibition on the rights of stockholders to call a special meeting if the CD&R Investor ceases to beneficially own at least 40% of the outstanding shares of our common stock; |
| • | removal of directors for cause if the CD&R Investor ceases own at least 40% of our outstanding common stock; |
| • | classified board of directors; and |
| • | required approval of the holders of at least 66 2⁄3% of the outstanding shares of our common stock to amend our amended and restated by-laws and certain provisions of our amended and restated certificate of incorporation if the CD&R Investor ceases to beneficially own at least 40% of the outstanding shares of our common stock. |
In addition, our amended and restated by-laws may be amended, altered or repealed, or new by-laws may be adopted, by the affirmative vote of a majority of the board of directors, or by the affirmative vote of the holders of (x) as long as the CD&R Investor beneficially owns at least 40% of the outstanding shares of our common stock, at least a majority, and (y) thereafter, at least 66 2⁄3%, of the outstanding shares of our common stock then entitled to vote at any annual or special meeting of stockholders.
These provisions make it more difficult for any person to remove or amend any provisions in our amended and restated certificate of incorporation and amended and restated by-laws that may have an anti-takeover effect.
Section 203 of the Delaware General Corporation Law. In our amended and restated certificate of incorporation, we will elect not to be governed by Section 203 of the DGCL, as permitted under and pursuant to subsection (b)(3) of Section 203, until the first date on which the CD&R Investor ceases to beneficially own (directly or indirectly) at least 5% of the outstanding shares of our common stock. Section 203 prohibits a publicly held Delaware corporation from engaging in a business combination, such as a merger, with a person or group owning 15% or more of the corporation’s outstanding voting stock for a period of three years following the date the person became an interested stockholder, unless (with certain exceptions) the business combination or the transaction in which the person became an interested stockholder is approved in a prescribed manner. Accordingly, we will not be subject to any anti-takeover effects of Section 203.
Limitations on Liability and Indemnification
Our amended and restated certificate of incorporation will contain provisions permitted under DGCL relating to the liability of directors. These provisions will eliminate a director’s personal liability for monetary damages resulting from a breach of fiduciary duty, except in circumstances involving:
| • | any breach of the director’s duty of loyalty; |
| • | acts or omissions not in good faith or that involve intentional misconduct or a knowing violation of the law; |
134
Table of Contents
| • | Section 174 of the DGCL (unlawful dividends); or |
| • | any transaction from which the director derives an improper personal benefit. |
The principal effect of the limitation on liability provision is that a stockholder will be unable to prosecute an action for monetary damages against a director unless the stockholder can demonstrate a basis for liability for which indemnification is not available under the DGCL. These provisions, however, should not limit or eliminate our rights or any stockholder’s rights to seek non-monetary relief, such as an injunction or rescission, in the event of a breach of director’s fiduciary duty. These provisions will not alter a director’s liability under federal securities laws. The inclusion of this provision in our amended and restated certificate of incorporation may discourage or deter stockholders or management from bringing a lawsuit against directors for a breach of their fiduciary duties, even though such an action, if successful, might otherwise have benefited us and our stockholders. In addition, your investment may be adversely affected to the extent we pay costs of settlement and damage awards against directors and officers pursuant to these indemnification provisions.
Our amended and restated certificate of incorporation and our amended and restated by-laws will require us to indemnify and advance expenses to our directors and officers to the fullest extent not prohibited by the DGCL and other applicable law, except in the case of a proceeding instituted by the director without the approval of our board of directors. Our amended and restated certificate of incorporation and our amended and restated by-laws will provide that we are required to indemnify our directors and officers, to the fullest extent permitted by law, for all judgments, fines, settlements, legal fees and other expenses incurred in connection with pending, threatened or completed legal proceedings because of the director’s or officer’s positions with us or another entity that the director or officer serves at our request, subject to various conditions, and to advance funds to our directors and officers to enable them to defend against such proceedings. To receive indemnification, the director or officer must have been successful in the legal proceeding or have acted in good faith and in what was reasonably believed to be a lawful manner in our best interest and, with respect to any criminal proceeding, have had no reasonable cause to believe his or her conduct was unlawful.
Prior to the completion of this offering, we will enter into an indemnification agreement with each of our directors. The indemnification agreement will provide our directors with contractual rights to the indemnification and expense advancement rights provided under our amended and restated by-laws, as well as contractual rights to additional indemnification as provided in the indemnification agreement. The indemnification agreements will provide for the advancement or payment of all expenses to the indemnitee and for reimbursement to us if it is found that such indemnitee is not entitled to such indemnification under applicable law and our amended and restated certificate of incorporation and amended and restated by-laws.
Corporate Opportunities
Our amended and restated certificate of incorporation will provide that we, on our behalf and on behalf of our subsidiaries, renounce any interest or expectancy in, or in being offered an opportunity to participate in, corporate opportunities, that are from time to time presented to the CD&R Investor or any of its officers, directors, employees, agents, stockholders, members, partners, affiliates or subsidiaries (other than us and our subsidiaries), even if the opportunity is one that we or our subsidiaries might reasonably be deemed to have pursued or had the ability or desire to pursue if granted the opportunity to do so. Neither the CD&R Investor nor any of its officers, directors, employees, agents, stockholders, members, partners, affiliates or subsidiaries will generally be liable to us or any of our subsidiaries for breach of any fiduciary or other duty, as a director or otherwise, by reason of the fact that such person pursues or acquires such corporate opportunity, directs such corporate opportunity to another person or fails to present such corporate opportunity, or information regarding such corporate opportunity, to us or our subsidiaries unless, in the case of any such person who is a director or officer of Atkore, such corporate opportunity is expressly offered to such director or officer in writing solely in his or her capacity as a director or officer of Atkore. Stockholders will be deemed to have notice of and consented to this provision of our amended and restated certificate of incorporation.
135
Table of Contents
Choice of Forum
Our amended and restated certificate of incorporation will provide that, unless we consent in writing to the selection of an alternative forum, the Court of Chancery of the State of Delaware will, to the fullest extent permitted by law, be the sole and exclusive forum for (i) any derivative action or proceeding brought on our behalf, (ii) any action asserting a claim of breach of a fiduciary duty owed to us or our stockholders by any of our directors, officers, other employees, agents or stockholders, (iii) any action asserting a claim arising out of or under the DGCL or as to which the DGCL confers jurisdiction on the Court of Chancery of the State of Delaware (including, without limitation, any action asserting a claim arising out of or pursuant to our amended and restated certificate of incorporation or our amended and restated by-laws) or (iv) any action asserting a claim that is governed by the internal affairs doctrine. By becoming a stockholder in our company, you will be deemed to have notice of and have consented to the provisions of our amended and restated certificate of incorporation related to choice of forum.
Market Listing
We have been approved to list our common stock on the NYSE under the symbol “ATKR”.
Transfer Agent and Registrar
The transfer agent and registrar for our common stock will be American Stock Transfer & Trust Company, LLC.
136
Table of Contents
SHARES AVAILABLE FOR FUTURE SALE
Immediately prior to this offering, there was no public market for our common stock. Sales of substantial amounts of our common stock in the public market could adversely affect prevailing market prices of our common stock. Some shares of our common stock will not be available for sale for a certain period of time after this offering because they are subject to contractual and legal restrictions on resale, some of which are described below. Sales of substantial amounts of common stock in the public market after these restrictions lapse, or the perception that these sales could occur, could adversely affect the prevailing market price and our ability to raise equity capital in the future.
Sales of Restricted Securities
After this offering, shares of our common stock will be outstanding, assuming that the underwriters do not exercise their option to purchase additional shares. Of these shares, all of the shares sold in this offering will be freely tradable without restriction under the Securities Act, unless purchased by our “affiliates,” as that term is defined in Rule 144 under the Securities Act. The remaining shares of our common stock that will be outstanding after this offering are “restricted securities” within the meaning of Rule 144 under the Securities Act. Restricted securities may be sold in the public market only if they are registered under the Securities Act or are sold pursuant to an exemption from registration under Rule 144 or Rule 701 under the Securities Act, which are summarized below. Subject to the lock-up agreements described below, shares held by our affiliates that are not restricted securities or that have been owned for more than one year may be sold subject to compliance with Rule 144 of the Securities Act without regard to the prescribed one-year holding period under Rule 144.
Stock Options
Upon the completion of this offering, we intend to file one or more registration statements under the Securities Act to register the shares of common stock to be issued under our stock option plans and, as a result, all shares of common stock acquired upon exercise of stock options and other equity-based awards granted under these plans will, subject to a 180-day lock-up period, also be freely tradable under the Securities Act unless purchased by our affiliates. A total of shares of common stock are subject to outstanding stock options previously granted under our stock incentive plans as of 2016, and an additional shares of common stock will be available for grants of additional equity awards under stock incentive plans to be adopted prior to the completion of this offering.
Lock-up Agreements
Upon the completion of the offering, our directors and executive officers, and stockholders currently representing substantially all of the outstanding shares of our common stock, including the selling stockholder, will have signed lock-up agreements, under which they will agree not to sell, transfer or dispose of, directly or indirectly, any shares of our common stock or any securities convertible into or exercisable or exchangeable for shares of our common stock without the prior written consent of for a period of 180 days after the date of this prospectus. These agreements are described below under “Underwriting.”
Registration Rights Agreement
In connection with this offering, we will enter into a registration rights agreement with the CD&R Investor. This agreement will grant the CD&R Investor the right to require us to register shares of common stock for resale in some circumstances. See “Certain Relationships and Related Party Transactions—Registration Rights Agreement.”
137
Table of Contents
Rule 144
In general, under Rule 144, as currently in effect, a person (or persons whose shares are aggregated) who is not deemed to be or have been one of our affiliates for purposes of the Securities Act at any time during 90 days preceding a sale and who has beneficially owned the shares proposed to be sold for at least six months, including the holding period of any prior owner other than an affiliate, is entitled to sell such shares without registration, subject to compliance with the public information requirements of Rule 144. If such a person has beneficially owned the shares proposed to be sold for at least one year, including the holding period of a prior owner other than an affiliate, then such person is entitled to sell such shares without complying with any of the requirements of Rule 144.
In general, under Rule 144, as currently in effect, our affiliates or persons selling shares on behalf of our affiliates, who have met the six-month holding period for beneficial ownership of “restricted shares” of our common stock, are entitled to sell within any three-month period, a number of shares that does not exceed the greater of:
| • | 1% of the number of shares of our common stock then outstanding, which will equal approximately shares immediately after this offering; and |
| • | the average reported weekly trading volume of our common stock on the NYSE during the four calendar weeks preceding the date of filing a Notice of Proposed Sale of Securities Pursuant to Rule 144 with respect to the sale. |
Sales under Rule 144 by our affiliates or persons selling shares on behalf of our affiliates are also subject to certain manner of sale provisions and notice requirements and to the availability of current public information about us. The sale of these shares, or the perception that sales will be made, could adversely affect the price of our common stock after this offering because a great supply of shares would be, or would be perceived to be, available for sale in the public market.
Rule 701
Any of our employees, officers or directors who acquired shares under a written compensatory plan or contract may be entitled to sell them in reliance on Rule 701. Rule 701 permits affiliates to sell their Rule 701 shares under Rule 144 without complying with the holding period requirements of Rule 144. Rule 701 further provides that non-affiliates may sell these shares in reliance on Rule 144 without complying with the holding period, public information, volume limitation or notice provisions of Rule 144. However, all shares issued under Rule 701 are subject to lock-up agreements and will only become eligible for sale when the 180-day lock-up agreements expire.
138
Table of Contents
DESCRIPTION OF CERTAIN INDEBTEDNESS
ABL Credit Facility
On December 22, 2010, we entered into a credit agreement, or the “ABL Credit Agreement,” for the ABL Credit Facility with UBS AG, Stamford Branch, as administrative agent and collateral agent, Deutsche Bank AG New York Branch, as co-collateral agent, and the other financial institutions and lenders from time to time party thereto.
General
AII is the borrower under the ABL Credit Facility, and, at the option of AII, one or more wholly owned U.S. restricted subsidiaries of AII may act as a co-borrower thereunder. The ABL Credit Facility provides for an asset-based revolving credit facility in the amount of up to $325.0 million, subject to borrowing base availability, and includes letter of credit and swingline sub-facilities. Amounts are available under the ABL Credit Facility in U.S. dollars and Canadian dollars, with other permitted currencies to be agreed upon as necessary. In addition, subject to certain terms and conditions, AII is entitled to request additional asset-based revolving credit commitments under the ABL Credit Facility (including a first-in, last-out tranche) or asset-based term loans under a new term loan facility to be included in the ABL Credit Facility, which shares in the borrowing base, in an aggregate amount of up to $75 million.
The final maturity of the ABL Credit Facility is October 23, 2018. In addition, however, the ABL Credit Agreement provides the right for individual lenders to extend the maturity date of their commitments and loans upon the request of AII and without the consent of any other lender.
The “borrowing base” is defined in the ABL Credit Agreement as, at any time, the sum of (i) 85% of the eligible accounts receivable of each borrower and each guarantor; plus (ii) the lesser of (x) 80% of eligible inventory of each borrower and each guarantor (other than the parent guarantor) valued at the lower of cost (on the first-in-first-out basis) and fair market value and (y) 85% of the net orderly liquidation value of such eligible inventory; minus (iii) such availability reserves as the administrative agent, in its permitted discretion, deems appropriate at such time; minus (iv) the outstanding principal amount of any asset-based term loans under the ABL Credit Facility described above.
As of March 25, 2016, there were no outstanding borrowings under the ABL Credit Facility (excluding $17.9 million of letters of credit issued under the ABL Credit Facility), and the borrowing base was estimated to be $238.6 million. As outstanding letters of credit count as utilization of the ABL Credit Facility and reduce the amount available for borrowings, approximately $220.7 million was available under our ABL Credit Facility as of March 25, 2016.
Interest Rates and Fees
The revolving credit loans under the ABL Credit Agreement, at the option of AII, bear interest at the following rates:
| • | in the case of the U.S. dollar-denominated loans, a rate equal to (i) the rate for deposits in U.S. dollars in the London interbank market (adjusted for maximum reserves) for the applicable interest period, or “LIBOR rate,” plus an applicable margin ranging from 1.5% to 2.0%, based on available loan commitments, or (ii) the base rate, which is the highest of (x) the corporate base rate established by the administrative agent from time to time, (y) 0.5% in excess of the overnight federal funds rate and (z) the one-month LIBOR rate (adjusted for maximum reserves) plus 1.0% per annum, plus, in each case, an applicable margin ranging from 0.5% to 1.0%, based on available loan commitments; |
| • | in the case of Canadian dollar-denominated loans, the “BA rate,” defined as (i) (A) for any lender that is a “Schedule I” bank the average annual yield rate for Canadian dollar bankers’ acceptances with a duration equal to the applicable interest period that is shown on the “CDOR” page from time to time and (B) for any lender that is not a Schedule I bank, the BA rate for Schedule I banks, plus 0.10% per |
139
Table of Contents
| annum, plus an applicable margin ranging from 1.5% to 2.0% per annum, based on available loan commitments or (ii) the Canadian prime rate that is the higher of (x) the corporate base rate of interest established from time to time by such Schedule I bank selected by the administrative agent for the ABL Credit Facility as its “prime” reference rate and (y) the annual rate of interest equal to the sum of the one-month BA rate in effect on such day, plus 0.75% per annum, plus an applicable margin ranging from 0.5% to 1.0% per annum. |
“Available loan commitments” is defined in the ABL Credit Agreement as the remainder of (a) the lesser of (x) the then applicable borrowing base and (y) the then effective commitments under the ABL Credit Facility over (b) the sum of (i) all revolving credit loans (including swingline loans) and (ii) all amounts outstanding under letters of credit at such time.
The ABL Credit Facility bears a commitment fee, payable quarterly in arrears, of 0.25% per annum if the utilization of the ABL Credit Facility is greater than 50% or 0.375% per annum if such utilization is equal to or less than 50%. The ABL Credit Facility also bears customary letter of credit fees.
Prepayments
If, at any time, the aggregate amount of outstanding revolving credit loans (including letters of credit outstanding) exceeds (a) the lesser of (x) the then applicable borrowing base and (y) the then effective commitments under the ABL Credit Facility, prepayments of the revolving credit loans (and/or the cash collateralization of letters of credit) will be required in an amount equal to such excess, without commitment reduction and without penalty, but subject to customary breakage costs in the case of LIBOR and BA rate loans.
After the occurrence and during the continuance of a Dominion Event (which is defined in the ABL Credit Agreement as (a) the period from the date specified availability (as defined below) shall have been less than the greater of (A) $27.5 million and (B) 12.5% of the lesser of (x) the then applicable borrowing base and (y) the then effective commitments under the ABL Credit Facility to the date specified availability shall have been in excess of such threshold for 30 consecutive calendar days, or (b) upon the occurrence of one or more events of default, the period that such events of default shall be continuing), all amounts deposited in the core concentration account controlled by the administrative agent will be applied on daily basis to the outstanding loan balances under the ABL Credit Facility and certain other secured obligations then due and owing.
At the option of the borrower the unutilized portion of the commitments under the ABL Credit Facility may be permanently reduced and the revolving credit loans under the ABL Credit Facility may be voluntarily prepaid, in each case subject to requirements as to minimum amounts and multiples, at any time in whole or in part without premium or penalty, except that any prepayment of LIBOR and BA rate revolving credit loans other than the last day of the applicable interest period will be subject to customary breakage costs.
“Specified availability” is defined in the ABL Credit Agreement as the sum of (i) the aggregate available loan commitments (as defined above) of all lenders, plus (ii) any cash or cash equivalents against which the lenders have a security interest, plus (iii) the amount by which the borrowing base exceeds the aggregate amount of the commitments.
Guarantee; Security
All obligations under the ABL Credit Facility are guaranteed by AIH and each direct and indirect wholly owned material U.S. restricted subsidiary of AII, other than the subsidiary borrowers and certain excluded subsidiaries.
140
Table of Contents
All obligations of each borrower and each guarantor are secured by the following:
| • | a perfected security interest in all present and after-acquired accounts receivable, inventory and other current assets and all proceeds thereof, including cash, cash equivalents, deposit accounts, securities accounts, investment accounts, instruments, chattel paper, general intangibles (excluding, for the avoidance of doubt, trademarks, trade names and other intellectual property), letters of credit, insurance proceeds and investment property in each case arising from any such accounts receivable, inventory and other current assets and all books and records and related data processing software relating to, or arising from, any of the foregoing, subject to customary exceptions, which security interest is senior to the security interest in the foregoing assets securing the Term Loan Facilities, or the “ABL Priority Collateral”; and |
| • | a perfected security interest in substantially all other tangible and intangible assets of each borrower and each guarantor, including the capital stock of AII and the capital stock of each U.S. subsidiary of each borrower and each guarantor, and 65% of the capital stock of any non-U.S. subsidiary held directly by any borrower or any guarantor, subject to customary exceptions, which security interest is junior to the security interest in the foregoing assets securing the Term Loan Facilities, or the “Term Loan Priority Collateral,” and together with the ABL Priority Collateral, the “Collateral.” |
The ABL Credit Facility does not generally require the security interest in deposit accounts owned by AII and its subsidiaries to be perfected, except for certain “concentration” accounts into which cash is swept on a regular basis.
The respective rights of the ABL Credit Facility lenders and the Term Loan Facilities lenders in the ABL Priority Collateral and the Term Loan Priority Collateral are governed by an intercreditor agreement entered into by the collateral agent for the ABL Credit Facility and the collateral agents for the Term Loan Facilities.
Covenants, Representations and Warranties
The ABL Credit Facility contains customary representations and warranties and customary affirmative and negative covenants. The negative covenants are limited to the following: limitations on indebtedness, dividends and distributions, investments, acquisitions, prepayments or redemptions of subordinated indebtedness, amendments of subordinated indebtedness, transactions with affiliates, asset sales, mergers, consolidations and sales of all or substantially all assets, liens, negative pledge clauses, changes in fiscal periods, changes in line of business, changes in charter documents and hedging transactions. The negative covenants are subject to the customary exceptions and also permit the payment of dividends and distributions, investments, permitted acquisitions and payments or redemptions of subordinated indebtedness upon satisfaction of a “payment condition.” The payment condition is deemed satisfied upon specified availability and 30-day specified availability exceeding agreed upon thresholds of (i) 15.0% for dividends and distributions, (ii) 12.5% for investments and permitted acquisitions, (iii) 12.5% for redemptions of subordinated indebtedness, (iv) 12.5% for any merger or consolidation and (v) 10.0% for any asset sale and, in certain cases, the absence of a default or event of default and pro forma compliance with a fixed charge coverage ratio of 1.0 to 1.0.
There are no financial covenants included in the ABL Credit Agreement, other than a springing minimum fixed charge coverage ratio of at least 1.0 to 1.0, which will be tested only when specified availability (as defined above) is less than the greater of (A) $22.0 million and (B) 10.0% of the lesser of (x) the then applicable borrowing base and (y) the then effective commitments under the ABL Credit Facility, and continuing until such time as available loan commitments have been in excess of such threshold for a period of 30 consecutive days.
Events of Default
Events of default under the ABL Credit Agreement are limited to nonpayment of principal when due, nonpayment of interest, fees or other amounts, inaccuracy of representations or warranties in any material respect, violation of other covenants, cross-default to other material debt, certain bankruptcy or insolvency
141
Table of Contents
events, certain Employee Retirement Income Security Act of 1974, or “ERISA” events, certain material judgments, actual or asserted invalidity of material guarantees or security interests in excess of $10 million, subject to a grace period, actual or asserted invalidity of any loan document (other than the ABL Credit Agreement or any of the material guaranty or security interests), and a change of control. The change of control default under the ABL Credit Agreement is not expected to be implicated by the CD&R Investor’s sale of shares in this offering. In addition, absent an acquisition of shares by another “person” or “group” (as such terms are defined in Sections 13(d) and 14(d) of the Exchange Act) of voting shares having more than 35% of the total voting power of all outstanding shares, subsequent sales of the shares by the CD&R Investor (including a sale resulting in them no longer owning any shares) would not be expected to trigger a change of control default under the ABL Credit Agreement.
First Lien Term Loan Facility
AII is the borrower under a $420.0 million first lien term loan facility dated April 9, 2014 among AII, the lenders from time to time party thereto and Deutsche Bank AG New York Branch, as administrative agent and collateral agent, or the “First Lien Credit Agreement,” providing for the First Lien Term Loan Facility in an original principal amount of $420.0 million. The First Lien Term Loan Facility matures on April 9, 2021 and amortizes at a rate of 1.00% per annum. In addition, the First Lien Credit Agreement provides the right for individual lenders to extend the maturity date of their loans upon AII’s request and without the consent of any other lender.
Subject to certain conditions and without the consent of the then existing lenders (but subject to the receipt of commitments), the First Lien Term Loan Facility may be expanded (or a new term loan facility, revolving credit facility or letter of credit facility added) by up to (i) $125.0 million plus (ii) an additional amount as will not cause the first lien net leverage ratio, after giving effect to the incurrence of such additional amount to exceed 3.75:1.00.
As of March 25, 2016, AII had $412.2 million of outstanding loans under the First Lien Term Loan Facility.
Interest Rates and Fees
The loans under the First Lien Term Loan Facility bear interest at a rate equal to (i) LIBOR, plus 3.5%, or (ii) the base rate, which will be the highest of (x) the corporate base rate established by the administrative agent as its prime rate, (y) 0.50% in excess of the overnight federal funds rate and (z) one-month LIBOR (adjusted for maximum reserves) plus 1.00% per annum, plus, in each case, 2.5%. The loans made under the First Lien Term Loan Facility are subject to a LIBOR “floor” of 1.00%.
Prepayments
The First Lien Term Loan Facility is subject to mandatory prepayment in an amount equal to (a) 50% of excess cash flow (as defined in the First Lien Credit Agreement), with a reduction to zero based upon achievement of a specified first lien net leverage ratio, (b) 100% of the net cash proceeds received from the incurrence of indebtedness by AII or any of its restricted subsidiaries (other than indebtedness permitted under the First Lien Term Loan Facility, excluding certain specified refinancing indebtedness), and (c) 100% of the net cash proceeds of all non-ordinary course asset sales or other dispositions of property by AII and its restricted subsidiaries (including certain insurance and condemnation proceeds) in excess of $20.0 million and subject to the right of AII and its restricted subsidiaries to reinvest such proceeds within a specified period of time, and other exceptions.
Voluntary prepayments of borrowings under the First Lien Credit Facilities are permitted at any time, subject to minimum principal amount requirements, without premium or penalty, subject to customary LIBOR breakage costs.
Guarantee; Security
All obligations under the First Lien Term Loan Facility are guaranteed by AIH and each current and future direct and indirect wholly owned U.S. restricted subsidiary of AII, other than certain excluded subsidiaries.
142
Table of Contents
All obligations of each borrower and each guarantor are secured by the following:
| • | a perfected security interest in all ABL Priority Collateral, which security interest is junior to the security interest in the ABL Priority Collateral securing the ABL Credit Facility and senior to the security interest in the ABL Priority Collateral securing the Second Lien Term Loan Facility; and |
| • | a perfected security interest in substantially all Term Loan Priority Collateral, which security interest is senior to the security interest in the Term Loan Priority Collateral securing the ABL Credit Facility and the Second Lien Term Loan Facility. |
The respective rights of the First Lien Term Loan Facility lenders and the ABL Credit Facility lenders in the ABL Priority Collateral and the Term Loan Priority Collateral are governed by an intercreditor agreement entered into by the collateral agent for the ABL Credit Facility and the collateral agents for the Term Loan Facilities. The respective rights of the First Lien Term Loan Facility lenders and the Second Lien Term Loan Facility lenders in the Collateral are governed by an intercreditor agreement entered into by the collateral agent for the First Lien Term Loan Facility and the collateral agent for the Second Lien Term Loan Facility.
Covenants, Representations and Warranties
The First Lien Term Loan Facility contains customary representations and warranties and customary affirmative and negative covenants. The negative covenants include restrictions on, among others:
| • | the incurrence of additional indebtedness and liens; |
| • | dividends and other distributions or the purchase, redemption or retirement of capital stock; |
| • | the purchase, redemption or retirement of certain junior indebtedness; |
| • | loans and investments; |
| • | entering into agreements that limit AII’s or its subsidiaries’ ability to pledge assets, make distributions or loans to AII or transfer assets to AII; |
| • | asset sales; |
| • | affiliate transactions; |
| • | consolidations, mergers or sale of substantially all assets; |
| • | voluntary payments or modifications of junior indebtedness; and |
| • | alterations of the business conducted. |
The First Lien Term Loan Facility does not contain financial maintenance covenants.
Events of Default
The First Lien Term Loan Facility includes customary events of default, including events of default relating to the nonpayment of principal or interest when due, inaccuracy of representations or warranties in any material respect, violation of covenants, default under other loan document of the First Lien Term Loan Facility, cross-default to other material debt, certain bankruptcy or insolvency events, certain ERISA events, certain material judgments, actual or asserted invalidity of guarantees, certain other loan documents or liens, asserted invalidity of any intercreditor agreement and a change of control, in each case subject to customary thresholds, notice and grace period provisions. The change of control default under the First Lien Term Loan Facility is not expected to be implicated by the CD&R Investor’s sale of shares in this offering. In addition, absent an acquisition of shares by another “person” or “group” (as such terms are defined in Sections 13(d) and 14(d) of the Exchange Act) of voting shares having more than 35% of the total voting power of all outstanding shares, subsequent sales of the shares by the CD&R Investor (including a sale resulting in them no longer owning any shares) would not be expected to trigger a change of control default under the First Lien Term Loan Facility.
143
Table of Contents
Second Lien Term Loan Facility
AII is the borrower under a $250.0 million second lien term facility pursuant to the terms of a Second Lien Credit Agreement dated April 9, 2014 among AII, the lenders from time to time party thereto and Deutsche Bank AG New York Branch, as administrative agent and collateral agent, or the “Second Lien Credit Agreement,” providing for a the Second Lien Term Loan Facility in an original principal amount of $250.0 million. The Second Lien Term Loan Facility matures on October 9, 2021. There are no amortization payments under the Second Lien Term Loan Facility. In addition, the Second Lien Credit Agreement provides the right for individual lenders to extend the maturity date of their loans upon AII’s request and without the consent of any other lender.
Subject to certain conditions and without the consent of the then existing lenders (but subject to the receipt of commitments), the loans under the Second Lien Term Loan Facility may be expanded (or a new term loan facility added) by up to (i) $75.0 million plus (ii) an additional amount as will not cause the net total secured leverage ratio after giving effect to the incurrence of such additional amount to exceed 5.50:1.00.
As of March 25, 2016, AII had $229.3 million of outstanding loans under the Second Lien Term Loan Facility.
Interest Rates and Fees
The loans under the Second Lien Term Loan Facility bear interest at a rate equal to (i) LIBOR, plus 6.75%, or (ii) the base rate, which will be the highest of (x) the corporate base rate established by the administrative agent as its prime rate, (y) 0.50% in excess of the overnight federal funds rate and (z) one-month LIBOR (adjusted for maximum reserves) plus 1.00% per annum, plus, in each case, 5.75%. The loans made under the Second Lien Term Loan Facility are subject to a LIBOR “floor” of 1.00%.
Prepayments
The Second Lien Term Loan Facility is subject to mandatory prepayment in an amount equal to (a) 50% of excess cash flow (as defined in the credit agreement), with a reduction to zero based upon achievement of a specified first lien net leverage ratio, (b) 100% of the net cash proceeds received from the incurrence of indebtedness by AII or any of its restricted subsidiaries (other than indebtedness permitted under the Second Lien Term Loan Facility, excluding certain specified refinancing indebtedness), and (c) 100% of the net cash proceeds of all non-ordinary course asset sales or other dispositions of property by AII and its restricted subsidiaries (including certain insurance and condemnation proceeds) in excess of $30.0 million and subject to the right of AII and its restricted subsidiaries to reinvest such proceeds within a specified period of time, and other exceptions. Mandatory prepayments may only be made to the extent permitted under the First Lien Credit Agreement, and only with amounts that were declined by the first lien lenders under the mandatory prepayment provisions thereunder.
Voluntary prepayments of borrowings under the Second Lien Term Loan Facility are permitted at any time, subject to minimum principal amount requirements and subject to customary LIBOR breakage costs. Prepayments made after April 9, 2015 but on or prior to April 9, 2016 are subject to a prepayment premium equal to 1.0% of the amounts so prepaid. Prepayments may be made after April 9, 2016 without premium or penalty.
Guarantee; Security
All obligations under the Second Lien Term Loan Facility are guaranteed by AIH, AII’s direct parent company and each current and future direct and indirect wholly owned U.S. restricted subsidiary of AII, other than certain excluded subsidiaries.
144
Table of Contents
All obligations of each borrower and each guarantor are secured by the following:
| • | a perfected security interest in all ABL Priority Collateral, which security interest is junior to the security interest in the ABL Priority Collateral securing the ABL Credit Facility and the First Lien Term Loan Facility; and |
| • | a perfected security interest in substantially all Term Loan Priority Collateral, which security interest is senior to the security interest in the Term Loan Priority Collateral securing the ABL Credit Facility and junior to the security interest in the Term Loan Priority Collateral securing the First Lien Term Loan Facility. |
The respective rights of the Second Lien Term Loan Facility lenders and the ABL Credit Facility lenders in the ABL Priority Collateral and the Term Loan Priority Collateral are governed by an intercreditor agreement entered into by the collateral agent for the ABL Credit Facility and the collateral agent for the Term Loan Facilities. The respective rights of the Second Lien Term Loan Facility lenders and the First Lien Term Loan Facility lenders in the Collateral are governed by an intercreditor agreement entered into by the collateral agent for the First Lien Term Loan Facility and the collateral agent for the Second Lien Term Loan Facility.
Covenants, Representations and Warranties
The Second Lien Term Loan Facility contains customary representations and warranties and customary affirmative and negative covenants that are substantially similar to the covenants applicable to the First Lien Credit Facilities. The negative covenants include restrictions on, among others:
| • | the incurrence of additional indebtedness and liens; |
| • | dividends and other distributions or the purchase, redemption or retirement of capital stock; |
| • | the purchase, redemption or retirement of certain junior indebtedness; |
| • | loans and investments; |
| • | entering into agreements that limit AII’s or its subsidiaries’ ability to pledge assets, make distributions or loans to AII or transfer assets to AII; |
| • | asset sales; |
| • | affiliate transactions; |
| • | consolidations, mergers or sale of substantially all assets; |
| • | voluntary payments or modifications of junior indebtedness; and |
| • | alterations of the business conducted. |
The Second Lien Term Loan Facility does not contain financial maintenance covenants.
Events of Default
The Second Lien Term Loan Facility includes customary events of default, including events of default relating to the nonpayment of principal or interest when due, inaccuracy of representations or warranties in any material respect, violation of covenants, default under other loan document of the Second Lien Term Loan Facility, cross payment default and cross acceleration to other material debt, certain bankruptcy or insolvency events, certain ERISA events, certain material judgments, actual or asserted invalidity of guarantees, certain other loan documents or liens, asserted invalidity of any intercreditor agreement and a change of control, in each case subject to customary thresholds, notice and grace period provisions. The change of control default under the Second Lien Term Loan Facility is not expected to be implicated by the CD&R Investor’s sale of shares in this offering. In addition, absent an acquisition of shares by another “person” or “group” (as such terms are defined in Sections 13(d) and 14(d) of the Exchange Act) of voting shares having more than 35% of the total voting power of all outstanding shares, subsequent sales of the shares by the CD&R Investor (including a sale resulting in them no longer owning any shares) would not be expected to trigger a change of control default under the Second Lien Term Loan Facility.
145
Table of Contents
U.S. FEDERAL INCOME TAX CONSIDERATIONS FOR NON-U.S. HOLDERS
The following is a discussion of certain U.S. federal income tax considerations relating to the purchase, ownership and disposition of our common stock by Non-U.S. Holders (as defined below) that purchase our common stock pursuant to this offering and hold such common stock as a capital asset. This discussion is based on the Code, U.S. Treasury regulations promulgated or proposed thereunder, and administrative and judicial interpretations thereof, all as in effect on the date hereof and all of which are subject to change, possibly with retroactive effect, or to different interpretation. This discussion does not address all of the U.S. federal income tax considerations that may be relevant to specific Non-U.S. Holders in light of their particular circumstances or to Non-U.S. Holders subject to special treatment under U.S. federal income tax law (such as banks, insurance companies, dealers in securities or other Non-U.S. Holders that generally mark their securities to market for U.S. federal income tax purposes, foreign governments, international organizations, tax-exempt entities, certain former citizens or residents of the United States, or Non-U.S. Holders that hold our common stock as part of a straddle, hedge, conversion or other integrated transaction). This discussion does not address any U.S. state or local or non-U.S. tax considerations or any U.S. federal gift or alternative minimum tax considerations.
As used in this discussion, the term “Non-U.S. Holder” means a beneficial owner of our common stock that, for U.S. federal income tax purposes, is:
| • | an individual who is neither a citizen nor a resident of the United States; |
| • | a corporation that is not created or organized in or under the laws of the United States, any state thereof or the District of Columbia; |
| • | an estate that is not subject to U.S. federal income tax on income from non-U.S. sources that is not effectively connected with the conduct of a trade or business in the United States; or |
| • | a trust unless (i) a court within the United States is able to exercise primary supervision over its administration and one or more U.S. persons have the authority to control all of its substantial decisions or (ii) it has in effect a valid election under applicable U.S. Treasury regulations to be treated as a U.S. person. |
If an entity treated as a partnership for U.S. federal income tax purposes invests in our common stock, the U.S. federal income tax considerations relating to such investment will depend in part upon the status and activities of such entity and the particular partner. Any such entity should consult its own tax advisor regarding the U.S. federal income tax considerations applicable to it and its partners relating to the purchase, ownership and disposition of our common stock.
PERSONS CONSIDERING AN INVESTMENT IN OUR COMMON STOCK SHOULD CONSULT THEIR OWN TAX ADVISORS REGARDING THE U.S. FEDERAL, STATE AND LOCAL AND NON-U.S. INCOME, ESTATE AND OTHER TAX CONSIDERATIONS RELATING TO THE PURCHASE, OWNERSHIP AND DISPOSITION OF OUR COMMON STOCK IN LIGHT OF THEIR PARTICULAR CIRCUMSTANCES.
Distributions on Common Stock
If we make a distribution of cash or other property (other than certain pro rata distributions of our common stock or rights to acquire our common stock) with respect to a share of our common stock, the distribution generally will be treated as a dividend to the extent it is paid from our current or accumulated earnings and profits (as determined under U.S. federal income tax principles). If the amount of such distribution exceeds our current and accumulated earnings and profits, such excess generally will be treated first as a tax-free return of capital to the extent of the Non-U.S. Holder’s adjusted tax basis in such share of our common stock, and then as capital gain (which will be treated in the manner described below under “—Sale, Exchange or Other Disposition
146
Table of Contents
of Common Stock”). Distributions treated as dividends on our common stock that are paid to or for the account of a Non-U.S. Holder generally will be subject to U.S. federal withholding tax at a rate of 30%, or at a lower rate if provided by an applicable tax treaty and the Non-U.S. Holder provides the documentation (generally, Internal Revenue Service, or “IRS,” Form W-8BEN or W-8BEN-E) required to claim benefits under such tax treaty to the applicable withholding agent. Even if our current or accumulated earnings and profits are less than the amount of the distribution, the applicable withholding agent may elect to treat the entire distribution as a dividend for U.S. federal withholding tax purposes. Each Non-U.S. Holder should consult its own tax advisor regarding U.S. federal withholding tax on distributions, including such Non-U.S. Holder’s eligibility for a lower rate and the availability of a refund of any excess U.S. federal tax withheld.
If, however, a dividend is effectively connected with the conduct of a trade or business in the United States by a Non-U.S. Holder, such dividend generally will not be subject to the 30% U.S. federal withholding tax if such Non-U.S. Holder provides the appropriate documentation (generally, IRS Form W-8ECI) to the applicable withholding agent. Instead, such Non-U.S. Holder generally will be subject to U.S. federal income tax on such dividend in substantially the same manner as a U.S. person (except as provided by an applicable tax treaty). In addition, a Non-U.S. Holder that is treated as a corporation for U.S. federal income tax purposes may be subject to a branch profits tax at a rate of 30% (or a lower rate if provided by an applicable tax treaty) on its effectively connected income for the taxable year, subject to certain adjustments.
The foregoing discussion is subject to the discussion below under “—FATCA Withholding” and “—Information Reporting and Backup Withholding.”
Sale, Exchange or Other Disposition of Common Stock
A Non-U.S. Holder generally will not be subject to U.S. federal income tax on any gain recognized on the sale, exchange or other disposition of our common stock unless:
| (i) | such gain is effectively connected with the conduct of a trade or business in the United States by such Non-U.S. Holder, in which event such Non-U.S. Holder generally will be subject to U.S. federal income tax on such gain in substantially the same manner as a U.S. person (except as provided by an applicable tax treaty) and, if it is treated as a corporation for U.S. federal income tax purposes, may also be subject to a branch profits tax at a rate of 30% (or a lower rate if provided by an applicable tax treaty), subject to certain adjustments; |
| (ii) | such Non-U.S. Holder is an individual who is present in the United States for 183 days or more during the taxable year of such sale, exchange or other disposition and certain other conditions are met, in which event such gain (net of certain U.S. source losses) generally will be subject to U.S. federal income tax at a rate of 30% (except as provided by an applicable tax treaty); or |
| (iii) | we are or have been a “United States real property holding corporation” for U.S. federal income tax purposes at any time during the shorter of (x) the five-year period ending on the date of such sale, exchange or other disposition and (y) such Non-U.S. Holder’s holding period with respect to such common stock, and certain other conditions are met. |
Generally, a corporation is a “United States real property holding corporation” if the fair market value of its United States real property interests equals or exceeds 50% of the sum of the fair market value of its worldwide real property interests and its other assets used or held for use in a trade or business (all as determined for U.S. federal income tax purposes). We believe that we presently are not, and we do not presently anticipate that we will become, a United States real property holding corporation. However, because this determination is made from time to time and is dependent upon a number of factors, some of which are beyond our control, including the value of our assets, there can be no assurance that we will not become a United States real property holding corporation. If we were a United States real property holding corporation during the period described in clause (iii) above, gain recognized by a Non-U.S. Holder generally would be treated as income effectively connected
147
Table of Contents
with the conduct of a trade or business in the United States by such Non-U.S. Holder, with the consequences described in clause (i) above (except that the branch profits tax would not apply), unless such Non-U.S. Holder owned (directly and constructively) five percent or less of our common stock during such period and our common stock is treated as “regularly traded on an established securities market” at any time during the calendar year of such sale, exchange or other disposition.
The foregoing discussion is subject to the discussion below under “—FATCA Withholding” and “—Information Reporting and Backup Withholding.”
FATCA Withholding
Under the Foreign Account Tax Compliance Act provisions of the Code and related U.S. Treasury guidance, or “FATCA,” a withholding tax of 30% will be imposed in certain circumstances on payments of (i) dividends on our common stock and (ii) on or after January 1, 2019, gross proceeds from the sale or other disposition of our common stock. In the case of payments made to a “foreign financial institution” (such as a bank, a broker, an investment fund or, in certain cases, a holding company), as a beneficial owner or as an intermediary, this tax generally will be imposed, subject to certain exceptions, unless such institution (i) has agreed to (and does) comply with the requirements of an agreement with the United States, or an “FFI Agreement,” or (ii) is required by (and does comply with) applicable foreign law enacted in connection with an intergovernmental agreement between the United States and a foreign jurisdiction, or an “IGA,” in either case to, among other things, collect and provide to the U.S. tax authorities or other relevant tax authorities certain information regarding U.S. account holders of such institution and, in either case, such institution provides the withholding agent with a certification as to its FATCA status. In the case of payments made to a foreign entity that is not a financial institution (as a beneficial owner), the tax generally will be imposed, subject to certain exceptions, unless such entity provides the withholding agent with a certification as to its FATCA status and, in certain cases, identifies any “substantial” U.S. owner (generally, any specified U.S. person that directly or indirectly owns more than a specified percentage of such entity). If our common stock is held through a foreign financial institution that has agreed to comply with the requirements of an FFI Agreement or is subject to similar requirements under applicable foreign law enacted in connection with an IGA, such foreign financial institution (or, in certain cases, a person paying amounts to such foreign financial institution) generally will be required, subject to certain exceptions, to withhold tax on payments made to (i) a person (including an individual) that fails to provide any required information or documentation or (ii) a foreign financial institution that has not agreed to comply with the requirements of an FFI Agreement and is not subject to similar requirements under applicable foreign law enacted in connection with an IGA. Each Non-U.S. Holder should consult its own tax advisor regarding the application of FATCA to the ownership and disposition of our common stock.
Information Reporting and Backup Withholding
Amounts treated as payments of dividends on our common stock paid to a Non-U.S. Holder and the amount of any U.S. federal tax withheld from such payments generally must be reported annually to the IRS and to such Non-U.S. Holder by the applicable withholding agent.
The information reporting and backup withholding rules that apply to payments of dividends to certain U.S. persons generally will not apply to payments of dividends on our common stock to a Non-U.S. Holder if such Non-U.S. Holder certifies under penalties of perjury that it is not a U.S. person (generally by providing an IRS Form W-8BEN or W-8BEN-E to the applicable withholding agent) or otherwise establishes an exemption.
Proceeds from the sale, exchange or other disposition of our common stock by a Non-U.S. Holder effected outside the United States through a non-U.S. office of a non-U.S. broker generally will not be subject to the information reporting and backup withholding rules that apply to payments to certain U.S. persons, provided that the proceeds are paid to the Non-U.S. Holder outside the United States. However, proceeds from the sale, exchange or other disposition of our common stock by a Non-U.S. Holder effected through a non-U.S. office of a
148
Table of Contents
non-U.S. broker with certain specified U.S. connections or a U.S. broker generally will be subject to these information reporting rules (but generally not to these backup withholding rules), even if the proceeds are paid to such Non-U.S. Holder outside the United States, unless such Non-U.S. Holder certifies under penalties of perjury that it is not a U.S. person (generally by providing an IRS Form W-8BEN or W-8BEN-E to the applicable withholding agent) or otherwise establishes an exemption. Proceeds from the sale, exchange or other disposition of our common stock by a Non-U.S. Holder effected through a U.S. office of a broker generally will be subject to these information reporting and backup withholding rules unless such Non-U.S. Holder certifies under penalties of perjury that it is not a U.S. person (generally by providing an IRS Form W-8BEN or W-8BEN-E to the applicable withholding agent) or otherwise establishes an exemption.
Backup withholding is not an additional tax. Any amounts withheld under the backup withholding rules generally will be allowed as a refund or a credit against a Non-U.S. Holder’s U.S. federal income tax liability if the required information is furnished by such Non-U.S. Holder on a timely basis to the IRS.
U.S. Federal Estate Tax
Shares of our common stock owned or treated as owned by an individual Non-U.S. Holder at the time of such Non-U.S. Holder’s death will be included in such Non-U.S. Holder’s gross estate for U.S. federal estate tax purposes and may be subject to U.S. federal estate tax unless an applicable estate tax treaty provides otherwise.
149
Table of Contents
Credit Suisse Securities (USA) LLC, Deutsche Bank Securities Inc. and J.P. Morgan Securities LLC are acting as representatives of each of the underwriters named below. Subject to the terms and conditions of the underwriting agreement, the underwriters named below have severally agreed to purchase from the selling stockholder the following respective number of shares of common stock at a public offering price less the underwriting discounts and commissions set forth on the cover page of this prospectus:
| Underwriter |
Number of Shares | |
| Credit Suisse Securities (USA) LLC |
||
| Deutsche Bank Securities Inc. |
||
| J.P. Morgan Securities LLC |
||
| UBS Securities LLC |
||
| Citigroup Global Markets Inc. |
||
| RBC Capital Markets, LLC |
||
| Wells Fargo Securities, LLC |
||
|
| ||
| Total |
||
|
|
The underwriting agreement provides that the underwriters’ obligation to purchase shares of common stock depends on the satisfaction of the conditions contained in the underwriting agreement including:
| • | the obligation to purchase all of the shares of common stock offered hereby (other than those shares of common stock covered by their option to purchase additional shares as described below), if any of the shares are purchased; |
| • | the representations and warranties made by us and the selling stockholder to the underwriters are true; |
| • | there is no material change in our business or the financial markets; and |
| • | customary closing documents are delivered to the underwriters. |
The offering of the shares by the underwriters is subject to receipt and acceptance and subject to the underwriters’ right to reject any order in whole or in part.
Commissions and Expenses
The following table summarizes the underwriting discounts and commissions the selling stockholder will pay to the underwriters. These amounts are shown assuming both no exercise and full exercise of the underwriters’ option to purchase additional shares of common stock from the selling stockholder. The underwriting fee is the difference between the initial offering price to the public and the amount the underwriters pay the selling stockholder for the shares of common stock.
| Total Fees | ||||||||||||
| Per Share | Without Exercise of Option to Purchase Additional Shares |
With Full Exercise of Option to Purchase Additional Shares |
||||||||||
| Discounts and commissions paid by the selling stockholder |
$ | $ | $ | |||||||||
The representatives of the underwriters have advised us and the selling stockholder that the underwriters propose to offer the shares of common stock directly to the public at the public offering price on the cover of this prospectus and to selected dealers, which may include the underwriters, at such offering price less a selling concession not in excess of $ per share. After the offering, the representatives may change the offering price and other selling terms.
150
Table of Contents
The expenses of the offering that are payable by us are estimated to be approximately $ million (excluding underwriting discounts and commissions), including up to $ in connection with the qualification of the offering with the Financial Industry Regulatory Authority, or “FINRA,” and “blue sky” expenses by counsel to the underwriters.
The underwriters have agreed to reimburse us in an amount of $ for certain financial consulting services in connection with the offering.
Option to Purchase Additional Shares
The selling stockholder has granted the underwriters an option exercisable for 30 days after the date of this prospectus, to purchase, from time to time, in whole or in part, up to an aggregate of shares from the selling stockholder at the public offering price less underwriting discounts and commissions. To the extent the underwriters exercise this option, each underwriter will be committed, so long as the conditions of the underwriting agreement are satisfied, to purchase a number of additional shares of common stock proportionate to that underwriter’s initial commitment as indicated in the preceding table, and the selling stockholder will be obligated to sell the additional shares of common stock to the underwriters.
No Sales of Similar Securities
We, the selling stockholder and our directors, executive officers and stockholders representing substantially all of our outstanding common stock have agreed with the underwriters, subject to certain exceptions, not to dispose of or hedge any common stock or securities convertible into or exchangeable for shares of common stock during the period from the date of this prospectus continuing through the date 180 days after the date of this prospectus, except with the prior written consent of . See “Shares Available for Future Sale” for a discussion of certain transfer restrictions.
Offering Price Determination
Prior to this offering, there has been no public market for our common stock. The initial public offering price was negotiated among us, the selling stockholder and the representatives. In determining the initial public offering price of our common stock, the representatives considered:
| • | the history and prospects for the industry in which we compete; |
| • | our financial information; |
| • | the ability of our management, present stage of development and our business potential and earning prospects; |
| • | the prevailing securities markets at the time of this offering; and |
| • | the recent market prices of, and the demand for, publicly traded shares of generally comparable companies. |
Indemnification
We and the selling stockholder have agreed to indemnify the several underwriters against certain liabilities, including liabilities under the Securities Act, liabilities arising from breaches of the representations and warranties contained in the underwriting agreement and to contribute to payments that the underwriters may be required to make for these liabilities.
151
Table of Contents
Stabilization, Short Positions and Penalty Bids
The underwriters may engage in stabilizing transactions, short sales and purchases to cover positions created by short sales, and penalty bids or purchases for the purpose of pegging, fixing or maintaining the price of our common stock, in accordance with Regulation M under the Exchange Act.
| • | Stabilizing transactions permit bids to purchase the underlying security so long as the stabilizing bids do not exceed a specified maximum. |
| • | A short position involves a sale by the underwriters of shares in excess of the number of shares the underwriters are obligated to purchase in the offering, which creates the syndicate short position. This short position may be either a covered short position or a naked short position. In a covered short position, the number of shares involved in the sales made by the underwriters in excess of the number of shares they are obligated to purchase is not greater than the number of shares that they may purchase by exercising their option to purchase additional shares. In a naked short position, the number of shares involved is greater than the number of shares in their option to purchase additional shares. The underwriters may close out any short position by either exercising their option to purchase additional shares, in whole or in part, and/or purchasing shares in the open market. In determining the source of shares to close out the short position, the underwriters will consider, among other things, the price of shares available for purchase in the open market as compared to the price at which they may purchase shares through their option to purchase additional shares. A naked short position is more likely to be created if the underwriters are concerned that there could be downward pressure on the price of the shares in the open market after pricing that could adversely affect investors who purchase in the offering. |
| • | Syndicate covering transactions involve purchases of our common stock in the open market after the distribution has been completed to cover syndicate short positions. |
| • | Penalty bids permit the representatives to reclaim a selling concession from a syndicate member when the common stock originally sold by the syndicate member is purchased in a stabilizing or syndicate covering transaction to cover syndicate short positions. |
These stabilizing transactions, syndicate covering transactions and penalty bids may have the effect of raising or maintaining the market price of our common stock or preventing or retarding a decline in the market price of our common stock. As a result, the price of our common stock may be higher than the price that might otherwise exist in the open market. These transactions may be effected otherwise and, if commenced, may be discontinued at any time.
Neither we nor any of the underwriters make any representation or prediction as to the direction or magnitude of any effect that the transactions described above may have on the price of our common stock. In addition, neither we nor any of the underwriters make any representation that the underwriters will engage in these stabilizing transactions or that any transaction, once commenced, will not be discontinued without notice.
Electronic Distribution
In connection with the offering, certain of the underwriters or securities dealers may distribute prospectuses by electronic means, such as e-mail. In addition, certain of the underwriters may facilitate Internet distribution for this offering to certain of its Internet subscription customers. Such underwriters may allocate a limited number of shares for sale to its online brokerage customers. A prospectus in electronic format is being made available on Internet websites maintained by one or more of the bookrunners of this offering and may be made available on websites maintained by other underwriters. Other than the prospectus in electronic format, the information on any underwriter’s website and any information contained in any other website maintained by an underwriter is not part of the prospectus or the registration statement of which the prospectus forms a part.
Listing
We have been approved to list our shares of common stock on the NYSE under the symbol “ATKR”.
152
Table of Contents
Discretionary Sales
The underwriters have informed us that they do not intend to confirm sales to discretionary accounts that exceed 5% of the total number of shares offered by them.
Stamp Taxes
Purchasers of the shares of our common stock offered in this prospectus may be required to pay stamp taxes and other charges under the laws and practices of the country of purchase, in addition to the offering price listed on the cover page of this prospectus. Accordingly, we urge you to consult a tax advisor with respect to whether you may be required to pay those taxes or charges, as well as any other tax consequences that may arise under the laws of the country of purchase.
Relationships
The underwriters and their respective affiliates are full service financial institutions engaged in various activities, which may include securities trading, commercial and investment banking, financial advisory, investment management, investment research, principal investment, hedging, financing and brokerage activities. Certain of the underwriters and their respective affiliates have, from time to time, performed, and may in the future perform, various financial advisory and investment banking services for us, for which they may receive customary fees and expenses. With respect to our ABL Credit Facility, affiliates of (i) UBS Securities LLC serve as the administrative agent, collateral agent, issuing lender, swingline lender and lender; (ii) Deutsche Bank Securities Inc. serve as the co-collateral agent, syndication agent and lender; and (iii) Credit Suisse Securities (USA) LLC serve as the documentation agent and lender. In addition, with respect to each of our First Lien Term Loan Facility and Second Lien Term Loan Facility, affiliates of (i) Deutsche Bank Securities Inc. serve as the administrative agent, collateral agent, joint lead arranger, joint bookrunner and lender; (ii) UBS Securities LLC serve as the syndication agent, joint lead arranger and joint bookrunner; (iii) Credit Suisse Securities (USA) LLC serve as the documentation agent, joint lead arranger and joint bookrunner; (iv) J.P. Morgan Securities LLC serve as the joint lead arranger and joint bookrunner; and (v) Wells Fargo Securities LLC serve as the joint lead arranger and joint bookrunner.
In addition, in the ordinary course of business, the underwriters and their respective affiliates may make or hold a broad array of investments including serving as counterparties to certain derivative and hedging arrangements and actively trade debt and equity securities (or related derivative securities) and financial instruments (including bank loans) for their own account and for the accounts of their customers, and such investment and securities activities may involve securities and/or instruments of the issuer. The underwriters and their respective affiliates may also make investment recommendations and/or publish or express independent research views in respect of such securities or instruments and may at any time hold, or recommend to clients that they acquire, long and/or short positions in such securities and instruments.
Selling Restrictions
Notice to Prospective Investors in the European Economic Area
In relation to each Member State of the European Economic Area that has implemented the Prospectus Directive, each, a Relevant Member State, with effect from and including the date on which the Prospectus Directive is implemented in that Relevant Member State, no offer of shares may be made to the public in that Relevant Member State other than:
| A. | to any legal entity which is a qualified investor as defined in the Prospectus Directive; |
| B. | to fewer than 100 or, if the Relevant Member State has implemented the relevant provision of the 2010 PD Amending Directive, 150, natural or legal persons (other than qualified investors as defined in the Prospectus Directive), as permitted under the Prospectus Directive, subject to obtaining the prior consent of the representatives; or |
153
Table of Contents
| C. | in any other circumstances falling within Article 3(2) of the Prospectus Directive, provided that no such offer of shares shall require the Company or the representatives to publish a prospectus pursuant to Article 3 of the Prospectus Directive or supplement a prospectus pursuant to Article 16 of the Prospectus Directive. |
Each person in a Relevant Member State (other than a Relevant Member State where there is a Permitted Public Offer) who initially acquires any shares or to whom any offer is made will be deemed to have represented, acknowledged and agreed that (A) it is a “qualified investor” within the meaning of the law in that Relevant Member State implementing Article 2(1)(e) of the Prospectus Directive and (B) in the case of any shares acquired by it as a financial intermediary, as that term is used in Article 3(2) of the Prospectus Directive, the shares acquired by it in the offering have not been acquired on behalf of, nor have they been acquired with a view to their offer or resale to, persons in any Relevant Member State other than “qualified investors” as defined in the Prospectus Directive, or in circumstances in which the prior consent of the Subscribers has been given to the offer or resale. In the case of any shares being offered to a financial intermediary as that term is used in Article 3(2) of the Prospectus Directive, each such financial intermediary will be deemed to have represented, acknowledged and agreed that the shares acquired by it in the offer have not been acquired on a nondiscretionary basis on behalf of, nor have they been acquired with a view to their offer or resale to, persons in circumstances that may give rise to an offer of any shares to the public other than their offer or resale in a Relevant Member State to qualified investors as so defined or in circumstances in which the prior consent of the representatives has been obtained to each such proposed offer or resale.
The Company, the representatives and their affiliates will rely upon the truth and accuracy of the foregoing representation, acknowledgement and agreement.
This prospectus has been prepared on the basis that any offer of shares in any Relevant Member State will be made pursuant to an exemption under the Prospectus Directive from the requirement to publish a prospectus for offers of shares. Accordingly any person making or intending to make an offer in that Relevant Member State of shares that are the subject of the offering contemplated in this prospectus may only do so in circumstances in which no obligation arises for the Company or any of the underwriters to publish a prospectus pursuant to Article 3 of the Prospectus Directive in relation to such offer. Neither the Company nor the underwriters have authorized, nor do they authorize, the making of any offer of shares in circumstances in which an obligation arises for the Company or the underwriters to publish a prospectus for such offer.
For the purpose of the above provisions, the expression “an offer to the public” in relation to any shares in any Relevant Member State means the communication in any form and by any means of sufficient information on the terms of the offer and the shares to be offered so as to enable an investor to decide to purchase or subscribe the shares, as the same may be varied in the Relevant Member State by any measure implementing the Prospectus Directive in the Relevant Member State and the expression “Prospectus Directive” means Directive 2003/71/EC (including the 2010 PD Amending Directive, to the extent implemented in the Relevant Member States) and includes any relevant implementing measure in the Relevant Member State and the expression “2010 PD Amending Directive” means Directive 2010/73/EU.
Notice to Prospective Investors in the United Kingdom
Each underwriter agrees that:
| (a) | it has only communicated or caused to be communicated and will only communicate or cause to be communicated an invitation or inducement to engage in investment activity (within the meaning of Section 21 of the Financial Services and Markets Act 2000, or “FSMA,” received by it in connection with the issue or sale of the shares in circumstances in which Section 21(1) of the FSMA does not apply to the Company; and |
| (b) | it has complied and will comply with all applicable provisions of the FSMA with respect to anything done by it in relation to the shares in, from or otherwise involving the United Kingdom. |
154
Table of Contents
Notice to Prospective Investors in Hong Kong
The shares may not be offered or sold by means of any document other than (i) in circumstances which do not constitute an offer to the public within the meaning of the Companies Ordinance (Cap.32, Laws of Hong Kong), or (ii) to “professional investors” within the meaning of the Securities and Futures Ordinance (Cap.571, Laws of Hong Kong) and any rules made thereunder, or (iii) in other circumstances that do not result in the document being a “prospectus” within the meaning of the Companies Ordinance (Cap.32, Laws of Hong Kong), and no advertisement, invitation or document relating to the shares may be issued or may be in the possession of any person for the purpose of issue (in each case whether in Hong Kong or elsewhere), that is directed at, or the contents of which are likely to be accessed or read by, the public in Hong Kong (except if permitted to do so under the laws of Hong Kong) other than with respect to shares that are or are intended to be disposed of only to persons outside Hong Kong or only to “professional investors” within the meaning of the Securities and Futures Ordinance (Cap. 571, Laws of Hong Kong) and any rules made thereunder.
Notice to Prospective Investors in Singapore
This prospectus has not been registered as a prospectus with the Monetary Authority of Singapore. Accordingly, this prospectus and any other document or material in connection with the offer or sale, or invitation for subscription or purchase, of the shares may not be circulated or distributed, nor may the shares be offered or sold, or be made the subject of an invitation for subscription or purchase, whether directly or indirectly, to persons in Singapore other than (i) to an institutional investor under Section 274 of the Securities and Futures Act, Chapter 289 of Singapore, or the SFA, (ii) to a relevant person, or any person pursuant to Section 275(1A), and in accordance with the conditions, specified in Section 275 of the SFA or (iii) otherwise pursuant to, and in accordance with the conditions of, any other applicable provision of the SFA.
Where the shares are subscribed or purchased under Section 275 by a relevant person that is: (a) a corporation (that is not an accredited investor) the sole business of which is to hold investments and the entire share capital of which is owned by one or more individuals, each of whom is an accredited investor; or (b) a trust (where the trustee is not an accredited investor) whose sole purpose is to hold investments and each beneficiary is an accredited investor, shares, debentures and units of shares and debentures of that corporation or the beneficiaries’ rights and interest in that trust shall not be transferable for six months after that corporation or that trust has acquired the shares under Section 275 except: (1) to an institutional investor under Section 274 of the SFA or to a relevant person, or any person pursuant to Section 275(1A), and in accordance with the conditions, specified in Section 275 of the SFA; (2) where no consideration is given for the transfer; or (3) by operation of law.
Notice to Prospective Investors in Japan
The securities have not been and will not be registered under the Financial Instruments and Exchange Law of Japan, or the Financial Instruments and Exchange Law, and each Underwriter has agreed that it will not offer or sell any securities, directly or indirectly, in Japan or to, or for the benefit of, any resident of Japan (which term as used herein means any person resident in Japan, including any corporation or other entity organized under the laws of Japan), or to others for re-offering or resale, directly or indirectly, in Japan or to a resident of Japan, except pursuant to an exemption from the registration requirements of, and otherwise in compliance with, the Financial Instruments and Exchange Law and any other applicable laws, regulations and ministerial guidelines of Japan.
Notice to Prospective Investors in Australia
No placement document, prospectus, product disclosure statement or other disclosure document has been lodged with the Australian Securities and Investments Commission in relation to the offering. This prospectus does not constitute a prospectus, product disclosure statement or other disclosure document under the
155
Table of Contents
Corporations Act 2001, or the Corporations Act, and does not purport to include the information required for a prospectus, product disclosure statement or other disclosure document under the Corporations Act.
Any offer in Australia of the shares may only be made to persons, or the “Exempt Investors,” who are “sophisticated investors” (within the meaning of section 708(8) of the Corporations Act), “professional investors” (within the meaning of section 708(11) of the Corporations Act), or otherwise pursuant to one or more exemptions contained in section 708 of the Corporations Act so that it is lawful to offer the shares without disclosure to investors under Chapter 6D of the Corporations Act.
The shares applied for by Exempt Investors in Australia must not be offered for sale in Australia in the period of 12 months after the date of allotment under the offering, except in circumstances where disclosure to investors under Chapter 6D of the Corporations Act would not be required pursuant to an exemption under section 708 of the Corporations Act or otherwise or where the offer is pursuant to a disclosure document that complies with Chapter 6D of the Corporations Act. Any person acquiring shares must observe such Australian on-sale restrictions.
This prospectus contains general information only and does not take account of the investment objectives, financial situation or particular needs of any particular person. It does not contain any securities recommendations or financial product advice. Before making an investment decision, investors need to consider whether the information in this prospectus is appropriate to their needs, objectives and circumstances, and, if necessary, seek expert advice on those matters.
Notice to Prospective Investors in the Dubai International Financial Centre
This prospectus relates to an Exempt Offer in accordance with the Offered Securities Rules of the Dubai Financial Services Authority, or the “DFSA.” This prospectus is intended for distribution only to persons of a type specified in the Offered Securities Rules of the DFSA. It must not be delivered to, or relied on by, any other person. The DFSA has no responsibility for reviewing or verifying any documents in connection with Exempt Offers. The DFSA has not approved this prospectus nor taken steps to verify the information set forth herein and has no responsibility for the prospectus. The shares to which this prospectus relates may be illiquid and/or subject to restrictions on their resale. Prospective purchasers of the shares offered should conduct their own due diligence on the shares. If you do not understand the contents of this prospectus, you should consult an authorized financial advisor.
State of Qatar
This prospectus is not intended to constitute an offer, sale or delivery of shares or other securities under the laws of the State of Qatar including the rules and regulations of Qatar Financial Centre Authority, or the “QFCA” or the Qatar Financial Centre Regulatory Authority, or the “QFCRA.” The securities have not been and will not be listed on the Qatar Exchange and are not subject to the rules and regulations of the DSM Internal Regulations applying to the Qatar Exchange, the Qatar Financial Markets Authority, the Qatar Central Bank, the QFCA or the QFCRA, or any laws of the State of Qatar. This prospectus is not for general circulation in the State of Qatar and may not be reproduced or used for any other purpose.
Notice to Prospective Investors in Switzerland
We have not and will not register with the Swiss Financial Market Supervisory Authority, or the “FINMA,” as a foreign collective investment scheme pursuant to Article 119 of the Federal Act on Collective Investment Scheme of 23 June 2006, as amended, or the “CISA,” and accordingly the securities being offered pursuant to this prospectus have not and will not be approved, and may not be licensable, with FINMA. Therefore, the securities have not been authorized for distribution by FINMA as a foreign collective investment scheme pursuant to Article 119 CISA and the securities offered hereby may not be offered to the public, as this term is
156
Table of Contents
defined in Article 3 CISA, in or from Switzerland. The securities may solely be offered to “qualified investors” (as this term is defined in Article 10 CISA) and in the circumstances set out in Article 3 of the Ordinance on Collective Investment Scheme of 22 November 2006, as amended, or the “CISO,” such that there is no public offer. Investors, however, do not benefit from protection under CISA or CISO or supervision by FINMA. This prospectus and any other materials relating to the securities are strictly personal and confidential to each offeree and do not constitute an offer to any other person. This prospectus may only be used by those qualified investors to whom it has been handed out in connection with the offer described herein and may neither directly or indirectly be distributed or made available to any person or entity other than its recipients. It may not be used in connection with any other offer and shall in particular not be copied and/or distributed to the public in Switzerland or from Switzerland. This prospectus does not constitute an issue prospectus as that term is understood pursuant to Article 652a and/or 1156 of the Swiss Federal Code of Obligations. We have not applied for a listing of the securities on the SIX Swiss Exchange or any other regulated securities market in Switzerland and, consequently, the information presented in this prospectus does not necessarily comply with the information standards set out in the listing rules of the SIX Swiss Exchange and corresponding prospectus schemes annexed to the listing rules of the SIX Swiss Exchange.
Notice to Prospective Investors in Canada
The shares of common stock may be sold only to purchasers purchasing, or deemed to be purchasing, as principal that are accredited investors, as defined in National Instrument 45-106 Prospectus Exemptions or subsection 73.3(1) of the Securities Act (Ontario), and are permitted clients, as defined in National Instrument 31-103 Registration Requirements, Exemptions and Ongoing Registrant Obligations. Any resale of the shares of common stock must be made in accordance with an exemption from, or in a transaction not subject to, the prospectus requirements of applicable securities laws.
Securities legislation in certain provinces or territories of Canada may provide a purchaser with remedies for rescission or damages if this prospectus (including any amendment thereto) contains a misrepresentation, provided that the remedies for rescission or damages are exercised by the purchaser within the time limit prescribed by the securities legislation of the purchaser’s province or territory. The purchaser should refer to any applicable provisions of the securities legislation of the purchaser’s province or territory for particulars of these rights or consult with a legal advisor.
Pursuant to section 3A.3 (or, in the case of securities issued or guaranteed by the government of a non-Canadian jurisdiction, section 3A.4) of National Instrument 33-105 Underwriting Conflicts (NI 33-105), the underwriters are not required to comply with the disclosure requirements of NI 33-105 regarding underwriter conflicts of interest in connection with this offering.
157
Table of Contents
The validity of the shares of our common stock offered hereby will be passed upon for us by Debevoise & Plimpton LLP, New York, New York. Certain legal matters related to this offering will be passed upon for the underwriters by Latham & Watkins LLP, New York, New York.
The consolidated financial statements of the Company included in this prospectus and the related financial statement schedules included elsewhere in the registration statement have been audited by Deloitte & Touche LLP, an independent registered public accounting firm, as stated in their reports appearing herein and elsewhere in the registration statement. Such consolidated financial statements and financial statement schedules are included in reliance upon the reports of such firm given upon their authority as experts in accounting and auditing.
The consolidated financial statements of Heritage Plastics, Inc. included in this prospectus have been audited by Rea & Associates, Inc., an independent registered public accounting firm, as stated in its report appearing herein and elsewhere in the registration statement. Such consolidated financial statements are included in reliance upon the report of such firm given upon their authority as experts in accounting and auditing.
WHERE YOU CAN FIND MORE INFORMATION
We have filed a registration statement on Form S-1 with the SEC with respect to the shares of our common stock being sold in this offering. This prospectus does not contain all of the information set forth in the registration statement and the exhibits thereto because some parts have been omitted in accordance with the rules and regulations of the SEC. You will find additional information about us and the common stock being sold in this offering in the registration statement and the exhibits thereto. For further information with respect to Atkore and the common stock being sold in this offering, reference is made to the registration statement and the exhibits filed therewith. Statements contained in this prospectus as to the contents of any contract or other document referred to are not necessarily complete and in each instance, if such contract or document is filed as an exhibit, reference is made to the copy of such contract or other document filed as an exhibit to the registration statement, each statement being qualified in all respects by such reference. A copy of the registration statement, including the exhibits thereto, may be read and copied at the SEC’s Public Reference Room at 100 F Street, N.E., Room 1580, Washington, D.C. 20549. Information on the operation of the Public Reference Room may be obtained by calling the SEC at 1-800-SEC-0330. In addition, the SEC maintains an internet site at http://www.sec.gov, from which interested persons can electronically access the registration statement, including the exhibits and any schedules thereto. Copies of the registration statement, including the exhibits and schedules thereto, are also available at your request, without charge, from Atkore International Group Inc., 16100 South Lathrop Avenue, Harvey, Illinois 60426.
We will be subject to the informational requirements of the Exchange Act and, accordingly, will file annual reports containing financial statements audited by an independent registered public accounting firm, quarterly reports containing unaudited financial statements, current reports, proxy statements and other information with the SEC. You will be able to inspect and copy these reports, proxy statements and other information at the public reference facilities maintained by the SEC at the address noted above. You will also be able to obtain copies of this material from the Public Reference Room of the SEC as described above, or inspect them without charge at the SEC’s website. You will also be able to access, free of charge, our reports filed with the SEC (for example, our Annual Reports on Form 10-K, our Quarterly Reports on Form 10-Q and our Current Reports on Form 8-K and any amendments to those forms) through our website (www.atkore.com). Reports filed with or furnished to the SEC will be available as soon as reasonably practicable after they are filed with or furnished to the SEC. None of the information contained on, or that may be accessed through, our websites or any other website identified herein is part of, or incorporated into, this prospectus. All website addresses in this prospectus are intended to be inactive textual references only.
158
Table of Contents
INDEX TO CONSOLIDATED FINANCIAL STATEMENTS
F-1
Table of Contents
REPORT OF INDEPENDENT REGISTERED PUBLIC ACCOUNTING FIRM
To the Board of Directors and Stockholders of
Atkore International Group Inc.
Harvey, Illinois
We have audited the accompanying consolidated balance sheets of Atkore International Group Inc. and subsidiaries (the “Company”) as of September 25, 2015 and September 26, 2014, and the related consolidated statements of operations, comprehensive loss, cash flows, and cumulative convertible preferred stock and equity for each of the three years in the period ended September 25, 2015. These financial statements are the responsibility of the Company’s management. Our responsibility is to express an opinion on the financial statements based on our audits.
We conducted our audits in accordance with the standards of the Public Company Accounting Oversight Board (United States). Those standards require that we plan and perform the audit to obtain reasonable assurance about whether the financial statements are free of material misstatement. The Company is not required to have, nor were we engaged to perform, an audit of its internal control over financial reporting. Our audits included consideration of internal control over financial reporting as a basis for designing audit procedures that are appropriate in the circumstances, but not for the purpose of expressing an opinion on the effectiveness of the Company’s internal control over financial reporting. Accordingly, we express no such opinion. An audit also includes examining, on a test basis, evidence supporting the amounts and disclosures in the financial statements, assessing the accounting principles used and significant estimates made by management, as well as evaluating the overall financial statement presentation. We believe that our audits provide a reasonable basis for our opinion.
In our opinion, such consolidated financial statements present fairly, in all material respects, the financial position of Atkore International Group Inc. and subsidiaries as of September 25, 2015, and September 26, 2014, and the results of their operations and their cash flows for each of the three years in the period ended September 25, 2015, in conformity with accounting principles generally accepted in the United States of America.
/s/ DELOITTE & TOUCHE LLP
Chicago, Illinois
March 4, 2016
F-2
Table of Contents
ATKORE INTERNATIONAL GROUP INC.
CONSOLIDATED STATEMENTS OF OPERATIONS
| For the Year Ended | ||||||||||||
| (in thousands, except per share data) |
September 25, 2015 |
September 26, 2014 |
September 27, 2013 |
|||||||||
| Net sales |
$ | 1,729,168 | $ | 1,702,838 | $ | 1,475,897 | ||||||
| Cost of sales |
1,456,375 | 1,475,728 | 1,264,348 | |||||||||
|
|
|
|
|
|
|
|||||||
| Gross profit |
272,793 | 227,110 | 211,549 | |||||||||
| Selling, general and administrative |
185,815 | 180,783 | 160,749 | |||||||||
| Intangible asset amortization |
22,103 | 20,857 | 15,317 | |||||||||
| Asset impairment charges |
27,937 | 44,424 | 9,161 | |||||||||
|
|
|
|
|
|
|
|||||||
| Operating income (loss) |
36,938 | (18,954 | ) | 26,322 | ||||||||
| Interest expense, net |
44,809 | 44,266 | 47,869 | |||||||||
| Loss on extinguishment of debt |
— | 43,667 | — | |||||||||
|
|
|
|
|
|
|
|||||||
| Loss from continuing operations before income taxes |
(7,871 | ) | (106,887 | ) | (21,547 | ) | ||||||
| Income tax benefit |
(2,916 | ) | (32,939 | ) | (2,966 | ) | ||||||
|
|
|
|
|
|
|
|||||||
| Loss from continuing operations |
(4,955 | ) | (73,948 | ) | (18,581 | ) | ||||||
| Loss from discontinued operations, net of income tax expense of $0, $0, $2,791, respectively |
— | — | (42,654 | ) | ||||||||
|
|
|
|
|
|
|
|||||||
| Net loss |
(4,955 | ) | (73,948 | ) | (61,235 | ) | ||||||
|
|
|
|
|
|
|
|||||||
| Convertible preferred stock and dividends |
— | 29,055 | 47,234 | |||||||||
|
|
|
|
|
|
|
|||||||
| Net loss attributable to common stockholders |
$ | (4,955 | ) | $ | (103,003 | ) | $ | (108,469 | ) | |||
|
|
|
|
|
|
|
|||||||
| Weighted Average Common Shares Outstanding: |
||||||||||||
| Basic |
45,640 | 37,225 | 29,740 | |||||||||
| Diluted |
45,640 | 37,225 | 29,740 | |||||||||
| Loss Per Share from Continuing Operations |
||||||||||||
| Basic and Diluted |
$ | (0.11 | ) | $ | (2.77 | ) | $ | (2.21 | ) | |||
| Loss Per Share from Discontinued Operations |
||||||||||||
| Basic and Diluted |
— | — | (1.43 | ) | ||||||||
| Net loss per share |
||||||||||||
| Basic and Diluted |
$ | (0.11 | ) | $ | (2.77 | ) | $ | (3.65 | ) | |||
See Notes to Financial Statements
F-3
Table of Contents
ATKORE INTERNATIONAL GROUP INC.
CONSOLIDATED STATEMENTS OF COMPREHENSIVE LOSS
| For the Year Ended | ||||||||||||
| (in thousands) |
September 25, 2015 |
September 26, 2014 |
September 27, 2013 |
|||||||||
| Net loss |
$ | (4,955 | ) | $ | (73,948 | ) | $ | (61,235 | ) | |||
| Other comprehensive loss: |
||||||||||||
| Change in foreign currency translation adjustment |
(7,135 | ) | (2,403 | ) | 12,877 | |||||||
| Change in unrecognized loss related to pension benefit plans, net of tax benefit of $4,554, $1,143, $8,119, respectively (See Note 10) |
(7,268 | ) | (1,829 | ) | 12,824 | |||||||
|
|
|
|
|
|
|
|||||||
| Total other comprehensive loss |
(14,403 | ) | (4,232 | ) | 25,701 | |||||||
|
|
|
|
|
|
|
|||||||
| Comprehensive loss |
$ | (19,358 | ) | $ | (78,180 | ) | $ | (35,534 | ) | |||
|
|
|
|
|
|
|
|||||||
See Notes to Financial Statements
F-4
Table of Contents
ATKORE INTERNATIONAL GROUP INC.
CONSOLIDATED BALANCE SHEETS
| (in thousands, except share and per share data) |
September 25, 2015 | September 26, 2014 | ||||||
| Assets |
||||||||
| Current Assets: |
||||||||
| Cash and cash equivalents |
$ | 80,598 | $ | 33,360 | ||||
| Accounts receivable, less allowance for doubtful accounts of $1,173 and $1,986, respectively |
216,992 | 220,012 | ||||||
| Inventories, net (see Note 4) |
161,924 | 226,101 | ||||||
| Assets held for sale |
3,313 | 4,835 | ||||||
| Prepaid expenses and other current assets |
18,665 | 25,721 | ||||||
|
|
|
|
|
|||||
| Total current assets |
481,492 | 510,029 | ||||||
| Property, plant and equipment, net (see Note 5) |
224,284 | 253,287 | ||||||
| Intangible assets, net (see Note 6) |
277,175 | 288,058 | ||||||
| Goodwill (see Note 6) |
115,829 | 114,442 | ||||||
| Deferred income taxes (see Note 9) |
1,087 | 2,260 | ||||||
| Non-trade receivables |
13,932 | 17,343 | ||||||
|
|
|
|
|
|||||
| Total Assets |
$ | 1,113,799 | $ | 1,185,419 | ||||
|
|
|
|
|
|||||
| Liabilities and Equity |
||||||||
| Current Liabilities: |
||||||||
| Borrowings under credit facility, short-term debt and current maturities of long-term debt (see Note 8) |
$ | 2,864 | $ | 42,887 | ||||
| Accounts payable |
109,847 | 154,681 | ||||||
| Income tax payable |
515 | 778 | ||||||
| Accrued and other current liabilities (see Note 7) |
97,272 | 75,441 | ||||||
|
|
|
|
|
|||||
| Total current liabilities |
210,498 | 273,787 | ||||||
| Long-term debt (see Note 8) |
649,344 | 649,980 | ||||||
| Deferred income taxes (see Note 9) |
14,557 | 23,095 | ||||||
| Other long-term tax liabilities |
13,319 | 16,184 | ||||||
| Pension liabilities (see Note 10) |
28,126 | 17,014 | ||||||
| Other long-term liabilities |
41,678 | 28,890 | ||||||
|
|
|
|
|
|||||
| Total Liabilities |
957,522 | 1,008,950 | ||||||
|
|
|
|
|
|||||
| Equity: |
||||||||
| Common stock, $0.01 par value, 200,000,000 shares authorized, 45,586,450 and 45,653,119 shares issued and outstanding, respectively |
457 | 457 | ||||||
| Treasury stock, held at cost, 190,438 and 119,880 shares, respectively |
(2,580 | ) | (1,698 | ) | ||||
| Additional paid-in capital |
352,674 | 352,626 | ||||||
| Accumulated deficit |
(173,241 | ) | (168,286 | ) | ||||
| Accumulated other comprehensive loss |
(21,033 | ) | (6,630 | ) | ||||
|
|
|
|
|
|||||
| Total Equity |
156,277 | 176,469 | ||||||
|
|
|
|
|
|||||
| Total Liabilities and Equity |
$ | 1,113,799 | $ | 1,185,419 | ||||
|
|
|
|
|
|||||
See Notes to Financial Statements
F-5
Table of Contents
ATKORE INTERNATIONAL GROUP INC.
CONSOLIDATED STATEMENTS OF CASH FLOWS
| For the Year Ended | ||||||||||||
| (in thousands) |
September 25, 2015 |
September 26, 2014 |
September 27, 2013 |
|||||||||
| Operating activities: |
||||||||||||
| Net loss |
$ | (4,955 | ) | $ | (73,948 | ) | $ | (61,235 | ) | |||
| Adjustments to reconcile net loss to net cash provided by operating activities: |
||||||||||||
| Loss from discontinued operations and disposal, net of income tax expense |
— | — | 42,654 | |||||||||
| Depreciation and amortization |
59,465 | 58,695 | 48,412 | |||||||||
| Impairment of assets |
27,937 | 44,424 | 9,161 | |||||||||
| Amortization of debt issuance costs and original issue discount |
3,631 | 4,731 | 5,559 | |||||||||
| Stock-based compensation expense |
13,523 | 8,398 | 2,199 | |||||||||
| Loss on sale of fixed assets and assets held for sale |
1,240 | — | — | |||||||||
| Loss from extinguishment of debt |
— | 43,667 | — | |||||||||
| Deferred income taxes |
(3,650 | ) | (36,510 | ) | (5,962 | ) | ||||||
| Provision for losses on accounts receivable and inventory |
546 | 3,254 | 4,981 | |||||||||
| Changes in operating assets and liabilities, net of effects from acquisitions: |
||||||||||||
| Accounts receivable |
7,038 | (12,124 | ) | 20,363 | ||||||||
| Inventories |
67,509 | 7,675 | (21,792 | ) | ||||||||
| Prepaid expenses and other current assets |
(616 | ) | 16,613 | (4,787 | ) | |||||||
| Accounts payable |
(43,710 | ) | 26,804 | (7,709 | ) | |||||||
| Income taxes |
(3,814 | ) | 654 | 19 | ||||||||
| Accrued and other liabilities |
16,311 | (1,028 | ) | 2,304 | ||||||||
| Other, net |
618 | (3,093 | ) | 4,046 | ||||||||
|
|
|
|
|
|
|
|||||||
| Net cash provided by continuing operating activities |
141,073 | 88,212 | 38,213 | |||||||||
| Net cash (used for) discontinued operating activities |
— | (1,879 | ) | (2,789 | ) | |||||||
|
|
|
|
|
|
|
|||||||
| Net cash provided by operating activities |
141,073 | 86,333 | 35,424 | |||||||||
| Investing activities: |
||||||||||||
| Capital expenditures |
(26,849 | ) | (24,362 | ) | (14,999 | ) | ||||||
| Proceeds from sale of properties and equipment |
1,451 | 7,396 | 2,401 | |||||||||
| Acquisitions of businesses, net of cash acquired |
(30,549 | ) | (39,787 | ) | (102,473 | ) | ||||||
| Working capital adjustment for acquisition |
— | 5,142 | — | |||||||||
| Proceeds from sale of an investment |
4,844 | 2,736 | — | |||||||||
| Other, net |
(78 | ) | 15 | 1,319 | ||||||||
|
|
|
|
|
|
|
|||||||
| Net cash (used for) continuing investing activities |
(51,181 | ) | (48,860 | ) | (113,752 | ) | ||||||
| Net cash provided by discontinued investing activities |
4,540 | — | 26,500 | |||||||||
|
|
|
|
|
|
|
|||||||
| Net cash (used for) investing activities |
(46,641 | ) | (48,860 | ) | (87,252 | ) | ||||||
| Financing activities: |
||||||||||||
| Borrowings under credit facility |
788,000 | 657,000 | 297,500 | |||||||||
| Repayments under credit facility |
(828,000 | ) | (676,000 | ) | (238,500 | ) | ||||||
| Proceeds from short-term debt |
1,692 | 4,126 | 9,011 | |||||||||
| Repayments of short-term debt |
(1,661 | ) | (5,825 | ) | (12,495 | ) | ||||||
| Proceeds from issuance of first and second lien credit agreements |
— | 665,400 | — | |||||||||
| Repayments of long-term debt |
(4,200 | ) | (438,558 | ) | — | |||||||
| Payment of debt issuance costs |
(102 | ) | (11,925 | ) | — | |||||||
| Proceeds from foreign exchange forward option |
999 | — | — | |||||||||
| Issuance of common stock. |
49 | 674 | 587 | |||||||||
| Repurchase of common stock. |
(882 | ) | (252,765 | ) | (253 | ) | ||||||
| Other, net |
(1 | ) | 289 | (27 | ) | |||||||
|
|
|
|
|
|
|
|||||||
| Net cash provided by (used for) continuing financing activities |
(44,106 | ) | (57,584 | ) | 55,823 | |||||||
| Effects of foreign exchange rate changes on cash and cash equivalents |
(3,088 | ) | (1,299 | ) | (1,152 | ) | ||||||
|
|
|
|
|
|
|
|||||||
| Increase (decrease) in cash and cash equivalents |
47,238 | (21,410 | ) | 2,843 | ||||||||
| Cash and cash equivalents at beginning of period |
33,360 | 54,770 | 51,927 | |||||||||
|
|
|
|
|
|
|
|||||||
| Cash and cash equivalents at end of period |
$ | 80,598 | $ | 33,360 | $ | 54,770 | ||||||
|
|
|
|
|
|
|
|||||||
| Supplementary Cash Flow information |
||||||||||||
| Interest paid |
$ | 41,460 | $ | 42,833 | $ | 42,288 | ||||||
| Income taxes paid, net of refunds |
4,759 | 2,206 | 3,091 | |||||||||
| Capital expenditures, not yet paid |
327 | 236 | 1,024 | |||||||||
| Non-cash preferred stock dividends |
— | 29,055 | 47,234 | |||||||||
See Notes to Financial Statements
F-6
Table of Contents
ATKORE INTERNATIONAL GROUP INC.
CONSOLIDATED STATEMENTS OF CUMULATIVE
CONVERTIBLE PREFERRED STOCK AND EQUITY
For the three year period ended September 25, 2015
| (in thousands, except share amounts) |
Cumulative Convertible Preferred Stock |
Common Stock | Treasury Stock |
Addi- tional Paid-in Capital |
Accum- ulated Deficit |
Accum- ulated Other Compre- hensive Loss |
Total Equity |
|||||||||||||||||||||||||||||
| Shares | Amount | Shares | Amount | Amount | ||||||||||||||||||||||||||||||||
| Balance at September 29, 2012 |
377 | $ | 376,341 | 29,724 | $ | 297 | $ | (680 | ) | $ | 228,622 | $ | (33,103 | ) | $ | (28,099 | ) | $ | 543,378 | |||||||||||||||||
| Net loss |
— | — | — | — | — | — | (61,235 | ) | — | (61,235 | ) | |||||||||||||||||||||||||
| Other comprehensive income |
— | — | — | — | — | — | — | 25,701 | 25,701 | |||||||||||||||||||||||||||
| Issuance of common stock |
— | — | 59 | 1 | — | 586 | — | — | 587 | |||||||||||||||||||||||||||
| Repurchase of common stock |
— | — | (18 | ) | — | (253 | ) | — | — | — | (253 | ) | ||||||||||||||||||||||||
| Stock-based compensation |
— | — | — | — | — | 2,199 | — | — | 2,199 | |||||||||||||||||||||||||||
| Preferred stock dividends |
47 | 47,234 | — | — | — | (47,234 | ) | — | — | — | ||||||||||||||||||||||||||
|
|
|
|
|
|
|
|
|
|
|
|
|
|
|
|
|
|
|
|||||||||||||||||||
| Balance at September 27, 2013 |
424 | 423,576 | 29,765 | 298 | (933 | ) | 184,174 | (94,338 | ) | (2,399 | ) | 510,378 | ||||||||||||||||||||||||
| Net loss |
— | — | — | — | — | — | (73,948 | ) | — | (73,948 | ) | |||||||||||||||||||||||||
| Other comprehensive loss |
— | — | — | — | — | — | — | (4,231 | ) | (4,231 | ) | |||||||||||||||||||||||||
| Issuance of common stock |
— | — | 59 | 1 | — | 673 | — | — | 674 | |||||||||||||||||||||||||||
| Repurchase of common stock |
— | — | (29,434 | ) | — | (252,765 | ) | — | — | — | (252,765 | ) | ||||||||||||||||||||||||
| Retirement of common stock |
— | — | — | (294 | ) | 252,000 | (251,706 | ) | — | — | — | |||||||||||||||||||||||||
| Preferred stock dividends |
29 | 29,055 | — | — | — | (29,055 | ) | — | — | — | ||||||||||||||||||||||||||
| Conversion of preferred stock |
(453 | ) | (452,630 | ) | 45,263 | 453 | — | 452,178 | — | — | — | |||||||||||||||||||||||||
| Modification of equity based compensation to liability award |
— | — | — | — | — | (3,638 | ) | — | — | (3,638 | ) | |||||||||||||||||||||||||
|
|
|
|
|
|
|
|
|
|
|
|
|
|
|
|
|
|
|
|||||||||||||||||||
| Balance at September 26, 2014 |
— | — | 45,653 | 457 | (1,698 | ) | 352,626 | (168,286 | ) | (6,629 | ) | 176,469 | ||||||||||||||||||||||||
| Net loss |
— | — | — | — | — | — | (4,955 | ) | — | (4,955 | ) | |||||||||||||||||||||||||
| Other comprehensive loss |
— | — | — | — | — | — | — | (14,403 | ) | (14,403 | ) | |||||||||||||||||||||||||
| Issuance of common stock |
— | — | 4 | — | — | 49 | — | — | 49 | |||||||||||||||||||||||||||
| Repurchase of common stock |
— | — | (71 | ) | — | (882 | ) | — | — | — | (882 | ) | ||||||||||||||||||||||||
|
|
|
|
|
|
|
|
|
|
|
|
|
|
|
|
|
|
|
|||||||||||||||||||
| Balance at September 25, 2015 |
— | — | 45,586 | $ | 457 | $ | (2,580 | ) | $ | 352,674 | $ | (173,241 | ) | $ | (21,033 | ) | $ | 156,277 | ||||||||||||||||||
|
|
|
|
|
|
|
|
|
|
|
|
|
|
|
|
|
|
|
|||||||||||||||||||
See Notes to Financial Statements
F-7
Table of Contents
ATKORE INTERNATIONAL GROUP INC. AND SUBSIDIARIES
NOTES TO CONSOLIDATED FINANCIAL STATEMENTS
(dollars in thousands, except per share data)
1. BASIS OF PRESENTATION AND SUMMARY OF SIGNIFICANT ACCOUNTING POLICIES
Organization and Ownership Structure—Atkore International Group Inc. (the “Company” or “Atkore”) was incorporated in the State of Delaware on November 4, 2010. The Company owns 100% of Atkore International Holdings Inc. (“Atkore Holdings”), which is sole owner of Atkore International, Inc. (“Atkore International”). Prior to the transactions described below, all of the capital stock of Atkore International was owned by Tyco International Ltd. (“Tyco”). The business of Atkore International was operated as the Tyco Electrical and Metal Products (“TEMP”) business of Tyco. Atkore was initially formed by Tyco as a holding company to hold ownership of TEMP.
The Transactions—On November 9, 2010, Tyco announced that it had entered into an agreement to sell a majority interest in TEMP to CD&R Allied Holdings, L.P. (the “CD&R Investor), an affiliate of the private equity firm Clayton Dubilier & Rice, LLC (“CD&R”). On December 22, 2010, the transaction was completed and CD&R acquired shares of a newly created class of cumulative convertible preferred stock (the “Preferred Stock”) of the Company. The Preferred Stock initially represented 51% of the Company’s outstanding capital stock (on an as-converted basis). The preferred stock is entitled to a 12% fixed, cumulative dividend paid quarterly (“Preferred Dividends”) and dividends on an as-converted basis when declared on common stock (“Participating Dividends”). On December 22, 2010, the Company also issued common stock (the “Common Stock”) to Tyco’s wholly owned subsidiary, Tyco International Holding S.à.r.l. (“Tyco Seller”), that initially represented the remaining 49% of the Company’s outstanding capital stock. Subsequent to December 22, 2010, the Company has operated as an independent, stand-alone entity. The aforementioned transactions described in this paragraph are referred to herein as the “Transactions.”
On March 6, 2014, the Company entered into a non-binding letter of intent (the “Letter of Intent”) with Tyco for the acquisition (the “Acquisition”) of 29.4 million shares of Common Stock held by Tyco Seller. On April 9, 2014, the Company paid $250,000 to Tyco Seller to redeem the shares, which were subsequently retired. The Company paid $2,000 of expenses related to the share redemption.
In a separate transaction on the same date, the CD&R Investor converted its Preferred Stock and accumulated Preferred Dividends into Common Stock. As of September 26, 2014, Common Stock is the Company’s sole issued and outstanding class of securities.
Basis of Presentation—The accompanying audited consolidated financial statements of the Company included herein have been prepared in accordance with accounting principles generally accepted in the United States of America (“GAAP”).
The consolidated financial statements include the assets and liabilities used in operating the Company’s business. All intercompany balances and transactions have been eliminated in consolidation. The results of companies acquired or disposed of are included in the consolidated financial statements from the effective date of acquisition or up to the date of disposal.
Description of Business—The Company delivers a unique portfolio of integrated electrical raceway solutions and mechanical products and solutions that deploy, isolate and protect a structure’s electrical circuitry from source to outlet. Product offerings include metal conduit, armored cable, flexible conduit, framing systems, wire baskets, cable trays and other complementary products including fittings and mechanical pipe.
Fiscal Year—The Company has a 52- or 53-week fiscal year that ends on the last Friday in September. It is the Company’s practice to establish quarterly closings using a 4-5-4 calendar. Fiscal years 2015, 2014 and 2013
F-8
Table of Contents
were 52-week fiscal years, which ended on September 25, 2015, September 26, 2014 and September 27, 2013, respectively. The next fiscal year will end on September 30, 2016, and will be a 53-week year.
Use of Estimates—The preparation of the consolidated financial statements in conformity with GAAP requires management to make estimates and assumptions that affect the reported amounts of assets and liabilities, disclose contingent assets and liabilities at the date of the consolidated financial statements and report the associated amounts of revenues and expenses. Significant estimates and assumptions are used for, but not limited to, allowances for doubtful accounts, estimates of future cash flows associated with asset impairments, useful lives for depreciation and amortization, loss contingencies, net realizable value of inventories, legal liabilities, income taxes and tax valuation allowances, pension and postretirement employee benefit liabilities and purchase price allocation. Actual results could differ materially from these estimates.
Revenue Recognition—The Company’s revenue is generated principally from the sale of its products. Revenue from the sale of products is recognized at the time title, risks and rewards of ownership pass. This is generally when the products reach the free-on-board shipping point, the sales price is fixed and determinable and collection is reasonably assured. The freight charges for shipments are included in the Company’s revenues.
Provisions for certain rebates, sales incentives, trade promotions, product returns and discounts to customers are accounted for as reductions in determining sales in the same period the related sales are recorded. Rebates are estimated based on sales terms and historical experience.
Product returns are estimated based on historical experience and are recorded at the time revenues are recognized. Accordingly, the Company reduces recognized revenue for estimated future returns at the time revenue is recorded. The estimates for returns are adjusted periodically based upon changes in historical rates of returns and trend analysis.
It is possible that these estimates will change in the future or that the actual amounts could vary from the Company’s estimates.
Cost of Sales—The Company includes all costs directly related to the production of goods for sale in cost of sales in the statement of operations. These costs include direct material, direct labor, production related overheads, excess and obsolescence costs, lower of cost or market provisions, freight and distribution costs, and the depreciation and amortization of assets directly used in the production of goods for sale.
Selling, General and Administrative Expenses—These amounts primarily include payroll-related expenses for both administrative and selling personnel, compensation expense from stock-based awards, restructuring-related charges, third-party professional services and translation gains or losses for foreign currency transaction.
Cash and Cash Equivalents—The Company considers all highly liquid investments with a maturity of three months or less, when purchased, to be cash equivalents.
Allowance for Doubtful Accounts—The allowance for doubtful accounts receivable reflects the best estimate of losses inherent in the Company’s accounts receivable portfolio determined on the basis of historical experience, specific allowances for known troubled accounts and other available evidence.
Inventories—Inventories are recorded at the lower of cost (primarily LIFO) or market value for a majority of the Company. The Company estimates losses for excess and obsolete inventory through an assessment of its net realizable value based on the aging of the inventory and an evaluation of the likelihood of recovering the inventory costs based on anticipated demand and selling price.
F-9
Table of Contents
Property, Plant and Equipment—Property, plant and equipment, net, is recorded at cost less accumulated depreciation. Maintenance and repair expenditures are charged to expense when incurred. Depreciation is calculated using the straight-line method over the estimated useful lives of the related assets as follows:
| Buildings |
2 to 40 years | |
| Building improvements |
2 to 22 years | |
| Machinery and production equipment |
2 to 20 years | |
| Support and testing machinery and equipment |
2 to 15 years | |
| Leasehold improvements |
Lesser of remaining term of the lease or economic useful life |
Long-Lived Asset Impairments—The Company reviews long-lived assets, including property, plant and equipment, for impairment whenever events or changes in business circumstances indicate that the carrying amount of the asset may not be fully recoverable.
The Company groups assets at the lowest level for which cash flows are separately identified in order to measure an impairment. Recoverability of an asset or asset group is first measured by a comparison of the carrying amount to its estimated undiscounted future cash flows expected to be generated by the asset or asset group. If the carrying amount exceeds its estimated undiscounted future cash flows, an impairment charge is recognized as the amount by which the carrying amount of the asset or asset group exceeds the estimated fair value. If impairment is determined to exist, any related impairment loss is calculated based on the estimated fair value. Impairment losses on assets to be disposed of or held for sale, if any, are based on the estimated proceeds to be received, less costs of disposal. See Note 15. Restructuring Charges and Asset Impairments.
Goodwill and Indefinite-Lived Intangible Asset Impairments—Goodwill and indefinite-lived intangible assets are assessed for impairment annually and more frequently if triggering events occur. See Note 6. Goodwill and Intangible Assets. Management uses various sources of information to estimate fair value including forecasted operating results, business plans, economic projections, royalty rates, market multiples of publicly traded comparable companies and other market data.
When testing for goodwill impairment, the Company first compares the fair value of a reporting unit with its carrying amount. Fair value for the goodwill impairment test is determined utilizing a discounted cash flow analysis based on the forecasted cash flows (including estimated underlying revenue and operating income growth rates) discounted using an estimated weighted average cost of capital of market participants. A market approach, utilizing observable market data of comparable companies in similar lines of business that are publicly traded is used to corroborate the discounted cash flow analysis performed at each reporting unit. If the carrying amount of a reporting unit exceeds its fair value, the second step of the goodwill impairment test will be performed to measure the amount of impairment loss.
In the second step of the goodwill impairment test, the Company compares the implied fair value of the reporting unit’s goodwill with the carrying amount of the reporting unit’s goodwill. If the carrying amount of the reporting unit’s goodwill exceeds the implied fair value of that goodwill, an impairment loss is recognized in an amount equal to the excess of the carrying amount of goodwill over its implied fair value. The implied fair value of goodwill is determined in the same manner that the amount of goodwill recognized in a business combination is determined. The Company allocates the fair value of a reporting unit to all of the assets and liabilities of that unit, including intangible assets, as if the reporting unit had been acquired in a business combination. Any excess of the fair value of a reporting unit over the amounts assigned to its assets and liabilities represents the implied fair value of goodwill and is considered a Level 3 fair value measurement in accordance with the fair value hierarchy.
Fair Value Measurements—Authoritative guidance for fair value measurements establishes a three-level hierarchy that ranks the quality and reliability of information used in developing fair value estimates. The hierarchy gives the highest priority to quoted prices in active markets and the lowest priority to unobservable
F-10
Table of Contents
data. In cases where two or more levels of inputs are used to determine fair value, a financial instrument’s level is determined based on the lowest level input that is considered significant to the fair value measurement in its entirety. The three levels of the fair value hierarchy are summarized as follows:
| • | Level 1—inputs are based upon quoted prices (unadjusted) in active markets for identical assets or liabilities that are accessible as of the measurement date. |
| • | Level 2—inputs are based upon quoted prices for similar assets or liabilities in active markets, quoted prices for identical or similar assets or liabilities in markets that are not active, and model-derived valuations for the asset or liability that are derived principally from or corroborated by market data for which the primary inputs are observable, including forward interest rates, yield curves, credit risk and exchange rates. |
| • | Level 3—inputs for the valuations are unobservable and are based on management’s estimates of assumptions that market participants would use in pricing the asset or liability. The fair values are therefore determined using model-based techniques such as option pricing models and discounted cash flow models. |
Income Taxes and Uncertain Tax Positions—The Company accounts for income taxes under the asset and liability method, which requires the recognition of deferred tax assets and liabilities for the expected future tax consequences of events that have been included in the consolidated financial statements. Under this method, deferred tax assets and liabilities are determined based on the differences between the financial reporting and tax basis of assets and liabilities using enacted tax rates in effect for the year it is expected the differences will reverse. The effect of a change in tax rates on deferred tax assets and liabilities is recognized in income in the period of the enactment date. The Company maintains an indemnity receivable for certain tax obligations that are indemnified by Tyco and that are expected to be settled directly with the taxing authorities.
The Company periodically assesses the realizabilty of the deferred tax assets. In making this determination management considers all available evidence, both positive and negative, including earnings history, expectations of future taxable income and available tax planning strategies. A valuation allowance is recorded to reduce our deferred tax assets to the amount that is considered more likely than not to be realized. Changes in the required valuation allowance are recorded in income in the period such determination is made.
Certain tax positions may be considered uncertain requiring an assessment of whether an allowance should be recorded. Provisions for uncertain tax positions provide a recognition threshold based on an estimate of whether it is more likely than not that a position will be sustained upon examination. The Company measures its uncertain tax positions as the largest amount of benefit that is greater than a 50 percent likelihood of being realized upon examination. Interest and penalties related to unrecognized tax benefits are recorded as a component of income tax expense. See Note 9. Income Taxes.
Stock-Based Compensation—Periodically, the Company grants stock options to employees. Compensation expense for such awards is based on the fair value recognized on a straight-line approach over the service period for which such awards are expected to vest. During the year ended September 26, 2014, the Company’s Board of Directors modified the Atkore International Group Inc. Stock Incentive Plan. The modification provides the Company discretion to net settle stock option awards in cash. Several former employees requested and were granted net cash settlements during the year. The Company previously did not have stock option exercises. Consequently, the modification triggered a change from equity accounting to liability accounting for all remaining outstanding options. Cumulative amounts previously recorded in equity were reclassified as a long-term liability and remeasured at fair value using the Black-Scholes model. The fair value of all outstanding options is remeasured each reporting period.
The resulting liability is classified as a non-current liability and reported in Other long-term liabilities on the balance sheet. The Company’s stock-based compensation liability is remeasured to fair value each reporting period until settlement. The fair value of stock options and stock purchase rights granted pursuant to the
F-11
Table of Contents
Company’s equity incentive plans is determined using the Black-Scholes valuation model. The determination of fair value is affected by the Company’s calculated stock price, as well as assumptions regarding subjective and complex variables such as expected employee exercise behavior and the Company’s expected stock price volatility over the expected term of the award. Key assumptions for the Black-Scholes valuation calculation are:
| • | Common Equity Share Price. The estimated fair value of a share of the Company’s common stock is used as a control point in order to determine the fair value each option grant. |
| • | Expected Volatility. Since the Company does not have a trading history for its common stock, the expected volatility was determined based on an analysis of reported data for a peer group of companies. The expected volatility of options granted has been determined using an average of the historical volatility measures of this peer group. The Company expects to continue to do so until such time as we have adequate historical data regarding the volatility of our traded stock price. |
| • | Expected Term. The expected term represents the period that our stock-based awards are expected to be outstanding. Because we have limited historic exercise behavior, the Company determined the expected term assumption using the “simplified” method, which is an average of the contractual term of the option and its ordinary vesting period. |
| • | Risk-free Interest Rate. The risk-free interest rate is based on U.S. Treasury yields in effect at the time of grant for the expected term of the option. |
| • | Expected Dividend Yield. The Company has not regularly paid, and does not anticipate paying or declaring, regular cash dividends on our common stock. Therefore, the expected dividend yield is assumed to be zero. |
Compensation expense is calculated based on awards ultimately expected to vest and is reduced for estimated forfeitures. Forfeitures are revised, if necessary, in subsequent periods if actual forfeitures differ from those estimates.
Concentration of Credit Risk—The Company extends credit to various customers in the retail and construction industries. Collection of trade receivables may be affected by changes in economic or other industry conditions and may, accordingly, impact the Company’s overall credit risk. Although the Company generally does not require collateral, the Company performs ongoing credit evaluations of customers and maintains reserves for potential credit losses. For all periods presented, no customer accounted for more than 10% of sales or accounts receivable.
Insurable Liabilities—The Company maintains policies with various insurance companies for its workers’ compensation, product, property, general, auto, and executive liability risks. The insurance policies the Company maintains have various retention levels and excess coverage limits. The establishment and update of liabilities for unpaid claims, including claims incurred but not reported, is based on management’s estimate as a result of the assessment by the Company’s claim administrator of each claim and an independent actuarial valuation of the nature and severity of total claims. The Company utilizes a third-party claims administrator to pay claims, track and evaluate actual claims experience, and ensure consistency in the data used in the actuarial valuation. For more information, see Note 16. Commitments and Contingencies.
Translation of Foreign Currency—For the Company’s non-U.S. subsidiaries that report in a functional currency other than U.S. dollars, assets and liabilities are translated into U.S. dollars using year-end exchange rates. Revenue and expenses are translated at the monthly average exchange rates in effect during the fiscal year. Foreign currency translation adjustments are included as a component of accumulated other comprehensive loss within the statements of comprehensive loss for the fiscal years ended September 25, 2015, September 26, 2014, and September 27, 2013.
Recent Accounting Pronouncements—On February 25, 2016, the FASB issued ASU 2016-2, Leases (Topic 842). The ASU requires companies to use a “right of use” lease model that assumes that each lease creates an
F-12
Table of Contents
asset (the lessee’s right to use the leased asset) and a liability (the future rent payment obligations) which should be reflected on a lessee’s balance sheet to fairly represent the lease transaction and the lessee’s related financial obligations. We conduct some of our operations under leases that are accounted for as operating leases, with no related assets and liabilities on our balance sheet. The proposed changes would require that substantially all of our operating leases be recognized as assets and liabilities on our balance sheet. The ASU is effective for annual periods beginning after December 15, 2018, and interim periods therein. Early adoption will be permitted. We are evaluating the effect of adopting this new accounting guidance and its impact on our results of operations, cash flows or financial position.
In November 2015, the FASB issued ASU 2015-17, “Income Taxes (Topic 740): Balance Sheet Classification of Deferred Taxes.” The amendment is part of the FASB’s simplification initiative and requires entities to present deferred tax assets and deferred tax liabilities as non-current in a classified balance sheet rather than as current and non-current. The guidance is effective for public business entities for annual periods beginning after December 15, 2016, and interim periods within those years. Early adoption is permitted and entities are permitted to apply the amendments either prospectively or retrospectively. We adopted this guidance in fiscal 2015 and applied the amendments retrospectively.
In September 2015, the FASB issued ASU 2015-16, Business Combinations (Topic 805): Simplifying the Accounting for Measurement-Period Adjustments. The ASU will require an acquirer to recognize provisional amounts that are identified during the measurement period in the reporting period in which the adjustment amounts are determined rather than restating prior periods. The ASU will be effective on a prospective basis for interim and annual periods beginning after December 15, 2015. The Company will adopt this new standard beginning with the 2016 fiscal year, and does not expect the adoption of this standard to have a material impact on the Company’s consolidated financial position, results of operations, cash flows, or related disclosures.
In June 2015, the FASB issued ASU 2015-10, “Technical Corrections and Improvements.” The ASU is part of an ongoing project on the FASB’s agenda to facilitate Codification updates for non-substantive technical corrections, clarifications, and improvements that are not expected to have a significant effect on accounting practice or create a significant administrative cost to most entities. The ASU will apply to all reporting entities within the scope of the affected accounting guidance. The amendments requiring transition guidance are effective for all entities for fiscal years, and interim periods within those fiscal years, beginning after December 15, 2015. Early adoption is permitted, including adoption in an interim period. All other amendments will be effective upon the issuance of this Update. We are evaluating the effect of adopting this new accounting guidance and its impact on our results of operations, cash flows or financial position. We do not believe this update will have a material impact on the financial statements.
In May 2015, the FASB issued ASU 2015-07, “Fair Value Measurement (Topic 820): Disclosures for Investments in Certain Entities That Calculate Net Asset Value per Share (or Its Equivalent).” The update amends ASC 820, “Fair Value Measurement.” This ASU removes the requirement to categorize within the fair value hierarchy investments without readily determinable fair values in entities that elect to measure fair value using net asset value per share or its equivalent. The ASU requires that these investments continue to be shown in the investment disclosure amount to allow the disclosure to reconcile to the investment amount presented in the balance sheet. Effective for public business entities for fiscal years beginning after December 15, 2015, and interim periods within those fiscal years. A reporting entity should apply the amendments retrospectively to all periods presented. The retrospective approach requires that an investment for which fair value is measured using the net asset value per share practical expedient be removed from the fair value hierarchy in all periods presented in an entity’s financial statements. Earlier application is permitted. We are evaluating the effect of adopting this new accounting guidance and its impact on our results of operations, cash flows or financial position. We do not believe this update will have a material impact on the financial statements.
In April 2015, the FASB issued ASU 2015-05, “Intangibles—Goodwill and Other—Internal-Use Software (Subtopic 350-40): Customer’s Accounting for Fees Paid in a Cloud Computing Arrangement.” This ASU
F-13
Table of Contents
provides guidance to customers about whether a cloud computing arrangement includes a software license. If an arrangement includes a software license, the accounting for the license will be consistent with licenses of other intangible assets. If the arrangement does not include a license, the arrangement will be accounted for as a service contract. Effective for annual periods, including interim periods within those annual periods, beginning after December 15, 2015. Early adoption is permitted for all entities. We are evaluating the effect of adopting this new accounting guidance and its impact on our results of operations, cash flows or financial position. We do not believe this update will have a material impact on the financial statements.
In April 2015, the FASB issued ASU 2015-04, “Compensation—Retirement Benefits (Topic 715): Practical Expedient for the Measurement Date of an Employer’s Defined Benefit Obligation and Plan Assets.” The amendments allow companies and other organizations with fiscal years that do not end on the last day of a month to measure their defined benefit plans assets and liabilities as of the last day of the month closest to the end of the fiscal year. Effective for public business entities for financial statements issued for fiscal years beginning after December 15, 2015, and interim periods within those fiscal years. We adopted this new accounting guidance in fiscal 2015 as early adoption was permitted.
In April 2015, the FASB issued ASU 2015-03, “Simplifying the Presentation of Debt Issuance Costs.” The update changes the presentation of debt issuance costs in the financial statements. The new ASU update requires an entity to present such costs in the balance sheet as a direct deduction from the related debt liability rather than as an asset. Amortization of these costs is reported as interest expense. For public business entities, the ASU’s guidance is effective for fiscal years, and interim periods within those fiscal years, beginning after December 15, 2015. We adopted this new accounting guidance in fiscal 2015 retrospectively for all periods presented.
In February 2015, the FASB issued ASU 2015-02 “Amendments to the Consolidation Analysis.” This update amends the consolidation requirements in ASC 810, “Consolidation.” The amendments change the consolidation analysis required under GAAP. For public business entities, the amendments in the ASU are effective for fiscal years, and interim periods within those fiscal years, beginning after December 15, 2015. Early adoption, including adoption in an interim period, is permitted. We are evaluating the effect of adopting this new accounting guidance and its impact on our results of operations, cash flows or financial position. We do not believe this update will have a material impact on the financial statements.
In January 2015, the FASB issued ASU 2015-01, “Simplifying Income Statement Presentation by Eliminating the Concept of Extraordinary Items.” This update eliminates the concept of an extraordinary item from GAAP. As a result, an entity will no longer (1) segregate an extraordinary item from the results of ordinary operations; (2) separately present an extraordinary item on its income statement, net of tax, after income from continuing operations; or (3) disclose income taxes and earnings-per-share data applicable to an extraordinary item. However, the ASU does not affect the reporting and disclosure requirements for an event that is unusual in nature or that occurs infrequently. The update is effective for fiscal years, and interim periods within those fiscal years, beginning after December 15, 2015, our fiscal 2017. A reporting entity also may apply the amendments retrospectively to all prior periods presented in the financial statements. Early adoption is permitted provided that the guidance is applied from the beginning of the fiscal year of adoption. We are evaluating the effect of adopting this new accounting guidance and its impact on our results of operations, cash flows or financial position. We do not believe this update will have a material impact on the financial statements.
In May 2014, the FASB issued ASU 2014-09, “Revenue from Contracts with Customers,” as a new Topic, ASC 606. The new revenue recognition standard provides a five-step analysis of transactions to determine when and how revenue is recognized. The core principle is that a company should recognize revenue to depict the transfer of promised goods or services to customers in an amount that reflects the consideration to which the entity expects to be entitled in exchange for those goods or services. On August 12, 2015, the FASB announced that it would defer for one year the effective date of the new standard for public and nonpublic entities. The revised effective date for public entities will be annual periods beginning after December 15, 2017. The revised
F-14
Table of Contents
effective date for nonpublic entities will be annual periods beginning after December 15, 2018, our fiscal 2019. Early adoption is permitted. We are evaluating the effect of adopting this new accounting guidance and its impact on our results of operations, cash flows or financial position.
In April 2014, the FASB issued ASU No. 2014-08, “Reporting Discontinued Operations and Disclosure of Disposals of Components of an Entity,” or “ASU 2014-08.” The amended guidance requires that a disposal representing a strategic shift that has (or will have) a major effect on an entity’s financial results or a business activity classified as held for sale should be reported as discontinued operations. The amendments also expand the disclosure requirements for discontinued operations and add new disclosures for individually significant dispositions that do not qualify as discontinued operations. The amendments are effective prospectively for fiscal years, and interim reporting periods within those years, beginning on or after December 15, 2014. The impact on the Company of adopting ASU 2014-08 will depend on the nature and size of future disposals, if any, of a component of the Company after the effective date. We adopted this new accounting guidance beginning in the first fiscal quarter of 2016.
2. ACQUISITIONS
Fiscal Year 2015 Transactions—On October 20, 2014, Atkore Plastic Pipe Corporation (“PPC”), a wholly owned indirect subsidiary of the Company, acquired all of the outstanding stock of American Pipe & Plastics, Inc. (“APPI”). The aggregate purchase price was $6,572. APPI is a manufacturer of PVC conduit and is located in Kirkwood, New York. Additionally, on November 17, 2014, Atkore Steel Components, Inc., a wholly owned indirect subsidiary of the Company, acquired most of the assets and assumed certain liabilities of Steel Components, Inc. (“SCI”). The aggregate purchase price was $23,868. SCI provides steel and malleable iron electrical fittings for steel, flexible and liquidtight conduit, as well as armored cable. SCI is located in Coconut Creek, Florida.
The purchase price was allocated to tangible and intangible assets acquired and liabilities assumed, based on their estimated fair values. Fair value measurements have been applied based on assumptions that market participants would use in the pricing of the asset or liability. The following table summarizes the Level 3 fair values assigned to the net assets acquired and liabilities assumed as of the acquisition date:
| (in thousands) |
APPI | SCI | ||||||
| Fair value of consideration transferred: |
||||||||
| Cash consideration |
$ | 6,572 | $ | 23,837 | ||||
|
|
|
|
|
|||||
| Fair value of assets acquired and liabilities assumed: |
||||||||
| Accounts receivable |
1,813 | 4,302 | ||||||
| Inventories |
1,850 | 5,500 | ||||||
| Intangible assets |
480 | 10,600 | ||||||
| Fixed assets |
2,907 | 46 | ||||||
| Accounts payable |
(1,057 | ) | (690 | ) | ||||
| Other |
(808 | ) | 155 | |||||
|
|
|
|
|
|||||
| Net assets acquired |
5,185 | 19,913 | ||||||
|
|
|
|
|
|||||
| Excess purchase price attributed to goodwill acquired |
$ | 1,387 | $ | 3,924 | ||||
|
|
|
|
|
|||||
Both acquisitions strengthen and diversify the Company’s Electrical Raceway reportable segment and its portfolio of products to electrical distribution customers. The Company funded both acquisitions using borrowings from Atkore International’s asset-based credit facility (“ABL Credit Facility”). The Company recognized $1,387 and $3,924 of goodwill for APPI and SCI, respectively. See Note 6. Goodwill and Intangible Assets. Goodwill consists of the excess of the purchase price over the net of the fair value of the acquired assets and assumed liabilities, and represents the estimated economic value attributable to future operations. Goodwill recognized from the APPI acquisition is non-deductible for income tax purposes. Goodwill recognized from the
F-15
Table of Contents
SCI acquisition will be tax-deductible and will be amortized over 15 years for income tax purposes. The goodwill arising from both acquisitions consists largely of the synergies and economies of scale from integrating these companies with existing businesses. The Company incurred approximately $318 and $610 during the years ended September 25, 2015 and September 26, 2014, respectively for acquisition-related expenses for both transactions which were recorded as a component of selling, general and administrative expenses in the Company’s Consolidated Statement of Operations. Due to the immaterial nature of the acquisitions, both individually, and in the aggregate, the Company has not included full year pro-forma results of operations for the acquisition year or previous years.
The following table summarizes the fair value of amortizable intangible assets as of the acquisition dates:
| (in thousands) |
APPI | SCI | ||||||||||||||
| Fair Value |
Weighted Average Useful Life (Years) |
Fair Value |
Weighted Average Useful Life (Years) |
|||||||||||||
| Amortizable intangible assets: |
||||||||||||||||
| Customer relationships |
$ | 300 | 10 | $ | 7,900 | 8 | ||||||||||
| Other |
180 | 4 | 2,700 | 14 | ||||||||||||
|
|
|
|
|
|||||||||||||
| Total amortizable intangible assets |
$ | 480 | $ | 10,600 | ||||||||||||
|
|
|
|
|
|||||||||||||
The SCI purchase agreement contains a provision for contingent consideration requiring the Company to pay the former owners an amount not to exceed $500 upon achieving certain performance targets. The Company recorded $190 reported in Accrued and other current liabilities as the best estimate of fair value of the contingent consideration on the opening balance sheet. The fair value estimate is considered a Level 3 measurement in accordance with the fair value hierarchy and the range of possible outcomes does not differ materially from the amount recorded. The Company finalized the valuation of assets acquired and liabilities assumed included in the tables above during fiscal year 2015.
Fiscal Year 2014 Transactions—On October 11, 2013, PPC acquired substantially all of the assets of EP Lenders II, LLC d/b/a Ridgeline. The aggregate purchase price for the assets was $39,787. The purchase price was funded from borrowings under the ABL Credit Facility. Ridgeline manufactures and sells PVC conduit, fittings, elbows and plumbing products, which complements the Company’s current conduit businesses in the Company’s Electrical Raceway reportable segment. The Company incurred approximately $267 and $146 during the years ended September 26, 2014 and September 27, 2013, respectively for acquisition-related expenses for both transactions which were recorded as a component of selling, general and administrative expenses in the Company’s Consolidated Statement of Operations. Due to the immaterial nature of the acquisition, the Company has not included full year pro-forma results of operations for the acquisition year or previous years.
The following table summarizes the Level 3 fair values assigned to the net assets acquired and liabilities assumed as of the October 11, 2013 acquisition date:
| (in thousands) |
Ridgeline | |||
| Fair value of consideration transferred: |
||||
| Cash consideration |
$ | 39,787 | ||
|
|
|
|||
| Fair value of assets acquired and liabilities assumed: |
||||
| Accounts receivable |
3,445 | |||
| Inventories |
2,510 | |||
| Intangible assets |
15,890 | |||
| Fixed assets |
10,551 | |||
| Accounts payable |
(2,218 | ) | ||
|
|
|
|||
| Net assets acquired |
30,178 | |||
|
|
|
|||
| Excess purchase price attributed to goodwill acquired |
$ | 9,609 | ||
|
|
|
|||
F-16
Table of Contents
The acquisition resulted in the recognition of $9,609 of goodwill, which is nondeductible for income tax purposes. The goodwill arising from the acquisition consists largely of the synergies and economies of scale expected from combining the acquisitions with current businesses.
The following table summarizes the fair value of amortizable intangible assets as of the acquisition date:
| (in thousands) |
Ridgeline | |||||||
| Fair Value | Weighted Average Useful Life (Years) |
|||||||
| Amortizable intangible assets: |
||||||||
| Customer relationships |
$ | 15,600 | 10 | |||||
| Other |
290 | 2 | ||||||
|
|
|
|||||||
| Total amortizable intangible assets |
$ | 15,890 | ||||||
|
|
|
|||||||
Fiscal Year 2013 Transactions—On September 17, 2013, PPC, a wholly owned indirect subsidiary of the Company, purchased substantially all of the assets of Heritage Plastics. The aggregate purchase price for the assets was $94,529, paid in cash in the amount of $98,671 at the closing, subject to various adjustments relating to working capital as set forth in the acquisition agreement, and $1,002 of deferred cash payment related to an above market property lease arrangement between PPC and Milford Rental LLC, a company owned by the prior owners of Heritage Plastics. The $1,002 of deferred cash payment is the present value of the lease payment variance that is above market rate over the five-year lease term. The purchase price was funded from cash on hand and borrowings under the ABL Credit Facility. Heritage Plastics manufactures and sells PVC conduit, fittings, elbows and plumbing products. The Company received a working capital adjustment of $5,042 in accordance with the acquisition agreement, which adjusted the purchase price allocation.
Additionally, PPC purchased certain fixed assets and inventory of Liberty Plastics, LLC (“Liberty Plastics”) on September 17, 2013. The aggregate purchase price was $3,579, subject to various adjustments related to working capital as set forth in the acquisition agreement. The purchase price was funded from cash on hand and borrowings under the ABL Credit Facility. Liberty Plastics manufactures and sells PVC conduit, fittings, elbows and plumbing products.
Heritage Plastics and Liberty Plastics were related businesses having shared management immediately prior to the acquisition. Consequently, the two acquisitions were aggregated and accounted for as a single business combination in the Company’s Electrical Raceway reportable segment, whereby allocating the purchase price to tangible and intangible assets acquired and liabilities assumed, based on their estimated fair values. The Company incurred approximately $517 and $379 during the years ended September 26, 2014 and September 27, 2013, respectively for acquisition-related expenses for both transactions which were recorded as a component of selling, general and administrative expenses in the Company’s Consolidated Statement of Operations.
F-17
Table of Contents
The following table summarizes the Level 3 fair values assigned to the net assets acquired and liabilities assumed as of the September 17, 2013 acquisition date:
| (in thousands) |
Heritage Plastics and Liberty Plastics |
|||
| Fair value of consideration transferred: |
||||
| Cash consideration |
$ | 98,108 | ||
|
|
|
|||
| Fair value of assets acquired and liabilities assumed: |
||||
| Accounts receivable |
23,130 | |||
| Inventories |
13,230 | |||
| Intangible assets |
42,830 | |||
| Fixed assets |
17,450 | |||
| Accounts payable |
(13,922 | ) | ||
|
|
|
|||
| Net assets acquired |
82,718 | |||
|
|
|
|||
| Excess purchase price attributed to goodwill acquired |
$ | 15,390 | ||
|
|
|
|||
The acquisition resulted in the recognition of $15,390 of goodwill, which is nondeductible for income tax purposes. The goodwill arising from the acquisition consists largely of the synergies and economies of scale expected from combining the acquisitions with current businesses.
The following table summarizes the fair value of amortizable intangible assets as of the acquisition date:
| (in thousands) |
Heritage Plastics and Liberty Plastics |
|||||||
| Fair Value |
Weighted Average Useful Life (Years) |
|||||||
| Amortizable intangible assets: |
||||||||
| Customer relationships |
$ | 37,230 | 11 | |||||
| Trademark |
5,600 | 10 | ||||||
|
|
|
|||||||
| Total amortizable intangible assets |
$ | 42,830 | ||||||
|
|
|
|||||||
Pro Forma Impact of Acquisition
The following table presents unaudited pro forma results of operations for the fiscal year ended September 27, 2013 as if the acquisitions had occurred as of the first day of the fiscal 2012 period:
| For the year ended September 27, 2013 | ||||
| Pro forma net sales |
1,592,185 | |||
| Pro forma net loss |
(42,404 | ) | ||
The pro forma condensed financial information is presented for illustrative purposes only and does not indicate the actual financial results of the Company if the closing of the Heritage Plastics and Liberty Plastics acquisitions had been completed on September 29, 2012, nor is it indicative of the results of operations in future periods. Included in the unaudited pro forma financial information for the year ended September 27, 2013 were pro forma adjustments to reflect the results of operations of Heritage Plastics and Liberty Plastics as well as the impact of amortizing certain acquisition accounting adjustments such as amortizable intangible assets. The pro forma financial information neither indicates the impact of possible business model changes nor considers any potential impact of current market conditions, expense efficiencies or other factors.
F-18
Table of Contents
3. RELATED PARTY TRANSACTIONS
Transactions between the Company, CD&R and affiliates of CD&R and Tyco are considered related party.
Prior to April 9, 2014, the Company paid a $6,000 annual advisory fee to CD&R and Tyco based on their pro-rata ownership percentages. The fees were paid quarterly, in advance and recorded as a component of selling, general and administrative expenses in the Company’s Consolidated Statement of Operations. In fiscal 2014, the Company’s third quarter consulting fee paid to Tyco was prorated through April 9, 2014. Subsequent to April 9, 2014, CD&R’s annual consulting fee was reduced to $3,500.
Consulting fees were $3,500, $4,854, and $6,000 for the years ended September 25, 2015, September 26, 2014 and September 27, 2013, respectively.
As a result of the sale of their ownership interest on April 9, 2014, Tyco is no longer considered a related party and is not reported as such for periods after that date. Additionally, affiliates of CD&R owned equity positions in one of the Company’s customers until fiscal 2014 and another of the Company’s customers until fiscal 2015. The following table presents information regarding related party transactions with these customers:
| For the Year Ended | ||||||||||||||||
| September 26, 2014 | September 27, 2013 | |||||||||||||||
| (in thousands) |
Tyco and affiliates | CD&R affiliates | Tyco and affiliates | CD&R affiliates | ||||||||||||
| Net sales |
$ | 5,933 | $ | 105,681 | $ | 10,080 | $ | 82,393 | ||||||||
| Cost of sales |
4,943 | 78,019 | 8,294 | 64,201 | ||||||||||||
4. INVENTORIES, NET
As of September 25, 2015 and September 26, 2014, inventories comprised:
| (in thousands) |
September 25, 2015 |
September 26, 2014 |
||||||
| Purchased materials and manufactured parts, net |
$ | 42,562 | $ | 87,714 | ||||
| Work in process, net |
13,360 | 25,362 | ||||||
| Finished goods, net |
111,743 | 139,917 | ||||||
| LIFO reserve |
(5,741 | ) | (26,892 | ) | ||||
|
|
|
|
|
|||||
| Inventories, net |
$ | 161,924 | $ | 226,101 | ||||
|
|
|
|
|
|||||
As of September 25, 2015 and September 26, 2014, the excess and obsolete inventory reserve was $10,201 and $10,290, respectively.
Approximately 80% and 85% of the Company’s inventories are valued at the lower of LIFO cost or market at September 25, 2015 and September 26, 2014, respectively. During 2015 and 2013, a reduction in inventories resulted in a liquidation of applicable LIFO inventory quantities carried at a lower cost. Cost of sales were $32,075 and $7,751 lower as a result of these liquidations.
The Company recorded a $11,073 and $2,918 charge for the years ended September 25, 2015 and September 26, 2014, respectively, as a component of Cost of sales. The charge represents write-down of the carrying value of inventory, whose estimated market value was lower than the Company’s LIFO carrying cost for the years ended September 25, 2015 and September 26, 2014, respectively.
F-19
Table of Contents
5. PROPERTY, PLANT AND EQUIPMENT
As of September 25, 2015 and September 26, 2014, property, plant and equipment at cost and accumulated depreciation were:
| (in thousands) |
September 25, 2015 |
September 26, 2014 |
||||||
| Land |
$ | 13,294 | $ | 14,493 | ||||
| Buildings and related improvements |
104,315 | 109,724 | ||||||
| Machinery and equipment |
231,237 | 231,247 | ||||||
| Leasehold improvements |
5,572 | 4,512 | ||||||
| Construction in progress |
10,582 | 14,691 | ||||||
|
|
|
|
|
|||||
| Property, plant and equipment |
365,000 | 374,667 | ||||||
| Accumulated depreciation |
(140,716 | ) | (121,380 | ) | ||||
|
|
|
|
|
|||||
| Property, plant and equipment, net |
$ | 224,284 | $ | 253,287 | ||||
|
|
|
|
|
|||||
Depreciation expense for the fiscal years ended September 25, 2015, September 26, 2014 and September 27, 2013, totaled $37,362, $37,837 and $33,095, respectively.
6. GOODWILL AND INTANGIBLE ASSETS
Goodwill
Changes in the carrying amount of goodwill were as follows:
| Segment | ||||||||||||
| (in thousands) |
Electrical Raceway |
Mechanical Products & Solutions |
Total | |||||||||
| Balance as of September 27, 2013 |
||||||||||||
| Goodwill |
$ | 66,523 | $ | 84,800 | $ | 151,323 | ||||||
| Goodwill acquired during year |
9,599 | 652 | 10,251 | |||||||||
| Purchase accounting adjustments |
(869 | ) | (3,263 | ) | (4,132 | ) | ||||||
| Impairment losses |
— | (43,000 | ) | (43,000 | ) | |||||||
|
|
|
|
|
|
|
|||||||
| Total |
$ | 75,253 | $ | 39,189 | $ | 114,442 | ||||||
| Balance as of September 26, 2014 |
||||||||||||
| Goodwill |
$ | 75,253 | $ | 82,189 | $ | 157,442 | ||||||
| Accumulated impairment losses |
— | (43,000 | ) | (43,000 | ) | |||||||
|
|
|
|
|
|
|
|||||||
| Total |
75,253 | 39,189 | 114,442 | |||||||||
| Goodwill acquired during year |
5,311 | — | 5,311 | |||||||||
| Impairment losses |
(3,924 | ) | — | (3,924 | ) | |||||||
|
|
|
|
|
|
|
|||||||
| Total |
$ | 76,640 | $ | 39,189 | $ | 115,829 | ||||||
| Balance as of September 25, 2015 |
||||||||||||
| Goodwill |
$ | 80,564 | $ | 82,189 | $ | 162,753 | ||||||
| Accumulated impairment losses |
(3,924 | ) | (43,000 | ) | (46,924 | ) | ||||||
|
|
|
|
|
|
|
|||||||
| Total |
$ | 76,640 | $ | 39,189 | $ | 115,829 | ||||||
The Company assesses the recoverability of goodwill on an annual basis in accordance with ASC 350—“Intangibles—Goodwill and Other.” The measurement date is the first day of the fourth fiscal quarter, or more frequently, if triggering events occur. This assessment employs a two-step approach. The first step compares the fair value of a reporting unit with its carrying amount, including goodwill. If a reporting unit’s carrying amount exceeds its fair value, a goodwill impairment may exist. The second part of the test compares the implied fair value of goodwill with its carrying amount.
F-20
Table of Contents
The assumptions used in the goodwill impairment testing process involve various judgments and estimates, and are subject to inherent uncertainties and subjectivity. The analysis estimates numerous factors, including future sales, gross profit, selling, general and administrative expense rates and capital expenditures. These estimates are based on the Company’s business plans and forecasts. These estimated cash flows are then discounted, which necessitates the selection of an appropriate discount rate. The discount rate used reflects the market-based estimates of the risks associated with the projected cash flows of the reporting unit.
The Company’s acquisition of SCI was treated as a separate reporting unit for which all of the goodwill ascribed from the purchase price allocation was assigned. SCI’s fiscal 2015 operating performance was below the Company’s initial projections. Post-acquisition, SCI’s net sales and earnings degraded in part due to a shift in the mix of products sold to a key customer. This customer historically purchased a disproportionate amount of higher margin product for use in a particular geographic end market. During the year, the volume shifted to lower margin product. Additionally, the customer began fulfilling a portion of their demand from a second source. The shift in product mix and volume decline prompted the Company to revisit the long-term projected forecast for this customer and its relative impact on the entire reporting unit.
The Company’s revised long-term projections were used in Step 1 of the goodwill impairment analysis. The first step of the goodwill impairment test indicated that the carrying value of the reporting unit, including goodwill, exceeded the fair value of the reporting unit requiring the second step of the test in the fourth quarter. The implied fair value in Step 2 revealed a $3,924 non-cash impairment, which is considered a Level 3 fair value measurement in accordance with the fair value hierarchy. As a result, there is no more goodwill ascribed to this reporting unit. The non-cash impairment charge was recorded as a component of Asset impairment charges in the Company’s Statements of Operations.
The Company concluded that the circumstances surrounding this customer constituted a triggering event in accordance with ASC 360—Property, Plant & Equipment. The Company compared the estimated undiscounted cash flows of the finite-lived customer relationship intangible asset to its carrying value to assess the recoverability. As the undiscounted cash flows related to the customer relationship intangible asset exceeded its carrying value, the Company did not proceed to the second step of the impairment test.
In fiscal year 2014, the Company recorded a $43,000 non-cash impairment charge related to a reporting unit in our MP&S reportable segment. The resulting implied fair value of goodwill is considered a Level 3 fair value measurement in accordance with the fair value hierarchy. This non-cash goodwill impairment was driven by changes in market conditions, the reporting unit’s actual results in fiscal 2014 that were below amounts estimated in fiscal 2013 and revisions to the reporting unit’s growth projections. Although this market had improved in 2014, the recovery related to steel products was expected to be slower compared to markets that buy copper and PVC products. The non-cash impairment charge was recorded as a component of Asset impairment charges in the Company’s Statements of Operations.
Intangible Assets—The Company also assesses annually the recoverability of its indefinite-lived trade names in accordance with ASC 350. The Company uses the relief from royalty method, an income approach method, to quantify the fair value of its trade names. The measurement date is the first day of the fourth fiscal quarter, or more frequently, if triggering events occur. In fiscal year 2015, there were no trade names whose carrying values were in excess of their fair values. In fiscal year 2014, two of the Company’s trade names, Razor Ribbon and Columbia MBF, in our MP&S reporting unit had carrying values in excess of their fair values. There is no second step when measuring impairment of indefinite-lived intangible assets. The Company recorded a $939 non-cash impairment charge for the year ended September 26, 2014 related to the Razor Ribbon and Columbia MBF trade names related to our MP&S reporting units, which is considered a Level 3 fair value measurement in accordance with the fair value hierarchy. This impairment was recorded prior to conducting the second step of the goodwill impairment test. The impairment was due to a contraction in the long-term growth projections of products sold under these trade names.
F-21
Table of Contents
The Company also considered potential impairment indicators associated with other finite-lived intangible assets, including its customer relationships, patents, and noncompete agreements. An impairment is recognized if the carrying value of an asset or asset group exceeds the estimated undiscounted future cash flows expected to result from the use of the asset or asset group and its eventual disposition. The Company’s key customers are primarily wholesale and national distributors. The terms of these relationships are based on purchase orders and are not contractually based. Customer relationships are amortized over their useful lives, ranging from 6 to 14 years. The Company evaluates the appropriateness of remaining useful lives based on customer attrition rates. Other intangible assets are amortized over their estimated useful lives, ranging from 2 to 20 years. The Company concluded that it was more likely than not that the fair value of the intangible assets would exceed their carrying value.
The following table provides the gross carrying value, accumulated amortization, and net carrying value for each major class of intangible assets:
| September 25, 2015 | September 26, 2014 | |||||||||||||||||||||||||||
| (in thousands) |
Weighted Average Useful Life (Years) |
Gross Carrying Value |
Accumulated Amortization |
Net Carrying Value |
Gross Carrying Value |
Accumulated Amortization |
Net Carrying Value |
|||||||||||||||||||||
| Amortizable intangible assets: |
||||||||||||||||||||||||||||
| Customer relationships |
12 | $ | 249,245 | $ | (77,112 | ) | $ | 172,133 | $ | 241,045 | $ | (57,031 | ) | $ | 184,014 | |||||||||||||
| Other |
7 | 16,943 | (5,781 | ) | 11,162 | 13,923 | (3,759 | ) | 10,164 | |||||||||||||||||||
|
|
|
|
|
|
|
|
|
|
|
|
|
|||||||||||||||||
| Total |
266,188 | (82,893 | ) | 183,295 | 254,968 | (60,790 | ) | 194,178 | ||||||||||||||||||||
| Indefinite-lived intangible assets: |
||||||||||||||||||||||||||||
| Trade names |
93,880 | — | 93,880 | 93,880 | — | 93,880 | ||||||||||||||||||||||
|
|
|
|
|
|
|
|
|
|
|
|
|
|||||||||||||||||
| Total |
$ | 360,068 | $ | (82,893 | ) | $ | 277,175 | $ | 348,848 | $ | (60,790 | ) | $ | 288,058 | ||||||||||||||
|
|
|
|
|
|
|
|
|
|
|
|
|
|||||||||||||||||
Amortization expense for the fiscal years ended September 25, 2015, September 26, 2014 and September 27, 2013 each totaled $22,103, $20,857 and $15,317, respectively. Expected amortization expense for intangible assets over the next five years and thereafter is as follows:
| (in thousands) |
||||
| 2016 |
$ | 22,069 | ||
| 2017 |
21,776 | |||
| 2018 |
21,267 | |||
| 2019 |
21,194 | |||
| 2020 |
20,980 | |||
| Thereafter |
76,009 | |||
Actual amounts of amortization may differ from estimated amounts due to additional intangible asset acquisitions, impairment of intangible assets, and other events.
F-22
Table of Contents
7. ACCRUED AND OTHER CURRENT LIABILITIES
As of September 25, 2015 and September 26, 2014, accrued and other current liabilities comprised:
| (in thousands) |
September 25, 2015 |
September 26, 2014 |
||||||
| Accrued compensation and employee benefits |
$ | 31,146 | $ | 21,965 | ||||
| Accrued transportation costs |
13,627 | 12,631 | ||||||
| Accrued interest |
9,890 | 9,133 | ||||||
| Deferred gain on sale of investment |
9,121 | 4,560 | ||||||
| Product liability |
2,700 | 2,700 | ||||||
| Accrued professional services |
6,535 | 5,815 | ||||||
| Accrued restructuring |
4,413 | 1,592 | ||||||
| Other |
19,840 | 17,045 | ||||||
|
|
|
|
|
|||||
| Accrued and other current liabilities |
$ | 97,272 | $ | 75,441 | ||||
|
|
|
|
|
|||||
8. DEBT
Debt as of September 25, 2015 and September 26, 2014 was as follows:
| (in thousands) |
September 25, 2015 |
September 26, 2014 |
||||||
| First lien loan due April 9, 2021 |
$ | 414,150 | $ | 418,050 | ||||
| Second lien loan due October 9, 2021 |
248,036 | 247,679 | ||||||
| Asset-based credit facility |
— | 40,000 | ||||||
| Deferred financing costs |
(11,622 | ) | (14,494 | ) | ||||
| Other |
1,644 | 1,632 | ||||||
|
|
|
|
|
|||||
| Total debt |
652,208 | 692,867 | ||||||
| Current portion |
2,864 | 42,887 | ||||||
|
|
|
|
|
|||||
| Long-term debt |
$ | 649,344 | $ | 649,980 | ||||
|
|
|
|
|
|||||
During fiscal year 2015, the Company adopted ASU 2015-03, which requires an entity to present deferred financing costs as a direct deduction from the related debt liability rather than as an asset on the balance sheet. As a result, debt issuance costs of $2,945 were reclassified from Prepaid expenses and other current assets to Borrowings under credit facility, short-term debt and current maturities of long-term debt as of September 26, 2014. Additionally, debt issuance costs of $11,549 were reclassified from Other assets to Long-term debt as of September 26, 2014.
Term Loan Facilities—On April 9, 2014, Atkore International entered into a credit agreement for the $420,000 First Lien Term Loan Facility (the “First Lien Term Loan Facility”), and a credit agreement for the $250,000 Second Lien Term Loan Facility (the “Second Lien Term Loan Facility” and together with the First Lien Term Loan Facility, the “Term Loan Facilities”). The First Lien Term Loan Facility was priced at 99.5%, has an interest rate of LIBOR plus 3.5% with a LIBOR floor of 1.00%, and matures on April 9, 2021. The Second Lien Term Loan Facility was priced at 99.0%, has an interest rate of LIBOR plus 6.75% with a LIBOR floor of 1.00%, and matures on October 9, 2021. The Term Loan Facilities contain covenants typical for this type of financing, including limitations on indebtedness, restricted payments including dividends, liens, restrictions on distributions from restricted subsidiaries, sales of assets, affiliate transactions, mergers and consolidations. The Term Loan Facilities also contain customary events of default typical for this type of financing, including, without limitation, failure to pay principal and/or interest when due, failure to observe covenants, certain events of bankruptcy, the rendering of certain judgments, or the loss of any guarantee. Atkore International used the proceeds from the Term Loan Facilities to redeem the Notes (as defined below) and to pay a dividend to Atkore Holdings, which in turn paid a dividend to the Company. The Company used the dividend proceeds to redeem 29.4 million shares of Common Stock held by Tyco Seller for an aggregate cash purchase price of $250,000.
F-23
Table of Contents
The approximate fair value of the First Lien Term Loan Facility was $397,089 and the Second Lien Term Loan Facility was $229,688 as of September 25, 2015. In determining the approximate fair value of its long-term debt, the Company used the trading value among financial institutions for the Term Loan Facilities, which were classified within Level 2 of the fair value hierarchy.
Notes—Atkore International issued Senior Secured Notes (the “Notes”) on December 22, 2010 in an aggregate principal amount of $410,000, due on January 1, 2018, with a coupon of 9.875%. The obligations under the Notes were senior to unsecured indebtedness of Atkore Holdings. Interest on the Notes was payable on a semi-annual basis, commencing on July 1, 2011. Atkore International’s obligations under the Notes were fully and unconditionally guaranteed on a stand-alone senior secured basis by Atkore Holdings and were fully and unconditionally guaranteed on a joint and several senior secured basis by each of Atkore International’s domestic subsidiaries that was a borrower or guarantor under the ABL Credit Facility and contained covenants typical for this type of financing. Atkore International redeemed $41,000 of the Notes on November 25, 2013 pursuant to the terms of the indenture governing the Notes at a redemption price of 103% of the principal amount redeemed, plus interest accrued to the redemption date. The redemption of the Notes resulted in a loss on extinguishment of debt of $2,754, including an early redemption premium of $1,230 and a write-off of $1,524 of unamortized debt issuance costs related to the Notes. The remaining Notes were redeemed on April 9, 2014 pursuant to the terms of the indenture governing the Notes at a redemption price of 107.406% of the principal amount redeemed, plus interest accrued to the redemption date, using the proceeds from the April 9, 2014 refinancing. The April 9, 2014 redemption of the Notes resulted in a loss on extinguishment of debt of $40,913, including an early redemption premium of $27,328, a write-off of $12,617 of unamortized debt issuance costs, incremental interest expense of $835, and additional legal fees of $133 related to the Notes.
ABL Credit Facility—On December 17, 2014, Atkore International exercised $25,000 of the accordion provision contained in the credit agreement governing the ABL Credit Facility, dated December 22, 2010 and as amended, which increased the aggregate commitments of the lenders from $300,000 to $325,000. Exercising the accordion provision resulted in the payment of fees of $102. On April 9, 2014, Atkore International entered into the Third Amendment to the ABL Credit Facility. The April 9, 2014 amendment incorporated changes necessary to accommodate the repurchase of outstanding shares of Common Stock held by Tyco Seller and the entry into the Term Loan Facilities. On October 23, 2013, Atkore International entered into the Second Amendment to the ABL Credit Facility, which increased the aggregate commitments of the lenders to $300,000, reduced interest spreads and amended certain other terms. Atkore International was not subject to the minimum fixed charge coverage ratio during any period subsequent to the establishment of the ABL Credit Facility.
As of September 25, 2015 and September 26, 2014, $0 and $40,000 were drawn under the ABL Credit Facility, respectively. The ABL Credit Facility is guaranteed by Atkore Holdings and the U.S. operating companies owned by Atkore International. Atkore International’s availability under the ABL Credit Facility was $255,755 and $245,430 as of September 25, 2015 and September 26, 2014, respectively. Availability under the ABL Credit Facility is subject to a borrowing base equal to the sum of 85% of eligible accounts receivable plus 80% of eligible inventory of each borrower and guarantor, subject to certain limitations. The interest rate on the ABL Credit Facility is LIBOR plus an applicable margin ranging from 1.50% to 2.00%, or an alternate base rate for U.S. Dollar denominated borrowings plus an applicable margin ranging from 0.50% to 1.00%. The ABL Credit Facility matures on October 23, 2018. The ABL Credit Facility contains customary representations and warranties and customary affirmative and negative covenants. Affirmative covenants include, without limitation, the timely delivery of quarterly and annual financial statements, certifications to be made by Atkore Holdings, payment of obligations, maintenance of corporate existence and insurance, notices, compliance with environmental laws, and the grant of liens on after acquired property. The negative covenants include, without limitation, the following: limitations on indebtedness, dividends and distributions, investments, prepayments or redemptions of subordinated indebtedness, amendments of subordinated indebtedness, transactions with affiliates, asset sales, mergers, consolidations and sales of all or substantially all assets, liens, negative pledge clauses, changes in fiscal periods, changes in line of business and changes in charter documents. Additionally, if the availability under the ABL Credit Facility falls below certain levels, Atkore Holdings would subsequently be required to maintain a minimum fixed charge coverage ratio.
F-24
Table of Contents
The Company’s remaining financial instruments consist primarily of cash and cash equivalents, accounts receivable and accounts payable.
9. INCOME TAXES
Significant components of loss from continuing operations and income tax expense for the fiscal years ended September 25, 2015, September 26, 2014 and September 27, 2013 consisted of the following:
| For the Year Ended | ||||||||||||
| (in thousands) |
September 25, 2015 |
September 26, 2014 |
September 27, 2013 |
|||||||||
| Components of loss from continuing operations before income taxes: |
||||||||||||
| United States |
$ | (11,739 | ) | $ | (107,722 | ) | $ | (14,180 | ) | |||
| Non-U.S. |
3,868 | 835 | (7,367 | ) | ||||||||
|
|
|
|
|
|
|
|||||||
| Loss from continuing operations before income taxes |
$ | (7,871 | ) | $ | (106,887 | ) | $ | (21,547 | ) | |||
|
|
|
|
|
|
|
|||||||
| Income tax benefit |
||||||||||||
| Current: |
||||||||||||
| United States: |
||||||||||||
| Federal |
$ | (2,017 | ) | $ | 195 | $ | 331 | |||||
| State |
1,562 | 1,502 | 1,605 | |||||||||
| Non-U.S. |
1,189 | 1,874 | 1,060 | |||||||||
|
|
|
|
|
|
|
|||||||
| Current income tax expense |
$ | 734 | $ | 3,571 | $ | 2,996 | ||||||
| Deferred: |
||||||||||||
| United States: |
||||||||||||
| Federal |
$ | (3,721 | ) | $ | (31,690 | ) | $ | (6,673 | ) | |||
| State |
(929 | ) | (2,925 | ) | (146 | ) | ||||||
| Non-U.S. |
1,000 | (1,895 | ) | 857 | ||||||||
|
|
|
|
|
|
|
|||||||
| Deferred income tax |
(3,650 | ) | (36,510 | ) | (5,962 | ) | ||||||
|
|
|
|
|
|
|
|||||||
| Income tax benefit |
$ | (2,916 | ) | $ | (32,939 | ) | $ | (2,966 | ) | |||
|
|
|
|
|
|
|
|||||||
The mix of foreign losses and domestic losses, along with rate reconciling items as outlined below, impacts the effective tax rate for the periods. Differences between the statutory federal income tax rate and effective income tax rate are summarized below:
| For the Year Ended | ||||||||||||
| September 25, 2015 |
September 26, 2014 |
September 27, 2013 |
||||||||||
| Statutory federal tax |
35 | % | 35 | % | 35 | % | ||||||
| Adjustments to reconcile to the effective income tax rate: |
||||||||||||
| State income taxes |
1 | % | 2 | % | 3 | % | ||||||
| Nondeductible expenses |
(7 | )% | (1 | )% | (8 | )% | ||||||
| Valuation allowance |
(15 | )% | — | % | (16 | )% | ||||||
| Foreign rate differential |
3 | % | — | % | 1 | % | ||||||
| U.S. tax effects of unremitted foreign earnings |
— | % | 2 | % | — | % | ||||||
| Nondeductible goodwill impairment |
— | % | (11 | )% | — | % | ||||||
| Changes in tax rate |
— | % | — | % | (3 | )% | ||||||
| Finalization of Federal audits |
— | % | 4 | % | — | % | ||||||
| Prior period adjustments |
(2 | )% | — | % | 1 | % | ||||||
| Indemnified uncertain tax benefits |
22 | % | — | % | — | % | ||||||
| Other |
— | % | — | % | 1 | % | ||||||
|
|
|
|
|
|
|
|||||||
| Effective income tax rate |
37 | % | 31 | % | 14 | % | ||||||
|
|
|
|
|
|
|
|||||||
F-25
Table of Contents
The Company’s effective tax rate for fiscal 2015 differs from the statutory rate due to a $1,779 tax benefit from the release of indemnified uncertain tax positions offset by nondeductible expenses and additional valuation allowance against deferred tax assets and foreign jurisdictions in which the deferred tax assets are not expected to be realized.
The Company’s effective tax rate for fiscal 2014 differs from the statutory rate due to $34,577 of nondeductible goodwill impairment, additional federal net operating losses recognized from the closure of a federal audit for prior periods, and the tax benefit from income of certain foreign subsidiaries deemed indefinitely reinvested. The remaining $8,423 of goodwill impairment is deductible for tax purposes.
The Company’s effective tax rate for fiscal 2013 differs from the statutory rate primarily as a result of nondeductible expenses and losses incurred without an associated tax benefit in certain foreign jurisdictions that have a full valuation allowance against deferred tax assets and foreign jurisdictions in which the deferred tax assets are not expected to be realized.
Deferred income taxes result from temporary differences between the amount of assets and liabilities recognized for financial reporting and tax purposes. The components of the net deferred income tax asset are as follows:
| (in thousands) |
September 25, 2015 |
September 26, 2014 |
||||||
| Deferred tax assets: |
||||||||
| Accrued liabilities and reserves |
$ | 32,494 | $ | 23,457 | ||||
| Tax loss and credit carryforwards |
18,699 | 36,302 | ||||||
| Postretirement benefits |
11,481 | 7,050 | ||||||
| Inventory |
18,481 | 22,425 | ||||||
| Other |
793 | 1,313 | ||||||
|
|
|
|
|
|||||
| $ | 81,948 | $ | 90,547 | |||||
|
|
|
|
|
|||||
| Deferred tax liabilities: |
||||||||
| Property, plant and equipment |
$ | (10,456 | ) | $ | (20,443 | ) | ||
| Intangible assets |
(77,430 | ) | (83,231 | ) | ||||
|
|
|
|
|
|||||
| $ | (87,886 | ) | $ | (103,674 | ) | |||
|
|
|
|
|
|||||
| Net deferred tax liability before valuation allowance |
$ | (5,938 | ) | $ | (13,127 | ) | ||
| Valuation allowance |
(7,532 | ) | (7,708 | ) | ||||
|
|
|
|
|
|||||
| Net deferred tax liability |
$ | (13,470 | ) | $ | (20,835 | ) | ||
|
|
|
|
|
|||||
During fiscal year 2015, the Company adopted ASU 2015-017, which requires an entity to present deferred tax assets and deferred tax liabilities as non-current in a classified balance sheet rather than as current and non-current. As of September 26, 2014, the Company reclassified $23,875 of current deferred taxes to non-current deferred taxes.
As of September 25, 2015, the Company has approximately $12,461 of federal and $97,625 of state net operating loss carryforwards, which expire beginning in 2017 through 2034. As a result of the Transactions, the federal net operating loss carryforwards are subject to Internal Revenue Code section 382, which provides an annual limitation on the amount of loss that can be used in future years. The Company does not expect the limitation to impact the ability to utilize the losses prior to their expiration. In certain non-U.S. jurisdictions the Company has net operating loss carryforwards of $35,138, which have an expiration period ranging from five years to unlimited.
Valuation allowances have been established on net operating losses and other deferred tax assets in Australia, China, France, and other foreign and U.S. state jurisdictions as a result of the Company’s
F-26
Table of Contents
determination that there is less than 50% likelihood that these assets will be realized. Evidence for this determination includes three year cumulative loss positions, future reversal of temporary differences, and expectations of future losses.
For the year ended September 25, 2015, the Company assessed the need for a valuation allowance against deferred tax assets in Australia as a result of significant evidence that the assets would no longer be realized. The significant evidence includes a cumulative three-year loss position and expected future losses in Australia. As a result, a full valuation allowance was established in Australia on current losses and other deferred tax assets. As of September 26, 2014, the Company has no longer recorded a valuation allowance against deferred tax assets in the United Kingdom as a result of significant positive evidence which includes three-year cumulative pre-tax income and expected future taxable income. As a result, the Company released $1,231 in valuation allowances, net of tax for the year ended September 26, 2014. For the year ended September 26, 2014, the Company assessed the need for a valuation allowance against deferred tax assets in France as a result of significant evidence that the assets would no longer be realized. The significant evidence includes a cumulative three-year loss position and expected future losses in France. As a result, a full valuation allowance was established in France on current losses and other deferred tax assets.
As of September 25, 2015, the Company had unrecognized tax benefits of $8,101, which, if recognized, would positively benefit the effective tax rate. For uncertainties arising in the post-Transactions period, the Company recognizes interest and penalties related to unrecognized tax benefits in income tax expense. As of September 25, 2015 and September 26, 2014, the Company had accrued interest and penalties of $5,497 and $6,093, respectively, in the consolidated balance sheets.
A reconciliation of the beginning and ending amount of unrecognized tax benefit, excluding interest and penalties, is as follows:
| (in thousands) |
For the Period from September 29, 2012 to September 25, 2015 |
|||
| Balance as of September 29, 2012 |
$ | 10,310 | ||
| Additions based on tax positions related to prior years |
3,959 | |||
| Settlements |
(105 | ) | ||
|
|
|
|||
| Balance as of September 27, 2013 |
14,164 | |||
| Additions based on tax positions related to prior years |
134 | |||
| Settlements |
(4,056 | ) | ||
|
|
|
|||
| Balance as of September 26, 2014 |
10,242 | |||
| Additions based on tax positions related to prior years |
69 | |||
| Settlements |
(2,210 | ) | ||
|
|
|
|||
| Balance as of September 25, 2015 |
$ | 8,101 | ||
|
|
|
|||
During fiscal year 2015, the balance of unrecognized tax benefits decreased by $2,210 as a result of completing tax audits and the expiration of the statute of limitations in various state jurisdictions.
During fiscal year 2014, the Company settled audits with the federal taxing jurisdiction resulting in a decrease of $3,809 in the balance of unrecognized tax benefits. The remaining $247 settlements in fiscal year 2014 relate to settling audits with various taxing jurisdictions.
Many of the Company’s uncertain tax positions relate to tax years that remain subject to audit by the taxing authorities. The following tax years remain subject to examination by the major tax jurisdictions as follows:
| Jurisdiction |
Years Open To Audit |
|||
| France |
2010 – 2012 | |||
| U.S. |
2010 – 2014 | |||
F-27
Table of Contents
The Company’s income tax returns are examined periodically by various taxing authorities. The Company’s federal tax returns for 2010 through 2012 are currently under examination by the Internal Revenue Service, and the Company is currently under examination in various state jurisdictions. Based on the current status of its income tax audits, the Company believes that it is reasonably possible that there would be no material changes to the unrecognized tax benefits in the next 12 months for a variety of unrecognized tax benefits. Should any unrecognized tax benefits be resolved, the Company will seek reimbursement from Tyco under the terms of the Investment Agreement relative to the periods prior to the Transactions.
Other Income Tax Matters—During fiscal 2015, the Company made no additional provision for U.S. or non-U.S. income taxes on the undistributed income of subsidiaries or for unrecognized deferred tax liabilities for temporary differences related to basis differences in investments in subsidiaries, as such income is expected to be indefinitely reinvested, the investments are essentially permanent in duration, or the Company has concluded that no additional tax liability will arise as a result of the distribution of such income.
During fiscal 2014, the Company recorded a deferred tax benefit of $2,069 related to the reversal of the deferred tax liability established in prior years for U.S. and non-U.S. income taxes on the undistributed income of subsidiaries, which the Company now considers to be indefinitely reinvested.
As of September 25, 2015, certain subsidiaries had approximately $21,438 of undistributed income that the Company intends to permanently reinvest. A liability could arise if the Company’s intention to permanently reinvest such income were to change and amounts are distributed by such subsidiaries or if such subsidiaries are ultimately disposed. It is not practicable to estimate the additional income taxes related to permanently reinvested income or the basis differences related to investments in subsidiaries.
The calculation of the Company’s tax liabilities involves dealing with uncertainties in the application of complex tax regulations in a multitude of jurisdictions across its global operations. The Company records tax liabilities for anticipated tax audit issues in the United States and other tax jurisdictions based on the Company’s estimate of whether, and the extent to which, additional taxes will be due. These tax liabilities are reflected net of related tax loss carry-forwards. The Company adjusts these reserves in light of changing facts and circumstances. However, due to the complexity of some of these uncertainties, the ultimate resolution may result in a payment that is materially different from the Company’s current estimate of the tax liabilities. For uncertain tax liabilities arising in the periods prior to the Transactions that are resolved in a future period, the Company plans to seek repayment from Tyco under the terms of the Investment Agreement. Accordingly, the Company has reflected those liabilities with an offsetting receivable due from Tyco of $12,853 on the consolidated balance sheet as of September 25, 2015. If the Company’s estimate of uncertain tax liabilities arising in the periods following the Transactions proves to be less than the ultimate assessment, an additional charge to expense would result. If payment of these amounts ultimately proves to be less than the recorded amounts, the reversal of the liabilities may result in income tax benefits being recognized in the period when the Company determines the liabilities are no longer necessary.
Under the terms of the Investment Agreement, Tyco has agreed to indemnify and hold harmless the Company and its subsidiaries and their respective affiliates from and against any taxes of the Company with respect to any tax period ending on or before the closing of the Transactions, as well as all tax liabilities relating to events or transactions occurring on or prior to the closing date of the Transactions. In addition, the Company has agreed to indemnify and hold harmless Tyco and its affiliates from and against any liability for any taxes of the Company with respect to any post-Transactions tax period.
10. POSTRETIREMENT BENEFITS
The Company has a number of noncontributory and contributory defined benefit retirement plans covering certain U.S. employees. Net periodic pension benefit cost is based on periodic actuarial valuations that use the projected unit credit method of calculation and is charged to the statements of operations on a systematic basis
F-28
Table of Contents
over the expected average remaining service lives of current participants. Contribution amounts are determined based on local regulations and with the assistance of professionally qualified actuaries in the countries concerned. The benefits under the defined benefit plans are based on various factors, such as years of service and compensation.
The net periodic benefit cost for the periods presented was as follows:
| For the Year Ended | ||||||||||||
| (in thousands) |
September 25, 2015 |
September 26, 2014 |
September 27, 2013 |
|||||||||
| Service cost |
$ | 2,509 | $ | 2,783 | $ | 3,076 | ||||||
| Interest cost |
4,784 | 4,850 | 4,382 | |||||||||
| Expected return on plan assets |
(6,803 | ) | (6,265 | ) | (5,593 | ) | ||||||
| Amortization of actuarial loss |
88 | — | 1,506 | |||||||||
|
|
|
|
|
|
|
|||||||
| Net periodic benefit cost |
$ | 578 | $ | 1,368 | $ | 3,371 | ||||||
|
|
|
|
|
|
|
|||||||
| Weighted-average assumptions used to determine net periodic pension cost during the period: |
||||||||||||
| Discount rate |
4.2 | % | 4.6 | % | 3.7 | % | ||||||
| Expected return on plan assets |
7.0 | % | 7.0 | % | 7.0 | % | ||||||
| Rate of compensation increase |
N/a | N/a | N/a | |||||||||
Amounts amortized from accumulated other comprehensive loss is as follows:
| For the Year Ended | ||||||||||||
| (in thousands) |
September 25, 2015 |
September 26, 2014 |
September 27, 2013 |
|||||||||
| Amortization of unrecognized actuarial loss |
$ | 88 | $ | — | $ | 1,506 | ||||||
The estimated net actuarial loss for pension benefit plans that will be amortized from accumulated other comprehensive loss into net periodic benefit cost over the next fiscal year is expected to be approximately $722.
F-29
Table of Contents
The change in benefit obligations, plan assets and the amounts recognized on the consolidated balance sheets was as follows:
| Change in benefit obligations: |
||||
| Benefit obligations as of September 27, 2013 |
$ | 107,300 | ||
| Service cost |
2,783 | |||
| Interest cost |
4,850 | |||
| Actuarial loss |
5,651 | |||
| Benefits and administrative expenses paid |
(3,936 | ) | ||
|
|
|
|||
| Benefit obligations as of September 26, 2014 |
116,648 | |||
| Service cost |
2,509 | |||
| Interest cost |
4,784 | |||
| Actuarial loss |
1,542 | |||
| Benefits and administrative expenses paid |
(4,283 | ) | ||
|
|
|
|||
| Benefit obligations as of September 25, 2015 |
$ | 121,200 | ||
|
|
|
|||
| Change in plan assets: |
||||
| Fair value of plan assets as of September 27, 2013 |
$ | 91,422 | ||
| Actual return on plan assets |
8,944 | |||
| Employer contributions |
3,390 | |||
| Benefits and administrative expenses paid |
(3,936 | ) | ||
|
|
|
|||
| Fair value of plan assets as of September 26, 2014 |
99,820 | |||
| Actual return on plan assets |
(3,566 | ) | ||
| Employer contributions |
1,103 | |||
| Benefits and administrative expenses paid |
(4,283 | ) | ||
|
|
|
|||
| Fair value of plan assets as of September 25, 2015 |
$ | 93,074 | ||
|
|
|
|||
| Funded status as of September 25, 2015 |
$ | (28,126 | ) | |
|
|
|
| September 25, 2015 |
September 26, 2014 |
|||||||
| Amounts recognized in the consolidated balance sheets consist of: |
||||||||
| Pension liabilities |
$ | (28,126 | ) | $ | (17,014 | ) | ||
|
|
|
|
|
|||||
| Net amount recognized |
$ | (28,126 | ) | $ | (17,014 | ) | ||
|
|
|
|
|
|||||
| Amounts recognized in accumulated other comprehensive loss (before income taxes) consist of: |
||||||||
| Net actuarial loss |
$ | (21,189 | ) | $ | (9,367 | ) | ||
|
|
|
|
|
|||||
| Total loss recognized |
$ | (21,189 | ) | $ | (9,367 | ) | ||
|
|
|
|
|
|||||
| Weighted-average assumptions used to determine pension benefit obligations at year end: |
||||||||
| Discount rate |
4.2 | % | 4.2 | % | ||||
| Rate of compensation increase |
N/a | N/a | ||||||
In accordance with ASU 2015-04 “Compensation—Retirement Benefits (Topic 715): Practical Expedient for the Measurement Date of an Employer’s Defined Benefit Obligation and Plan Assets,” the Company measured its fiscal 2015 pension liabilities on September 30, 2015, the last day of the month closest to the end of the fiscal year. Fiscal 2014 pension liabilities were measured as of the last day of the fiscal year, September 26, 2014. In determining the expected return on plan assets, the Company considers the relative weighting of plan assets by class, historical performance of asset classes over long-term periods, asset class performance expectations as well as current and future economic conditions. The Company’s investment strategy for its pension plans is to manage the plans on a going-concern basis. Current investment policy is to maximize the
F-30
Table of Contents
return on assets, subject to a prudent level of portfolio risk, for the purpose of enhancing the security of benefits for participants. For the pension plans, this policy targets a 60% allocation to equity securities and a 40% allocation to debt securities.
Pension plans have the following weighted-average asset allocations:
| September 25, 2015 |
September 26, 2014 |
|||||||
| Asset Category: |
||||||||
| Equity securities |
59 | % | 61 | % | ||||
| Debt securities |
40 | % | 38 | % | ||||
| Cash and cash equivalents |
1 | % | 1 | % | ||||
|
|
|
|
|
|||||
| Total |
100 | % | 100 | % | ||||
|
|
|
|
|
|||||
The Company evaluates its defined benefit plans’ asset portfolios for the existence of significant concentrations of risk. Such as investments in a single entity, industry, foreign country and individual fund manager. As of September 25, 2015, there were no significant concentrations of risk in the Company’s defined benefit plan assets.
The Company’s plan assets are accounted for at fair value and are classified in their entirety based on the lowest level of input that is significant to the fair value measurement. The Company’s assessment of the significance of a particular input to the fair value measurement requires judgment, and may affect the valuation of fair value of assets and their placement within the fair value hierarchy levels. The Company’s asset allocations by level within the fair value hierarchy for the years ended September 25, 2015 and September 26, 2014, are presented in the table below for the Company’s defined benefit plans.
| September 25, 2015 | September 26, 2014 | |||||||||||||||||||||||||||||||
| (in thousands) |
Level 1 | Level 2 | Level 3 | Total | Level 1 | Level 2 | Level 3 | Total | ||||||||||||||||||||||||
| Equity securities: |
||||||||||||||||||||||||||||||||
| U.S. equity securities |
$ | 9,635 | $ | 26,682 | $ | — | $ | 36,317 | $ | 10,156 | $ | 34,355 | $ | — | $ | 44,511 | ||||||||||||||||
| Non-U.S. equity securities |
— | 18,990 | — | 18,990 | — | 16,348 | — | 16,348 | ||||||||||||||||||||||||
| Fixed income securities: |
||||||||||||||||||||||||||||||||
| Government and government agency securities |
— | 17,890 | — | 17,890 | — | 14,653 | — | 14,653 | ||||||||||||||||||||||||
| Corporate debt securities |
— | 18,791 | — | 18,791 | — | 11,961 | — | 11,961 | ||||||||||||||||||||||||
| Mortgage and other asset-backed securities |
— | 376 | — | 376 | — | 11,456 | — | 11,456 | ||||||||||||||||||||||||
| Cash and cash equivalents |
710 | — | — | 710 | 891 | — | — | 891 | ||||||||||||||||||||||||
|
|
|
|
|
|
|
|
|
|
|
|
|
|
|
|
|
|||||||||||||||||
| Total |
$ | 10,345 | $ | 82,729 | $ | — | $ | 93,074 | $ | 11,047 | $ | 88,773 | $ | — | $ | 99,820 | ||||||||||||||||
|
|
|
|
|
|
|
|
|
|
|
|
|
|
|
|
|
|||||||||||||||||
Equity securities consist primarily of publicly traded U.S. and non-U.S. equities. Publicly traded securities are valued at the last trade or closing price reported in the active market in which the individual securities are traded. Certain equity securities are held within commingled funds, which are valued at the unitized net asset value (“NAV”) or percentage of the NAV as determined by the custodian of the fund. These values are based on the fair value of the underlying net assets owned by the fund.
Fixed income securities consist primarily of government and agency securities, corporate debt securities, and mortgage and other asset-backed securities. When available, fixed income securities are valued at the closing price reported in the active market in which the individual security is traded. Government and agency securities and corporate debt securities are valued using the most recent bid prices or occasionally the mean of the latest bid and ask prices when markets are less liquid. Asset-backed securities including mortgage-backed securities are
F-31
Table of Contents
valued using broker/dealer quotes when available. When quotes are not available, fair value is determined by utilizing a discounted cash flow approach, which incorporates other observable inputs such as cash flows, underlying security structure and market information including interest rates and bid evaluations of comparable securities. As of September 25, 2015 and September 26, 2014, the Company did not have any Level 3 pension assets. Certain fixed income securities are held within commingled funds, which are valued utilizing NAV as determined by the custodian of the fund. These values are based on the fair value of the underlying net assets owned by the fund.
Cash and cash equivalents consist primarily of short-term commercial paper, and other cash or cash-like instruments including settlement proceeds due from brokers, stated at cost, which approximates fair value.
Transfers between levels of the fair value hierarchy (the “hierarchy”) are recognized on the actual date of the event or circumstance giving rise to the transfer, which generally coincides with the Company’s valuation process. There were no transfers between levels of hierarchy during the fiscal years ended September 25, 2015 and September 26, 2014.
The strategy of the Company’s investment managers with regard to the investments valued using NAV or its equivalent is to either match or exceed relevant benchmarks associated with the respective asset category. The underlying investment funds are available to be redeemed on a daily basis. None of the investments valued using NAV or its equivalent contain any redemption restrictions or unfunded commitments.
The Company’s funding policy is to make contributions in accordance with appropriate laws and customs. The Company contributed $1,103 and $3,390 to its pension plans for the fiscal years ended September 25, 2015 and September 26, 2014.
The Company anticipates that it will contribute at least the minimum required contribution of $562 to its pension plans in fiscal year 2016.
During the year ended September 26, 2014, the Company signed a new collective bargaining agreement with the United Steel Workers Local 9777-18. Effective April 10, 2017, the new agreement freezes the defined benefit pension plan whereby participants will no longer accrue credited service.
Benefit payments, which reflect future expected service as appropriate, are expected to be paid in each fiscal year as follows (amounts in thousands):
| 2016 |
$ | 4,589 | ||
| 2017 |
4,939 | |||
| 2018 |
5,337 | |||
| 2019 |
5,662 | |||
| 2020 |
6,046 | |||
| 2021-2025 |
34,112 |
Defined Contribution Retirement Plans—The Company also sponsors several defined contribution retirement plans—the 401(k) matching programs. Expense for the defined contribution plans is computed as a percentage of participants’ compensation and was $2,741, $3,162 and $3,675 for the fiscal years ended September 25, 2015, September 26, 2014 and September 27, 2013, respectively.
Multi-Employer Plan
On July 14, 2013, the Company withdrew from a multi-employer pension plan in which it participated prior to its acquisition by CD&R. The Company recorded a liability representing its proportionate share of the plan’s obligation of $6,778 as of September 25, 2015 and $7,039 as of September 26, 2014.
F-32
Table of Contents
11. COMMON AND PREFERRED STOCK
As of September 25, 2015 and September 26, 2014, the Company had 200,000 shares of common stock authorized and 45,586 and 45,653 shares issued and outstanding, respectively.
Common Stock—Holders of Common Stock are entitled to cost one vote for each share held of record on all matters submitted to a vote of the stockholders. Additionally, holders of Common Stock are entitled to receive, on a pro rata basis, dividends and distributions, if any, that the Company’s board of directors may declare out of legally available funds, subject to preferences that may be applicable to preferred stock, if any.
Preferred Stock—On December 22, 2010, CD&R acquired shares of a newly created class of Preferred Stock. The Preferred Stock initially represented 51% of the Company’s outstanding capital stock (on an as-converted basis). The Preferred Stock is entitled to a 12% fixed, cumulative dividend paid quarterly if and when declared by the board of directors in cash or shares of Preferred Stock at the Company’s option. The Company paid all dividends on Preferred Stock in additional shares of Preferred Stock (“Preferred Dividends”) and dividends on an as-converted basis when declared on Common Stock (“Participating Dividends”).
On April 9, 2014, the Preferred Stock and accumulated Preferred Dividends converted into Common Stock. As of the conversion date, the Company issued 452,630 shares of Preferred Stock, which included $146,630 of Participating Dividends to CD&R. The Preferred Dividends had a liquidation preference of $1 per share of Preferred Stock, equal to the issuance price.
12. EARNINGS PER SHARE
As described in Note 1, the Company issued Common Stock and Preferred Stock on December 22, 2010. The Preferred Stock was entitled to Preferred Dividends and Participating Dividends. Each fiscal quarter, beginning with the quarter ended December 23, 2012, the Company declared and issued the Preferred Dividend in kind. On April 9, 2014, CD&R converted all of its Preferred Stock to Common Stock.
Basic earnings (loss) per common share is computed by dividing net income (loss) available to common stockholders by the weighted average number of shares of Common Stock outstanding for the period. For periods that the Preferred Stock was outstanding, the Company computed earnings per share using the two-class method, which is an earnings allocation formula that treats a participating security as having rights to earnings that otherwise would have been available to common stockholders. The Company’s Preferred Stock had rights to Participating Dividends, requiring the Company to use the two-class method. However, as holders of Preferred Stock were not required to fund losses, no allocation of the loss available to common stockholders was made for the years ended September 26, 2014 and September 27, 2013. For the year ended September 25, 2015, the Company no longer is required to use the two-class method as its capital structure contains Common Stock only.
F-33
Table of Contents
The computation of diluted earnings (loss) per common share includes the effect of potential Common Stock, if dilutive. As the Company intends to settle all employee stock options in cash, the potential issuance of shares of Common Stock related to these options does not affect diluted shares. There are no other potentially dilutive instruments outstanding (amounts in thousands, except share and per share data).
| Components of Basic and Diluted Earnings per Share |
For the year ended September 25, 2015 |
For the year ended September 26, 2014 |
For the year ended September 27, 2013 |
|||||||||
| Basic and Diluted Earnings per Share Numerator: |
||||||||||||
| Loss from continuing operations |
$ | (4,955 | ) | $ | (73,948 | ) | $ | (18,581 | ) | |||
| Less: Convertible Preferred Stock and Dividends |
— | 29,055 | 47,234 | |||||||||
|
|
|
|
|
|
|
|||||||
| Loss from continuing operations available to common stockholders |
$ | (4,955 | ) | $ | (103,003 | ) | $ | (65,815 | ) | |||
|
|
|
|
|
|
|
|||||||
| Loss from discontinued operations |
— | — | (42,654 | ) | ||||||||
|
|
|
|
|
|
|
|||||||
| Net Loss |
$ | (4,955 | ) | $ | (103,003 | ) | $ | (108,469 | ) | |||
|
|
|
|
|
|
|
|||||||
| Basic and Diluted Earnings per Share Denominator: |
||||||||||||
| Weighted average shares outstanding |
45,640 | 37,225 | 29,740 | |||||||||
| Basic and Diluted loss per share from continuing operations available to common stockholders |
$ | (0.11 | ) | $ | (2.77 | ) | $ | (2.21 | ) | |||
| Basic and Diluted loss per share from discontinued operations |
— | — | $ | (1.43 | ) | |||||||
| Basic and Diluted net loss per share available to common stockholders |
$ | (0.11 | ) | $ | (2.77 | ) | $ | (3.65 | ) | |||
13. STOCK INCENTIVE PLAN
On May 16, 2011, the Company’s Board of Directors adopted the Atkore International Group Inc. Stock Incentive Plan (the “Stock Incentive Plan”). A maximum of 6.5 million shares of Common Stock is reserved for issuance under the Stock Incentive Plan. The Stock Incentive Plan provides for stock purchases and grants of other equity awards, including nonqualified stock options, restricted stock and restricted stock units, to officers and key employees.
Stock options vest ratably over five years. Compensation expense, based on the fair market value of the options, is charged to selling, general and administrative expenses over the respective vesting periods. All options and rights have a ten-year life.
During the year ended September 26, 2014, the Company’s Board of Directors modified the Stock Incentive Plan. The modification provides the Company discretion to net settle stock option awards in cash. Subsequent to the modification, several former employees requested and were granted net cash settlements. Consequently, the modification triggered a change from equity accounting to liability accounting for all remaining outstanding options. Cumulative amounts previously recorded in equity were reclassified as a long-term liability and remeasured at fair value using the Black-Scholes model. The fair value of all outstanding options will be remeasured each reporting period.
There were 4,924 and 5,601 stock options outstanding issued under the Stock Incentive Plan as of September 25, 2015 and September 26, 2014, respectively. Compensation expense for the years ended September 25, 2015, September 26, 2014 and September 27, 2013 was $13,523, $8,398 and $2,199, respectively. Compensation expense for the year ended September 26, 2014 included approximately $5,428 of incremental compensation expense related to the modification. Compensation expense is included in selling, general and administrative expenses.
F-34
Table of Contents
The fair value of each of the Company’s options granted for the periods presented was estimated using the Black-Scholes option pricing model with the following assumptions:
| For the Year Ended | ||||||||
| September 25, 2015 | September 26, 2014 | |||||||
| Expected dividend yield |
— | % | — | % | ||||
| Expected volatility |
35 | % | 55 | % | ||||
| Range of risk free interest rates |
.85% - 1.74 | % | 1.23% - 2.09 | % | ||||
| Range of expected option lives |
2.51 - 6.35 years | 3.42 - 6.34 years | ||||||
The range of fair values used to calculate the fair value of options outstanding as of September 25, 2015 and September 26, 2014, were $8.84—$10.50 and $5.38—$6.54, respectively. The number of options exercised during the fiscal years ended September 25, 2015, September 26, 2014 and September 27, 2013 were 366, 56 and 0, respectively. The intrinsic value of those options was $2,928, $140 and $0 for the years ended September 25, 2015, September 26, 2014 and September 27, 2013, respectively. The amount of cash the Company paid to settle the exercised options during fiscal year 2015 and 2014 was $914 and $140 and is recorded as a financing activity in the statement of cash flows.
The expected life of options represents the weighted-average period of time that options granted are expected to be outstanding giving consideration to vesting schedules and expected exercise patterns. The risk-free interest rate is based on the U.S. Treasury yield curve in effect at the time of the grant for periods corresponding with the expected life of the options. Expected volatility is based on historical volatilities of comparable companies. Dividends are not paid on Common Stock.
Stock option activity for the period September 29, 2012 to September 25, 2015, was as follows:
| Shares | Weighted-Average Exercise Price |
Weighted-Average Remaining Contractual Term (in years) |
||||||||||
| Outstanding as of September 29, 2012 |
1,697 | $ | 10.00 | 6.99 | ||||||||
| Granted |
3,161 | 10.00 | 8.33 | |||||||||
| Forfeited |
(141 | ) | 10.00 | — | ||||||||
|
|
|
|||||||||||
| Outstanding as of September 27, 2013 |
4,717 | 10.00 | 7.90 | |||||||||
| Granted |
1,334 | 11.74 | 9.56 | |||||||||
| Exercised |
(56 | ) | 10.00 | — | ||||||||
| Forfeited |
(394 | ) | 10.00 | — | ||||||||
|
|
|
|||||||||||
| Outstanding as of September 26, 2014 |
5,601 | 10.40 | 8.28 | |||||||||
| Granted |
212 | 12.39 | 9.5 | |||||||||
| Exercised |
(366 | ) | 10.00 | — | ||||||||
| Forfeited |
(523 | ) | 10.00 | — | ||||||||
|
|
|
|||||||||||
| Outstanding as of September 25, 2015 |
4,924 | 10.55 | 7.4 | |||||||||
|
|
|
|||||||||||
| Vested as of September 25, 2015 |
2,042 | 10.00 | 6.9 | |||||||||
As of September 25, 2015, there was $21,292 of total unrecognized compensation cost related to nonvested options granted. The cost is expected to be recognized over a weighted-average period of three years.
14. FAIR VALUE MEASUREMENTS
Authoritative guidance for fair value measurements establishes a three-level hierarchy that ranks the quality and reliability of information used in developing fair value estimates. The hierarchy gives the highest priority to quoted prices in active markets and the lowest priority to unobservable data. In cases where two or more levels of
F-35
Table of Contents
inputs are used to determine fair value, a financial instrument’s level is determined based on the lowest level input that is considered significant to the fair value measurement in its entirety. The three levels of the fair value hierarchy are summarized as follows:
| • | Level 1—inputs are based upon quoted prices (unadjusted) in active markets for identical assets or liabilities that are accessible as of the measurement date. |
| • | Level 2—inputs are based upon quoted prices for similar assets or liabilities in active markets, quoted prices for identical or similar assets or liabilities in markets that are not active, and model-derived valuations for the asset or liability that are derived principally from or corroborated by market data for which the primary inputs are observable, including forward interest rates, yield curves, credit risk and exchange rates. |
| • | Level 3—inputs for the valuations are unobservable and are based on management’s estimates of assumptions that market participants would use in pricing the asset or liability. The fair values are therefore determined using model-based techniques such as option pricing models and discounted cash flow models. |
Certain assets and liabilities are required to be recorded at fair value on a recurring basis. The Company’s assets and liabilities to be adjusted to fair value on a recurring basis are cash equivalents, assets held for sale, and foreign exchange forward options.
In addition to assets and liabilities that are recorded at fair value on a recurring basis, the Company is required to record certain assets and liabilities at fair value on a nonrecurring basis. The Company recognized impairment of certain property, plant and equipment, goodwill and indefinite-lived trade names for the years ended September 25, 2015 and September 26, 2014 requiring these assets to be recorded at their fair value. Various techniques and methods were used to value the Level 2 and Level 3 assets and liabilities.
We separately disclose the fair value of any debt-related obligations within Note 8.
We valued our assets held for sale and our property, plant and equipment based upon the estimated sales price less costs to dispose as of September 25, 2015 and September 26, 2014. Selling price is estimated based on market transactions for similar assets. The significant unobservable input used in the fair value measurement of our assets held for sale is the estimated selling price. Changes in the estimated selling price would not have a significant impact on the estimated fair value.
As of September 26, 2014, our goodwill was valued using a combination of three valuation approaches: (a) an income approach using a discounted cash flow analysis; (b) a market approach using a comparable company analysis; (c) a market approach using a transaction analysis. The fair value of our indefinite-lived trade names were valued from the income approach using a relief-from-royalty method.
The following table presents the assets and liabilities measured at fair value on a recurring basis as of September 25, 2015 and September 26, 2014 in accordance with the fair value hierarchy:
| Fair Value Measurement | ||||||||||||||||||||||||
| September 25, 2015 | September 26, 2014 | |||||||||||||||||||||||
| Level 1 | Level 2 | Level 3 | Level 1 | Level 2 | Level 3 | |||||||||||||||||||
| Assets |
||||||||||||||||||||||||
| Cash equivalents |
$ | 54,032 | $ | — | $ | — | $ | 13 | $ | — | $ | — | ||||||||||||
| Assets held for sale |
— | — | 3,313 | — | — | 4,835 | ||||||||||||||||||
| Foreign exchange forward options |
— | — | — | 161 | — | — | ||||||||||||||||||
F-36
Table of Contents
The following tables reflect a rollforward of the Company’s recurring Level 3 assets and liabilities:
| Assets Held for Sale-Level 3 | ||||
| September 26, 2014 |
$ | 4,835 | ||
| Consideration Received |
(1,348 | ) | ||
| Currency Translation Adjustment |
(174 | ) | ||
|
|
|
|||
| September 25, 2015 |
$ | 3,313 | ||
The following table presents the assets and liabilities measured at fair value on a non-recurring basis as of September 25, 2015 and September 26, 2014 in accordance with the fair value hierarchy:
| Fair Value Measurement | ||||||||||||||||||||||||
| September 25, 2015 | September 26, 2014 | |||||||||||||||||||||||
| Level 1 | Level 2 | Level 3 | Level 1 | Level 2 | Level 3 | |||||||||||||||||||
| Assets |
||||||||||||||||||||||||
| Property, plant and equipment |
$ | — | $ | — | $ | 5,500 | $ | — | $ | — | $ | — | ||||||||||||
| Goodwill |
— | — | — | — | — | 21,497 | ||||||||||||||||||
| Indefinite-lived trade names |
— | — | — | — | — | 1,500 | ||||||||||||||||||
15. RESTRUCTURING CHARGES AND ASSET IMPAIRMENTS
Severance—On August 6, 2015, the Company announced plans to exit its Fence and Sprinkler steel pipe and tube product lines (“Fence and Sprinkler”) in order to realign its long-term strategic focus. The Company anticipates that the operations associated with these product lines will be wound down during the first quarter of fiscal 2016. As a result, one of the Company’s facilities that manufactures these product lines, located in Philadelphia, PA, will close during the first quarter of 2016. The Company’s Phoenix, AZ facility, which also supports these product lines, will reduce manufacturing output as a result of this announcement. Management of and administrative services for these product lines reside in the Company’s Harvey, IL facility.
The Fence and Sprinkler exit will result in headcount reductions in the Company’s Philadelphia, Phoenix and Harvey facilities. For the year ended September 25, 2015, the Company recorded $3,681 of severance-related expenses for individuals whose service will end within 60 days of the communication date.
The Company also recorded $19,495 of asset impairment charges related to property, plant and equipment and $4,518 for the write-down of prepaid shop supplies as a component of Asset impairment charges and $664 of inventory write-down recorded as a component of Cost of sales. The charges represent adjustments of the carrying values to current fair values.
During fiscal year 2014, the Company recorded involuntary employee termination benefits pursuant to a benefit arrangement. Total expense for the year ended September 26, 2014 of $999 was recorded as a component of selling, general and administrative expenses. The remaining severance payments of $395 are expected to be completed during fiscal year 2016 and were included as a component of accrued expenses.
In the fourth quarter of the fiscal year 2013, the Company committed to close the Company’s Acroba S.A.S. (“Acroba”) subsidiary’s facility in Reux, France as part of the Company’s continuing effort to realign its strategic focus. The Company recorded restructuring charges of $1,301 and $1,946 related to termination benefits during the fiscal years ended September 26, 2014 and September 27, 2013, respectively. The remaining severance payments of $206 are expected to be completed during fiscal year 2016 and were included as a component of accrued expenses.
The Company recorded an impairment charge of $553 and $3,328 for the years ended September 26, 2014 and September 27, 2013, respectively, related to the closing of its facility in Reux, France. The facility was sold in the fourth quarter of 2015 at carrying value.
F-37
Table of Contents
The rollforward of restructuring reserves included as a component of accrued expenses is as follows:
| Electrical Raceway | MP&S | Corporate | Total | |||||||||||||||||||||||||
| (in thousands) |
Severance | Other | Severance | Other | Severance | Other | ||||||||||||||||||||||
| Balance as of September 29, 2012 |
$ | 140 | $ | — | $ | 960 | $ | — | $ | 2,321 | $ | — | $ | 3,421 | ||||||||||||||
| Charges |
— | — | 3,916 | — | — | — | 3,916 | |||||||||||||||||||||
| Utilization |
(188 | ) | (1,212 | ) | (1,820 | ) | — | (3,220 | ) | |||||||||||||||||||
| Reversals/ exchange rate effects |
48 | — | (1,693 | ) | — | (501 | ) | — | (2,146 | ) | ||||||||||||||||||
|
|
|
|
|
|
|
|
|
|
|
|
|
|
|
|||||||||||||||
| Balance as of September 27, 2013 |
— | — | 1,971 | — | — | — | 1,971 | |||||||||||||||||||||
| Charges |
— | — | 1,301 | — | 999 | — | 2,300 | |||||||||||||||||||||
| Utilization |
— | — | (2,236 | ) | — | (406 | ) | — | (2,642 | ) | ||||||||||||||||||
| Reversals/ exchange rate effects |
— | — | (37 | ) | — | — | — | (37 | ) | |||||||||||||||||||
|
|
|
|
|
|
|
|
|
|
|
|
|
|
|
|||||||||||||||
| Balance as of September 26, 2014 |
— | — | 999 | — | 593 | — | 1,592 | |||||||||||||||||||||
| Charges |
— | 200 | 3,680 | 846 | 1 | 62 | 4,789 | |||||||||||||||||||||
| Utilization |
— | (200 | ) | (907 | ) | (102 | ) | (577 | ) | — | (1,786 | ) | ||||||||||||||||
| Reversals/ exchange rate effects |
— | — | (55 | ) | (124 | ) | (2 | ) | (1 | ) | (182 | ) | ||||||||||||||||
|
|
|
|
|
|
|
|
|
|
|
|
|
|
|
|||||||||||||||
| Balance as of September 25, 2015 |
$ | — | $ | — | $ | 3,717 | $ | 620 | $ | 15 | $ | 61 | $ | 4,413 | ||||||||||||||
|
|
|
|
|
|
|
|
|
|
|
|
|
|
|
|||||||||||||||
The net restructuring charges included in selling, general and administrative expense, were as follows:
| For the Year Ended | ||||||||||||
| (in thousands) |
September 25, 2015 | September 26, 2014 | September 27, 2013 | |||||||||
| Total restructuring charges, net |
$ | 4,766 | $ | 2,263 | $ | 1,770 | ||||||
16. COMMITMENTS AND CONTINGENCIES
The Company has obligations related to commitments to purchase certain goods. As of September 25, 2015, such obligations were $56,822 for the next twelve months and $2,920 for year two. These amounts represent open purchase orders for materials used in production.
The Company leases certain facilities and equipment under operating leases. Total rental expense on all operating leases was $11,721, $12,659, and $9,765 in fiscal years 2015, 2014, and 2013, respectively. At September 25, 2015, minimum future operating lease payments in excess of one year are presented in the table below as follows:
| Minimum future operating lease payments: |
||||
| 2016 |
$ | 7,303 | ||
| 2017 |
6,799 | |||
| 2018 |
6,069 | |||
| 2019 |
3,271 | |||
| 2020 |
2,666 | |||
| 2021 and thereafter |
7,856 | |||
|
|
|
|||
| Total |
$ | 33,964 | ||
|
|
|
Legal Contingencies—The Company is a defendant in a number of pending legal proceedings, some of which were inherited from Tyco, including product liability claims. Several lawsuits have been filed against the Company and the Company has also received other claim demand letters alleging that the Company’s anti-microbial coated steel sprinkler pipe (“ABF”) causes environmental stress cracking in chlorinated polyvinyl chloride (“CPVC”) pipe when the steel ABF pipe and CPVC pipe are installed together in the same sprinkler system, which we refer to collectively as the “Special Products Claims.” After an analysis of claims experience,
F-38
Table of Contents
the Company reserved its best estimate of the probable and estimable losses related to these matters. Prior to fiscal year 2015, the Company measured all product liability claims in aggregate. Incurred and paid losses collectively declined approximately 66% over the past three years. Consequently, the Company believed it was appropriate to measure ABF matters and non-ABF matters separately which included a revision of certain estimates including the relative significance of claim history. The product liability reserve decreased by $3,585 in the year ended September 25, 2015 due to the change in estimate. The Company recognized a product liability reserve of $2,783 related to ABF matters and $2,666 related to other product liability claims as of September 25, 2015 compared to $9,034 for the combined product liability as of September 26, 2014. The change in estimate better measures the exposure from the ABF and other product liability matters. The Company believes that the range of expected losses for ABF and other product liabilities is between $3,000 and $10,000.
In addition to the matters above, from time to time, the Company is subject to a number of disputes, administrative proceedings and other claims arising out of the conduct of the Company’s business. These matters generally relate to disputes arising out of the use or installation of the Company’s products, product liability litigation, contract disputes, patent infringement accusations, employment matters and similar matters. On the basis of information currently available to the Company, it does not believe that existing proceedings and claims will have a material impact on its net assets, income or cash flows. However, litigation is unpredictable, and the Company could incur judgments or enter into settlements for current or future claims that could adversely affect its financial statements. The Company also has legal liabilities related to non-product liability matters totaling $1,136.
17. GUARANTEES
The Company has outstanding letters of credit for $6,310 supporting workers’ compensation and general liability insurance policies, and $1,500 supporting foreign lines of credit. The Company also has an outstanding letter of credit in the amount of $9,121 as collateral for four advance payments it has received pursuant to the sale of its minority ownership share in Abahsain-Cope Saudi Arabia Ltd., a joint venture in the Middle East. Pursuant to this matter, the Company received the final two installment payments totaling $4,560 during the year ended September 25, 2015. The bank guarantees will be canceled when final payment and ownership transfer is complete. As of September 25, 2015, the risk and title transfer was not complete. The Company also has surety bonds primarily related to performance guarantees on supply agreements and construction contracts, and payment of duties and taxes in the amount of $5,623. AII has guaranteed the performance of the Company to third parties for leased properties in the amount of $5,150 on behalf of the Company that the Company believes will be released before the end of the calendar year.
In disposing of assets or businesses, the Company often provides representations, warranties and indemnities to cover various risks including unknown damage to the assets, environmental risks involved in the sale of real estate, liability to investigate and remediate environmental contamination at waste disposal sites and manufacturing facilities, and unidentified tax liabilities and legal fees related to periods prior to disposition. The Company does not have the ability to estimate the potential liability from such indemnities because they relate to unknown conditions. However, the Company has no reason to believe that these uncertainties would have a material effect on the Company’s consolidated financial statements.
In the normal course of business, the Company is liable for product performance and contract completion. In the opinion of management, such obligations will not have a material effect to the Company’s consolidated financial statements.
18. DISCONTINUED OPERATIONS AND ASSETS HELD FOR SALE
In August 2013, the Company determined that the Brazil business was no longer strategic to the Company. On August 26, 2013, Atkore International, a subsidiary of the Company, entered into a Share Purchase Agreement (the “Agreement”) with Atkore International Indústria e Comércio de Aço e Materiais Elétricos Ltda. (the “Subsidiary”), Panatlantica S.A. (“Buyer”) and Allied Switzerland GmbH (“Seller”). Pursuant to the
F-39
Table of Contents
Agreement, Seller agreed to sell to Buyer all of the shares of the Subsidiary for 98,700 Brazilian Reais. Brazil’s operations and cash flows have been segregated from continuing operations and presented as discontinued operations for all of the periods presented. The Company will not have any continuing involvement in the operations after the disposal transaction. The Purchase Price was paid in four installments. The Company collected 87,785 Brazilian Reais or $38,809 through 2014. The remaining 14,651 Brazilian Reais or $4,540 were collected during fiscal 2015. The total loss, net of tax, from the sale was $19,751.
In order to mitigate foreign currency exposure, the Company entered into three foreign exchange forward option contracts to offset the risk of remeasuring the remaining unpaid installments. The Company recorded a gain on the foreign exchange forward options of $838 during fiscal 2015. The Company recorded losses on the foreign exchange forward options of $770 and $870 during the fiscal years ended September 26, 2014 and September 27, 2013, respectively. The Company received $999 as settlement of the foreign exchange forward option during fiscal year 2015. Gains and losses on these derivative instruments are recorded through earnings within selling, general and administrative on the Statements of Operations. All foreign exchange forward options expired during fiscal 2015.
In February 2013, the Company became aware of a $10,000 tax assessment by the State of Sao Paulo, Brazil related to Company purchases of raw material from a trading company located in Espiritu Santo in 2007 and 2008. The trading company paid taxes on the raw materials to the State of Espiritu Santo, but Sao Paulo tax authorities alleged that the materials were purchased for use at the Company’s Sao Paulo manufacturing facility and were subject to its tax jurisdiction. Sao Paulo authorities contend that manufacturers in their State used trading agents in Espiritu Santo to take advantage of that State’s favorable tax rates and to circumvent tax payments in Sao Paulo. In 2009, the governments of Sao Paulo and Espiritu Santo reached agreement regarding the appropriate tax jurisdiction for purchases made by Sao Paulo manufacturers from trading companies in Espiritu Santo. Under the terms of that agreement, taxes on materials purchased by the Company from an Espiritu Santo trading agent pursuant to a valid purchase order would be paid to the State of Espiritu Santo. However, the terms of the agreement do not apply to transactions that occurred prior to 2009. As a result, Sao Paulo continues to assert that it is entitled to tax payments on trading agent transactions involving Sao Paulo manufacturers prior to 2009. The Company strongly maintains it acted in compliance with all applicable laws and has commenced legal action to annul the tax assessment. The Company does not believe that the liability is probable or reasonably estimable and accordingly has not recorded a loss contingency related to this matter. In addition, as described in Note 9, under the terms of the Investment Agreement, Tyco has agreed to indemnify and hold harmless the Company and its subsidiaries from and against any taxes of the Company with respect to any tax period ending on or before the closing of the Transactions, as well as all tax liabilities relating to events or transactions occurring on or prior to the closing date of the Transactions. Tyco has agreed to extend the indemnification to the Buyer; therefore, the Company does not expect to incur any losses related to this matter.
The following tables present the operating results of the Company’s discontinued operations for the fiscal year ended September 27, 2013:
Brazil—
| (in thousands) |
September 27, 2013 | |||
| Net sales |
$ | 135,397 | ||
| Cost of sales |
155,509 | |||
|
|
|
|||
| Loss before income tax |
(20,112 | ) | ||
| Income tax expense |
2,791 | |||
|
|
|
|||
| Loss from discontinued operations |
$ | (22,903 | ) | |
| Loss from disposal of discontinued business assets, net of tax |
(19,751 | ) | ||
|
|
|
|||
| Loss from discontinued operations and disposal net of income tax. |
$ | (42,654 | ) | |
|
|
|
|||
F-40
Table of Contents
There were no assets and liabilities of discontinued operations as of September 25, 2015 and September 26, 2014.
Assets Held for Sale—The Company has classified certain buildings and an investment in an unconsolidated joint venture as held for sale on the accompanying consolidated balance sheets as of September 25, 2015 and September 26, 2014. The components of assets held for sale at September 25, 2015 and September 26, 2014 consisted of the following (amounts in thousands):
| September 25, 2015 | September 26, 2014 | |||||||
| Assets held for sale |
$ | 3,313 | $ | 4,835 | ||||
|
|
|
|
|
|||||
In January 2012, the Company entered into a share purchase agreement pursuant to which the Company would sell its minority ownership share in Abahsain-Cope Saudi Arabia Ltd. for cash consideration of approximately $10,000, which was paid into an escrow account in May 2012. The escrow remains in the name of the buyer, and the Company retains the benefit of the investment until all deliverables are met. The carrying value of the investment is $3,313 and is classified as held for sale. The consideration is to be distributed incrementally from the escrow as certain milestones are reached. The Company will recognize the gain on the sale upon transfer of risk and title. The Company received the final two installment payments totaling $4,561 during the year ended September 25, 2015. The total consideration paid of $9,121 is included in accrued and other liabilities until the transfer of risk and title at which point, the Company will recognize the revenue related to the sale of the business.
In a prior year, the Company closed the Acroba subsidiary’s facility in Reux, France. The Company recorded $553 and $3,328 impairment charges related to the Reux, France facility for the years ended September 26, 2014 and September 27, 2013, respectively. The charge recorded in the current fiscal year reflects a further deterioration of market conditions for this property. During 2015, the Company reached an agreement to sell this facility at carrying value for 1,200 Euro or $1,279.
19. SEGMENT INFORMATION
The Company has two operating segments which are also its reportable segments. The Company’s operating segments are organized based upon primary market channels and, in most instances, the end use of products.
Electrical Raceway—Product offerings include steel conduit and fittings, plastic conduit and fittings, armored cable (an alternative for steel conduit in some instances), flexible and liquidtight conduit, cable tray, and ancillary products such as wire baskets, cable ladders, and accessories. These products represent a broad array of products used in non-residential buildings such as hospitals, manufacturing plants, data centers, etc. The electrical infrastructure in many of these buildings requires conduit, cables, fittings, etc. These products are sold into the electrical market primarily through distribution networks.
Mechanical Products & Solutions—Product offerings include in-line galvanized tubular products and mechanical framework. Additionally, this segment provides value-added engineering, installation and pre-fabrication solutions. These products serve a variety of end markets, including solar steel structures, framework for commercial greenhouses and conveyor systems. The primary market channels for these products include electrical, industrial and specialized distribution and direct to OEMs.
Both segments use Adjusted EBITDA as the primary measure of profit and loss. Segment Adjusted EBITDA is the sum of income (loss) from continuing operations before income taxes, adjusted to exclude unallocated expenses, depreciation and amortization, loss on extinguishment of debt, interest expense, net, restructuring and impairments, net periodic pension plan benefit cost, stock-based compensation, ABF product liability impact, consulting fees, multi-employer pension withdrawal, transaction costs and other items, such as lower of cost or market inventory adjustments and the impact of foreign exchange gains or losses related to our divestiture in Brazil and the impact from our Fence and Sprinkler exit.
F-41
Table of Contents
Intersegment transactions primarily consist of product sales at designated transfer prices on an arms-length basis. Gross profit earned and reported within the segment is eliminated in the Company’s consolidated results. Certain manufacturing and distribution expenses are allocated between the segments due to the shared nature of activities. Recorded amounts represent a proportional amount of the quantity of product produced for each segment. A portion of certain assets, such as machinery and equipment and facilities, are not allocated despite serving both segments. These assets are shared and not fully dedicated to either segment. These shared assets are reported within the Mechanical Products & Solutions segment.
| September 25, 2015 | September 26, 2014 | September 27, 2013 | ||||||||||||||||||||||||||||||||||
| (in thousands) |
External Net Sales |
Intersegment Sales |
Adjusted EBITDA |
External Net Sales |
Intersegment Sales |
Adjusted EBITDA |
External Net Sales |
Intersegment Sales |
Adjusted EBITDA |
|||||||||||||||||||||||||||
| Electrical Raceway |
$ | 1,004,683 | $ | 896 | $ | 106,717 | $ | 967,105 | $ | 661 | $ | 86,273 | $ | 739,439 | $ | 656 | $ | 66,845 | ||||||||||||||||||
| Mechanical Products & Solutions |
724,485 | 277 | $ | 79,553 | 735,733 | 317 | $ | 59,941 | 736,458 | 479 | $ | 63,415 | ||||||||||||||||||||||||
| Eliminations |
— | (1,173 | ) | — | (978 | ) | — | (1,135 | ) | |||||||||||||||||||||||||||
|
|
|
|
|
|
|
|
|
|
|
|
|
|||||||||||||||||||||||||
| Consolidated operations |
$ | 1,729,168 | — | $ | 1,702,838 | — | $ | 1,475,897 | — | |||||||||||||||||||||||||||
|
|
|
|
|
|
|
|
|
|
|
|
|
|||||||||||||||||||||||||
| September 25, 2015 | September 26, 2014 | September 27, 2013 | ||||||||||||||||||||||
| (in thousands) |
Capital Expenditures |
Total Assets |
Capital Expenditures |
Total Assets |
Capital Expenditures |
Total Assets |
||||||||||||||||||
| Electrical Raceway |
$ | 12,210 | $ | 590,999 | $ | 10,873 | $ | 591,098 | $ | 4,151 | $ | 565,511 | ||||||||||||
| Mechanical Products & Solutions |
10,918 | 439,037 | 9,474 | 507,967 | 11,305 | 600,092 | ||||||||||||||||||
| Unallocated |
3,721 | 83,763 | 4,015 | 86,354 | (457 | ) | 106,586 | |||||||||||||||||
|
|
|
|
|
|
|
|
|
|
|
|
|
|||||||||||||
| Consolidated operations |
$ | 26,849 | $ | 1,113,799 | $ | 24,362 | $ | 1,185,419 | $ | 14,999 | $ | 1,272,189 | ||||||||||||
|
|
|
|
|
|
|
|
|
|
|
|
|
|||||||||||||
Presented below is a reconciliation of operating segment Adjusted EBITDA to Income (loss) from continuing operations before income taxes:
| Fiscal Year Ended | ||||||||||||
| (in thousands) |
September 25, 2015 | September 26, 2014 | September 27, 2013 | |||||||||
| Operating segment Adjusted EBITDA |
||||||||||||
| Electrical Raceway |
$ | 106,717 | $ | 86,273 | $ | 66,845 | ||||||
| Mechanical Products & Solutions |
79,553 | 59,941 | 63,416 | |||||||||
|
|
|
|
|
|
|
|||||||
| Total |
$ | 186,270 | $ | 146,214 | $ | 130,261 | ||||||
| Unallocated expenses(a) |
(22,320 | ) | (19,617 | ) | (18,702 | ) | ||||||
| Depreciation and amortization |
(59,465 | ) | (58,695 | ) | (48,412 | ) | ||||||
| Loss on extinguishment of debt |
— | (43,667 | ) | — | ||||||||
| Interest expense, net |
(44,809 | ) | (44,266 | ) | (47,869 | ) | ||||||
| Restructuring & impairments |
(32,703 | ) | (46,687 | ) | (10,931 | ) | ||||||
| Net periodic pension benefit cost |
(578 | ) | (1,368 | ) | (3,371 | ) | ||||||
| Stock-based compensation |
(13,523 | ) | (8,398 | ) | (2,199 | ) | ||||||
| ABF product liability impact |
216 | (2,841 | ) | (1,383 | ) | |||||||
| Consulting fee |
(3,500 | ) | (4,854 | ) | (6,000 | ) | ||||||
| Multi-employer pension withdrawal |
— | — | (7,290 | ) | ||||||||
| Transaction costs |
(6,039 | ) | (5,049 | ) | (1,780 | ) | ||||||
| Other |
(14,305 | ) | 12,656 | (7,685 | ) | |||||||
| Impact of Fence and Sprinkler |
2,885 | (5,003 | ) | 3,814 | ||||||||
|
|
|
|
|
|
|
|||||||
| Income (loss) from continuing operations before income taxes |
$ | (7,871 | ) | $ | (106,887 | ) | $ | (21,547 | ) | |||
|
|
|
|
|
|
|
|||||||
F-42
Table of Contents
| (a) | Represents unallocated selling, general and administrative activities and associated expenses including, in part, executive, legal, finance, human resources, information technology, business development and communications, as well as certain costs and earnings of employee-related benefits plans, such as stock-based compensation and a portion of self-insured medical costs. |
The Company’s long-lived assets by geography were as follows:
| (in thousands) |
September 25, 2015 | September 26, 2014 | September 27, 2013 | |||||||||
| United States |
$ | 232,566 | $ | 263,750 | $ | 272,207 | ||||||
| Other Americas |
132 | 194 | 253 | |||||||||
| Europe |
1,036 | 1,417 | 4,389 | |||||||||
| Asia-Pacific |
4,482 | 5,269 | 6,272 | |||||||||
|
|
|
|
|
|
|
|||||||
| Total |
$ | 238,216 | $ | 270,630 | $ | 283,121 | ||||||
|
|
|
|
|
|
|
|||||||
The Company’s net sales by geographic area were as follows:
| Fiscal Year Ended | ||||||||||||
| (in thousands) |
September 25, 2015 | September 26, 2014 | September 27, 2013 | |||||||||
| United States |
$ | 1,604,788 | $ | 1,570,788 | $ | 1,338,252 | ||||||
| Other Americas |
42,136 | 43,323 | 42,992 | |||||||||
| Europe |
38,621 | 38,422 | 39,192 | |||||||||
| Asia-Pacific |
43,623 | 50,305 | 55,461 | |||||||||
|
|
|
|
|
|
|
|||||||
| Total |
$ | 1,729,168 | $ | 1,702,838 | $ | 1,475,897 | ||||||
|
|
|
|
|
|
|
|||||||
The table below shows the amount of net sales from external customers for each of our product categories which accounted for 10 percent or more of our consolidated net sales in any of the last three fiscal years:
| Fiscal Year Ended | ||||||||||||
| (in thousands) |
September 25, 2015 | September 26, 2014 | September 27, 2013 | |||||||||
| Armored Cables & Fittings |
$ | 332,153 | $ | 341,912 | $ | 320,149 | ||||||
| Metal Electrical Conduit & Fittings |
320,367 | 300,594 | 275,817 | |||||||||
| Mechanical Pipe |
286,799 | 282,789 | 279,696 | |||||||||
| PVC Electrical Conduit & Fittings |
269,808 | 238,042 | 59,377 | |||||||||
| Metal Framing & Fittings |
174,976 | 176,047 | 178,772 | |||||||||
| Other |
166,472 | 170,766 | 163,364 | |||||||||
| Impact of Fence and Sprinkler |
178,593 | 192,688 | 198,722 | |||||||||
|
|
|
|
|
|
|
|||||||
| Net Sales |
$ | 1,729,168 | $ | 1,702,838 | $ | 1,475,897 | ||||||
|
|
|
|
|
|
|
|||||||
20. SUBSEQUENT EVENTS
The Company has evaluated subsequent events through March 4, 2016, which is the date the financial statements were available to be issued.
On November 16, 2015, the Company was served with a Special Products Claim, Wind Condominium Association, Inc., et al. v. Allied Tube & Conduit Corporation, et al., a putative class action claim in the Southern District of Florida. The lawsuit asserts that the Company’s installed steel pipe was not compatible with CPVC pipe and defines a “National Class” and a “Florida Subclass” consisting of all condominium associations and building owners who had ABF and/or ABF II installed in combination with CPVC from January 1, 2003 through December 31, 2010 nationwide and in Florida, respectively. At this time, the Company does not expect the
F-43
Table of Contents
outcome of this matter or the other Special Products Claims proceedings, either individually or in the aggregate, to have a material effect on its financial statements, and the Company believes that its reserves are adequate for Special Products Claims contingencies. However, it is possible that additional reserves could be required in the future that could have a material effect on the Company’s financial statements. The loss or range of losses cannot be reasonably estimated at this time.
The Company exited Fence and Sprinkler and closed one of its manufacturing facilities in Philadelphia, PA as of November 30, 2015.
In January 2016, the Company separately repurchased $17,000 and $2,000 of its Second Lien Term Loan Facilities at 89.0% and 89.75% of par value, respectively.
F-44
Table of Contents
ATKORE INTERNATIONAL GROUP INC.
CONDENSED CONSOLIDATED STATEMENTS OF OPERATIONS
(Unaudited)
| Three Months Ended | Six Months Ended | |||||||||||||||
| (in thousands, except per share data) |
March 25, 2016 | March 27, 2015 | March 25, 2016 | March 27, 2015 | ||||||||||||
| Net sales |
$ | 353,046 | $ | 432,586 | $ | 711,421 | $ | 858,987 | ||||||||
| Cost of sales |
261,636 | 365,140 | 547,602 | 735,776 | ||||||||||||
|
|
|
|
|
|
|
|
|
|||||||||
| Gross profit |
91,410 | 67,446 | 163,819 | 123,211 | ||||||||||||
| Selling, general and administrative |
54,179 | 41,981 | 98,020 | 84,779 | ||||||||||||
| Intangible asset amortization |
5,572 | 5,373 | 11,089 | 10,526 | ||||||||||||
|
|
|
|
|
|
|
|
|
|||||||||
| Operating income |
31,659 | 20,092 | 54,710 | 27,906 | ||||||||||||
| Interest expense, net |
10,567 | 11,483 | 20,448 | 22,412 | ||||||||||||
| Gain on extinguishment of debt |
(1,661 | ) | — | (1,661 | ) | — | ||||||||||
|
|
|
|
|
|
|
|
|
|||||||||
| Income from operations before income taxes |
22,753 | 8,609 | 35,923 | 5,494 | ||||||||||||
| Income tax expense |
8,746 | 2,809 | 13,344 | 2,456 | ||||||||||||
|
|
|
|
|
|
|
|
|
|||||||||
| Net income |
$ | 14,007 | $ | 5,800 | $ | 22,579 | $ | 3,038 | ||||||||
|
|
|
|
|
|
|
|
|
|||||||||
| Weighted Average Common Shares Outstanding |
||||||||||||||||
| Basic and Diluted |
45,643 | 45,653 | 45,653 | 45,648 | ||||||||||||
| Net income per share |
||||||||||||||||
| Basic and Diluted |
$ | 0.31 | $ | 0.13 | $ | 0.49 | $ | 0.07 | ||||||||
See Notes to condensed consolidated financial statements.
F-45
Table of Contents
ATKORE INTERNATIONAL GROUP INC.
CONDENSED CONSOLIDATED STATEMENTS OF COMPREHENSIVE INCOME (LOSS)
(Unaudited)
| Three Months Ended | Six Months Ended | |||||||||||||||
| (in thousands) |
March 25, 2016 | March 27, 2015 | March 25, 2016 | March 27, 2015 | ||||||||||||
| Net income |
$ | 14,007 | $ | 5,800 | $ | 22,579 | $ | 3,038 | ||||||||
| Other comprehensive income: |
||||||||||||||||
| Change in foreign currency translation adjustment |
(96 | ) | (2,484 | ) | (61 | ) | (4,735 | ) | ||||||||
| Change in unrecognized loss related to pension benefit plans (See Note 10) |
180 | 22 | 360 | 44 | ||||||||||||
|
|
|
|
|
|
|
|
|
|||||||||
| Total other comprehensive income (loss) |
84 | (2,462 | ) | 299 | (4,691 | ) | ||||||||||
|
|
|
|
|
|
|
|
|
|||||||||
| Comprehensive income (loss) |
$ | 14,091 | $ | 3,338 | $ | 22,878 | $ | (1,653 | ) | |||||||
|
|
|
|
|
|
|
|
|
|||||||||
See Notes to condensed consolidated financial statements.
F-46
Table of Contents
ATKORE INTERNATIONAL GROUP INC.
CONDENSED CONSOLIDATED BALANCE SHEETS
(Unaudited)
| (in thousands, except share and per share data) |
March 25, 2016 | September 25, 2015 | ||||||
| Assets |
||||||||
| Current Assets: |
||||||||
| Cash and cash equivalents |
$ | 134,477 | $ | 80,598 | ||||
| Accounts receivable, less allowance for doubtful accounts of $1,393 and $1,173, respectively |
191,552 | 216,992 | ||||||
| Inventories, net (see Note 4) |
154,224 | 161,924 | ||||||
| Assets held for sale (see Note 17) |
6,663 | 3,313 | ||||||
| Prepaid expenses and other current assets |
20,612 | 18,665 | ||||||
|
|
|
|
|
|||||
| Total current assets |
507,528 | 481,492 | ||||||
| Property, plant and equipment, net (see Note 5) |
214,212 | 224,284 | ||||||
| Intangible assets, net (see Note 6) |
266,086 | 277,175 | ||||||
| Goodwill (see Note 6) |
115,829 | 115,829 | ||||||
| Deferred income taxes |
809 | 1,087 | ||||||
| Non-trade receivables |
14,141 | 13,932 | ||||||
|
|
|
|
|
|||||
| Total Assets |
$ | 1,118,605 | $ | 1,113,799 | ||||
|
|
|
|
|
|||||
| Liabilities and Equity |
||||||||
| Current Liabilities: |
||||||||
| Short-term debt and current maturities of long-term debt (see Note 8) |
$ | 1,881 | $ | 2,864 | ||||
| Accounts payable |
108,824 | 109,847 | ||||||
| Income tax payable |
1,249 | 515 | ||||||
| Accrued and other current liabilities (see Note 7) |
81,303 | 97,272 | ||||||
|
|
|
|
|
|||||
| Total current liabilities |
193,257 | 210,498 | ||||||
| Long-term debt (see Note 8) |
630,369 | 649,344 | ||||||
| Deferred income taxes |
21,355 | 14,557 | ||||||
| Other long-term tax liabilities |
12,759 | 13,319 | ||||||
| Pension liabilities |
27,709 | 28,126 | ||||||
| Other long-term liabilities |
53,949 | 41,678 | ||||||
|
|
|
|
|
|||||
| Total Liabilities |
939,398 | 957,522 | ||||||
|
|
|
|
|
|||||
| Equity: |
||||||||
| Common stock, $.01 par value, 200,000,000 shares authorized, 45,590,049 and 45,586,450 shares issued and outstanding, respectively |
457 | 457 | ||||||
| Treasury stock, held at cost |
(2,580 | ) | (2,580 | ) | ||||
| Additional paid in capital |
352,726 | 352,674 | ||||||
| Accumulated deficit |
(150,662 | ) | (173,241 | ) | ||||
| Accumulated other comprehensive loss |
(20,734 | ) | (21,033 | ) | ||||
|
|
|
|
|
|||||
| Total Equity |
179,207 | 156,277 | ||||||
|
|
|
|
|
|||||
| Total Liabilities and Equity |
$ | 1,118,605 | $ | 1,113,799 | ||||
|
|
|
|
|
|||||
See Notes to condensed consolidated financial statements.
F-47
Table of Contents
ATKORE INTERNATIONAL GROUP INC.
CONDENSED CONSOLIDATED STATEMENTS OF CASH FLOWS
(Unaudited)
| Six Months Ended | ||||||||
| (in thousands) |
March 25, 2016 |
March 27, 2015 |
||||||
| Operating activities: |
||||||||
| Net income |
$ | 22,579 | $ | 3,038 | ||||
| Adjustments to reconcile net income to net cash provided by operating activities: |
||||||||
| Loss on sale of fixed assets |
17 | — | ||||||
| Depreciation and amortization |
26,742 | 29,024 | ||||||
| Amortization of debt issuance costs and original issue discount |
1,759 | 1,812 | ||||||
| Deferred income taxes |
7,020 | 3,140 | ||||||
| Gain on extinguishment of debt |
(1,661 | ) | — | |||||
| Provision for losses on accounts receivable and inventory |
1,093 | 412 | ||||||
| Stock based compensation expense |
12,043 | 1,801 | ||||||
| Other adjustments to net income |
(648 | ) | — | |||||
| Changes in operating assets and liabilities, net of effects from acquisitions |
13,213 | (39,300 | ) | |||||
|
|
|
|
|
|||||
| Net cash provided by (used for) operating activities |
82,157 | (73 | ) | |||||
| Investing activities: |
||||||||
| Capital expenditures |
(9,014 | ) | (12,547 | ) | ||||
| Proceeds from sale of properties and equipment |
45 | 19 | ||||||
| Acquisitions of businesses, net of cash acquired |
— | (31,290 | ) | |||||
| Proceeds from sale of other assets |
458 | 2,300 | ||||||
| Proceeds from sale of a discontinued operation |
— | 1,200 | ||||||
| Other, net |
— | (134 | ) | |||||
|
|
|
|
|
|||||
| Net cash used for investing activities |
(8,511 | ) | (40,452 | ) | ||||
| Financing activities: |
||||||||
| Borrowings under credit facility |
— | 396,000 | ||||||
| Repayments under credit facility |
— | (359,700 | ) | |||||
| Repayments of short-term debt |
(1,002 | ) | (571 | ) | ||||
| Repayments of long-term debt |
(19,025 | ) | (2,100 | ) | ||||
| Issuance of common shares |
52 | 48 | ||||||
| Payment for debt financing costs and fees |
— | (102 | ) | |||||
| Other, net |
2 | (203 | ) | |||||
|
|
|
|
|
|||||
| Net cash (used for) provided by financing activities |
(19,973 | ) | 33,372 | |||||
| Effects of foreign exchange rate changes on cash and cash equivalents |
206 | (1,599 | ) | |||||
|
|
|
|
|
|||||
| Increase (decrease) in cash and cash equivalents |
53,879 | (8,752 | ) | |||||
| Cash and cash equivalents at beginning of period |
80,598 | 33,360 | ||||||
|
|
|
|
|
|||||
| Cash and cash equivalents at end of period |
$ | 134,477 | $ | 24,608 | ||||
|
|
|
|
|
|||||
| Supplementary Cash Flow information |
||||||||
| Interest paid |
$ | 20,475 | $ | 20,345 | ||||
| Income taxes paid, net of refunds |
8,452 | 2,693 | ||||||
| Capital expenditures, not yet paid |
410 | 701 | ||||||
See Notes to condensed consolidated financial statements.
F-48
Table of Contents
ATKORE INTERNATIONAL GROUP INC.
CONDENSED CONSOLIDATED STATEMENT OF EQUITY
(Unaudited)
| (in thousands, except share data) |
Shares | Common Stock Par Value |
Treasury Shares |
Additional Paid in Capital |
Accumulated Deficit |
Accumulated Other Comprehensive Loss |
Total Equity |
|||||||||||||||||||||
| Balance at September 26, 2015 |
45,586 | $ | 457 | $ | (2,580 | ) | $ | 352,674 | $ | (173,241 | ) | $ | (21,033 | ) | $ | 156,277 | ||||||||||||
| Net income |
— | — | — | — | 22,579 | — | 22,579 | |||||||||||||||||||||
| Other comprehensive income |
— | — | — | — | — | 299 | 299 | |||||||||||||||||||||
| Issuance of common shares |
4 | — | — | 52 | — | — | 52 | |||||||||||||||||||||
|
|
|
|
|
|
|
|
|
|
|
|
|
|
|
|||||||||||||||
| Balance at March 25, 2016 |
45,590 | $ | 457 | $ | (2,580 | ) | $ | 352,726 | $ | (150,662 | ) | $ | (20,734 | ) | $ | 179,207 | ||||||||||||
|
|
|
|
|
|
|
|
|
|
|
|
|
|
|
|||||||||||||||
See Notes to condensed consolidated financial statements.
F-49
Table of Contents
ATKORE INTERNATIONAL GROUP INC.
NOTES TO CONDENSED CONSOLIDATED FINANCIAL STATEMENTS
(unaudited)
(dollars in thousands, except share data)
| 1. | BASIS OF PRESENTATION AND SUMMARY OF SIGNIFICANT ACCOUNTING POLICIES |
Organization and Ownership Structure—Atkore International Group Inc. (the “Company” or “Atkore”) was incorporated in the State of Delaware on November 4, 2010. The Company owns 100% of Atkore International Holdings Inc. (“Atkore Holdings”), which is sole owner of Atkore International, Inc. (“Atkore International”). Prior to the transactions described below, all of the capital stock of Atkore International was owned by Tyco International Ltd. (“Tyco”). The business of Atkore International was operated as the Tyco Electrical and Metal Products (“TEMP”) business of Tyco. Atkore was initially formed by Tyco as a holding company to hold ownership of TEMP.
The Transactions—November 9, 2010, Tyco announced that it had entered into an agreement to sell a majority interest in TEMP to CD&R Allied Holdings, L.P. (the “CD&R Investor), an affiliate of the private equity firm Clayton Dubilier & Rice, LLC (“CD&R”). On December 22, 2010, the transaction was completed and CD&R acquired shares of a newly created class of cumulative convertible preferred stock (the “Preferred Stock”) of the Company. The Preferred Stock initially represented 51% of the Company’s outstanding capital stock (on an as-converted basis). The preferred stock is entitled to a 12% fixed, cumulative dividend paid quarterly (“Preferred Dividends”) and dividends on an as-converted basis when declared on common stock, (“Participating Dividends”). On December 22, 2010, the Company also issued common stock (the “Common Stock”) to Tyco’s wholly owned subsidiary, Tyco International Holding S.à.r.l. (“Tyco Seller”), that initially represented the remaining 49% of the Company’s outstanding capital stock. Subsequent to December 22, 2010, the Company has operated as an independent, stand-alone entity. The aforementioned transactions described in this paragraph are referred to herein as the “Transactions.”
On March 6, 2014, the Company entered into a non-binding letter of intent (the “Letter of Intent”) with Tyco for the acquisition (the “Acquisition”) of 29.4 million shares of Common Stock held by Tyco Seller. On April 9, 2014, the Company paid $250,000 to Tyco Seller to redeem the shares, which were subsequently retired. The Company paid $2,000 of expenses related to the share redemption.
In a separate transaction on the same date, the CD&R Investor converted its Preferred Stock and accumulated Preferred Dividends into Common Stock. As of September 26, 2014, Common Stock is the Company’s sole issued and outstanding class of securities.
Basis of Presentation—The accompanying unaudited condensed consolidated financial statements of the Company included herein have been prepared in accordance with accounting principles generally accepted in the United States of America (“GAAP”). These condensed consolidated financial statements have been prepared in accordance with the Company’s accounting policies and on the same basis as those financial statements included in the Company’s Annual Report for the fiscal year ended September 25, 2015, and should be read in conjunction with those consolidated financial statements and the notes thereto.
The unaudited condensed consolidated financial statements include the assets and liabilities used in operating the Company’s business. All intercompany balances and transactions have been eliminated in consolidation. The results of companies acquired or disposed of are included in the condensed consolidated financial statements from the effective date of acquisition or up to the date of disposal.
These statements include all adjustments (consisting of normal recurring adjustments) that the Company considered necessary to present a fair statement of its results of operations, financial position and cash flows. The
F-50
Table of Contents
results reported in these condensed consolidated financial statements should not be regarded as necessarily indicative of results that may be expected for the entire year.
Description of Business—The Company delivers a unique portfolio of integrated electrical raceway solutions and mechanical products and solutions that deploy, isolate and protect a structure’s electrical circuitry from source to outlet. Product offerings include metal conduit, armored cable, flexible conduit, framing systems, wire baskets, cable trays and other complementary products including fittings and mechanical pipe.
Fiscal Periods—The Company has a 52- or 53-week fiscal year that ends on the last Friday in September. It is the Company’s practice to establish quarterly closings using a 4-5-4 calendar. Fiscal year 2015 was a 52-week fiscal year which ended on September 25, 2015. Fiscal year 2016 will end on September 30, 2016, and will be a 53-week year. The Company’s fiscal quarters end on the last Friday in December, March and June.
Use of Estimates—The preparation of the consolidated financial statements in conformity with GAAP requires management to make estimates and assumptions that affect the reported amounts of assets and liabilities, disclose contingent assets and liabilities at the date of the consolidated financial statements and report the associated amounts of revenues and expenses. Significant estimates and assumptions are used for, but not limited to, allowances for doubtful accounts, estimates of future cash flows associated with asset impairments, useful lives for depreciation and amortization, loss contingencies, net realizable value of inventories, legal liabilities, income taxes and tax valuation allowances, pension and postretirement employee benefit liabilities and purchase price allocation. Actual results could differ materially from these estimates.
Fair Value Measurements—Authoritative guidance for fair value measurements establishes a three-level hierarchy that ranks the quality and reliability of information used in developing fair value estimates. The hierarchy gives the highest priority to quoted prices in active markets and the lowest priority to unobservable data. In cases where two or more levels of inputs are used to determine fair value, a financial instrument’s level is determined based on the lowest level input that is considered significant to the fair value measurement in its entirety. The three levels of the fair value hierarchy are summarized as follows:
| • | Level 1—inputs are based upon quoted prices (unadjusted) in active markets for identical assets or liabilities which are accessible as of the measurement date. |
| • | Level 2—inputs are based upon quoted prices for similar assets or liabilities in active markets, quoted prices for identical or similar assets or liabilities in markets that are not active, and model-derived valuations for the asset or liability that are derived principally from or corroborated by market data for which the primary inputs are observable, including forward interest rates, yield curves, credit risk and exchange rates. |
| • | Level 3—inputs for the valuations are unobservable and are based on management’s estimates of assumptions that market participants would use in pricing the asset or liability. The fair values are therefore determined using model-based techniques such as option pricing models and discounted cash flow models. |
Recent Accounting Pronouncements—On March 30, 2016, the Financial Accounting Standards Board, or “FASB,” issued Accounting Standards Update (“ASU”) 2016-09, Improvements to Employee Share-Based Payment Accounting, which amends Accounting Standards Codification (“ASC”) Topic 718, Compensation – Stock Compensation. ASU 2016-09 simplifies several aspects of the accounting for share-based payment transactions, including the income tax consequences, classification of awards as either equity or liabilities, and classification on the statement of cash flows. ASU 2016-09 is effective for fiscal years beginning after December 15, 2016, our fiscal 2018. Early adoption is permitted. We are evaluating the effect of adopting this new guidance and its impact on our results of operations, cash flows, or financial position
On March 17, 2016, the FASB issued ASU 2016-08, Principal versus Agent Considerations (Reporting Revenue Gross versus Net) that amends the principal versus agent guidance in ASU 2014-09. ASU 2016-08
F-51
Table of Contents
clarifies that the analysis must focus on whether the entity has control of the goods or services before they are transferred to the customer. The ASU also provides additional guidance about how to apply the control principle when services are provided and when goods or services are combined with other goods or services. The new standard effective date will coincide with ASU 2014-09. ASU 2014-09 will be effective beginning with annual periods beginning after December 15, 2017, our fiscal 2019. Early adoption is permitted. We are evaluating the effect of adopting this new guidance and its impact on our results of operations, cash flows, or financial position.
On February 25, 2016, the FASB issued ASU 2016-02, Leases (Topic 842). The ASU requires companies to use a “right of use” lease model that assumes that each lease creates an asset (the lessee’s right to use the leased asset) and a liability (the future rent payment obligations) which should be reflected on a lessee’s balance sheet to fairly represent the lease transaction and the lessee’s related financial obligations. We conduct some of our operations under leases that are accounted for as operating leases, with no related assets and liabilities on our balance sheet. The proposed changes would require that substantially all of our operating leases be recognized as assets and liabilities on our balance sheet. The ASU is effective for annual periods beginning after December 15, 2018, our fiscal 2020. Early adoption will be permitted. We are evaluating the effect of adopting this new accounting guidance and its impact on our results of operations, cash flows or financial position.
In November 2015, the FASB issued ASU 2015-17, “Income Taxes (Topic 740): Balance Sheet Classification of Deferred Taxes.” The amendment is part of the FASB’s simplification initiative and requires entities to present deferred tax assets and deferred tax liabilities as non-current in a classified balance sheet rather than as current and non-current. The guidance is effective for public business entities for annual and interim periods within those years beginning after December 15, 2016, our fiscal 2018. Early adoption is permitted and entities are permitted to apply the amendments either prospectively or retrospectively. We adopted this guidance in fiscal 2015 and applied the amendments retrospectively.
In September 2015, the FASB issued ASU 2015-16, Business Combinations (Topic 805): Simplifying the Accounting for Measurement-Period Adjustments. The ASU requires an acquirer to recognize provisional amounts that are identified during the measurement period in the reporting period in which the adjustment amounts are determined rather than restating prior periods. The ASU is effective on a prospective basis for interim and annual periods beginning after December 15, 2015. The Company adopted this new standard beginning with the 2016 fiscal year, and it did not have a material impact on the financial statements.
In June 2015, the FASB issued ASU 2015-10, “Technical Corrections and Improvements.” The ASU is part of an ongoing project on the FASB’s agenda to facilitate Codification updates for non-substantive technical corrections, clarifications, and improvements that are not expected to have a significant effect on accounting practice or create a significant administrative cost to most entities. The ASU will apply to all reporting entities within the scope of the affected accounting guidance. The amendments requiring transition guidance are effective for all entities for fiscal years, and interim periods within those fiscal years, beginning after December 15, 2015, our fiscal 2017. Early adoption is permitted, including adoption in an interim period. All other amendments will be effective upon the issuance of this Update. We are evaluating the effect of adopting this new accounting guidance and its impact on our results of operations, cash flows or financial position. We do not believe this update will have a material impact on the financial statements.
In May 2015, the FASB issued ASU 2015-07, “Fair Value Measurement (Topic 820): Disclosures for Investments in Certain Entities That Calculate Net Asset Value per Share (or Its Equivalent).” The update amends ASC 820, “Fair Value Measurement.” This ASU removes the requirement to categorize within the fair value hierarchy investments without readily determinable fair values in entities that elect to measure fair value using net asset value per share or its equivalent. The ASU requires that these investments continue to be shown in the investment disclosure amount to allow the disclosure to reconcile to the investment amount presented in the balance sheet. Effective for public business entities for fiscal years, and interim periods within those fiscal years beginning after December 15, 2015, our fiscal 2017. A reporting entity should apply the amendments retrospectively to all periods presented. The retrospective approach requires that an investment for which fair value is measured using the net asset value per share practical expedient be removed from the fair value
F-52
Table of Contents
hierarchy in all periods presented in an entity’s financial statements. Earlier application is permitted. We are evaluating the effect of adopting this new accounting guidance and its impact on our results of operations, cash flows or financial position. We do not believe this update will have a material impact on the financial statements.
In April 2015, the FASB issued ASU 2015-05, “Intangibles-Goodwill and Other-Internal-Use Software (Subtopic 350-40): Customer’s Accounting for Fees Paid in a Cloud Computing Arrangement.” This ASU provides guidance to customers about whether a cloud computing arrangement includes a software license. If an arrangement includes a software license, the accounting for the license will be consistent with licenses of other intangible assets. If the arrangement does not include a license, the arrangement will be accounted for as a service contract. Effective for annual periods, including interim periods within those annual periods, beginning after December 15, 2015, our fiscal 2017. Early adoption is permitted for all entities. We are evaluating the effect of adopting this new accounting guidance and its impact on our results of operations, cash flows or financial position. We do not believe this update will have a material impact on the financial statements.
In April 2015, the FASB issued ASU 2015-04, “Compensation-Retirement Benefits (Topic 715): Practical Expedient for the Measurement Date of an Employer’s Defined Benefit Obligation and Plan Assets.” The amendments allow companies and other organizations with fiscal years that do not end on the last day of a month to measure their defined benefit plans assets and liabilities as of the last day of the month closest to the end of the fiscal year. Effective for public business entities for financial statements issued for fiscal years, and interim periods within those fiscal years, beginning after December 15, 2015. Earlier application is permitted. We adopted this new accounting guidance in fiscal 2015.
In April 2015, the FASB issued ASU 2015-03, “Simplifying the Presentation of Debt Issuance Costs.” The update changes the presentation of debt issuance costs in the financial statements. The new ASU update requires an entity to present such costs in the balance sheet as a direct deduction from the related debt liability rather than as an asset. Amortization of these costs is reported as interest expense. For public business entities, the ASU’s guidance is effective for fiscal years, and interim periods within those fiscal years, beginning after December 15, 2015. We adopted this new accounting guidance in fiscal 2015 retrospectively for all periods presented.
In February 2015, the FASB issued ASU 2015-02 “Amendments to the Consolidation Analysis.” This update amends the consolidation requirements in ASC 810, “Consolidation.” The amendments change the consolidation analysis required under GAAP. For public business entities, the amendments in the ASU are effective for fiscal years, and interim periods within those fiscal years, beginning after December 15, 2015, our fiscal 2017. Early adoption, including adoption in an interim period, is permitted. We are evaluating the effect of adopting this new accounting guidance and its impact on our results of operations, cash flows or financial position. We do not believe this update will have a material impact on the financial statements.
In January 2015, the FASB issued ASU 2015-01, “Simplifying Income Statement Presentation by Eliminating the Concept of Extraordinary Items.” This update eliminates the concept of an extraordinary item from GAAP. As a result, an entity will no longer (1) segregate an extraordinary item from the results of ordinary operations; (2) separately present an extraordinary item on its income statement, net of tax, after income from continuing operations; or (3) disclose income taxes and earnings-per-share data applicable to an extraordinary item. However, the ASU does not affect the reporting and disclosure requirements for an event that is unusual in nature or that occurs infrequently. The update is effective for fiscal years, and interim periods within those fiscal years, beginning after December 15, 2015, our fiscal 2017. A reporting entity also may apply the amendments retrospectively to all prior periods presented in the financial statements. Early adoption is permitted provided that the guidance is applied from the beginning of the fiscal year of adoption. We are evaluating the effect of adopting this new accounting guidance and its impact on our results of operations, cash flows or financial position. We do not believe this update will have a material impact on the financial statements.
In May 2014, the FASB issued ASU 2014-09, “Revenue from Contracts with Customers,” as a new Topic, ASC 606. The new revenue recognition standard provides a five-step analysis of transactions to determine when and how revenue is recognized. The core principle is that a company should recognize revenue to depict the
F-53
Table of Contents
transfer of promised goods or services to customers in an amount that reflects the consideration to which the entity expects to be entitled in exchange for those goods or services. On August 12, 2015, the FASB announced that it would defer for one year the effective date of the new standard for public and nonpublic entities. The revised effective date for public entities will be annual periods beginning after December 15, 2017, our fiscal 2018. Early adoption is permitted. We are evaluating the effect of adopting this new accounting guidance and its impact on our results of operations, cash flows or financial position.
In April 2014, the FASB issued ASU No. 2014-08, “Reporting Discontinued Operations and Disclosure of Disposals of Components of an Entity,” or “ASU 2014-08.” The amended guidance requires that a disposal representing a strategic shift that has (or will have) a major effect on an entity’s financial results or a business activity classified as held for sale should be reported as discontinued operations. The amendments also expand the disclosure requirements for discontinued operations and add new disclosures for individually significant dispositions that do not qualify as discontinued operations. The amendments are effective prospectively for fiscal years, and interim reporting periods within those years, beginning on or after December 15. The impact on the Company of adopting ASU 2014-08 will depend on the nature and size of future disposals, if any, of a component of the Company after the effective date. We adopted this new accounting guidance beginning in the first fiscal quarter of 2016, and it did not have a material impact on the financial statements.
| 2. | ACQUISITIONS |
Fiscal Year 2015 Transactions—On October 20, 2014, Atkore Plastic Pipe Corporation, a wholly owned indirect subsidiary of the Company, acquired all of the outstanding stock of American Pipe & Plastics, Inc. (“APPI”). The aggregate purchase price was $6,572. APPI is a manufacturer of PVC conduit and is located in Kirkwood, New York. Additionally, on November 17, 2014, Atkore Steel Components, Inc., a wholly owned indirect subsidiary of the Company, acquired most of the assets and assumed certain liabilities of Steel Components, Inc. (“SCI”). The aggregate purchase price was $23,868. SCI provides steel and malleable iron electrical fittings for steel, flexible and liquidtight conduit, as well as armored cable. SCI is located in Coconut Creek, Florida.
The purchase price was allocated to tangible and intangible assets acquired and liabilities assumed, based on their estimated fair values. Fair value measurements have been applied based on assumptions that market participants would use in the pricing of the asset or liability. The following table summarizes the Level 3 fair values assigned to the net assets acquired and liabilities assumed as of the acquisition date:
| (in thousands) |
APPI | SCI | ||||||
| Fair value of consideration transferred: |
||||||||
| Cash consideration |
$ | 6,572 | $ | 23,837 | ||||
|
|
|
|
|
|||||
| Fair value of assets acquired and liabilities assumed: |
||||||||
| Accounts receivable |
1,813 | 4,302 | ||||||
| Inventories |
1,850 | 5,500 | ||||||
| Intangible assets |
480 | 10,600 | ||||||
| Fixed assets |
2,907 | 46 | ||||||
| Accounts payable |
(1,057 | ) | (690 | ) | ||||
| Other |
(808 | ) | 155 | |||||
|
|
|
|
|
|||||
| Net assets acquired |
5,185 | 19,913 | ||||||
|
|
|
|
|
|||||
| Excess purchase price attributed to goodwill acquired |
$ | 1,387 | $ | 3,924 | ||||
|
|
|
|
|
|||||
F-54
Table of Contents
Both acquisitions strengthen and diversify the Company’s Electrical Raceway reportable segment and its portfolio of products provided to electrical distribution customers. The Company funded both acquisitions using borrowings from Atkore International’s asset-based credit facility (“ABL Credit Facility”). The Company recognized $1,387 and $3,924 of goodwill for APPI and SCI, respectively. See Note 6. Goodwill and Intangible Assets. Goodwill consists of the excess of the purchase price over the net of the fair value of the acquired assets and assumed liabilities, and represents the estimated economic value attributable to future operations. Goodwill recognized from the APPI acquisition is non-deductible for income tax purposes. Goodwill recognized from the SCI acquisition is tax-deductible and is amortized over 15 years for income tax purposes. The goodwill arising from both acquisitions consists largely of the synergies and economies of scale from integrating these companies with existing businesses. Due to the immaterial nature of the acquisitions, both individually, and in the aggregate, the Company has not included the relevant period pro-forma results of operations for the acquisition year or previous years.
The following table summarizes the fair value of amortizable intangible assets as of the acquisition dates:
| ($ in thousands) |
APPI | SCI | ||||||||||||||
| Fair Value |
Weighted Average Useful Life (Years) |
Fair Value |
Weighted Average Useful Life (Years) |
|||||||||||||
| Amortizable intangible assets: |
||||||||||||||||
| Customer relationships |
$ | 300 | 10 | $ | 7,900 | 8 | ||||||||||
| Other |
180 | 4 | 2,700 | 14 | ||||||||||||
|
|
|
|
|
|||||||||||||
| Total amortizable intangible assets |
$ | 480 | $ | 10,600 | ||||||||||||
|
|
|
|
|
|||||||||||||
The SCI purchase agreement contains a provision for contingent consideration requiring the Company to pay the former owners an amount not to exceed $500 upon achieving certain performance targets. The Company recorded $190 reported in Accrued and other current liabilities as the best estimate of fair value of the contingent consideration on the opening balance sheet. The fair value estimate is considered a Level 3 measurement in accordance with the fair value hierarchy and the range of possible outcomes does not differ materially from the amount recorded. The performance target period of one year expired during the three months ended December 25, 2015 and the performance conditions were not met. As such, the Company recorded a reversal of the contingent liability as a component of Selling, general and administrative expense. The Company finalized the valuation of assets acquired and liabilities assumed included in the tables above during fiscal year 2015.
| 3. | RELATED PARTY TRANSACTIONS |
Annual consulting fees are paid to CD&R quarterly, in advance and recorded as a component of selling, general and administrative expenses in the Company’s condensed consolidated statement of operations. CD&R’s annual consulting fee is $3,500. Consulting fees for the three months ended March 25, 2016 and March 27, 2015 were $875. Consulting fees for the six months ended March 25, 2016 and March 27, 2015 were $1,750.
| 4. | INVENTORIES, NET. |
As of March 25, 2016 and September 25, 2015, inventories were comprised of:
| (in thousands) |
March 25, 2016 |
September 25, 2015 |
||||||
| Purchased materials and manufactured parts, net |
$ | 30,656 | $ | 42,562 | ||||
| Work in process, net |
16,065 | 13,360 | ||||||
| Finished goods, net |
108,166 | 111,743 | ||||||
| LIFO reserves |
(663 | ) | (5,741 | ) | ||||
|
|
|
|
|
|||||
| Inventories, net |
$ | 154,224 | $ | 161,924 | ||||
|
|
|
|
|
|||||
F-55
Table of Contents
As of March 25, 2016 and September 25, 2015, the excess and obsolete inventory reserve was $9,113 and $10,201, respectively.
Approximately 90% and 80% of the Company’s inventories are valued at the lower of LIFO cost or market at March 25, 2016 and September 25, 2015, respectively.
During the three months ended March 25, 2016, market conditions for raw material prices did not require a downward adjustment for lower-of-cost-or-market. The Company recorded a decrease in the lower-of-cost-or-market reserves of $1,935 and incremental reserves of $205 for the three months ended March 27, 2015 as a component of cost of sales in the Company’s condensed consolidated statement of operations. The Company recorded $1,954 and $205 of incremental lower-of-cost-or-market reserves during the six months ended March 25, 2016 and March 27, 2015, respectively.
| 5. | PROPERTY, PLANT AND EQUIPMENT |
As of March 25, 2016 and September 25, 2015, property, plant and equipment at cost and accumulated depreciation were:
| (in thousands) |
March 25, 2016 |
September 25, 2015 |
||||||
| Land |
$ | 12,804 | $ | 13,294 | ||||
| Buildings and related improvements |
102,909 | 104,315 | ||||||
| Machinery and equipment |
236,715 | 231,237 | ||||||
| Leasehold improvements |
5,803 | 5,572 | ||||||
| Construction in progress |
11,591 | 10,582 | ||||||
|
|
|
|
|
|||||
| Property, plant and equipment |
369,822 | 365,000 | ||||||
| Accumulated depreciation |
(155,610 | ) | (140,716 | ) | ||||
|
|
|
|
|
|||||
| Property, plant and equipment, net |
$ | 214,212 | $ | 224,284 | ||||
|
|
|
|
|
|||||
Depreciation expense for the three and six months ended March 25, 2016 totaled $7,677 and $15,653, respectively. Depreciation expense for the three and six months ended March 27, 2015 totaled $8,935 and $18,498 respectively.
| 6. | GOODWILL AND INTANGIBLE ASSETS |
Goodwill—There were no changes in the carrying amount of goodwill during the six months ended March 25, 2016.
| (in thousands) |
Segment | Total | ||||||||||
| Electrical Raceway |
Mechanical Products & Solutions |
|||||||||||
| Balance at March 25, 2016 |
||||||||||||
| Goodwill |
$ | 80,564 | $ | 82,189 | $ | 162,753 | ||||||
| Accumulated impairment losses |
(3,924 | ) | (43,000 | ) | (46,924 | ) | ||||||
|
|
|
|
|
|
|
|||||||
| $ | 76,640 | $ | 39,189 | $ | 115,829 | |||||||
|
|
|
|
|
|
|
|||||||
The Company assesses the recoverability of goodwill on an annual basis in accordance with Accounting Standards Codification—Intangibles—Goodwill and Other (“ASC 350”). The measurement date is the first day of the fourth fiscal quarter, or more frequently, if triggering events occur. During the six months ended March 25, 2016 there were no triggering events as defined by ASC 350; therefore, the Company did not perform a test to assess the recoverability of goodwill.
F-56
Table of Contents
Intangible Assets—The Company also assesses the recoverability of its indefinite-lived trade names on an annual basis or more frequently, if triggering events occur, in accordance with ASC 350. The Company uses the relief from royalty method, an income approach method, to quantify the fair value of its trade names. The measurement date is the first day of the fourth fiscal quarter, or more frequently, if triggering events occur. During the six months ended March 25, 2016 there were no triggering events as defined by ASC 350; therefore, the Company did not perform a test to assess the recoverability of indefinite-lived intangible assets.
The following table provides the gross carrying value, accumulated amortization, and net carrying value for each major class of intangible assets:
| ($ in thousands) |
March 25, 2016 | September 25, 2015 | ||||||||||||||||||||||||||
| Weighted Average Useful Life (Years) |
Gross Carrying Value |
Accumulated Amortization |
Net Carrying Value |
Gross Carrying Value |
Accumulated Amortization |
Net Carrying Value |
||||||||||||||||||||||
| Amortizable Intangible Assets: |
||||||||||||||||||||||||||||
| Customer Relationships |
13 | $ | 249,245 | $ | (87,212 | ) | $ | 162,033 | $ | 249,245 | $ | (77,112 | ) | $ | 172,133 | |||||||||||||
| Other |
7 | 16,943 | (6,770 | ) | 10,173 | 16,943 | (5,781 | ) | 11,162 | |||||||||||||||||||
|
|
|
|
|
|
|
|
|
|
|
|
|
|||||||||||||||||
| Total |
266,188 | (93,982 | ) | 172,206 | 266,188 | (82,893 | ) | 183,295 | ||||||||||||||||||||
| Indefinite-lived Intangible Assets: |
||||||||||||||||||||||||||||
| Trade names |
93,880 | — | 93,880 | 93,880 | — | 93,880 | ||||||||||||||||||||||
|
|
|
|
|
|
|
|
|
|
|
|
|
|||||||||||||||||
| Total |
$ | 360,068 | $ | (93,982 | ) | $ | 266,086 | $ | 360,068 | $ | (82,893 | ) | $ | 277,175 | ||||||||||||||
|
|
|
|
|
|
|
|
|
|
|
|
|
|||||||||||||||||
Amortization expense for the three and six months ended March 25, 2016 was $5,572 and $11,089. Amortization expense for the three and six months ended March 27, 2015 totaled $5,373 and $10,526, respectively. Expected amortization expense for intangible assets over the next five years and thereafter is as follows:
| Remaining in 2016 |
10,980 | |||
| 2017 |
21,776 | |||
| 2018 |
21,267 | |||
| 2019 |
21,194 | |||
| 2020 |
20,980 | |||
| 2021 |
20,853 | |||
| Thereafter |
55,156 |
Actual amounts of amortization may differ from estimated amounts due to additional intangible asset acquisitions, impairment of intangible assets, and other events.
| 7. | ACCRUED AND OTHER CURRENT LIABILITIES |
As of March 25, 2016 and September 25, 2015, accrued and other current liabilities were comprised of:
| (in thousands) |
March 25, 2016 |
September 25, 2015 |
||||||
| Accrued compensation and employee benefits |
$ | 23,026 | $ | 31,146 | ||||
| Accrued transportation costs |
12,641 | 13,627 | ||||||
| Accrued interest |
8,589 | 9,890 | ||||||
| Deferred gain on sale of investment |
9,121 | 9,121 | ||||||
| Product liability |
2,700 | 2,700 | ||||||
| Accrued professional services |
5,883 | 6,535 | ||||||
| Accrued restructuring |
796 | 4,413 | ||||||
| Other |
18,547 | 19,840 | ||||||
|
|
|
|
|
|||||
| Accrued and other current liabilities |
$ | 81,303 | $ | 97,272 | ||||
|
|
|
|
|
|||||
F-57
Table of Contents
| 8. | DEBT |
Debt as of March 25, 2016 and September 25, 2015 was as follows:
| (in thousands) |
March 25, 2016 |
September 25, 2015 |
||||||
| First lien loan due April 9, 2021 |
$ | 412,200 | $ | 414,150 | ||||
| Second lien loan due October 9, 2021 |
229,306 | 248,036 | ||||||
| Deferred financing costs |
(9,870 | ) | (11,622 | ) | ||||
| Other |
614 | 1,644 | ||||||
|
|
|
|
|
|||||
| Total debt |
$ | 632,250 | $ | 652,208 | ||||
| Current portion |
1,881 | 2,864 | ||||||
|
|
|
|
|
|||||
| Long-term debt |
$ | 630,369 | $ | 649,344 | ||||
|
|
|
|
|
|||||
Term Loan Facilities—On April 9, 2014, Atkore International entered into a credit agreement for the $420,000 First Lien Term Loan Facility (the “First Lien Term Loan Facility”), and a credit agreement for the $250,000 Second Lien Term Loan Facility (the “Second Lien Term Loan Facility” and together with the First Lien Term Loan Facility, the “Term Loan Facilities”). The First Lien Term Loan Facility was priced at 99.5%, has an interest rate of LIBOR plus 3.5% with a LIBOR floor of 1.00%, and matures on April 9, 2021. The Second Lien Term Loan Facility was priced at 99.0%, has an interest rate of LIBOR plus 6.75% with a LIBOR floor of 1.00%, and matures on October 9, 2021. The Term Loan Facilities contain covenants typical for this type of financing, including limitations on indebtedness, restricted payments including dividends, liens, restrictions on distributions from restricted subsidiaries, sales of assets, affiliate transactions, mergers and consolidations. The Term Loan Facilities also contain customary events of default typical for this type of financing, including, without limitation, failure to pay principal and/or interest when due, failure to observe covenants, certain events of bankruptcy, the rendering of certain judgments, or the loss of any guarantee. Atkore International used the proceeds from the Term Loan Facilities to redeem the Notes (as defined below) and to pay a dividend to Atkore Holdings, which in turn paid a dividend to the Company. The Company used the dividend proceeds to redeem 29.4 million shares of Common Stock held by Tyco Seller for an aggregate cash purchase price of $250,000.
On January 22, 2016, Atkore International redeemed $17,000 of the Second Lien Term Loan Facility at a redemption price of 89.00% of the par value, and $2,000 at a redemption price of 89.75% of the par value. The Company recorded a gain on the extinguishment of debt of $1,661.
The approximate fair value of the First Lien Term Loan Facility was $401,289 and the Second Lien Term Loan Facility was $209,632 as of March 25, 2016. In determining the approximate fair value of its long-term debt, the Company used the trading value among financial institutions for the Term Loan Facilities, which were classified within Level 2 of the fair value hierarchy.
Notes—Atkore International issued Senior Secured Notes (the “Notes”) on December 22, 2010 in an aggregate principal amount of $410,000, due on January 1, 2018, with a coupon of 9.875%. The obligations under the Notes were senior to unsecured indebtedness of Atkore Holdings. Interest on the Notes was payable on a semi-annual basis, commencing on July 1, 2011. Atkore International’s obligations under the Notes were fully and unconditionally guaranteed on a stand-alone senior secured basis by Atkore Holdings and were fully and unconditionally guaranteed on a joint and several senior secured basis by each of Atkore International’s domestic subsidiaries that was a borrower or guarantor under the ABL Credit Facility and contained covenants typical for this type of financing. Atkore International redeemed $41,000 of the Notes on November 25, 2013 pursuant to the terms of the indenture governing the Notes at a redemption price of 103% of the principal amount redeemed, plus interest accrued to the redemption date. The remaining Notes were redeemed on April 9, 2014 pursuant to the terms of the indenture governing the Notes at a redemption price of 107.406% of the principal amount redeemed, plus interest accrued to the redemption date, using the proceeds from the April 9, 2014 refinancing.
F-58
Table of Contents
ABL Credit Facility—On December 17, 2014, Atkore International exercised $25,000 of the accordion provision contained in the credit agreement governing the ABL Credit Facility, dated December 22, 2010 and as amended, which increased the aggregate commitments of the lenders from $300,000 to $325,000. Exercising the accordion provision resulted in the payment of fees of $102. On April 9, 2014, Atkore International entered into the Third Amendment to the ABL Credit Facility. The April 9, 2014 amendment incorporated changes necessary to accommodate the repurchase of outstanding shares of Common Stock held by Tyco Seller and the entry into the Term Loan Facilities. On October 23, 2013, Atkore International entered into the Second Amendment to the ABL Credit Facility which increased the aggregate commitments of the lenders to $300,000, reduced interest spreads and amended certain other terms.
The ABL Credit Facility is guaranteed by Atkore Holdings and the U.S. operating companies owned by Atkore International. Atkore International’s availability under the ABL Credit Facility was $238,619 and $255,755 as of March 25, 2016 and September 25, 2015, respectively. Availability under the ABL Credit Facility is subject to a borrowing base equal to the sum of 85% of eligible accounts receivable plus 80% of eligible inventory of each borrower and guarantor, subject to certain limitations. The interest rate on the ABL Credit Facility is LIBOR plus an applicable margin ranging from 1.50% to 2.00%, or an alternate base rate for U.S. Dollar denominated borrowings plus an applicable margin ranging from 0.50% to 1.00%. The ABL Credit Facility matures on October 23, 2018. The ABL Credit Facility contains customary representations and warranties and customary affirmative and negative covenants. Affirmative covenants include, without limitation, the timely delivery of quarterly and annual financial statements, certifications to be made by Atkore Holdings, payment of obligations, maintenance of corporate existence and insurance, notices, compliance with environmental laws, and the grant of liens. The negative covenants include, without limitation, the following: limitations on indebtedness, dividends and distributions, investments, prepayments or redemptions of subordinated indebtedness, amendments of subordinated indebtedness, transactions with affiliates, asset sales, mergers, consolidations and sales of all or substantially all assets, liens, negative pledge clauses, changes in fiscal periods, changes in line of business and changes in charter documents. Additionally, if the availability under the ABL Credit Facility falls below certain levels, Atkore Holdings would subsequently be required to maintain a minimum fixed charge coverage ratio. Atkore International was not subject to the minimum fixed charge coverage ratio during any period subsequent to the establishment of the ABL credit facility.
The Company’s remaining financial instruments consist primarily of cash and cash equivalents, accounts receivable and accounts payable.
| 9. | INCOME TAXES |
For the three months ended March 25, 2016 and March 27, 2015, the Company’s effective income tax rate attributable to income from operations before income taxes was 38.4% and 32.6%, respectively.
The effective tax rate for the three months ended March 25, 2016 varied from the United States statutory tax rate primarily as a result of the impact of state taxes and other permanent items including nondeductible transaction costs which were partially offset by benefits of the Section 199 Domestic Production Activities Deduction and qualifying expenses from research and development activities.
The effective tax rate for the three months ended March 27, 2015 varied from the United States statutory tax rate primarily as a result of a change in the geographic mix of earnings, including a difference in the proportion of losses in foreign jurisdictions without an associated tax benefit in the respective period.
For the six months ended March 25, 2016 and March 27, 2015, the Company’s effective income tax rate attributable to income from operations before income taxes was 37.1% and 44.7% respectively.
The effective tax rate for the six months ended March 25, 2016 varied from the United States statutory tax rate primarily as a result of losses incurred in jurisdictions with no associated tax benefit, state income taxes, and other permanent items including nondeductible transaction costs netted against benefits of the Section 199 Domestic Production Activities Deduction and qualifying expenses from research and development activities.
F-59
Table of Contents
The effective tax rate for the six months ended March 27, 2015 varied from the United States statutory tax rate primarily as a result of certain nondeductible permanent items, and the mix of earnings geographically, including the impact of incurring losses in foreign jurisdictions without an associated tax benefit partially offset by the benefit of the release of certain reserves for uncertain tax positions indemnified by Tyco.
A valuation allowance has been recorded against certain net operating losses in certain foreign jurisdictions. A valuation allowance is recorded when it is determined to be more likely than not that these assets will not be fully realized in the foreseeable future. The realization of deferred tax assets is dependent upon whether the Company can generate future taxable income in the appropriate character and jurisdiction to utilize the assets. The amount of the deferred tax assets considered realizable is subject to adjustment in future periods.
The company recognizes the benefits of uncertain tax positions taken or expected to be taken in tax returns in the provision for income taxes only for those positions that we have determined are more likely than not to be realized upon examination. We record interest and penalties related to unrecognized tax benefits as a component of the provision for income taxes. The partial releases of uncertain tax positions during the six months ended March 25, 2016 resulted from audit closures and statute expirations and were not material. The Company is fully indemnified by its former parent for uncertain tax positions taken prior to December 22, 2010.
For the three months ended March 25, 2016, the Company made no additional provision for U.S. or non-U.S. income taxes on the undistributed income of subsidiaries or for unrecognized deferred tax liabilities for temporary differences related to basis differences in investments in subsidiaries, as such income is expected to be indefinitely reinvested, the investments are essentially permanent in duration, or the Company has concluded that no additional tax liability will arise as a result of the distribution of such income.
| 10. | POSTRETIREMENT BENEFITS |
The Company has a number of noncontributory and contributory defined benefit retirement plans covering certain U.S. employees. Net periodic pension benefit cost is based on periodic actuarial valuations that use the projected unit credit method of calculation and is charged to the statements of operations on a systematic basis over the expected average remaining service lives of current participants. Contribution amounts are determined based on local regulations and with the assistance of professionally qualified actuaries in the countries concerned. The benefits under the defined benefit plans are based on various factors, such as years of service and compensation.
The net periodic benefit cost for the three and six months ended March 25, 2016 and March 27, 2015 was as follows:
| (in thousands) |
Three Months Ended | Six Months Ended | ||||||||||||||
| March 25, 2016 |
March 27, 2015 |
March 25, 2016 |
March 27, 2015 |
|||||||||||||
| Service cost |
$ | 474 | $ | 628 | $ | 947 | $ | 1,255 | ||||||||
| Interest cost |
1,036 | 1,196 | 2,072 | 2,392 | ||||||||||||
| Expected return on plan assets |
(1,580 | ) | (1,702 | ) | (3,159 | ) | (3,402 | ) | ||||||||
| Amortization of actuarial loss |
180 | 22 | 360 | 44 | ||||||||||||
|
|
|
|
|
|
|
|
|
|||||||||
| Net periodic benefit cost |
$ | 110 | $ | 144 | $ | 220 | $ | 289 | ||||||||
|
|
|
|
|
|
|
|
|
|||||||||
The amortization of actuarial losses reclassified from accumulated other comprehensive loss during the three months ended March 25, 2016 and March 25, 2016 were $180 and $22, respectively. The amortization of actuarial losses reclassified from accumulated other comprehensive loss during the six months ended March 25, 2016 and March 25, 2016 were $360 and $44, respectively. The amortization of actuarial loss is included as a component of cost of sales on the Company’s condensed consolidated statements of operations.
F-60
Table of Contents
The Company contributed $116 and $298 to its pension plans during the three months ended March 25, 2016 and March 27, 2015, respectively. The Company contributed $253 and $630 to its pension plans during the six months ended March 25, 2016 and March 27, 2015, respectively.
Multi-Employer Plan—The Company has a liability of $6,643 as of March 25, 2016 and $6,778 as of September 25, 2015, representing the Company’s proportionate share of a multi-employer pension plan which was exited in a prior year.
| 11. | EARNINGS PER SHARE |
Basic earnings per common share is computed by dividing net income available to common stockholders by the weighted average number of shares of Common Stock outstanding for the period.
The computation of diluted earnings per share includes the effect of potential Common Stock, if dilutive. As the Company intends to settle all employee stock options in cash, the potential issuance of shares of Common Stock related to these options does not affect diluted shares. There are no other potentially dilutive instruments outstanding.
| (in thousands, except per share data) |
Three Months Ended | Six Months Ended | ||||||||||||||
| March 25, 2016 |
March 27, 2015 |
March 25, 2016 |
March 27, 2015 |
|||||||||||||
| Basic and Diluted Earnings per Share Numerator: |
||||||||||||||||
| Net income |
$ | 14,007 | $ | 5,800 | $ | 22,579 | $ | 3,038 | ||||||||
|
|
|
|
|
|
|
|
|
|||||||||
| Basic and Diluted Earnings per Share Denominator: |
||||||||||||||||
| Weighted average shares outstanding |
45,643 | 45,653 | 45,653 | 45,648 | ||||||||||||
| Basic and Diluted net income per share |
$ | 0.31 | $ | 0.13 | $ | 0.49 | $ | 0.07 | ||||||||
| 12. | STOCK INCENTIVE PLAN |
On May 16, 2011, the Company’s Board of Directors adopted the Atkore International Group Inc. Stock Incentive Plan (the “Stock Incentive Plan”). A maximum of 6.5 million shares of Common Stock is reserved for issuance under the Stock Incentive Plan. The Stock Incentive Plan provides for stock purchases and grants of other equity awards, including non-qualified stock options, restricted stock, and restricted stock units, to officers, and key employees.
Stock options vest ratably over five years. Compensation expense, based on the fair market value of the Options, is charged to selling, general and administrative expenses over the respective vesting periods. All options and rights have a ten year life.
During the year ended September 26, 2014, the Company’s Board of Directors modified the Stock Incentive Plan. The modification provides the Company discretion to net settle stock option awards in cash. Subsequent to the modification, several former employees requested and were granted net cash settlements. The Company did not have stock option exercises prior to the fiscal year ended September 26, 2014. Consequently, the modification triggered a change from equity accounting to liability accounting for all remaining outstanding options. The fair values of outstanding options are remeasured each reporting period using the Black-Scholes model.
The assumptions used for re-measurement as of March 25, 2016 were as follows:
| Six Months Ended March 25, 2016 |
||||
| Expected dividend yield |
— | % | ||
| Expected volatility |
35 | % | ||
| Range of risk free interest rates |
1.24% - 1.97 | % | ||
| Range of expected option lives |
2.70 - 6.47 years | |||
| Range of fair values |
$ | 10.85 - $13.18 | ||
F-61
Table of Contents
There were 4.9 million and 4.9 million options outstanding and issued under the Stock Incentive Plan as of March 25, 2016 and September 25, 2015, respectively. Compensation expense related to stock-based compensation plans was $9,998 and $377 for the three months ended March 25, 2016 and March 27, 2015, respectively due to an increase in the estimated fair value of a share of our common stock. Compensation expense related to stock-based compensation plans was $12,043 and $1,801 for the six months ended March 25, 2016 and March 27, 2015, respectively. Compensation expense is included in selling, general and administrative expenses.
The number of options exercised during the six months ended March 25, 2016 and March 27, 2015 were 13 thousand and 91 thousand, respectively. The amount of cash the Company paid to settle the options exercised during the six months ended March 25, 2016 and March 27, 2015 was $43 and $228, respectively.
The expected life of options represents the weighted-average period of time that options granted are expected to be outstanding, giving consideration to vesting schedules and expected exercise patterns. The risk-free interest rate is based on the U.S. Treasury yield curve in effect at the time of the grant for periods corresponding with the expected life of the options. Expected volatility is based on historical volatilities of comparable companies. Dividends are not paid on Common Stock.
Stock option activity for the period September 25, 2015 to March 25, 2016 was as follows:
| (share amounts in thousands) |
Shares | Weighted- Average Exercise Price |
Weighted- Average Remaining Contractual Term (in years) |
|||||||||
| Outstanding as of September 25, 2015 |
4,924 | $ | 10.55 | 7.4 | ||||||||
| Granted |
11 | 14.90 | 10.0 | |||||||||
| Exercised |
(13 | ) | 10.77 | — | ||||||||
| Forfeited |
(16 | ) | 12.50 | — | ||||||||
|
|
|
|||||||||||
| Outstanding as of March 25, 2016 |
4,906 | 10.56 | 6.8 | |||||||||
| Vested as of March 25, 2016 |
2,704 | 10.18 | 6.2 | |||||||||
As of March 25, 2016, there was $21,293 of total unrecognized compensation expense related to non-vested options granted. The compensation expense is expected to be recognized over a weighted-average period of approximately three years.
| 13. | FAIR VALUE MEASUREMENTS |
Authoritative guidance for fair value measurements establishes a three-level hierarchy that ranks the quality and reliability of information used in developing fair value estimates. The hierarchy gives the highest priority to quoted prices in active markets and the lowest priority to unobservable data. In cases where two or more levels of inputs are used to determine fair value, a financial instrument’s level is determined based on the lowest level input that is considered significant to the fair value measurement in its entirety. The three levels of the fair value hierarchy are summarized as follows:
| • | Level 1—inputs are based upon quoted prices (unadjusted) in active markets for identical assets or liabilities that are accessible as of the measurement date. |
| • | Level 2—inputs are based upon quoted prices for similar assets or liabilities in active markets, quoted prices for identical or similar assets or liabilities in markets that are not active, and model-derived valuations for the asset or liability that are derived principally from or corroborated by market data for which the primary inputs are observable, including forward interest rates, yield curves, credit risk and exchange rates. |
F-62
Table of Contents
| • | Level 3—inputs for the valuations are unobservable and are based on management’s estimates of assumptions that market participants would use in pricing the asset or liability. The fair values are therefore determined using model-based techniques such as option pricing models and discounted cash flow models. |
Certain assets and liabilities are required to be recorded at fair value on a recurring basis. The Company’s assets and liabilities to be adjusted to fair value on a recurring basis are cash equivalents and assets held for sale.
In addition to assets and liabilities that are recorded at fair value on a recurring basis, the Company is required to record certain assets and liabilities at fair value on a nonrecurring basis. The Company recognized impairment of certain property, plant and equipment for the year ended September 25, 2015 which required those assets to be recorded at their fair value.
We separately disclose the fair value of any debt-related obligations within Note 8. Debt.
We valued our assets held for sale and our property, plant and equipment based upon the estimated sales price less costs to dispose as of March 25, 2016 and September 25, 2015. Selling price is estimated based on market transactions for similar assets. The significant unobservable input used in the fair value measurement of our assets held for sale is the estimated selling price. Changes in the estimated selling price would not have a significant impact on the estimated fair value.
The following table presents the assets and liabilities measured at fair value on a recurring basis as of March 25, 2016 and September 25, 2015 in accordance with the fair value hierarchy:
| March 25, 2016 | September 25, 2015 | |||||||||||||||||||||||
| Level 1 | Level 2 | Level 3 | Level 1 | Level 2 | Level 3 | |||||||||||||||||||
| Assets |
||||||||||||||||||||||||
| Cash equivalents |
$ | 86,025 | $ | — | $ | — | $ | 54,032 | $ | — | $ | — | ||||||||||||
| Assets held for sale |
— | — | 6,663 | — | — | 3,313 | ||||||||||||||||||
We did not have any non-recurring fair value measurements as of March 25, 2016.
| 14. | RESTRUCTURING CHARGES |
The remaining liability for restructuring reserves as of March 25, 2016 are included within accrued and other current liabilities in the Company’s condensed consolidated balance sheets as follows:
| Electrical Raceway |
Mechanical Products & Solutions |
Corporate | ||||||||||||||||||||||
| (in thousands) |
Severance | Severance | Other | Severance | Other | Total | ||||||||||||||||||
| Balance as of September 25, 2015 |
$ | — | $ | 3,717 | $ | 620 | $ | 15 | $ | 61 | $ | 4,413 | ||||||||||||
| Charges |
28 | 630 | 1,255 | — | 156 | 2,069 | ||||||||||||||||||
| Utilization |
(28 | ) | (4,097 | ) | (1,360 | ) | (13 | ) | (183 | ) | (5,681 | ) | ||||||||||||
| Reversals / exchange rate effects |
— | (5 | ) | — | — | — | (5 | ) | ||||||||||||||||
|
|
|
|
|
|
|
|
|
|
|
|
|
|||||||||||||
| Balance as of March 25, 2016 |
$ | — | $ | 245 | $ | 515 | $ | 2 | $ | 34 | $ | 796 | ||||||||||||
|
|
|
|
|
|
|
|
|
|
|
|
|
|||||||||||||
During the three and six months ended March 25, 2016, the Company recorded $775 and $2,069, respectively of severance-related and other charges related to the exit of its Fence and Sprinkler product lines and the closure of a facility in Philadelphia, PA. During the three and six months ended months ended March 27, 2015, the Company recorded $154 and $167, respectively of severance-related and other charges. Restructuring charges are included as a component of selling, general and administrative expenses in the Company’s condensed consolidated statement of operations.
F-63
Table of Contents
| 15. | COMMITMENTS AND CONTINGENCIES |
The Company has obligations related to commitments to purchase certain goods. As of March 25, 2016, such obligations were $94,430 for the rest of fiscal year 2016, $2,626 for year two and $1,231 thereafter. These amounts represent open purchase orders for materials used in production.
Legal Contingencies—The Company is a defendant in a number of pending legal proceedings, some of which were inherited from Tyco, including product liability claims. Several lawsuits have been filed against the Company and the Company has also received other claim demand letters alleging that the Company’s anti-microbial coated steel sprinkler pipe (“ABF”) causes environmental stress cracking in chlorinated polyvinyl chloride (“CPVC”) pipe when the steel ABF pipe and CPVC pipe are installed together in the same sprinkler system, which we refer to collectively as the “Special Products Claims.” After an analysis of claims experience, the Company reserved its best estimate of the probable and estimable losses related to these matters. The Company’s product liability reserve related to ABF matters were $2,990 and $2,783 as of March 25, 2016 and September 25, 2015, respectively. The Company separately reserves for other product liability matters that do not involve ABF. The Company’s other product liability reserves were $3,085 and $2,666 as of December 25, 2015 and September 25, 2015, respectively. The Company believes that the range of expected losses for ABF and other product liabilities is between $3,000 and $10,000.
On November 16, 2015, the Company was served with a Special Products Claim, Wind Condominium Association, Inc., et al. v. Allied Tube & Conduit Corporation, et al., a putative class action claim in the Southern District of Florida. The lawsuit asserts that the Company’s installed steel pipe was not compatible with CPVC pipe and defines a “National Class” and a “Florida Subclass” consisting of all condominium associations and building owners who had ABF and/or ABF II installed in combination with CPVC from January 1, 2003 through December 31, 2010 nationwide and in Florida, respectively. At this time, the Company does not expect the outcome of this matter or the other Special Products Claims proceedings, either individually or in the aggregate, to have a material effect on its financial statements, and the Company believes that its reserves are adequate for Special Products Claims contingencies. However, it is possible that additional reserves could be required in the future that could have a material effect on the Company’s financial statements. This additional loss or range of losses cannot be recorded at this time, as it is not reasonably estimable.
In addition to the matters above, from time to time, the Company is subject to a number of disputes, administrative proceedings and other claims arising out of the conduct of the Company’s business. These matters generally relate to disputes arising out of the use or installation of the Company’s products, product liability litigation, contract disputes, patent infringement accusations, employment matters and similar matters. On the basis of information currently available to the Company, it does not believe that existing proceedings and claims will have a material impact on its net assets, income or cash flows. However, litigation is unpredictable, and the Company could incur judgments or enter into settlements for current or future claims that could adversely affect its financial statements. The Company also has legal liabilities related to non-product liability matters totaling $892.
| 16. | GUARANTEES |
The Company has outstanding letters of credit for $7,310 supporting workers’ compensation and general liability insurance policies, and $1,500 supporting foreign lines of credit. The Company also has outstanding letters of credit totaling $9,121 as collateral for four advance payments it has received pursuant to the sale of its minority ownership share in Abahsain-Cope Saudi Arabia Ltd. Pursuant to this matter, the Company received all four payments as of September 25, 2015. The bank guarantees will be canceled when the transfer of ownership is complete. As of March 25, 2016, the risk and title transfer was not complete. The Company also has surety bonds primarily related to performance guarantees on supply agreements and construction contracts, and payment of duties and taxes totaling $8,122.
F-64
Table of Contents
In disposing of assets or businesses, the Company often provides representations, warranties and indemnities to cover various risks including unknown damage to the assets, environmental risks involved in the sale of real estate, liability to investigate and remediate environmental contamination at waste disposal sites and manufacturing facilities, and unidentified tax liabilities and legal fees related to periods prior to disposition. The Company does not have the ability to estimate the potential liability from such indemnities because they relate to unknown conditions. However, the Company has no reason to believe that these uncertainties would have a material effect on the Company’s financial statements.
In the normal course of business, the Company is liable for product performance and contract completion. In the opinion of management, such obligations will not significantly affect the Company’s financial statements.
| 17. | ASSETS HELD FOR SALE |
| (in thousands) |
March 25, 2016 |
September 25, 2015 |
||||||
| Assets held for sale |
$ | 6,663 | $ | 3,313 | ||||
|
|
|
|
|
|||||
During the three months ended December 25, 2015, the Company exited a manufacturing facility located in Philadelphia, PA. As of December 25, 2015, the Company did not meet all of the held for sale criteria in accordance with ASC 360—Property, Plant and Equipment. During the three months ended March 25, 2016, the Company met all remaining criteria including actively marketing the property at a price reasonable to its current fair value. Consequently, the Company classified the property and the associated land value as assets held for sale in the Company’s condensed consolidated balance sheet. The total carrying value of the land and property is $3,350.
In a prior fiscal year, the Company entered into a share purchase agreement pursuant to which the Company would sell its minority ownership share in Abahsain-Cope Saudi Arabia Ltd. for cash consideration of approximately $10,000, which was paid into an escrow account in May 2012. All amounts paid into the escrow account have been distributed and the account has been closed. The total carrying value of the investment is $3,313. The Company will recognize the gain on the sale when transfer of ownership is completed.
| 18. | SEGMENT INFORMATION |
The Company has two operating segments, which are also its reportable segments. The Company’s operating segments are organized based upon primary market channels and, in most instances, the end use of products.
Electrical Raceway—Product offerings include steel conduit and fittings, plastic conduit and fittings, armored cable (an alternative for steel conduit in some instances), flexible and liquidtight conduit, cable tray, and ancillary products such as wire baskets, cable ladders and accessories. These products represent a broad array of products used in non-residential buildings such as hospitals, manufacturing plants, data centers, etc. The electrical infrastructure in many of these buildings requires conduit, cables, fittings, etc. These products are sold into the electrical market primarily through distribution networks.
Mechanical Products & Solutions—Product offerings include in-line galvanized tubular products and mechanical framework and services. Additionally, this segment provides ancillary value-added engineering, installation and pre-fabrication solutions. These products serve a variety of end markets, including solar steel structures, framework for commercial greenhouses and conveyor systems. The primary market channels for these products include Electrical, industrial and specialized distribution and direct to OEMs.
Both segments use Adjusted EBITDA as the primary measure of profit and loss. Segment Adjusted EBITDA is the sum of income (loss) from continuing operations before income taxes, adjusted to exclude
F-65
Table of Contents
unallocated expenses, depreciation and amortization, loss on extinguishment of debt, interest expense, net, restructuring and impairments, net periodic pension plan benefit cost, stock-based compensation, ABF product liability impact, consulting fees, multi-employer pension withdrawal, transaction costs and other items, such as lower of cost or market inventory adjustments and the impact of foreign exchange gains or losses related to our divestiture in Brazil and the impact from our Fence and Sprinkler exit.
Intersegment transactions primarily consist of product sales at designated transfer prices on an arms-length basis. Gross profit earned and reported within the segment is eliminated in the Company’s consolidated results. Certain manufacturing and distribution expenses are allocated between the segments due to the shared nature of activities. Recorded amounts represent a proportional amount of the quantity of product produced for each segment. A portion of certain assets, such as machinery and equipment and facilities, are not allocated despite serving both segments. These assets are shared and not fully dedicated to either segment. These shared assets are reported within the Mechanical Products & Solutions segment.
| Three Months Ended | ||||||||||||||||||||||||
| March 25, 2016 | March 27, 2015 | |||||||||||||||||||||||
| (in thousands) |
External Net Sales |
Intersegment Sales |
Adjusted EBITDA |
External Net Sales |
Intersegment Sales |
Adjusted EBITDA |
||||||||||||||||||
| Electrical Raceway |
$ | 230,835 | $ | 458 | $ | 42,186 | $ | 251,130 | $ | 149 | $ | 23,792 | ||||||||||||
| Mechanical Products & Solutions |
122,211 | 34 | $ | 22,324 | 181,456 | 89 | $ | 17,685 | ||||||||||||||||
| Eliminations |
— | (492 | ) | — | (238 | ) | ||||||||||||||||||
|
|
|
|
|
|
|
|
|
|||||||||||||||||
| Consolidated operations |
$ | 353,046 | $ | — | $ | 432,586 | $ | — | ||||||||||||||||
|
|
|
|
|
|
|
|
|
|||||||||||||||||
| Six Months Ended | ||||||||||||||||||||||||
| March 25, 2016 | March 27, 2015 | |||||||||||||||||||||||
| (in thousands) |
External Net Sales |
Intersegment Sales |
Adjusted EBITDA |
External Net Sales |
Intersegment Sales |
Adjusted EBITDA |
||||||||||||||||||
| Electrical Raceway |
$ | 454,139 | $ | 759 | $ | 76,619 | $ | 498,868 | $ | 247 | $ | 42,680 | ||||||||||||
| Mechanical Products & Solutions |
257,282 | 65 | $ | 41,701 | 360,119 | 229 | $ | 30,556 | ||||||||||||||||
| Eliminations |
— | (824 | ) | — | (476 | ) | ||||||||||||||||||
|
|
|
|
|
|
|
|
|
|||||||||||||||||
| Consolidated operations |
$ | 711,421 | $ | — | $ | 858,987 | $ | — | ||||||||||||||||
|
|
|
|
|
|
|
|
|
|||||||||||||||||
| Capital Expenditures | ||||||||||||||||
| Six Months Ended | Total Assets | |||||||||||||||
| (in thousands) |
March 25, 2016 |
March 27, 2015 |
March 25, 2016 |
September 25, 2015 |
||||||||||||
| Electrical Raceway |
$ | 4,468 | $ | 5,732 | $ | 569,284 | $ | 590,999 | ||||||||
| Mechanical Products & Solutions |
4,177 | 5,864 | 385,623 | 439,037 | ||||||||||||
| Unallocated |
369 | 951 | 163,698 | 83,763 | ||||||||||||
|
|
|
|
|
|
|
|
|
|||||||||
| Consolidated operations |
$ | 9,014 | $ | 12,547 | $ | 1,118,605 | $ | 1,113,799 | ||||||||
|
|
|
|
|
|
|
|
|
|||||||||
F-66
Table of Contents
Presented below is a reconciliation of operating segment Adjusted EBITDA to Income from operations before income taxes:
| Three Months Ended | Six Months Ended | |||||||||||||||
| (in thousands) |
March 25, 2016 |
March 27, 2015 |
March 25, 2016 |
March 27, 2015 |
||||||||||||
| Operating segment Adjusted EBITDA |
||||||||||||||||
| Electrical Raceway |
$ | 42,186 | $ | 23,792 | $ | 76,619 | $ | 42,680 | ||||||||
| Mechanical Products & Solutions |
22,324 | 17,685 | 41,701 | 30,556 | ||||||||||||
|
|
|
|
|
|
|
|
|
|||||||||
| Total |
64,510 | 41,477 | 118,320 | 73,236 | ||||||||||||
| Unallocated expenses(a) |
(6,149 | ) | (5,364 | ) | (11,906 | ) | (9,973 | ) | ||||||||
| Depreciation and amortization |
(13,249 | ) | (14,308 | ) | (26,742 | ) | (29,024 | ) | ||||||||
| Interest expense, net |
(10,567 | ) | (11,483 | ) | (20,448 | ) | (22,412 | ) | ||||||||
| Gain on extinguishment of debt |
1,661 | — | 1,661 | — | ||||||||||||
| Restructuring & impairments |
(775 | ) | (154 | ) | (2,069 | ) | (167 | ) | ||||||||
| Net periodic pension benefit cost |
(110 | ) | (144 | ) | (220 | ) | (289 | ) | ||||||||
| Stock-based compensation |
(9,998 | ) | (377 | ) | (12,043 | ) | (1,801 | ) | ||||||||
| ABF product liability impact |
(213 | ) | (561 | ) | (425 | ) | (1,122 | ) | ||||||||
| Consulting fee |
(875 | ) | (875 | ) | (1,750 | ) | (1,750 | ) | ||||||||
| Transaction costs |
(2,776 | ) | (637 | ) | (3,431 | ) | (1,154 | ) | ||||||||
| Other |
1,294 | (499 | ) | (4,213 | ) | (1,770 | ) | |||||||||
| Impact of Fence and Sprinkler exit |
— | 1,534 | (811 | ) | 1,720 | |||||||||||
|
|
|
|
|
|
|
|
|
|||||||||
| Income from operations before income taxes |
$ | 22,753 | $ | 8,609 | $ | 35,923 | $ | 5,494 | ||||||||
|
|
|
|
|
|
|
|
|
|||||||||
| (a) | Represents unallocated selling, general and administrative activities and associated expenses including, in part, executive, legal, finance, human resources, information technology, business development and communications, as well as certain costs and earnings of employee-related benefits plans, such as stock-based compensation and a portion of self-insured medical costs. |
The Company’s net long-lived assets and net sales by geography were as follows:
| Net sales | ||||||||||||||||||||||||
| Net long-lived assets | Three Months Ended | Six Months Ended | ||||||||||||||||||||||
| (in thousands) |
March 25, 2016 |
September 25, 2015 |
March 25, 2016 |
March 27, 2015 |
March 25, 2016 |
March 27, 2015 |
||||||||||||||||||
| United States |
$ | 226,308 | $ | 232,565 | $ | 325,968 | $ | 404,325 | $ | 657,719 | $ | 798,964 | ||||||||||||
| Other Americas |
113 | 132 | 8,855 | 9,762 | 18,289 | 20,625 | ||||||||||||||||||
| Europe |
1,151 | 1,036 | 9,023 | 9,505 | 17,542 | 18,889 | ||||||||||||||||||
| Asia-Pacific |
4,132 | 4,482 | 9,200 | 8,994 | 17,871 | 20,509 | ||||||||||||||||||
|
|
|
|
|
|
|
|
|
|
|
|
|
|||||||||||||
| Total |
$ | 231,704 | $ | 238,215 | $ | 353,046 | $ | 432,586 | $ | 711,421 | $ | 858,987 | ||||||||||||
|
|
|
|
|
|
|
|
|
|
|
|
|
|||||||||||||
| 19. | SUBSEQUENT EVENTS |
The Company has evaluated subsequent events through May 5, 2016, which is the date the financial statements were available to be issued.
F-67
Table of Contents
November 8, 2013
To the Board of Directors
Heritage Plastics, Inc. and Related Companies
Carrollton, Ohio
Report on the Financial Statements
We have audited the accompanying consolidated financial statements of Heritage Plastics, Inc. and Related Companies which comprise the consolidated balance sheet as of December 31, 2010, and the related consolidated statements of income, retained earnings and members’ equity, and cash flows for the year then ended and the related notes to the financial statements.
Management’s Responsibility for the Financial Statements
Management is responsible for the preparation and fair presentation of these financial statements in accordance with accounting principles generally accepted in the United States of America; this includes the design, implementation, and maintenance of internal control relevant to the preparation and fair presentation of financial statements that are free from material misstatement, whether due to fraud or error.
Auditor’s Responsibility
Our responsibility is to express an opinion on these consolidated financial statements based on our audit. We conducted our audit in accordance with auditing standards generally accepted in the United States of America. Those standards require that we plan and perform the audit to obtain reasonable assurance about whether the consolidated financial statements are free from material misstatement.
An audit involves performing procedures to obtain audit evidence about the amounts and disclosures in the consolidated financial statements. The procedures selected depend on the auditor’s judgment, including the assessment of the risks of material misstatement of the financial statements, whether due to fraud or error. In making those risk assessments, the auditor considers internal control relevant to the entity’s preparation and fair presentation of the consolidated financial statements in order to design audit procedures that are appropriate in the circumstances, but not for the purpose of expressing an opinion on the effectiveness of the entity’s internal control. Accordingly, we express no such opinion. An audit also includes evaluating the appropriateness of accounting policies used and the reasonableness of significant accounting estimates made by management, as well as evaluating the overall presentation of the consolidated financial statements.
We believe that the audit evidence we have obtained is sufficient and appropriate to provide a basis for our audit opinion.
Opinion
In our opinion, the consolidated financial statements referred to above present fairly, in all material respects, the financial position of Heritage Plastics, Inc. and Related Companies as of December 31, 2010, and the results of its operations and its cash flows for the year then ended in accordance with accounting principles generally accepted in the United States of America.
Other Matter
In our report dated May 6, 2011, we issued an opinion on the consolidated balance sheet as of December 2010 only, as we were not engaged to audit the consolidated statements of income, retained earnings and members’ equity, or cash flows for the year then ended. We did review the consolidated statements of income, retained earnings and members’ equity, and cash flows for the year ended December 31, 2010, and reported on those statements, in part, as follows:
Based on our review, we are not aware of any material modifications that should be made to the accompanying consolidated statements of income, equity, and cash flows in order for them to be in conformity with accounting principles generally accepted in the United States of America.
Due to subsequently being engaged to perform an audit of the consolidated statements of income, retained earnings and members’ equity, and cash flows, our present opinion on the 2010 financial statements, as presented herein, is different from that expressed in our previous report.
/s/ Rea & Associates, Inc.
New Philadelphia, Ohio
May 6, 2011, except for the Consolidated Statements of Income, Retained Earnings and Members’ Equity, and Cash Flows, and Note 8, as to which the date is November 8, 2013.
F-68
Table of Contents
HERITAGE PLASTICS, INC. AND RELATED COMPANIES
CONSOLIDATED BALANCE SHEET
AS OF DECEMBER 31, 2010
ASSETS
| CURRENT ASSETS: |
||||
| Cash |
$ | 627,580 | ||
| Accounts receivable—trade |
9,783,558 | |||
| Inventory |
8,761,020 | |||
| Prepaid expenses |
205,440 | |||
|
|
|
|||
| Total current assets |
19,377,598 | |||
| PROPERTY AND EQUIPMENT: |
||||
| Buildings |
5,802,048 | |||
| Land improvements |
806,814 | |||
| Building improvements |
266,685 | |||
| Parking lot |
321,532 | |||
| Machinery and equipment |
10,954,713 | |||
| Office furniture and equipment |
58,199 | |||
| Leasehold improvements |
1,348,967 | |||
| Warehouse equipment |
182,805 | |||
| Vehicles |
362,885 | |||
| Computer equipment |
68,601 | |||
|
|
|
|||
| 20,173,249 | ||||
| Less: accumulated depreciation |
10,661,616 | |||
|
|
|
|||
| 9,511,633 | ||||
| Land |
357,817 | |||
| Construction-in-progress |
87,664 | |||
|
|
|
|||
| 9,957,114 | ||||
| OTHER ASSETS: |
||||
| Accounts receivable—members’ |
1,257,450 | |||
| —related companies |
635,875 | |||
| Note receivable |
100,000 | |||
| Other |
72,983 | |||
|
|
|
|||
| Total other assets |
2,066,308 | |||
|
|
|
|||
| Total assets |
$ | 31,401,020 | ||
|
|
|
|||
F-69
Table of Contents
HERITAGE PLASTICS, INC. AND RELATED COMPANIES
CONSOLIDATED BALANCE SHEET
AS OF DECEMBER 31, 2010
LIABILITIES, SHAREHOLDERS’ AND MEMBERS’ EQUITY
| CURRENT LIABILITIES: |
||||
| Accounts payable—trade |
$ | 7,014,731 | ||
| Notes payable—line-of-credit |
4,911,341 | |||
| Current portion of long-term debt |
957,373 | |||
| Accrued commissions |
378,263 | |||
| Accrued sales rebates |
841,341 | |||
| Accrued wages |
222,200 | |||
| Accrued other |
67,020 | |||
|
|
|
|||
| Total current liabilities |
14,392,269 | |||
| LONG-TERM DEBT, net of current portion |
10,138,110 | |||
| SHAREHOLDERS’ AND MEMBERS’ EQUITY: |
||||
| Common stock—no par value, 103,750 shares authorized, 2,850 shares issued and 2,450 shares outstanding |
212,505 | |||
| Paid-in capital |
3,420,940 | |||
| Treasury stock, 400 shares, at cost |
(3,750,000 | ) | ||
| Retained earnings |
6,573,430 | |||
| Members’ equity |
413,766 | |||
|
|
|
|||
| Total shareholders’ and members’ equity |
6,870,641 | |||
|
|
|
|||
| Total liabilities and shareholders’ and members’ equity |
$ | 31,401,020 | ||
|
|
|
|||
F-70
Table of Contents
HERITAGE PLASTICS, INC. AND RELATED COMPANIES
CONSOLIDATED STATEMENT OF INCOME
FOR THE YEAR ENDED DECEMBER 31, 2010
| NET SALES |
$ | 54,249,329 | ||
| COST OF GOODS SOLD |
45,746,001 | |||
|
|
|
|||
| Gross margin |
8,503,328 | |||
| OPERATING EXPENSES: |
||||
| Selling/customer service |
324,485 | |||
| Administration |
3,969,523 | |||
| Shipping/receiving |
377,271 | |||
| Interest expense |
544,773 | |||
|
|
|
|||
| Total operating expenses |
5,216,052 | |||
|
|
|
|||
| Net operating income |
3,287,276 | |||
| OTHER INCOME |
514,138 | |||
| OTHER EXPENSES |
(253,141 | ) | ||
|
|
|
|||
| Net income |
$ | 3,548,273 | ||
|
|
|
|||
F-71
Table of Contents
HERITAGE PLASTICS, INC. AND RELATED COMPANIES
CONSOLIDATED STATEMENT OF RETAINED EARNINGS AND MEMBERS’ EQUITY
FOR THE YEAR ENDED DECEMBER 31, 2010
| RETAINED EARNINGS AND MEMBERS’ EQUITY, beginning as previously stated |
$ | 5,289,720 | ||
| PRIOR PERIOD ADJUSTMENTS |
(1,474,113 | ) | ||
|
|
|
|||
| RETAINED EARNINGS AND MEMBERS’ EQUITY, beginning as adjusted |
3,815,607 | |||
| NET INCOME |
3,548,273 | |||
| DISTRIBUTIONS |
(376,684 | ) | ||
|
|
|
|||
| RETAINED EARNINGS AND MEMBERS’ EQUITY, end of year |
$ | 6,987,196 | ||
|
|
|
|||
F-72
Table of Contents
HERITAGE PLASTICS, INC. AND RELATED COMPANIES
CONSOLIDATED STATEMENT OF CASH FLOWS
FOR THE YEAR ENDED DECEMBER 31, 2010
| CASH FLOW FROM OPERATING ACTIVITIES: |
||||
| Net income |
$ | 3,548,273 | ||
| Adjustments to reconcile net income to net cash provided by operating activities: |
||||
| Depreciation and amortization |
995,952 | |||
| (Increase) decrease in certain assets: |
||||
| Accounts receivable |
(2,036,867 | ) | ||
| Inventories |
(1,954,230 | ) | ||
| Prepaid expenses |
121,786 | |||
| Accounts receivable—related companies |
284,204 | |||
| Other |
14,263 | |||
| Increase (decrease) in certain liabilities: |
||||
| Accounts payable |
1,387,905 | |||
| Accrued expenses |
299,117 | |||
|
|
|
|||
| Net cash from operating activities |
2,660,403 | |||
| CASH FLOWS FROM INVESTING ACTIVITIES: |
||||
| Purchase of property and equipment |
(224,423 | ) | ||
| Increase in deposits and other |
(87,664 | ) | ||
|
|
|
|||
| Net cash from investing activities |
(312,087 | ) | ||
|
|
|
|||
| CASH FLOWS FROM FINANCING ACTIVITIES: |
||||
| Net borrowings (payments) under line-of-credit agreements |
(609,038 | ) | ||
| Payments on long-term debt |
(1,042,171 | ) | ||
| Distributions to shareholders and members |
(376,684 | ) | ||
|
|
|
|||
| Net cash from financing activities |
(2,027,893 | ) | ||
|
|
|
|||
| Net increase in cash |
320,423 | |||
| CASH, beginning of year |
307,157 | |||
|
|
|
|||
| CASH, end of year |
$ | 627,580 | ||
|
|
|
|||
F-73
Table of Contents
HERITAGE PLASTICS, INC. AND RELATED COMPANIES
CONSOLIDATED NOTES TO FINANCIAL STATEMENTS
NOTE 1: SUMMARY OF SIGNIFICANT ACCOUNTING POLICIES
Nature of Operations
Heritage Plastics, Inc., Heritage Plastics South, Inc., Heritage Plastics Central, Inc., Heritage Plastics West, Inc., Heritage Plastics Molding, Inc. (the “Operating Companies”) manufacture PVC plastic pipe for a broad-based mix of industry and customers. The Operating Companies have production plants in Ohio, Florida, Texas and Utah. The Operating Companies grant credit to customers throughout the nation. Consequently, the Company’s ability to collect the amounts due from customers is affected by economic fluctuations in the industry.
Carroll Rentals, LLC, Florida Rentals, LLC, and Milford Rentals, LLC (the “LLC’s”) are engaged in the rental of real estate in Ohio, Florida and Utah.
Principles of Consolidation
The consolidated financial statements include the amounts of Heritage Plastics, Inc., Heritages Plastics South, Heritage Plastics Central, Heritage Plastics West and Heritage Plastics Moldings, all operating companies related through common ownership. In addition, Carroll Rentals, LLC, Florida Rentals, LLC and Milford Rentals, LLC various interest real estate companies are included. All significant intercompany transactions have been eliminated in consolidation.
Revenue Recognition
The Company recognizes revenue from sales at the time of shipment. Freight costs are included in cost of goods sold.
Trade Accounts Receivable
Trade receivables are carried at original invoice amount, less an estimate made for doubtful receivables based on a review of all outstanding amounts on a monthly basis. Management determines the allowance for doubtful accounts by identifying troubled accounts and by using historical experience applied to an aging of accounts. Management determines the allowance for doubtful accounts by regularly evaluating individual customer receivables and considering a customer’s financial condition, credit history, and current economic conditions. Trade receivables are written off when deemed uncollectible. Recoveries of trade receivables previously written off are recorded when received. Based on management’s assessment of the credit history with customers having outstanding balances and current relationships with them, they have concluded that a $661,879 allowance for doubtful accounts was necessary at December 31, 2010.
A trade receivable is considered to be past due if any portion of the receivable balance is outstanding for more than 90 days. Interest is charged on trade receivables that are outstanding for more than 30 days and is recognized as it is charged. After the receivable becomes past due, it is on nonaccrual status and accrual of interest is suspended.
Inventories
Inventories consist of raw materials and finished goods and are stated at the lower of cost (first-in, first-out) or market value.
See independent auditor’s report.
F-74
Table of Contents
NOTE 1: SUMMARY OF SIGNIFICANT ACCOUNTING POLICIES (Continued)
Inventories as of December 31, 2010 consisted of the following components:
| Raw materials |
$ | 2,589,179 | ||
| Supplies |
300,536 | |||
| Finished goods |
5,871,305 | |||
|
|
|
|||
| Total inventories |
$ | 8,761,020 | ||
|
|
|
Property and Equipment
Property and equipment are stated at cost. Depreciation is computed primarily on the straight-line method over estimated useful lives.
Income Taxes
The Operating Companies, with the consent of their stockholders, have elected to have their income taxed as S corporations under Section 1362 of the Internal Revenue Code. As such, the Operating Companies do not pay corporate income taxes and are not allowed net operating tax loss carrybacks or carryovers as deductions. Instead, the stockholders include their proportionate share of the Operating Companies’ taxable income or loss in their individual income tax returns.
The LLC’s are limited liability companies, and in lieu of income taxes, the members of the limited liability companies are taxed on their proportionate share of the taxable income.
The entities adopted new guidance on accounting for uncertainty in income taxes effective for the year ended December 31, 2009. Management evaluated the entities’ tax positions and concluded that the entities had taken no uncertain tax positions that require adjustment to the financial statements to comply with the provisions of this guidance. With few exceptions, the entities are no longer subject to income tax examinations by the U.S. federal, state or local tax authorities for years before 2007.
Use of Estimates
The preparation of financial statements in conformity with generally accepted accounting principles requires management to make estimates and assumptions that affect the reported amounts of assets and liabilities and disclosure of contingent assets and liabilities at the date of the financial statements and the reported amounts of revenues and expenses during the reporting period. Actual results could differ from those estimates.
Advertising
Advertising costs are expensed as incurred and amounted to approximately $15,000 for the year ended December 31, 2010.
Depreciation
Depreciation of property and equipment are provided by use of straight line method over the following useful lives:
| Buildings |
10 – 25 years | |||
| Machinery and Equipment |
5 – 10 years | |||
| Office Furniture and Equipment |
3 – 10 years | |||
| Leasehold Improvements |
15 years |
See independent auditor’s report.
F-75
Table of Contents
NOTE 1: SUMMARY OF SIGNIFICANT ACCOUNTING POLICIES (Continued)
Concentration of Credit Risk
For purposes of classification on the consolidated balance sheet and consolidated statement of cash flows, cash and cash equivalents include cash on hand and deposits in banks. The Company maintains cash balances in various financial institutions. At various times during the year, those balances may exceed the amount insured by the FDIC.
Subsequent Events
In evaluating events that may have a material impact on the financial statements, the Company has considered activities through May 6, 2011, the date the financial statements were originally available to be released. Additional consideration has been given to events through November 8, 2013, the date at which these re-issued financial statements were available to be released, and such events are discussed in Note 8.
NOTE 2: NOTES PAYABLE
Heritage Plastics, Inc. maintains a $3,500,000 line-of-credit with Huntington Bank secured by equipment, inventory and accounts receivable which bears interest at the rate of LIBOR plus 2.5 percent (2.76% percent at December 31, 2010). At December 31, 2010 there was no outstanding balance.
Heritage Plastics South, Inc. maintains a $3,500,000 line-of-credit with Huntington Bank secured by equipment, inventory and accounts receivable which bears interest at the rate of LIBOR plus 2.5 percent (2.76% percent at December 31, 2010). At December 31, 2010 the outstanding balance was $1,124,017.
Heritage Plastics Central, Inc. maintains a $5,000,000 line-of-credit with Huntington Bank secured by equipment, inventory and accounts receivable which bears interest at the rate of LIBOR plus 2.5 percent (2.76% percent at December 31, 2010). At December 31, 2010 the outstanding balance was $2,088,736.
Heritage Plastics West, Inc. maintains a $3,000,000 line-of-credit with Huntington Bank secured by equipment, inventory and accounts receivable which bears interest at the rate of LIBOR plus 2.5 percent (2.76% percent at December 31, 2010). At December 31, 2010 the outstanding balance was $1,698,588.
Heritage Plastics Molding, Inc. maintains a $500,000 line-of-credit with Huntington Bank secured by equipment, inventory and accounts receivable which bears interest at the rate of LIBOR plus 2.5 percent (2.76% percent at December 31, 2010). At December 31, 2010 there was no outstanding balance.
The lines-of-credit and long-term debt (described in Note 3) contain covenants for debt coverage and minimum net worth. The entities are not in compliance with all requirements for 2010. The bank has waived the covenant violations for the 2010 year end.
See independent auditor’s report.
F-76
Table of Contents
NOTE 3: LONG-TERM DEBT
The following is a summary of long-term debt as of December 31, 2010:
| Note payable to bank bearing interest at LIBOR plus 2.50% (2.76% for December 2010), payable in monthly installments of $9,045 including interest through May 2013 with final balloon payment, collateralized by property and assets of related entities. |
$ | 765,268 | ||
| Note payable to bank bearing interest at LIBOR plus 2.50% (2.76% for December 2010), payable in monthly installments of $15,459 including interest through May 2013 with final balloon payment, collateralized by property and assets of related entities. |
1,307,483 | |||
| Note payable to bank bearing interest at LIBOR plus 2.50% (2.76% for December 2010), payable in monthly installments of $11,303 including interest through May 2013 with final balloon payment, collateralized by property and assets of related entities. |
956,564 | |||
| Note payable to bank bearing interest at LIBOR plus 1.85% (2.76% for December 2010), payable in monthly installments of $10,060 including interest through November 2013 with final balloon payment, collateralized by property and assets of related entities. |
810,224 | |||
| Note payable to bank bearing interest at LIBOR plus 2.50% (2.76% for December 2010), payable in monthly installments of $4,521 including interest through May 2013 with final balloon payment, collateralized by property and assets of related entities |
382,630 | |||
| Note payable to bank bearing interest at LIBOR plus 2.50% (2.76% for December 2010), payable in monthly installments of $30,393 including interest through November 2013 with final balloon payment, collateralized by property and assets of related entities. |
3,185,858 | |||
| Note payable to bank bearing interest at LIBOR plus 2.50% (2.76% for December 2010), payable in monthly installments of $17,379 through June 2013 with final balloon payment, collateralized by property and assets of related entities. |
3,128,378 | |||
| Note payable to bank bearing interest at 8%, payable in monthlyinstallments of $7,745 through December 2012, collateralized by assets of related entities. |
293,446 | |||
| Note payable to bank bearing interest at 8.75%, payable in monthlyinstallments of $3,522 through March 2015, collateralized by property and assets of related entities. |
150,632 | |||
| Note payable to Officers. Due on demand. |
115,000 | |||
|
|
|
|||
| 11,095,483 | ||||
| Less: principal due within one year |
(957,373 | ) | ||
|
|
|
|||
| $ | 10,138,110 | |||
|
|
|
|||
Future scheduled maturities of long-term debt are as follows:
| Year ending December 31, 2011 |
$ | 957,373 | ||
| 2012 |
1,030,188 | |||
| 2013 |
8,943,044 | |||
| 2014 |
39,464 | |||
| 2015 |
10,414 | |||
| Thereafter |
115,000 | |||
|
|
|
|||
| $ | 11,095,483 | |||
|
|
|
Interest paid amounted to $544,773 in 2010.
See independent auditor’s report.
F-77
Table of Contents
NOTE 4: EMPLOYEE BENEFIT PLANS
The Operating Companies sponsor a 401(k) plan which covers all eligible employees who meet minimum age and length of service requirements. Contributions to the plan are determined at the discretion of the board of directors. No contributions were made for the year ending December 31, 2010.
NOTE 5: FINANCIAL INSTRUMENTS
In the ordinary course of business with vendors, the Operating Companies are contingently liable for performance under standby letters of credit which totaled $105,000 at December 31, 2010. Management does not expect any material losses from these instruments since performance is not likely to be required.
NOTE 6: DESCRIPTION OF LEASING ARRANGEMENTS
Heritage Plastics Central, Inc. leases the following facility from an affiliated company:
Weatherford, Texas
The Company leases land and a building from a related entity, Loan Star Rentals, LLC, under a ten-year agreement expiring in 2012. The lease is treated as an operating lease for financial statement purposes. The Company also leases equipment under month-to-month operating lease agreements. Charges to operations amounted to $300,000 at December 31, 2010.
Following is a summary of future minimum lease payments under operating leases that have initial or remaining noncancellable lease terms in excess of one year as of December 31, 2010:
| Year ending |
2011 | $ | 355,200 | |||
| 2012 | 355,200 |
Heritage Plastics, Inc., Heritage Plastics South, Inc. and Heritage Plastics Central, Inc. lease facilities from related companies. Revenues and expenses have been eliminated in the consolidated statements. There are no formal lease agreements in place between the operating companies and real estate entities.
NOTE 7: PRIOR PERIOD ADJUSTMENT
During 2010, it was discovered that accounts payable as of December 31, 2009 was understated by $1,474,113. The total of the prior period error correction of $1,474,113 has been shown as an adjustment to opening retained earnings.
NOTE 8: SUBSEQUENT EVENT
For purposes of these re-issued financial statements, the Company has re-evaluated subsequent events from the date of the most recently audited financial statements, December 31, 2012. During 2013, Heritage entered into an agreement to sell substantially all the assets of Heritage and related companies. The transaction closed on September 17, 2013.
See independent auditor’s report.
F-78
Table of Contents
March 27, 2013
To the Board of Directors
of Heritage Plastics, Inc. and Related Companies
Report on the Financial Statements
We have audited the accompanying consolidated financial statements of Heritage Plastics, Inc. and Related Companies which comprise the consolidated balance sheets as of December 31, 2012 and 2011, and the related consolidated statements of income, changes in shareholders’ and members’ equity, and cash flows for the years then ended and the related notes to the financial statements.
Management’s Responsibility for the Financial Statements
Management is responsible for the preparation and fair presentation of these consolidated financial statements in accordance with accounting principles generally accepted in the United States of America; this includes the design, implementation, and maintenance of internal control relevant to the preparation and fair presentation of consolidated financial statements that are free from material misstatement, whether due to fraud or error.
Auditor’s Responsibility
Our responsibility is to express an opinion on these consolidated financial statements based on our audits. We conducted our audits in accordance with auditing standards generally accepted in the United States of America. Those standards require that we plan and perform the audit to obtain reasonable assurance about whether the consolidated financial statements are free of material misstatement.
An audit involves performing procedures to obtain audit evidence about the amounts and disclosures in the consolidated financial statements. The procedures selected depend on the auditor’s judgment, including the assessment of the risks of material misstatement of the consolidated financial statements, whether due to fraud or error. In making those risk assessments, the auditor considers internal control relevant to the entity’s preparation and fair presentation of the consolidated financial statements in order to design audit procedures that are appropriate in the circumstances, but not for the purpose of expressing an opinion on the effectiveness of the entity’s internal control. Accordingly, we express no such opinion. An audit also includes evaluating the appropriateness of accounting policies used and the reasonableness of significant accounting estimates made by management, as well as evaluating the overall presentation of the consolidated financial statements.
We believe that the audit evidence we have obtained is sufficient and appropriate to provide a basis for our audit opinion.
Opinion
In our opinion, the consolidated financial statements referred to above present fairly, in all material respects, the financial position of Heritage Plastics, Inc. and Related Companies as of December 31, 2012 and 2011, and the results of its operations and its cash flows for the years then ended in accordance with accounting principles generally accepted in the United States of America.
/s/ Rea & Associates, Inc.
F-79
Table of Contents
HERITAGE PLASTICS, INC. AND RELATED COMPANIES
CONSOLIDATED BALANCE SHEETS
AS OF DECEMBER 31, 2012 AND 2011
ASSETS
| 2012 | 2011 | |||||||
| CURRENT ASSETS: |
||||||||
| Cash and cash equivalents |
$ | 4,274,927 | $ | 1,573,536 | ||||
| Accounts receivable—trade, net of allowance |
17,694,592 | 13,103,334 | ||||||
| Inventory |
13,466,113 | 11,071,396 | ||||||
| Prepaid expenses |
656,520 | 388,874 | ||||||
|
|
|
|
|
|||||
| Total current assets |
36,092,152 | 26,137,140 | ||||||
| PROPERTY AND EQUIPMENT: |
||||||||
| Buildings |
5,802,048 | 5,802,048 | ||||||
| Land improvements |
806,814 | 806,814 | ||||||
| Building improvements |
266,685 | 266,685 | ||||||
| Parking lot |
321,532 | 321,532 | ||||||
| Machinery and equipment |
13,474,812 | 12,081,831 | ||||||
| Office furniture and equipment |
66,179 | 58,200 | ||||||
| Leasehold improvements |
1,771,555 | 1,520,313 | ||||||
| Warehouse equipment |
293,614 | 286,023 | ||||||
| Vehicles |
369,836 | 346,608 | ||||||
| Computer equipment |
319,788 | 68,601 | ||||||
|
|
|
|
|
|||||
| 23,492,863 | 21,558,655 | |||||||
| Less: accumulated depreciation |
12,631,854 | 11,594,525 | ||||||
|
|
|
|
|
|||||
| 10,861,009 | 9,964,130 | |||||||
| Land |
357,817 | 357,817 | ||||||
| Construction-in-progress |
214,332 | 435,479 | ||||||
|
|
|
|
|
|||||
| 11,433,158 | 10,757,426 | |||||||
| OTHER ASSETS: |
||||||||
| Accounts receivable—shareholders’ & members’ |
2,002,065 | 1,700,784 | ||||||
|
—related companies |
1,163,470 | 755,919 | ||||||
| Note receivable |
— | 100,000 | ||||||
| Other |
160,239 | 62,868 | ||||||
|
|
|
|
|
|||||
| Total other assets |
3,325,774 | 2,619,571 | ||||||
|
|
|
|
|
|||||
| Total assets |
$ | 50,851,084 | $ | 39,514,137 | ||||
|
|
|
|
|
|||||
F-80
Table of Contents
HERITAGE PLASTICS, INC. AND RELATED COMPANIES
CONSOLIDATED BALANCE SHEETS
AS OF DECEMBER 31, 2012 AND 2011
LIABILITIES, SHAREHOLDERS’ AND MEMBERS’ EQUITY
| 2012 | 2011 | |||||||
| CURRENT LIABILITIES: |
||||||||
| Accounts payable—trade |
10,826,214 | 6,882,459 | ||||||
| Line-of-credit |
10,920,455 | 9,218,778 | ||||||
| Current portion of long-term debt |
1,320,335 | 1,345,244 | ||||||
| Accrued commissions |
393,384 | 516,921 | ||||||
| Accrued sales rebates |
1,580,745 | 1,101,374 | ||||||
| Accrued wages |
1,110,615 | 823,648 | ||||||
| Accrued other |
34,697 | 74,016 | ||||||
|
|
|
|
|
|||||
| Total current liabilities |
26,186,445 | 19,962,440 | ||||||
| LONG-TERM DEBT, net of current portion |
8,722,960 | 9,416,907 | ||||||
| SHAREHOLDERS’ AND MEMBERS’ EQUITY: |
||||||||
| Common stock—no par value, 103,750 shares authorized, 2,850 shares issued and 2,450 shares outstanding |
212,505 | 212,505 | ||||||
| Paid-in capital |
3,420,940 | 3,420,940 | ||||||
| Treasury stock, 400 shares, at cost |
(2,500,000 | ) | (2,500,000 | ) | ||||
| Retained earnings |
14,529,675 | 8,081,990 | ||||||
| Members’ equity |
278,559 | 919,355 | ||||||
|
|
|
|
|
|||||
| Total shareholders’ and members’ equity |
15,941,679 | 10,134,790 | ||||||
|
|
|
|
|
|||||
| Total liabilities and shareholders’ and members’ equity |
$ | 50,851,084 | $ | 39,514,137 | ||||
|
|
|
|
|
|||||
F-81
Table of Contents
HERITAGE PLASTICS, INC. AND RELATED COMPANIES
CONSOLIDATED STATEMENTS OF INCOME
FOR THE YEARS ENDED DECEMBER 31, 2012 AND 2011
| 2012 | 2011 | |||||||
| NET SALES |
$ | 85,721,547 | $ | 68,539,216 | ||||
| COST OF GOODS SOLD |
71,004,806 | 58,620,741 | ||||||
|
|
|
|
|
|||||
| Gross margin |
14,716,741 | 9,918,475 | ||||||
| OPERATING EXPENSES: |
||||||||
| Selling/customer service |
262,780 | 355,566 | ||||||
| Administration |
6,799,188 | 4,662,816 | ||||||
| Shipping/receiving |
620,603 | 494,806 | ||||||
| Interest expense |
524,745 | 476,217 | ||||||
|
|
|
|
|
|||||
| Total operating expenses |
8,207,316 | 5,989,405 | ||||||
|
|
|
|
|
|||||
| Net operating income |
6,509,425 | 3,929,070 | ||||||
| OTHER INCOME |
345,074 | 800,559 | ||||||
| OTHER EXPENSES |
(3,505 | ) | (614,779 | ) | ||||
|
|
|
|
|
|||||
| Net income |
$ | 6,850,994 | $ | 4,114,850 | ||||
|
|
|
|
|
|||||
F-82
Table of Contents
HERITAGE PLASTICS, INC. AND RELATED COMPANIES
CONSOLIDATED STATEMENTS OF CHANGES IN SHAREHOLDERS’ AND MEMBERS’ EQUITY
FOR THE YEARS ENDED DECEMBER 31, 2012 AND 2011
| Common Stock |
Paid-in Capital |
Treasury Shares |
Retained Earnings |
Members’ Equity |
Total Equity | |||||||||||||||||||
| BALANCE, December 31, 2010 |
$ | 212,505 | $ | 3,420,940 | $ | (2,500,000 | ) | $ | 5,323,430 | $ | 413,766 | $ | 6,870,641 | |||||||||||
| Net income |
3,485,761 | 629,089 | 4,114,850 | |||||||||||||||||||||
| Distributions |
(727,201 | ) | (123,500 | ) | (850,701 | ) | ||||||||||||||||||
|
|
|
|
|
|
|
|
|
|
|
|
|
|||||||||||||
| BALANCE, December 31, 2011 |
212,505 | 3,420,940 | (2,500,000 | ) | 8,081,990 | 919,355 | 10,134,790 | |||||||||||||||||
| Net income (loss) |
7,291,790 | (440,796 | ) | 6,850,994 | ||||||||||||||||||||
| Distributions |
(844,105 | ) | (200,000 | ) | (1,044,105 | ) | ||||||||||||||||||
|
|
|
|
|
|
|
|
|
|
|
|
|
|||||||||||||
| BALANCE, December 31, 2012 |
$ | 212,505 | $ | 3,420,940 | $ | (2,500,000 | ) | $ | 14,529,675 | $ | 278,559 | $ | 15,941,679 | |||||||||||
|
|
|
|
|
|
|
|
|
|
|
|
|
|||||||||||||
F-83
Table of Contents
CONSOLIDATED STATEMENTS OF CASH FLOWS
FOR THE YEARS ENDED DECEMBER 31, 2012 AND 2011
| 2012 | 2011 | |||||||
| CASH FLOW FROM OPERATING ACTIVITIES: |
||||||||
| Net income |
$ | 6,850,994 | $ | 4,114,850 | ||||
| Adjustments to reconcile net income to net cash provided by operating activities: |
||||||||
| Depreciation and amortization |
1,042,252 | 986,746 | ||||||
| Bad debt expense |
437,730 | 61,156 | ||||||
| (Increase) decrease in assets: |
||||||||
| Accounts receivable |
(4,928,988 | ) | (3,380,931 | ) | ||||
| Inventories |
(2,394,717 | ) | (2,310,376 | ) | ||||
| Prepaid expenses |
(267,646 | ) | (183,434 | ) | ||||
| Accounts receivable—shareholders’ and members’ |
(301,281 | ) | (443,334 | ) | ||||
| Accounts receivable—related companies |
(407,551 | ) | (120,044 | ) | ||||
| Other |
(97,371 | ) | 10,114 | |||||
| Increase (decrease) in liabilities: |
||||||||
| Accounts payable |
3,943,754 | (132,270 | ) | |||||
| Accrued expenses |
603,482 | 1,007,136 | ||||||
|
|
|
|
|
|||||
| Net cash from operating activities |
4,480,658 | (390,387 | ) | |||||
| CASH FLOWS FROM INVESTING ACTIVITIES: |
||||||||
| Purchase of property and equipment |
(1,939,131 | ) | (1,439,245 | ) | ||||
| Decrease (increase) in construction in progress |
221,148 | (347,816 | ) | |||||
|
|
|
|
|
|||||
| Net cash from investing activities |
(1,717,983 | ) | (1,787,061 | ) | ||||
| CASH FLOWS FROM FINANCING ACTIVITIES: |
||||||||
| Net borrowings (payments) under line-of-credit agreements |
1,701,677 | 4,307,437 | ||||||
| Borrowings on long-term debt |
693,091 | 977,041 | ||||||
| Payments on long-term debt |
(1,411,947 | ) | (1,310,373 | ) | ||||
| Distributions to shareholders’ |
(1,044,105 | ) | (850,701 | ) | ||||
|
|
|
|
|
|||||
| Net cash from financing activities |
(61,284 | ) | 3,123,404 | |||||
|
|
|
|
|
|||||
| Net increase in cash |
2,701,391 | 945,956 | ||||||
| CASH, beginning of year |
1,573,536 | 627,580 | ||||||
|
|
|
|
|
|||||
| CASH, end of year |
$ | 4,274,927 | $ | 1,573,536 | ||||
|
|
|
|
|
|||||
F-84
Table of Contents
HERITAGE PLASTICS, INC. AND RELATED COMPANIES
CONSOLIDATED NOTES TO FINANCIAL STATEMENTS
NOTE 1: SUMMARY OF SIGNIFICANT ACCOUNTING POLICIES
Nature of Operations
Heritage Plastics, Inc., Heritage Plastics Central, Inc. and Heritage Plastics West, Inc. (the “Operating Companies”) manufacture PVC plastic pipe for a broad-based mix of industry and customers. The Operating Companies have production plants in Ohio, Florida, Texas and Utah. Effective January 1, 2012, Heritage Plastics South, Inc. and Heritage Plastics Molding, Inc. were merged into Heritage Plastics, Inc. The Operating Companies grant credit to customers throughout the nation. Consequently, the Company’s ability to collect the amounts due from customers is affected by economic fluctuations in the industry.
Carroll Rentals, LLC, Florida Rentals, LLC, and Milford Rentals, LLC (the “LLC’s”) are engaged in the rental of real estate to the operating companies in Ohio, Florida, and Utah.
Principles of Consolidation
The consolidated financial statements include the amounts of Heritage Plastics, Inc., Heritage Plastics Central, and Heritage Plastics West, all operating companies related through common ownership. In addition, Carroll Rentals, LLC, Florida Rentals, LLC, and Milford Rentals, LLC various interest real estate companies are included. All significant intercompany transactions have been eliminated in consolidation.
Revenue Recognition
The Company recognizes revenue from sales at the time of shipment. Freight costs are included in cost of goods sold.
Cash and Cash Equivalents
For purposes of classification on the consolidated balance sheets and consolidated statements of cash flows, cash and cash equivalents include cash on hand and deposits in banks.
Trade Accounts Receivable
Trade receivables are carried at original invoice amount, less an estimate made for doubtful receivables based on a review of all outstanding amounts on a monthly basis. Management determines the allowance for doubtful accounts by identifying troubled accounts and by using historical experience applied to an aging of accounts. Management determines the allowance for doubtful accounts by regularly evaluating individual customer receivables and considering a customer’s financial condition, credit history, and current economic conditions. Trade receivables are written off when deemed uncollectible. Recoveries of trade receivables previously written off are recorded when received. Based on management’s assessment of the credit history with customers having outstanding balances and current relationships with them, they have concluded that a $327,255 and $328,055 allowance for doubtful accounts was necessary at December 31, 2012 and 2011, respectively.
A trade receivable is considered to be past due if any portion of the receivable balance is outstanding for more than 90 days. Interest is charged on trade receivables that are outstanding for more than 30 days and is recognized as it is charged. After the receivable becomes past due, it is on nonaccrual status and accrual of interest is suspended.
See independent auditor’s report.
F-85
Table of Contents
Inventories
Inventories consist of raw materials and finished goods and are stated at the lower of cost (first-in, first-out) or market value.
Inventories as of December 31, 2012 and 2011 consisted of the following components:
| 2012 | 2011 | |||||||
| Raw materials |
$ | 6,336,037 | $ | 3,755,482 | ||||
| Supplies |
286,179 | 444,460 | ||||||
| Finished goods |
6,843,897 | 6,871,454 | ||||||
|
|
|
|
|
|||||
| Total inventories |
$ | 13,466,113 | $ | 11,071,396 | ||||
|
|
|
|
|
|||||
Property and Equipment
Property and equipment are stated at cost. Depreciation is computed primarily on the straight-line method over estimated useful lives.
Income Taxes
The Operating Companies, with the consent of their stockholders, have elected to have their income taxed as S corporations under Section 1362 of the Internal Revenue Code. As such, the Operating Companies do not pay corporate income taxes and are not allowed net operating tax loss carrybacks or carryovers as deductions. Instead, the stockholders include their proportionate share of the Operating Companies’ taxable income or loss in their individual income tax returns.
The LLC’s are limited liability companies, and in lieu of income taxes, the members of the limited liability companies are taxed on their proportionate share of the taxable income.
In accounting for uncertainty in income taxes, management evaluated the entities’ tax positions and concluded that the entities had taken no uncertain tax positions that require adjustment to the financial statements to comply with the provisions of this guidance. With few exceptions, the entities are no longer subject to income tax examinations by the U.S. federal, state or local tax authorities for years before 2009.
Use of Estimates
The preparation of financial statements in conformity with generally accepted accounting principles requires management to make estimates and assumptions that affect the reported amounts of assets and liabilities and disclosure of contingent assets and liabilities at the date of the financial statements and the reported amounts of revenues and expenses during the reporting period. Actual results could differ from those estimates.
Depreciation
Depreciation of property and equipment are provided by use of straight line method over the following useful lives:
| Buildings |
10 – 25 years | |||
| Machinery and Equipment |
5 – 10 years | |||
| Office Furniture and Equipment |
3 – 10 years | |||
| Leasehold Improvements |
15 years |
See independent auditor’s report.
F-86
Table of Contents
Uninsured Risk—Cash Deposits
The Company maintains its cash and cash equivalents balances in various financial institutions located across the United States. Deposits in interest-bearing accounts are insured by the Federal Deposit Insurance Corporation (“FDIC”) up to a coverage limit of $250,000 through December 31, 2012. Insurance on deposits in noninterest-bearing accounts is unlimited through December 31, 2012. The Company has both interest-bearing and noninterest-bearing accounts.
Beginning January 1, 2013, noninterest-bearing accounts will no longer be insured separately from the Company’s other accounts at the same FDIC-insured depository institution (IDI). Instead, noninterest-bearing and interest-bearing accounts will collectively be insured up to a coverage limit of $250,000, at each separately chartered IDI.
As a result, the Company may have balances that exceed the insured limit.
Advertising
Advertising costs are expensed as incurred and amounted to approximately $13,200 and $17,800 for the years ended December 31, 2012 and 2011, respectively.
NOTE 2: LINE-OF-CREDIT
The Operating Companies have negotiated a line-of-credit with Huntington Bank in the amount of $15,500,000. The bank has allocated the maximum line amounts to each of the operating companies as noted in the paragraphs below.
Heritage Plastics, Inc. maintains a $7,500,000 line-of-credit with Huntington Bank secured by equipment, inventory and accounts receivable which bears interest at the rate of LIBOR plus 2.5 percent (2.7108% percent at December 31, 2012). At December 31, 2012 and 2011, the outstanding balance was $5,300,929 and $3,823,828, respectively.
Heritage Plastics Central, Inc. maintains a $5,000,000 line-of-credit with Huntington Bank secured by equipment, inventory and accounts receivable which bears interest at the rate of LIBOR plus 2.5 percent (2.7108% percent at December 31, 2012). At December 31, 2012 and 2011, the outstanding balance was $2,830,486 and $2,660,432, respectively.
Heritage Plastics West, Inc. maintains a $4,000,000 line-of-credit with Huntington Bank secured by equipment, inventory and accounts receivable which bears interest at the rate of LIBOR plus 2.5 percent (2.7108% percent at December 31, 2012). At December 31, 2012 and 2011, the outstanding balance was $2,789,040 and $2,734,518, respectively.
The lines-of-credit and long-term debt (described in Note 3) contain covenants for debt coverage and minimum net worth. Management believes the entities are in compliance with all requirements for 2012.
See independent auditor’s report.
F-87
Table of Contents
NOTE 3: LONG-TERM DEBT
The following is a summary of long-term debt as of December 31:
| 2012 | 2011 | |||||||
| Note payable to bank bearing interest at LIBOR plus 2.50% (2.7108% for December 2012), payable in monthly installments of $9,045 including interest through May 2018 with final balloon payment, collateralized by property and assets of related entities. |
$ | 575,998 | $ | 671,138 | ||||
| Note payable to bank bearing interest at LIBOR plus 2.50% (2.7108% for December 2012), payable in monthly installments of $15,459 including interest through May 2018 with final balloon payment, collateralized by property and assets of related entities. |
984,062 | 1,146,815 | ||||||
| Note payable to bank bearing interest at LIBOR plus 2.50% (2.7108% for December 2012), payable in monthly installments of $11,303 including interest through May 2018 with final balloon payment, collateralized by property and assets of related entities. |
719,982 | 839,060 | ||||||
| Note payable to bank bearing interest at LIBOR plus 2.50% (2.7108% for December 2012), payable in monthly installments of $10,060 including interest through November 2018 with final balloon payment, collateralized by property and assets of related entities. |
624,319 | 718,512 | ||||||
| Note payable to bank bearing interest at LIBOR plus 2.50% (2.7108% for December 2012), payable in monthly installments of $4,521 including interest through May 2018 with final balloon payment, collateralized by property and assets of related entities. |
287,991 | 335,560 | ||||||
| Note payable to bank bearing interest at LIBOR plus 2.50% (2.7108% for December 2012), payable in monthly installments of $30,393 including interest through November 2018 with final balloon payment, collateralized by property and assets of related entities |
2,578,226 | 2,886,136 | ||||||
| Note payable to bank bearing interest at LIBOR plus 2.50% (2.7108% for December 2012), payable in monthly installments of $17,379 through June 2018 with final balloon payment, collateralized by property and assets of related entities. |
2,836,729 | 2,979,597 | ||||||
| Note payable to bank bearing interest at 4.859%, payable in monthly installments including interest of $18,369 through December 2016, collateralized by property and assets of related entities. |
789,569 | 977,041 | ||||||
| Note payable to bank bearing interest at 8%, payable in monthly installments of $7,745 through December 2012, collateralized by assets of related entities. Paid in full during 2012. |
— | 146,723 | ||||||
| Note payable to bank bearing interest at 8.75%, payable in monthly installments of $3,522 through March 2015, collateralized by property and assets of related entities. Paid in full during 2012. |
— | 61,569 | ||||||
| Note payable to bank bearing interest at 4.443%, payable in monthly installments of $8,975 through September 2017, collateralized by assets of related entities. |
460,005 | — | ||||||
| Note payable to bank bearing interest at 4.553%, payable in monthly installments of $3,381 through May 2017, collateralized by assets of related entities. |
162,063 | — | ||||||
| Note payable to bank bearing interest at 4.562%, payable in monthly installments of $484 through August 2017, collateralized by assets of related entities. |
24,351 | — | ||||||
|
|
|
|
|
|||||
| 10,043,295 | 10,762,151 | |||||||
| Less: principal due within one year |
1,320,335 | 1,345,244 | ||||||
|
|
|
|
|
|||||
| $ | 8,722,960 | $ | 9,416,907 | |||||
|
|
|
|
|
|||||
See independent auditor’s report.
F-88
Table of Contents
Future scheduled maturities of long-term debt for the years ended:
| 2013 |
$ | 1,320,335 | ||
| 2014 |
1,361,949 | |||
| 2015 |
1,404,980 | |||
| 2016 |
1,436,913 | |||
| 2017 |
1,217,285 | |||
| Thereafter |
3,301,833 | |||
| $ | 10,043,295 |
Interest paid amounted to $524,745 and $476,217 in 2012 and 2011.
NOTE 4: DESCRIPTION OF LEASING ARRANGEMENTS
Heritage Plastics Central, Inc. leases the following facility from an affiliated company:
Weatherford, Texas
The Company leases land and a building from a related entity, Loan Star Rentals, LLC, under a lease agreement that expired in 2012 and is now being treated as a month-to-month lease. A new lease agreement is currently being negotiated. The lease is treated as an operating lease for financial statement purposes. The Company also leases equipment under month-to-month operating lease agreements. Charges to operations amounted to $355,200 for 2012 and 2011, respectively.
Heritage Plastics, Inc. leases the following facilities from affiliated companies:
Carrollton, Ohio
The Company leases land and a building from a related entity, Carroll Rentals, LLC, under a ten-year agreement expiring in 2022. The lease is treated as an operating lease for financial statement purposes. The Company also leases equipment under month-to-month operating lease agreements. Charges to operations amounted to $360,000 and $355,200 for 2012 and 2011, respectively.
Tampa, Florida
The Company leases land and a building from a related entity, Florida Rentals, LLC, under a ten-year agreement expiring in 2022. The lease is treated as an operating lease for financial statement purposes. The Company also leases equipment under month-to-month operating lease agreements. Charges to operations amounted to $336,000 and $355,200 for 2012 and 2011, respectively.
Heritage Plastics West, Inc. leases the following facility from an affiliated company:
Milford, Utah
The Company leases land and a building from a related entity, Milford Rentals, LLC, under a ten-year agreement expiring in 2017. The lease is treated as an operating lease for financial statement purposes. The Company also leases equipment under month-to-month operating lease agreements. Charges to operations amounted to $396,000 for 2012 and 2011, respectively.
The inter-company lease income and expense noted above was eliminated on the consolidated financial statements.
See independent auditor’s report.
F-89
Table of Contents
The future minimum lease payments as of December 31, 2012 were as follows:
| Year Ending |
Amount | |||
| 2013 |
$ | 1,092,000 | ||
| 2014 |
1,092,000 | |||
| 2015 |
1,092,000 | |||
| 2016 |
1,092,000 | |||
| 2017 |
1,092,000 | |||
| Thereafter |
3,480,000 | |||
NOTE 5: EMPLOYEE BENEFIT PLANS
The Operating Companies all sponsor a 401(k) plan which covers all eligible employees who meet minimum age and length of service requirements. Contributions to the plan are determined at the discretion of the board of directors. Total contributions of $37,530 and $0 were made during 2012 or 2011, respectively.
NOTE 6: FINANCIAL INSTRUMENTS
In the ordinary course of business with vendors, the Operating Companies are contingently liable for performance under standby letters of credit which totaled $105,000 at December 31, 2012 and 2011. Management does not expect any material losses from these instruments since performance is not likely to be required.
NOTE 7: RECLASSIFICATIONS
Certain 2011 amounts have been reclassified to conform with the 2012 consolidated financial statements. These reclassifications had no effect on shareholders’ and members’ equity or changes in shareholders’ and members’ equity.
NOTE 8: SUBSEQUENT EVENTS
In evaluating events that may have a material impact on the financial statements, the Company has considered activities through March 27, 2013, the date the financial statements were available to be released.
See independent auditor’s report.
F-90
Table of Contents
HERITAGE PLASTICS, INC. AND RELATED COMPANIES
CONSOLIDATED BALANCE SHEETS
(unaudited)
| June 30, 2013 | December 31, 2012 | |||||||
| Assets |
||||||||
| Current Assets: |
||||||||
| Cash and cash equivalents |
$ | 2,696,330 | $ | 4,274,927 | ||||
| Accounts receivable—trade, net of allowance |
22,903,141 | 17,694,592 | ||||||
| Inventory |
13,476,357 | 13,466,113 | ||||||
| Prepaid expenses and other |
726,947 | 656,520 | ||||||
| Total current assets |
39,802,775 | 36,092,152 | ||||||
| Fixed assets, net (see Note 2) |
11,574,407 | 11,433,158 | ||||||
| Other assets |
3,411,275 | 3,325,774 | ||||||
| Total Assets |
54,788,457 | 50,851,084 | ||||||
| Liabilities and Equity |
||||||||
| Accounts payable—trade |
11,097,168 | 10,826,214 | ||||||
| Line of credit and current maturities of long-term debt (see Note 4) |
10,280,474 | 12,240,790 | ||||||
| Accrued liabilities |
6,034,168 | 3,119,441 | ||||||
| Total current liabilities |
27,411,810 | 26,186,445 | ||||||
| Long-term debt, net of current portion (see Note 5) |
7,747,195 | 8,722,960 | ||||||
| Total Liabilities |
35,159,005 | 34,909,405 | ||||||
| Shareholders’ and Members’ Equity: |
||||||||
| Common stock—no par value, 103,750 shares authorized, 2,850 shares issued and 2,450 shares outstanding |
212,505 | 212,505 | ||||||
| Paid-in capital |
3,420,940 | 3,420,940 | ||||||
| Treasury stock, 400 shares, at cost |
(2,500,000 | (2,500,000 | ) | |||||
| Retained earnings |
18,100,995 | 14,529,675 | ||||||
| Members’ equity |
395,012 | 278,559 | ||||||
| Total shareholders’ and members’ equity |
19,629,452 | 15,941,679 | ||||||
| Total liabilities and shareholders’ and members’ equity |
$ | 54,788,457 | $ | 50,851,084 | ||||
F-91
Table of Contents
HERITAGE PLASTICS, INC. AND RELATED COMPANIES
CONSOLIDATED STATEMENTS OF INCOME
(unaudited)
| Three Months Ended | Six Months Ended | |||||||||||||||
| June 30, 2013 | June 30, 2012 | June 30, 2013 | June 30, 2012 | |||||||||||||
| Net sales |
$ | 27,979,644 | $ | 20,235,586 | $ | 53,032,420 | $ | 41,975,562 | ||||||||
| Cost of goods sold |
23,169,556 | 17,252,444 | 43,066,607 | 38,053,276 | ||||||||||||
| Operating expenses |
1,918,934 | 1,346,443 | 3,524,228 | 2,885,727 | ||||||||||||
|
|
|
|
|
|
|
|
|
|||||||||
| Net operating income |
2,891,154 | 1,636,699 | 6,441,585 | 1,036,559 | ||||||||||||
| Interest expense |
115,635 | 135,237 | 237,879 | 267,489 | ||||||||||||
|
|
|
|
|
|
|
|
|
|||||||||
| Income before income tax |
2,775,519 | 1,501,462 | 6,203,706 | 769,070 | ||||||||||||
| Other income |
158,577 | 43,341 | 400,821 | 119,486 | ||||||||||||
| Other expenses |
— | (31,887 | ) | — | (61,185 | ) | ||||||||||
|
|
|
|
|
|
|
|
|
|||||||||
| Net income |
$ | 2,934,096 | $ | 1,512,916 | $ | 6,604,527 | 827,371 | |||||||||
|
|
|
|
|
|
|
|
|
|||||||||
F-92
Table of Contents
CONSOLIDATED STATEMENTS OF CASH FLOWS
| Six months ended June 28, 2013 |
Six months ended June 29, 2012 |
|||||||
| CASH FLOW FROM OPERATING ACTIVITIES: |
||||||||
| Net income |
$ | 6,604,527 | $ | 827,371 | ||||
| Adjustments to reconcile net income to net cash provided by operating activities: |
||||||||
| Depreciation and amortization |
538,084 | 312,504 | ||||||
| Change in operating assets and liabilities |
(2,189,040 | ) | (489,189 | ) | ||||
| Net cash from operating activities |
4,953,571 | 650,686 | ||||||
| CASH FLOWS FROM INVESTING ACTIVITIES: |
||||||||
| Purchase of property and equipment |
(679,333 | ) | (539,967 | ) | ||||
| Decrease (increase) in construction in progress |
— | — | ||||||
|
|
|
|
|
|||||
| Net cash from investing activities |
(679,3330 | ) | (539,967 | ) | ||||
| CASH FLOWS FROM FINANCING ACTIVITIES: |
||||||||
| Net borrowings (payments) under line-of-credit agreements |
(2,100,316 | ) | 1,731,677 | |||||
| Borrowings on long-term debt |
71,153 | 258,064 | ||||||
| Payments on long-term debt |
(906,918 | ) | (412,728 | ) | ||||
| Distributions to shareholders’ |
(2,916,754 | ) | (860,315 | ) | ||||
|
|
|
|
|
|||||
| Net cash from financing activities |
(5,852,835 | ) | 716,698 | |||||
|
|
|
|
|
|||||
| Net increase in cash |
(1,578,597 | ) | 827,417 | |||||
| CASH, beginning of year |
4,274,927 | 1,573,536 | ||||||
|
|
|
|
|
|||||
| CASH, end of year |
$ | 2,696,330 | $ | 2,400,953 | ||||
|
|
|
|
|
|||||
F-93
Table of Contents
NOTE 1: SUMMARY OF SIGNIFICANT ACCOUNTING POLICIES
Nature of Operations
Heritage Plastics, Inc., Heritage Plastics Central, Inc. and Heritage Plastics West, Inc. (the “Operating Companies”) manufacture PVC plastic pipe for a broad-based mix of industry and customers. The Operating Companies have production plants in Ohio, Florida, Texas and Utah. Effective January 1, 2012, Heritage Plastics South, Inc. and Heritage Plastics Molding, Inc. were merged into Heritage Plastics, Inc. The Operating Companies grant credit to customers throughout the nation. Consequently, the Company’s ability to collect the amounts due from customers is affected by economic fluctuations in the industry.
Carroll Rentals, LLC, Florida Rentals, LLC, and Milford Rentals, LLC (the “LLC’s”) are engaged in the rental of real estate to the operating companies in Ohio, Florida, and Utah.
Principles of Consolidation
The consolidated financial statements include the amounts of Heritage Plastics, Inc., Heritage Plastics Central, and Heritage Plastics West, all operating companies related through common ownership. In addition, Carroll Rentals, LLC, Florida Rentals, LLC, and Milford Rentals, LLC various interest real estate companies are included. All significant intercompany transactions have been eliminated in consolidation.
Revenue Recognition
The Company recognizes revenue from sales at the time of shipment. Freight costs are included in cost of goods sold.
Cash and Cash Equivalents
For purposes of classification on the consolidated balance sheets and consolidated statements of cash flows, cash and cash equivalents include cash on hand and deposits in banks.
Trade Accounts Receivable
Trade receivables are carried at original invoice amount, less an estimate made for doubtful receivables based on a review of all outstanding amounts on a monthly basis. Management determines the allowance for doubtful accounts by identifying troubled accounts and by using historical experience applied to an aging of accounts. Management determines the allowance for doubtful accounts by regularly evaluating individual customer receivables and considering a customer’s financial condition, credit history, and current economic conditions. Trade receivables are written off when deemed uncollectible. Recoveries of trade receivables previously written off are recorded when received. Based on management’s assessment of the credit history with customers having outstanding balances and current relationships with them, they have concluded that a $327,255 allowance for doubtful accounts was necessary at both June 30, 2013 and December 31, 2012, respectively.
A trade receivable is considered to be past due if any portion of the receivable balance is outstanding for more than 90 days. Interest is charged on trade receivables that are outstanding for more than 30 days and is recognized as it is charged. After the receivable becomes past due, it is on nonaccrual status and accrual of interest is suspended.
Inventories
Inventories consist of raw materials and finished goods and are stated at the lower of cost (first-in, first-out) or market value.
F-94
Table of Contents
Inventories as of June 30, 2013 and December 31, 2012 consisted of the following components:
| June 30, 2013 | December 31, 2012 | |||||||
| Raw materials |
$ | 6,193,134 | $ | 6,336,037 | ||||
| Supplies |
511,274 | 286,179 | ||||||
| Finished goods |
6,771,949 | 6,843,897 | ||||||
|
|
|
|
|
|||||
| Total inventories |
$ | 13,476,357 | $ | 13,466,113 | ||||
|
|
|
|
|
|||||
Property and Equipment
Property and equipment are stated at cost. Depreciation is computed primarily on the straight-line method over estimated useful lives.
Income Taxes
The Operating Companies, with the consent of their stockholders, have elected to have their income taxed as S corporations under Section 1362 of the Internal Revenue Code. As such, the Operating Companies do not pay corporate income taxes and are not allowed net operating tax loss carrybacks or carryovers as deductions. Instead, the stockholders include their proportionate share of the Operating Companies’ taxable income or loss in their individual income tax returns.
The LLC’s are limited liability companies, and in lieu of income taxes, the members of the limited liability companies are taxed on their proportionate share of the taxable income.
In accounting for uncertainty in income taxes, management evaluated the entities’ tax positions and concluded that the entities had taken no uncertain tax positions that require adjustment to the financial statements to comply with the provisions of this guidance. With few exceptions, the entities are no longer subject to income tax examinations by the U.S. federal, state or local tax authorities for years before 2009.
Use of Estimates
The preparation of financial statements in conformity with generally accepted accounting principles requires management to make estimates and assumptions that affect the reported amounts of assets and liabilities and disclosure of contingent assets and liabilities at the date of the financial statements and the reported amounts of revenues and expenses during the reporting period. Actual results could differ from those estimates.
Depreciation
Depreciation of property and equipment are provided by use of straight line method over the following useful lives:
| Buildings |
10 – 25 years | |||
| Machinery and Equipment |
5 – 10 years | |||
| Office Furniture and Equipment |
3 – 10 years | |||
| Leasehold Improvements |
15 years |
F-95
Table of Contents
NOTE 2: PROPERTY AND EQUIPMENT
Property and equipment as of June 30, 2013 and December 31, 2012 consisted of the following components:
| June 30, 2013 | December 31, 2012 | |||||||
| Buildings |
$ | 5,802,049 | $ | 5,802,048 | ||||
| Land improvements |
806,814 | 806,814 | ||||||
| Building improvements |
266,685 | 266,685 | ||||||
| Parking lot |
321,532 | 321,532 | ||||||
| Machinery and equipment |
14,022,059 | 13,474,812 | ||||||
| Office furniture and equipment |
69,729 | 66,179 | ||||||
| Leasehold improvements |
1,877,076 | 1,771,555 | ||||||
| Warehouse equipment |
299,626 | 293,614 | ||||||
| Vehicles |
415,089 | 369,836 | ||||||
| Computer equipment |
348,273 | 319,788 | ||||||
| Land |
357,817 | 357,817 | ||||||
| Construction in progress |
157,596 | 214,332 | ||||||
|
|
|
|
|
|||||
| Property and Equipment |
24,744,345 | 24,065,012 | ||||||
| Less: accumulated depreciation |
(13,169,938 | ) | (12,631,854 | ) | ||||
|
|
|
|
|
|||||
| Property and Equipment, net |
$ | 11,574,407 | $ | 11,433,158 | ||||
|
|
|
|
|
|||||
NOTE 3: ACCRUED LIABILITIES
Accrued liabilities as of June 30, 2013 and December 31, 2012 consisted of the following components:
| June 30, 2013 | December 31, 2012 | |||||||
| Accrued commissions |
$ | 683,076 | $ | 393,384 | ||||
| Accrued sales rebates |
1,621,848 | 1,580,745 | ||||||
| Accrued wages |
341,128 | 1,110,615 | ||||||
| Accrued other |
3,388,116 | 34,697 | ||||||
|
|
|
|
|
|||||
| Accrued liabilities |
$ | 6,034,168 | $ | 3,119,441 | ||||
|
|
|
|
|
|||||
NOTE 4: LINE-OF-CREDIT
The Operating Companies have negotiated a line-of-credit with Huntington Bank in the amount of $15,500,000. The bank has allocated the maximum line amounts to each of the operating companies as noted in the paragraphs below.
Heritage Plastics, Inc. maintains a $7,500,000 line-of-credit with Huntington Bank secured by equipment, inventory and accounts receivable which bears interest at the rate of LIBOR plus 2.5 percent. At June 30, 2013 and December 31, 2012, the outstanding balance was $4,725,621 and $5,300,929, respectively.
Heritage Plastics Central, Inc. maintains a $5,000,000 line-of-credit with Huntington Bank secured by equipment, inventory and accounts receivable which bears interest at the rate of LIBOR plus 2.5 percent. At June 30, 2013 and December 31, 2012, the outstanding balance was $1,550,000 and $2,830,486, respectively.
Heritage Plastics West, Inc. maintains a $4,000,000 line-of-credit with Huntington Bank secured by equipment, inventory and accounts receivable which bears interest at the rate of LIBOR plus 2.5 percent. At June 30, 2013 and December 31, 2012, the outstanding balance was $2,544,518 and $2,789,040, respectively.
The lines-of-credit and long-term debt (described in Note 5) contain covenants for debt coverage and minimum net worth. Management believes the entities are in compliance with all requirements.
F-96
Table of Contents
NOTE 5: LONG-TERM DEBT
The following is a summary of long-term debt as of June 30, 2013 and December 31, 2012:
| June 30, 2013 | December 31, 2012 | |||||||
| Note payable to bank bearing interest at LIBOR plus 2.50%, payable in monthly installments of $9,045 including interest through May 2018 with final balloon payment, collateralized by property and assets of related entities. |
$ | 527,133 | $ | 575,998 | ||||
| Note payable to bank bearing interest at LIBOR plus 2.50%, payable in monthly installments of $15,459 including interest through May 2018 with final balloon payment, collateralized by property and assets of related entities. |
900,578 | 984,062 | ||||||
| Note payable to bank bearing interest at LIBOR plus 2.50%, payable in monthly installments of $11,303 including interest through May 2018 with final balloon payment, collateralized by property and assets of related entities. |
658,898 | 719,982 | ||||||
| Note payable to bank bearing interest at LIBOR plus 2.50%, payable in monthly installments of $10,060 including interest through November 2018 with final balloon payment, collateralized by property and assets of related entities. |
576,144 | 624,319 | ||||||
| Note payable to bank bearing interest at LIBOR plus 2.50%, payable in monthly installments of $4,521 including interest through May 2018 with final balloon payment, collateralized by property and assets of related entities. |
— | 287,991 | ||||||
| Note payable to bank bearing interest at LIBOR plus 2.50%, payable in monthly installments of $30,393 including interest through November 2018 with final balloon payment, collateralized by property and assets of related entities |
2,420,542 | 2,578,226 | ||||||
| Note payable to bank bearing interest at LIBOR plus 2.50%, payable in monthly installments of $17,379 through June 2018 with final balloon payment, collateralized by property and assets of related entities. |
2,762,782 | 2,836,729 | ||||||
| Note payable to bank bearing interest at 4.859%, payable in monthly installments including interest of $18,369 through December 2016, collateralized by property and assets of related entities. |
708,166 | 789,569 | ||||||
| Note payable to bank bearing interest at 4.443%, payable in monthly installments of $8,975 through September 2017, collateralized by assets of related entities. |
416,421 | 460,005 | ||||||
| Note payable to bank bearing interest at 4.553%, payable in monthly installments of $3,381 through May 2017, collateralized by assets of related entities. |
145,307 | 162,063 | ||||||
| Note payable to bank bearing interest at 4.562%, payable in monthly installments of $484 through August 2017, collateralized by assets of related entities. |
21,915 | 24,351 | ||||||
| Note payable to bank bearing interest at 4.553%, payable in monthly installments of $3,381 through May 2017, collateralized by assets of related entities. |
24,391 | — | ||||||
| Note payable to bank bearing interest at 4.562%, payable in monthly installments of $484 through August 2017, collateralized by assets of related entities. |
45,253 | |||||||
|
|
|
|
|
|||||
| 9,207,530 | 10,043,295 | |||||||
| Less: principal due within one year |
1,460,335 | 1,320,335 | ||||||
|
|
|
|
|
|||||
| $ | 7,747,195 | $ | 8,722,960 | |||||
|
|
|
|
|
|||||
F-97
Table of Contents
Future scheduled maturities of long-term debt as of June 30, 2013:
| 2014 |
$ | 1,460,335 | ||
| 2015 |
1,361,949 | |||
| 2016 |
1,404,980 | |||
| 2017 |
1,436,913 | |||
| 2018 |
3,543,353 | |||
| $ | 9,207,530 |
Interest paid amounted to $237,879 and $267,489 for the six months ended June 30, 2013 and June 30, 2012; respectively.
F-98
Table of Contents

Table of Contents
Shares
Atkore International Group Inc.
Common Stock
Credit Suisse
Deutsche Bank Securities
J.P. Morgan
UBS Investment Bank
Citigroup
RBC Capital Markets
Wells Fargo Securities
, 2016
Through and including , 2016 (25 days after the date of this prospectus), all dealers that buy, sell or trade our common stock, whether or not participating in this offering, may be required to deliver a prospectus. This delivery requirement is in addition to the obligation of dealers to deliver a prospectus when acting as underwriters and with respect to their unsold allotments or subscriptions.
Table of Contents
PART II
INFORMATION NOT REQUIRED IN PROSPECTUS
| Item 13. | Other Expenses of Issuance and Distribution. |
The following table sets forth the estimated expenses payable by us in connection with the sale and distribution of the securities registered hereby, other than underwriting discounts or commissions. All amounts are estimates except for the SEC registration fee and the FINRA filing fee.
| SEC Registration Fee |
$ | 10,070 | ||
| FINRA Filing Fee |
15,500 | |||
| NYSE Listing Fee |
25,000 | |||
| Printing Fees and Expenses |
250,000 | |||
| Accounting Fees and Expenses |
2,100,000 | |||
| Legal Fees and Expenses |
2,700,000 | |||
| Blue Sky Fees and Expenses |
15,000 | |||
| Transfer Agent Fees and Expenses |
10,000 | |||
| Miscellaneous |
* | |||
|
|
|
|||
| Total: |
$ | * | ||
|
|
|
| * | To be filed by amendment. |
| Item 14. | Indemnification of Directors and Officers. |
Atkore International Group Inc. is incorporated under the laws of the State of Delaware.
Section 145(a) of the DGCL provides that a corporation may indemnify any person who was or is a party or is threatened to be made a party to any threatened, pending or completed action, suit or proceeding, whether civil, criminal, administrative or investigative (other than an action by or in the right of the corporation) by reason of the fact that the person is or was a director, officer, employee or agent of the corporation, or is or was serving at the request of the corporation as a director, officer, employee or agent of another corporation, partnership, joint venture, trust or other enterprise, against expenses (including attorneys’ fees), judgments, fines and amounts paid in settlement actually and reasonably incurred by the person in connection with such action, suit or proceeding if the person acted in good faith and in a manner the person reasonably believed to be in or not opposed to the best interests of the corporation, and, with respect to any criminal action or proceeding, had no reasonable cause to believe the person’s conduct was unlawful.
Section 145(b) of the DGCL provides that a corporation may indemnify any person who was or is a party or is threatened to be made a party to any threatened, pending or completed action or suit by or in the right of the corporation to procure a judgment in its favor by reason of the fact that the person is or was a director, officer, employee or agent of the corporation, or is or was serving at the request of the corporation as a director, officer, employee or agent of another corporation, partnership, joint venture, trust or other enterprise, against expenses (including attorneys’ fees) actually and reasonably incurred by the person in connection with the defense or settlement of such action or suit if the person acted in good faith and in a manner the person reasonably believed to be in or not opposed to the best interests of the corporation and except that no indemnification shall be made in respect of any claim, issue or matter as to which such person shall have been adjudged to be liable to the corporation unless and only to the extent that the Delaware Court of Chancery or the court in which such action or suit was brought shall determine upon application that, despite the adjudication of liability but in view of all of the circumstances of the case, such person is fairly and reasonably entitled to indemnity for such expenses which the Delaware Court of Chancery or such other court shall deem proper.
Section 145(c) of the DGCL provides that to the extent that a present or former director or officer of a corporation has been successful on the merits or otherwise in defense of any action, suit or proceeding referred to
II-1
Table of Contents
in subsections (a) and (b) of Section 145 of the DGCL, or in defense of any claim, issue or matter therein, such person shall be indemnified against expenses (including attorneys’ fees) actually and reasonably incurred by such person in connection therewith.
Section 145(e) of the DGCL provides that expenses (including attorneys’ fees) incurred by an officer or director of the corporation in defending any civil, criminal, administrative or investigative action, suit or proceeding may be paid by the corporation in advance of the final disposition of such action, suit or proceeding upon receipt of an undertaking by or on behalf of such director or officer to repay such amount if it shall ultimately be determined that such person is not entitled to be indemnified by the corporation as authorized in Section 145 of the DGCL. Such expenses, including attorneys’ fees, incurred by former directors and officers or other employees and agents of the corporation or by persons serving at the request of the corporation as directors, officers, employees or agents of another corporation, partnership, joint venture, trust or other enterprise may be so paid upon such terms and conditions, if any, as the corporation deems appropriate.
Section 145(g) of the DGCL specifically allows a Delaware corporation to purchase liability insurance on behalf of its directors and officers and to insure against potential liability of such directors and officers regardless of whether the corporation would have the power to indemnify such directors and officers under Section 145 of the DGCL.
Section 102(b)(7) of the DGCL permits a Delaware corporation to include a provision in its certificate of incorporation eliminating or limiting the personal liability of directors to the corporation or its stockholders for monetary damages for breach of fiduciary duty as a director. This provision, however, may not eliminate or limit a director’s liability (1) for breach of the director’s duty of loyalty to the corporation or its stockholders, (2) for acts or omissions not in good faith or involving intentional misconduct or a knowing violation of law, (3) under Section 174 of the DGCL, which provides for liability of directors for unlawful payments of dividends or unlawful stock purchases or redemptions, or (4) for any transaction from which the director derived an improper personal benefit.
Section 174 of the DGCL provides, among other things, that a director who willfully and negligently approves of an unlawful payment of dividends or an unlawful stock purchase or redemption may be held liable for such actions. A director who was either absent when the unlawful actions were approved or dissented at the time may avoid liability by causing his or her dissent to such actions to be entered in the books containing the minutes of the meetings of the board of directors at the time the action occurred or immediately after the absent director receives notice of the unlawful acts.
Our Second Amended and Restated Certificate of Incorporation will contain provisions permitted under the DGCL relating to the liability of directors. These provisions will eliminate a director’s personal liability for monetary damages resulting from a breach of fiduciary duty, except in circumstances involving:
| • | any breach of the director’s duty of loyalty; |
| • | acts or omissions not in good faith or which involve intentional misconduct or a knowing violation of the law; |
| • | under Section 174 of the DGCL (unlawful dividends); or |
| • | any transaction from which the director derives an improper personal benefit. |
Our Second Amended and Restated Certificate of Incorporation and our Second Amended and Restated By-laws will require us to indemnify and advance expenses to our directors and officers to the fullest extent not prohibited by the DGCL and other applicable law, except in the case of a proceeding instituted by the director without the approval of our board of directors. Our Second Amended and Restated Certificate of Incorporation and our Second Amended and Restated By-laws will provide that we are required to indemnify our directors and officers, to the fullest extent permitted by law, for all judgments, fines, settlements, legal fees and other expenses incurred in connection with pending or threatened legal proceedings because of the director’s or officer’s positions with us or another entity that the director or officer serves at our request, subject to various conditions,
II-2
Table of Contents
and to advance funds to our directors and officers to enable them to defend against such proceedings. To receive indemnification, the director or officer must have been successful in the legal proceeding or have acted in good faith and in what was reasonably believed to be a lawful manner in our best interest and, with respect to any criminal proceeding, had no reasonable cause to believe his or her conduct was unlawful.
Indemnification Agreements
Atkore, AIH and AII are parties to an indemnification agreement with CD&R, the CD&R Investor and the CD&R Affiliates, referred to collectively as the CD&R Entities, pursuant to which Atkore, AIH and AII, subject to certain limitations, jointly and severally agreed to indemnify the CD&R Entities and their affiliates, directors, officers, partners, members, employees, agents, representatives and controlling persons, against certain liabilities arising out of performance of the consulting agreement described above under “Certain Relationships and Related Party Transactions—Consulting Agreement” and certain other claims and liabilities, including liabilities arising out of financing arrangements and securities offerings.
Prior to the completion of this offering, we will enter into indemnification agreements with our directors. The indemnification agreements will provide the directors with contractual rights to the indemnification and expense advancement rights provided under our amended and restated by-laws, as well as contractual rights to additional indemnification as provided in the indemnification agreements.
The indemnification agreements will provide for the advancement or payment of all expenses to the indemnitee and for reimbursement to us if it is found that such indemnitee is not entitled to such indemnification under applicable law and our amended and restated certificate of incorporation and amended and restated by-laws.
Directors’ and Officers’ Liability Insurance
Prior to the completion of this offering, we will have obtained directors’ and officers’ liability insurance that insures against certain liabilities that our directors and officers and the directors and officers of our subsidiaries may, in such capacities, incur.
| Item 15. | Recent Sales of Unregistered Securities. |
In May 2013, we issued 45,000 shares of our common stock to current and former employees in exchange for $450,000 in cash.
In October 2013, we issued 10,000 shares of our common stock to a current employee in exchange for $100,000 in cash.
In November 2013, we issued 3,858 shares of our common stock to current and former employees in exchange for $38,580 in cash.
In December 2013, we issued 1,631 shares of our common stock to current and former employees in exchange for $16,310 in cash.
In February 2014, we issued 10,000 shares of our common stock to a current employee in exchange for $100,000 in cash.
In May 2014, we issued 33,829 shares of our common stock to current employees in exchange for $422,863 in cash.
In May 2014, we issued 51,900 shares of our common stock to certain former employees upon exercise of vested options at a purchase price of $12.50 per share.
In July 2014, we issued 8,400 shares of our common stock to certain former employees upon exercise of vested options at a purchase price of $12.50 per share.
In August 2014, we issued 5,594 shares of our common stock to certain former employees upon exercise of vested options at a purchase price of $12.50 per share.
II-3
Table of Contents
In September 2014, we issued 17,516 shares of our common stock to certain former employees upon exercise of vested options at a purchase price of $12.50 per share.
In October 2014, we issued 39,251 shares of our common stock to certain former employees upon exercise of vested options at a purchase price of $12.50 per share.
In December 2014, we issued 2,060 shares of our common stock to current employees in exchange for $25,750 in cash.
In January 2015, we issued 24,500 shares of our common stock to certain former employees upon exercise of vested options at a purchase price of $12.50 per share.
In March 2015, we issued 3,000 shares of our common stock to certain former employees upon exercise of vested options at a purchase price of $12.50 per share.
In April 2015, we issued 113,654 shares of our common stock to certain former employees upon exercise of vested options at a purchase price of $12.50 per share.
In April 2015, we issued 8,000 restricted stock units to an outside director with a value of $12.50 per unit.
In May 2015, we issued 14,667 shares of our common stock to certain former employees upon exercise of vested options at a purchase price of $12.50 per share.
In July 2015, we issued 139,967 shares of our common stock to certain former employees upon exercise of vested options at a purchase price of $12.50 per share.
In September 2015, we issued 3,000 shares of our common stock to certain former employees upon exercise of vested options at a purchase price of $12.50 per share.
In October 2015, we issued 3,750 shares of our common stock to certain former employees upon exercise of vested options at a purchase price of $12.50 per share.
In November 2015, we issued 1,500 shares of our common stock to certain former employees upon exercise of vested options at a purchase price of $12.50 per share.
In December 2015, we issued 2,028 shares of our common stock to current employees in exchange for $25,350 in cash.
In December 2015, we issued 16,667 restricted stock units to 3 outside directors with a value of $18.00 per unit.
In January 2016, we issued 3,750 shares of our common stock to certain former employees upon exercise of vested options at a purchase price of $18.00 per share.
In January 2016, we issued 1,571 shares of our common stock to a current employee in exchange for $28,278 in cash.
The sales of the above securities were deemed to be exempt from registration under the Securities Act in reliance upon Section 4(2) of the Securities Act or Regulation D or Rule 701 promulgated thereunder, as transactions by an issuer not involving any public offering or pursuant to benefit plans and contracts relating to compensation as provided under Rule 701.
There were no underwriters employed in connection with any of the transactions set forth in this Item 15.
The share amounts above have not been adjusted to reflect our anticipated stock splits prior to completion of the offering.
II-4
Table of Contents
| Item 16. | Exhibits and Financial Statement Schedules. |
The Exhibits to this Registration Statement on Form S-1 are listed in the Exhibit Index that follows the signature pages to this Registration Statement and is herein incorporated by reference.
Financial Statement Schedules
REPORT OF INDEPENDENT REGISTERED PUBLIC ACCOUNTING FIRM
To the Board of Directors and Stockholders of
Atkore International Group Inc.
Harvey, Illinois
We have audited the consolidated financial statements of Atkore International Group Inc. and subsidiaries (the “Company”) as of September 25, 2015 and September 26, 2014, and for each of the three years in the period ended September 25, 2015, and have issued our report thereon dated March 4, 2016 (included elsewhere in this Registration Statement). Our audits also included the financial statement schedules of the Company listed in Item 16 of this Registration Statement. These financial statement schedules are the responsibility of the Company’s management. Our responsibility is to express an opinion based on our audits. In our opinion, such financial statement schedules, when considered in relation to the basic consolidated financial statements taken as a whole, present fairly, in all material respects, the information set forth therein.
/s/ DELOITTE & TOUCHE LLP
Chicago, Illinois
March 4, 2016
II-5
Table of Contents
SCHEDULE I
ATKORE INTERNATIONAL GROUP INC. (PARENT)
CONDENSED FINANCIAL INFORMATION
CONDENSED BALANCE SHEETS
| (In thousands, except share and per share amounts) |
September 25, 2015 |
September 26, 2014 |
||||||
| Assets |
||||||||
| Investment in subsidiary |
$ | 156,277 | $ | 176,469 | ||||
|
|
|
|
|
|||||
| Total Assets |
156,277 | 176,469 | ||||||
|
|
|
|
|
|||||
| Liabilities and Equity |
||||||||
| Total Liabilities |
$ | — | $ | — | ||||
|
|
|
|
|
|||||
| Equity: |
||||||||
| Common stock, $0.01 par value-authorized, 200,000,000 shares; 45,586,450 and 45,653,119 shares outstanding, respectively |
457 | 457 | ||||||
| Additional paid-in capital |
352,674 | 352,626 | ||||||
| Treasury stock, held at cost, 190,438 and 119,880 shares, respectively |
(2,580 | ) | (1,698 | ) | ||||
| Accumulated deficit |
(173,241 | ) | (168,286 | ) | ||||
| Accumulated other comprehensive loss |
(21,033 | ) | (6,630 | ) | ||||
|
|
|
|
|
|||||
| Total Equity |
156,277 | 176,469 | ||||||
|
|
|
|
|
|||||
| Total Liabilities and Equity |
$ | 156,277 | $ | 176,469 | ||||
|
|
|
|
|
|||||
See accompanying Notes to Condensed Financial Statements.
II-6
Table of Contents
SCHEDULE I
ATKORE INTERNATIONAL GROUP INC. (PARENT)
CONDENSED FINANCIAL INFORMATION
CONDENSED STATEMENTS OF OPERATIONS
| For the Year Ended | ||||||||||||
| (in thousands) |
September 25, 2015 |
September 26, 2014 |
September 27, 2013 |
|||||||||
| Equity in net loss of subsidiary |
(4,955 | ) | (73,948 | ) | (61,235 | ) | ||||||
| Net loss |
(4,955 | ) | (73,948 | ) | (61,235 | ) | ||||||
|
|
|
|
|
|
|
|||||||
| Other comprehensive income (loss) of subsidiary, net of tax |
(14,403 | ) | (4,232 | ) | 25,701 | |||||||
|
|
|
|
|
|
|
|||||||
| Comprehensive loss |
$ | (19,358 | ) | $ | (78,180 | ) | $ | (35,534 | ) | |||
|
|
|
|
|
|
|
|||||||
See accompanying Notes to Condensed Financial Statements.
II-7
Table of Contents
SCHEDULE I
ATKORE INTERNATIONAL GROUP INC. (PARENT)
CONDENSED FINANCIAL INFORMATION
CONDENSED STATEMENTS OF CASH FLOWS
| For the Year Ended | ||||||||||||
| (in thousands) |
September 25, 2015 |
September 26, 2014 |
September 27, 2013 |
|||||||||
| Cash Flows from Operating Activities: |
||||||||||||
| Net cash provided by operating activities |
$ | — | $ | — | $ | — | ||||||
|
|
|
|
|
|
|
|||||||
| Cash Flows from Investing Activities: |
||||||||||||
| Distribution received from subsidiary |
882 | 252,765 | 253 | |||||||||
| Distribution paid to subsidiary |
(49 | ) | (674 | ) | (587 | ) | ||||||
| Net cash provided by (used in) investing activities |
— | — | — | |||||||||
|
|
|
|
|
|
|
|||||||
| 833 | 252,091 | (334 | ) | |||||||||
| Cash Flows from Financing Activities: |
||||||||||||
| Issuance of common shares |
49 | 674 | 587 | |||||||||
| Repurchase of common shares |
(882 | ) | (252,765 | ) | (253 | ) | ||||||
|
|
|
|
|
|
|
|||||||
| Net cash (used in) provided by financing activities |
(833 | ) | (252,091 | ) | 334 | |||||||
|
|
|
|
|
|
|
|||||||
| Net change in cash and cash equivalents |
— | — | — | |||||||||
| Cash and cash equivalents: |
||||||||||||
| Beginning |
— | — | — | |||||||||
|
|
|
|
|
|
|
|||||||
| Ending |
$ | — | $ | — | $ | — | ||||||
|
|
|
|
|
|
|
|||||||
See accompanying Notes to Condensed Financial Statements.
II-8
Table of Contents
SCHEDULE I
ATKORE INTERNATIONAL GROUP INC. (PARENT)
CONDENSED FINANCIAL INFORMATION
NOTES TO CONDENSED FINANCIAL STATEMENTS
(amounts in thousands)
1. Description of Atkore International Group Inc.
Atkore International Group Inc. (the “Company,” “Parent” or “Atkore”) was incorporated in the State of Delaware on November 4, 2010. The Company owns 100% of Atkore International Holdings Inc. (“AIH”), which is sole owner of Atkore International, Inc. (“AII”). Prior to the transactions described below, all of the capital stock of AII was owned by Tyco International Ltd. (“Tyco”). The business of AII was operated as the Tyco Electrical and Metal Products (“TEMP”) business of Tyco. Atkore was initially formed by Tyco as a holding company to hold ownership of TEMP.
On November 9, 2010, Tyco announced that it had entered into an agreement to sell a majority interest in TEMP to CD&R Allied Holdings, L.P. (the “CD&R Investor), an affiliate of the private equity firm Clayton Dubilier & Rice, LLC (“CD&R”). On December 22, 2010, the transaction was completed and CD&R acquired shares of a newly created class of cumulative convertible preferred stock (the “Preferred Stock”) of the Company. The Preferred Stock initially represented 51% of the Company’s outstanding capital stock (on an as-converted basis). On December 22, 2010, the Company also issued common stock (the “Common Stock”) to Tyco’s wholly owned subsidiary, Tyco International Holding S.à.r.l. (“Tyco Seller”), that initially represented the remaining 49% of the Company’s outstanding capital stock. Subsequent to December 22, 2010, the Company has operated as an independent, stand-alone entity.
On March 6, 2014, the Company entered into a non-binding letter of intent with Tyco for the acquisition of 29,400 shares of Common Stock held by Tyco Seller. On April 9, 2014, the Company paid $250,000 to Tyco Seller to redeem the shares, which were subsequently retired. The Company paid $2,000 of expenses related to the share redemption.
In a separate transaction on the same date, the CD&R Investor converted its Preferred Stock and accumulated Preferred Dividends into Common Stock. As of September 26, 2014, Common Stock is the Company’s sole issued and outstanding class of equity securities.
The Parent has no significant operations or assets other than its indirect ownership of the equity of AII. Accordingly, the Parent is dependent upon distributions from AII to fund its obligations. However, under the terms of the agreements governing AII’s borrowings, AII’s ability to pay dividends or lend to Atkore Holding or the Parent, is restricted. While certain exceptions to the paying dividends or lending funds restrictions exist, these restrictions have resulted in the restricted net assets (as defined in Rule 4-08(e)(3) of Regulation S-X) of the Company’s subsidiaries exceeding 25% of the consolidated net assets of the Company and its subsidiaries. Atkore Holding has no obligations to pay dividends to the Parent except to pay specified amounts to Parent in order to fund the payment of the Parent’s tax obligations.
2. Basis of Presentation
The accompanying condensed Parent only financial statements are required in accordance with Rule 4-08(e)(3) of Regulation S-X. The financial statements include the amounts of the Parent and its investment in its subsidiaries under the equity method, and does not present the financial statements of the Parent and its subsidiaries on a consolidated basis. Under the equity method, investment in its subsidiaries is stated at cost plus contributions and equity in undistributed income (loss) of subsidiary less distributions received since the date of acquisition. These condensed Parent only financial statements should be read in conjunction with the Atkore International Group, Inc. consolidated financial statements and their accompanying notes.
II-9
Table of Contents
3. Dividends and Distributions from Subsidiaries
The Company received distributions of $882, $252,765, and $253 from its subsidiaries for the years ended September 25, 2015, September 26, 2014 and September 27, 2013, respectively. The distributions received were used to repurchase shares of the Company’s Common Stock. These dividends were permissible under an exception to the net asset restrictions of the the agreements governing AII’s borrowings, which allow for dividend payments from AII to AIH or the Parent for the purpose of repurchasing shares of Parent’s Common Stock.
II-10
Table of Contents
SCHEDULE II
ATKORE INTERNATIONAL GROUP INC.
VALUATION AND QUALIFYING ACCOUNTS
| (in thousands) | Balance at Beginning of Year |
Additions Charged to Income |
Write offs and Other |
Balance at End of Year |
||||||||||||
| Allowance for Doubtful Accounts: |
||||||||||||||||
| For the Year Ended September 25, 2015 |
$ | 1,986 | $ | (560 | ) | $ | (253 | ) | $ | 1,173 | ||||||
| For the Year Ended September 26, 2014 |
$ | 3,184 | $ | (616 | ) | $ | (582 | ) | $ | 1,986 | ||||||
| For the Year Ended September 27, 2013 |
$ | 2,912 | $ | 552 | $ | (280 | ) | $ | 3,184 | |||||||
| Deferred Tax Valuation Allowance: |
||||||||||||||||
| For the Year Ended September 25, 2015 |
$ | 7,708 | $ | 1,107 | $ | (1,283 | ) | $ | 7,532 | |||||||
| For the Year Ended September 26, 2014 |
$ | 8,346 | $ | 548 | $ | (1,186 | ) | $ | 7,708 | |||||||
| For the Year Ended September 27, 2013 |
$ | 5,325 | $ | 3,409 | $ | (388 | ) | $ | 8,346 | |||||||
| Item 17. | Undertakings. |
| (a) | The undersigned registrant hereby undertakes to provide to the underwriters at the closing specified in the underwriting agreements certificates in such denominations and registered in such names as required by the underwriters to permit prompt delivery to each purchaser. |
| (b) | Insofar as indemnification for liabilities arising under the Securities Act of 1933, as amended, or the “Securities Act,” may be permitted to directors, officers and controlling persons of the registrant pursuant to the foregoing provisions, or otherwise, the registrant has been advised that in the opinion of the United States Securities and Exchange Commission such indemnification is against public policy as expressed in the Securities Act and is, therefore, unenforceable. In the event that a claim for indemnification against such liabilities (other than the payment by the registrant of expenses incurred or paid by a director, officer or controlling person of the registrant in the successful defense of any action, suit or proceeding) is asserted by such director, officer or controlling person in connection with the securities being registered, the registrant will, unless in the opinion of its counsel the matter has been settled by controlling precedent, submit to a court of appropriate jurisdiction the question whether such indemnification by it is against public policy as expressed in the Securities Act and will be governed by the final adjudication of such issue. |
| (c) | The undersigned registrant hereby undertakes that: |
| (1) | For purposes of determining any liability under the Securities Act, the information omitted from the form of prospectus filed as part of this registration statement in reliance upon Rule 430A and contained in a form of prospectus filed by the registrant pursuant to Rule 424(b)(1) or (4) or 497(h) under the Securities Act shall be deemed to be part of this registration statement as of the time it was declared effective. |
| (2) | For the purpose of determining any liability under the Securities Act, each post-effective amendment that contains a form of prospectus shall be deemed to be a new registration statement relating to the securities offered therein, and the offering of such securities at that time shall be deemed to be the initial bona fide offering thereof. |
II-11
Table of Contents
SIGNATURES
Pursuant to the requirements of the Securities Act of 1933, as amended, Atkore International Group Inc. has duly caused this registration statement to be signed on its behalf by the undersigned, thereunto duly authorized, in the City of Harvey, State of Illinois, on May 5, 2016.
| ATKORE INTERNATIONAL GROUP INC. | ||
| By: | /s/ John P. Williamson | |
| Name: John P. Williamson | ||
| Title: President and Chief Executive Officer, Director | ||
Pursuant to the requirements of the Securities Act of 1933, this registration statement has been signed on May 5, 2016 by the following persons in the capacities indicated.
| Signature |
Title | |||
| * Philip W. Knisely |
Director and Chairman of the Board | |||
| /s/ John P. Williamson John P. Williamson |
President and Chief Executive Officer, Director (Principal Executive Officer) | |||
| /s/ James A Mallak James A. Mallak |
Vice President and Chief Financial Officer (Principal Financial Officer and Principal Accounting Officer) | |||
| * James G. Berges |
Director | |||
| * Jeri L. Isbell |
Director | |||
| * Scott H. Muse |
Director | |||
| * Nathan K. Sleeper |
Director | |||
| * William VanArsdale |
Director | |||
| * A. Mark Zeffiro |
Director | |||
| * Jonathan L. Zrebiec |
Director | |||
| *By: |
/s/ John P. Williamson John P. Williamson as Attorney-in-Fact |
|||
S-1
Table of Contents
EXHIBIT INDEX
Note Regarding Reliance on Statements in Our Contracts: In reviewing the agreements included as exhibits to this Registration Statement on Form S-1, please remember that they are included to provide you with information regarding their terms. The agreements contain representations and warranties by each of the parties to the applicable agreement. These representations and warranties were made for the benefit of the other parties to the applicable agreement and (i) were not intended to be treated as categorical statements of fact, but rather as a way of allocating the risk to one of the parties if those statements prove to be inaccurate; (ii) may have been qualified in such agreement by disclosures that were made to the other party in connection with the negotiation of the applicable agreement; (iii) may apply contract standards of “materiality” that are different from “materiality” under applicable securities laws; and (iv) were made only as of the date of the applicable agreement or such other date or dates as may be specified in the agreement and are subject to more recent developments. Additional information about Atkore International Group Inc., its subsidiaries and affiliates may be found elsewhere in this Registration Statement on Form S-1.
| Exhibit Number |
Exhibit Description | |
| 1.1# | Form of Underwriting Agreement. | |
| 2.1 | Investment Agreement, dated as of November 9, 2010, by and among CD&R Allied Holdings, L.P., Tyco International Ltd., Tyco International Holding S.à.r.l. and Atkore International Group Inc., incorporated by reference from Exhibit 2.1 to AIH’s Registration Statement on Form S-4 filed on June 3, 2011. | |
| 2.4 | Share Purchase Agreement, dated as of August 26, 2013, by and among Atkore International Indústria e Comércio de Aço e Materiais Elétricos Ltda., Panatlântica S.A., Allied Switzerland GmbH and Atkore International Inc., incorporated by reference from Exhibit 2.1 to AIH’s Current Report on Form 8-K filed on September 27, 2013. | |
| 2.4.1 | First Amendment, dated September 23, 2013, to Share Purchase Agreement, dated as of August 26, 2013, by and among Atkore International Indústria e Comércio de Aço e Materiais Elétricos Ltda., Panatlântica S.A., Allied Switzerland GmbH and Atkore International Inc., incorporated by reference from Exhibit 2.2 to AIH’s Current Report on Form 8-K filed on September 27, 2013. | |
| 2.5 | Asset Purchase Agreement, dated September 13, 2013, by and among Heritage Plastics, Inc., Heritage Plastics Central, Inc., Heritage Plastics West, Inc., each shareholder of the foregoing companies and Atkore Plastic Pipe Corporation, incorporated by reference from Exhibit 2.1 to AIH’s Current Report on Form 8-K filed on September 18, 2013. | |
| 2.6 | Asset Purchase Agreement, dated September 13, 2013, by and among Liberty Plastics, LLC, each member of Liberty Plastics, LLC and Atkore Plastic Pipe Corporation, incorporated by reference from Exhibit 2.2 to the AIH’s Current Report on Form 8-K filed on September 18, 2013. | |
| 2.7* | Stock Redemption Agreement, dated as of April 9, 2014, by and among Tyco International Holding S.à.r.l., Atkore International Group Inc. and CD&R Allied Holdings, L.P. | |
| 3.1.1** | Amended and Restated Certificate of Incorporation of Atkore International Group Inc. | |
| 3.1.2# | Certificate of Amendment of Amended and Restated Certificate of Incorporation of Atkore International Group Inc. | |
| 3.2# | Form of Second Amended and Restated Certificate of Incorporation of Atkore International Group Inc. | |
E-1
Table of Contents
| Exhibit Number |
Exhibit Description | |
| 3.3** | Amended and Restated By-Laws of Atkore International Group Inc. | |
| 3.4* | Form of Second Amended and Restated By-Laws of Atkore International Group Inc. | |
| 4.1* | Form of Common Stock Certificate. | |
| 5.1# | Opinion of Debevoise & Plimpton LLP. | |
| 10.1 | Credit Agreement, dated as of December 22, 2010, among Atkore International, Inc., the subsidiary borrowers from time to time party thereto, the several banks and other financial institutions from time to time party thereto, UBS AG, Stamford Branch, as an issuing lender, as administrative agent for the lenders thereunder and as collateral agent for the Secured Parties and the Issuing Lenders, Deutsche Bank AG New York Branch, as co-collateral agent and UBS Loan Finance LLC, as swingline lender, incorporated by reference from Exhibit 10.6 to AIH’s Registration Statement on Form S-4/A filed on August 12, 2011. | |
| 10.1.1** | First Amendment to Credit Agreement, dated as of February 3, 2011, among Atkore International, Inc., the subsidiary borrowers, the several banks and other financial institutions from time to time parties thereto, UBS AG, Stamford Branch, as an issuing lender, as administrative agent for the lenders and as collateral agent for the secured parties, DeutscheBank AG New York Branch, as co-collateral agent, and UBS Loan Finance LLC, as Swingline Lender. | |
| 10.1.2** | Second Amendment to Credit Agreement and First Amendment to and Reaffirmation of Guarantee and Collateral Agreement, dated as of October 23, 2013, among Atkore International, Inc., the subsidiary borrowers, the several banks and other financial institutions from time to time parties thereto, UBS AG, Stamford Branch, as an issuing lender, as administrative agent for the Lenders and as collateral agent for the secured parties, DeutscheBank AG New York Branch, as co-collateral agent, and UBS Loan Finance LLC, as Swingline Lender. | |
| 10.1.3** | Third Amendment to Credit Agreement, dated as of April 9, 2014, among Atkore International, Inc., the Persons party thereto and identified on the signature pages as a guarantor, the several banks and other financial institutions from time to time parties thereto, UBS AG, Stamford Branch, as an issuing lender, as administrative agent for the Lenders and as collateral agent for the secured parties, and Deutsche Bank AG New York Branch, as co-collateral agent. | |
| 10.1.4** | Additional Lender Joinder Agreement, dated as of December 17, 2014, by and among PNC Bank, National Association, The Huntington National Bank, Citizens Bank, National Association and JPMorgan Chase Bank, N.A., Atkore International, Inc., the subsidiary borrowers from time to time party to the Credit Agreement and UBS AG, Stamford Branch, as administrative agent. | |
| 10.1.5** | Fourth Amendment to Credit Agreement, dated as of November 12, 2015, among Atkore International, Inc., the several banks and other financial institutions from time to time parties thereto, UBS AG, Stamford Branch, as an issuing lender, as administrative agent for the lenders and as collateral agent for the secured parties, and Deutsche Bank AG New York Branch, as co-collateral agent. | |
| 10.2** | First Lien Credit Agreement, dated as of April 9, 2014, among Atkore International, Inc., the several banks and other financial institutions from time to time party thereto, and Deutsche Bank AG New York Branch, as administrative agent for the lenders thereunder and as collateral agent for the secured parties. | |
| 10.2.1** | Amendment No. 1 to First Lien Credit Agreement, dated as of October 14, 2015, among Atkore International, Inc. and Deutsche Bank AG New York Branch, as administrative agent. | |
| 10.3** | Second Lien Credit Agreement, dated as of April 9, 2014, among Atkore International, Inc., the several banks and other financial institutions from time to time party thereto, and Deutsche Bank AG New York Branch, as administrative agent for the lenders thereunder and as collateral agent for the secured parties. | |
E-2
Table of Contents
| Exhibit Number |
Exhibit Description | |
| 10.3.1** | Amendment No. 1 to Second Lien Credit Agreement, dated as of October 14, 2015, among Atkore International, Inc. and Deutsche Bank AG New York Branch, as administrative agent. | |
| 10.4 | Guarantee and Collateral Agreement, dated as of December 22, 2010 made by Atkore International Holdings Inc., Atkore International, Inc. and certain subsidiary borrowers, in favor of UBS AG, Stamford Branch, as collateral agent and administrative agent for the banks and other financial institutions from time to time parties to the Credit Agreement, incorporated by reference from Exhibit 10.7 to AIH’s Registration Statement on Form S-4/A filed on August 12, 2011. | |
| 10.5** | First Lien Guarantee and Collateral Agreement, dated as of April 9, 2014, made by Atkore International Holdings Inc., Atkore International, Inc., and certain subsidiaries of Atkore International, Inc. from time to time party thereto, in favor of Deutsche Bank AG New York Branch, as collateral agent and administrative agent for the banks and other financial institutions from time to time parties to the First Lien Credit Agreement. | |
| 10.6** | Second Lien Guarantee and Collateral Agreement, dated as of April 9, 2014, made by Atkore International Holdings Inc., Atkore International, Inc., and certain subsidiaries of Atkore International, Inc. from time to time party thereto, in favor of Deutsche Bank AG New York Branch, as collateral agent and administrative agent for the banks and other financial institutions from time to time parties to the Second Lien Credit Agreement. | |
| 10.7 | Intercreditor Agreement, dated as of December 22, 2010, between UBS AG, Stamford Branch, in its capacity as collateral agent for the ABL Credit Agreement lenders and Wilmington Trust FSB, in its capacity as collateral agent for the Noteholder Secured Parties, incorporated by reference from Exhibit 10.9 to AIH’s Registration Statement on Form S-4/A filed on August 12, 2011. | |
| 10.7.1** | First Amendment and Waiver, dated as of April 9, 2014, to the Intercreditor Agreement, dated as of December 22, 2010, among UBS AG, Stamford Branch, in its capacity as ABL Agent and Deutsche Bank AG New York Branch, in its capacity as Note Agent. | |
| 10.8** | Intercreditor Agreement, as of April 9, 2014, by and between Deutsche Bank AG New York Branch, in its capacity as collateral agent for the Original First Lien Secured Parties referred to therein, and Deutsche Bank AG New York Branch, in its capacity as collateral agent for the Original Second Lien Secured Parties referred to therein. | |
| 10.9† | Employment Agreement, dated as of May 23, 2011, by and between John Williamson, Atkore International, Inc. and Atkore International Group Inc., incorporated by reference from Exhibit 10.12 to AIH’s Registration Statement on Form S-4 filed on June 3, 2011. | |
| 10.10† | Offer Letter, dated December 7, 2011, by and between Atkore International, Inc. and Kevin P. Fitzpatrick, incorporated by reference from Exhibit 10.22 to AIH’s Annual Report on Form 10-K for the year ended September 28, 2012. | |
| 10.11† | Offer Letter, dated as of February 17, 2012, by and between Atkore International, Inc. and James A. Mallak, incorporated by reference from Exhibit 10.1 to AIH’s Quarterly Report on Form 10-Q for the quarter ended March 30, 2012. | |
| 10.12†** | Offer Letter, dated as of July 15, 2013, by and between Atkore International, Inc. and William E. Waltz. | |
| 10.13†** | Offer Letter, dated as of April 22, 2014, by and between Atkore International, Inc. and Michael J. Schulte. | |
| 10.14† | Offer Letter, dated as of January 24, 2013, by and between Atkore International Inc. and William Taylor, incorporated by reference from Exhibit 10.26 to AIH’s Annual Report on Form 10-K for the year ended September 27, 2013. | |
E-3
Table of Contents
| Exhibit Number |
Exhibit Description | |
| 10.15†** | Severance Agreement, dated November 17, 2014, by and between Atkore International, Inc. and Kevin P. Fitzpatrick. | |
| 10.16†** | Severance Agreement, dated November 17, 2014, by and between Atkore International, Inc. and James A. Mallak. | |
| 10.17†** | Severance Agreement, dated July 15, 2015, by and between Atkore International, Inc. and William E. Waltz. | |
| 10.18†** | Separation Agreement, effective April 17, 2015, by and between Atkore International, Inc. and William Taylor. | |
| 10.19† | Severance Policy, dated May 9, 2012, incorporated by reference from Exhibit 10.21 to AIH’s Annual Report on Form 10-K for the year ended September 23, 2012. | |
| 10.20† | Atkore International Group Inc. Stock Incentive Plan, incorporated by reference from Exhibit 10.15 to AIH’s Registration Statement on Form S-4 filed on June 3, 2011. | |
| 10.21† | Form of Employee Stock Option Agreement, incorporated by reference from Exhibit 10.16 to AIH’s Registration Statement on Form S-4 filed on June 3, 2011. | |
| 10.22† | Form of Employee Stock Subscription Agreement (Purchased Shares), incorporated by reference from Exhibit 10.17 to AIH’s Registration Statement on Form S-4 filed on June 3, 2011. | |
| 10.23†** | 2015 Annual Incentive Plan terms. | |
| 10.24.1†** | Form of Award Letter under 2015 Annual Incentive Plan. | |
| 10.24.2†** | Form of Award Letter under 2015 Annual Incentive Plan (Business Unit President). | |
| 10.25†* | Form of Director Indemnification Agreement. | |
| 10.26†* | Atkore International Group Inc. Annual Incentive Plan. | |
| 10.27†* | Atkore International Group Inc. 2016 Omnibus Equity Incentive Plan. | |
| 10.28.1†* | Form of Employee Stock Option Agreement under the 2016 Omnibus Equity Incentive Plan. | |
| 10.28.2†* | Form of Employee Restricted Stock Agreement under the 2016 Omnibus Equity Incentive Plan. | |
| 10.29†* | Atkore International Group Inc. Non-Employee Director Compensation Program. | |
| 10.30†* | Form of Director Deferred Stock Unit Agreement under the 2016 Omnibus Equity Incentive Plan. | |
| 10.31 | Indemnification Agreement, dated as of December 22, 2010 among Atkore International Group Inc., Atkore International Holdings Inc., Atkore International Inc., CD&R Allied Holdings, L.P., Clayton, Dubilier & Rice Fund VIII, L.P., CD&R Friends & Family Fund VIII, L.P., CD&R Allied Advisor Co-Investor, L.P., Clayton, Dubilier & Rice, Inc. and Clayton, Dubilier & Rice, LLC, incorporated by reference from Exhibit 10.4 to AIH’s Registration Statement on Form S-4 filed on June 3, 2011. | |
| 10.32 | Indemnification Agreement, dated as of December 22, 2010 among Atkore International Group Inc., Atkore International Holdings Inc., Atkore International Inc., Tyco International Ltd., Tyco International Holding S.à.r.l. and Tyco International Management Company, LLC, incorporated by reference from Exhibit 10.5 to AIH’s Registration Statement on Form S-4 filed on June 3, 2011. | |
| 10.32.1 | Consulting Agreement, dated December 22, 2010 by and between Atkore International Group Inc., Atkore International Holdings Inc., Atkore International Inc. and Clayton, Dubilier & Rice, LLC, incorporated by reference from Exhibit 10.2 to AIH’s Registration Statement on Form S-4 filed on June 3, 2011. | |
| 10.32.2** | Side Letter, dated as of June 26, 2014, by and among Atkore International Group Inc., Atkore International Holdings Inc., Atkore International, Inc. and Clayton, Dubilier & Rice, LLC. | |
E-4
Table of Contents
| Exhibit Number |
Exhibit Description | |
| 10.33 | Consulting Agreement, dated December 22, 2010 by and between Atkore International Group Inc., Atkore International Holdings Inc., Atkore International Inc. and Tyco International Management Company, LLC, incorporated by reference from Exhibit 10.3 to AIH’s Registration Statement on Form S-4 filed on June 3, 2011. | |
| 10.33.1** | Termination Agreement, dated April 9, 2014, by and among Atkore International Group Inc., Atkore International Holdings Inc., Atkore International Inc., Tyco International Ltd., Tyco International holdings S.à.r.l., Tyco International Management Company, LLC and CD&R Allied Holdings, L.P. | |
| 10.34* | Form of Consulting Agreement Termination Agreement. | |
| 10.35* | Form of Stockholders Agreement. | |
| 10.36* | Form of Registration Rights Agreement. | |
| 21.1** | List of Subsidiaries of Atkore International Group Inc. as of March 25, 2016. | |
| 23.1* | Consent of Deloitte & Touche LLP. | |
| 23.2* | Consent of Rea & Associates, Inc. | |
| 23.3# | Consent of Debevoise & Plimpton LLP (included in Exhibit 5.1 hereto). | |
| 24.1** | Powers of Attorney (contained on signature pages to the Registration Statement on Form S-1). | |
| * | Filed herewith. |
| † | Identifies each management contract or compensatory plan or arrangement. |
| # | To be filed by amendment. |
| **Previously | filed. |
E-5