Attached files
| file | filename |
|---|---|
| 8-K - FORM 8-K - Tesla, Inc. | d158845d8k.htm |
Exhibit 99.1

|
Tesla First Quarter 2016 Update
• Advancing 500,000 unit build plan by two years to 2018 • Volume Model 3 production and deliveries to start in late 2017 • Model S orders up 45% compared to Q1 last year, accelerating globally • Model X production increased from 507 in Q4 to 2,659 in Q1 • Cash balance up $245M sequentially inclusive of ABL & exclusive of Model 3 • Affirming 80,000 to 90,000 deliveries this year |
May 4, 2016
Dear Customers and Fellow Shareholders:
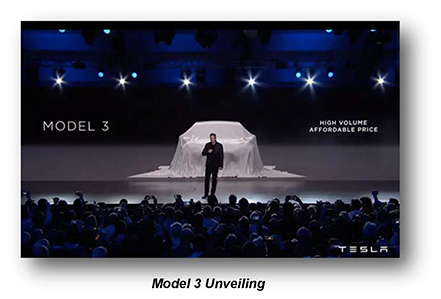
| The overwhelming demand for Model 3 confirms that compelling all-electric vehicles have mass-market appeal. In the first week of taking deposits for Model 3, we received more than 325,000 reservations despite no advertising or paid endorsements. This implies about $14 billion in future sales, making the Model 3 introduction the biggest consumer product launch ever. Since then, reservations have continued to grow to surpass even our expectations. With Model 3, our mission of accelerating the transition to sustainable transportation is more achievable than ever. |
| Apart from the Model 3 launch, Model S demand grew globally and Model X production continued to ramp. Tesla Energy also expanded production and deliveries, with momentum continuing to build, and Gigafactory construction remains ahead of our original plan. |
| Our financial performance improved, as well. We managed to drive down both non-GAAP operating expenses and capital expenditures. Combined with more focused working capital management, this allowed us to more effectively manage our cash outflows in the quarter. Looking ahead, we affirm our plan to deliver 80,000 to 90,000 new vehicles in 2016. |
Advancing Build Plan
|
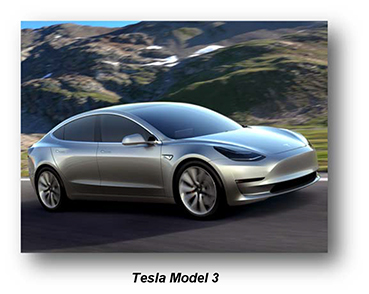
We are on track to achieve volume Model 3 production and deliveries in late 2017. Of course, in order to meet that timeframe, we will be holding both ourselves and our suppliers accountable to be ready for volume production in advance of that timing. |
| |
|
Additionally, given the demand for Model 3, we have decided to advance our 500,000 total unit build plan (combined for Model S, Model X, and Model 3) to 2018, two years earlier than previously planned. Increasing production five fold over the next two years will be challenging and will likely require some additional capital, but this is our goal and we will be working hard to achieve it. |
||
|
We remain on plan to make the first cells at the Gigafactory in Q4 2016, and we are adjusting our plans there to accommodate our revised build plan. |
||
|
Our objective with Model 3 is to create the world’s best car with a base price of $35,000, before any incentives, with a range of at least 215 miles on a single charge, and with strong gross margins. We plan to incorporate our best technology into Model 3, yet keep it relatively simple to build at high volume and with high quality. |
Accelerating Global Demand
| Q1 Model S net orders rose 45% compared to a year ago, and grew at a faster pace than last quarter. The more rapid pace of growth was driven by increased order growth in North America and Europe, and a more than 160% increase in orders from Asia compared to a year ago. Model S continues to be the market share leader in North America and Europe among all comparably priced four-door sedans. |
| The growth in Model S orders and the Model X reservation conversion rate support our plan of 80,000 to 90,000 deliveries in 2016. Notably, this demand level was reached ahead of the Model S refresh, before Model X could be seen in stores, and prior to the unveiling of Model 3, which we believe is stimulating demand for all of our vehicles. |
|
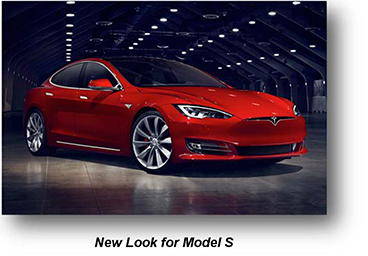
We introduced the Model S refresh in April, with the largest single set of hardware changes (nearly 300 part changes in total) on Model S to date. Updates include an enhanced look for the front of the car, adaptive headlights, faster charging and more range, all for a minimal price increase. Air quality inside the car is just as important as it is outside, so we added the same HEPA air filtration system that Model X has. Now all of our new Model S and Model X customers can have access to Bioweapon Defense mode. | |
|
We are also pleased that despite these product upgrades, demand for used Model S vehicles remains strong and residual values are in line with our expectations. | ||
|
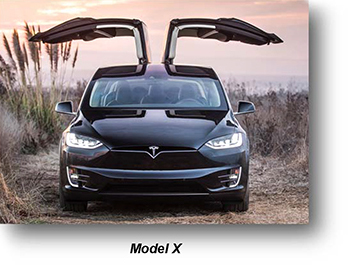
With respect to Model X, greater production has led to greater availability. In April, we launched online Model X configuration in North America and began to deploy Model X to many of our stores in the United States. Model X will be in the rest of our stores by year end. |
| To support the rapidly growing fleet of Tesla vehicles, we continue to expand our network of sales, service, and Superchargers worldwide. We remain on plan to open more than 70 additional retail and service locations in 2016, to bring our total to nearly 300 locations. We also energized 29 Supercharger locations and 311 Destination charging locations during Q1, bringing our total away-from-home charging locations to almost 615 and 2,200, respectively. Global Supercharger and Destination connectors now total over 3,600 and 3,700, respectively. |
| Tesla Energy posted strong growth in the quarter as well. During Q1, we delivered over 25 MWh of energy storage to customers in four continents. We delivered over 2,500 Powerwalls and nearly 100 Powerpacks in the quarter throughout North America, Asia, Europe and Africa. |
Enhancing and Increasing Production Capacity
| In Q1, we reached a new quarterly production record of 15,510 vehicles, up 10% from Q4. Q1 Model S production of 12,851 vehicles met plan, but Model X production of 2,659 vehicles was insufficient to meet our projected level of deliveries. Our Q1 delivery announcement explained the Model X production challenges and the reasons for them. We are making significant progress in increasing production and plan to continue increasing total vehicle production to support over 50,000 deliveries in the second half of this year. Continuing to ramp high quality production is the top priority at Tesla right now. |
| Gigafactory construction and implementation continues at a pace consistent with our plans for cell production by year end. This will result in battery cell production in 2016, in preparation for the revised build plan. |
|
Q1 Results
| Our Q1 results reflect our initial efforts to manage cash more effectively. While we are in the early stages of significantly enhancing our systems and operations to improve working capital management, we are already seeing the benefits of improved inventory control, better vendor management, and more rapid collections. |
| With a careful eye on spending, we were able to reduce non-GAAP operating expenses sequentially for the first time in three years. Total Q1 operating expenses were $417 million on a non-GAAP basis, down 3% from Q4. Research and development expenses declined sequentially as Model X development work diminished during the quarter. GAAP operating expenses were $501 million and include $83 million of non-cash stock based compensation. Stock based compensation increased sequentially as achieving certain developmental and operational milestones became highly probable. |
| By improving our capital budgeting, we reduced capital expenditures by 47% from Q4 to $217 million, without compromising our future growth prospects. Q1 capital expenditures were primarily for increased production capacity, Gigafactory construction, and customer support infrastructure. |
| Cash and cash equivalents rose to $1.44 billion at quarter end aided by more effective cash management and $430 million drawn against our asset based credit line. The quarter end cash balance does not include any meaningful cash flow from Model 3 reservations. Almost all Model 3 reservations received on the last day of Q1 are recorded as receivables, pending cash receipt from various credit card banks. April cash receipts for vehicles in transit at quarter end plus Model 3 reservation deposits allowed us to pay back $350 million on the asset based line. |
| Our GAAP cash outflow from operations during the quarter was $250 million. After adding $242 million of cash inflows from vehicle sales to our bank leasing partners, our cash flow from core operations was nearly breakeven. |
| Total Q1 non-GAAP revenue was $1.60 billion for the quarter, up over 45% from a year ago, while GAAP revenue was $1.15 billion. Total Q1 gross margin was 21.7% on a non-GAAP basis and 22.0% on a GAAP basis. |
| Automotive revenue was $1.48 billion on a non-GAAP basis, and comprises $1.03 billion of GAAP Automotive revenue plus $455 million of net increase in deferred revenue resulting from lease accounting used for indirect leases and cars sold with a resale value guarantee. During the quarter, we delivered 14,810 vehicles, almost the same as what we estimated in our April announcement. Model S average prices improved 1.4% sequentially, as price increases and higher option take rates offset a slight mix shift to less expensive Model S variants. Average Q1 Model X prices were about 30% higher than for Model S. |
|
The popularity of leasing increased again this quarter, as did the percentage of Tesla direct leases. Tesla directly leased 1,405 cars to customers in Q1, worth $149 million of aggregate transaction value. | |
|
After excluding $57 million of ZEV credit revenue, Q1 Automotive gross margin was 20.0% on a non-GAAP basis and 19.6% on a GAAP basis. Our warranty accrual rate on all new vehicles declined from Q4, based on projected warranty costs, as vehicle reliability continues to improve. Overall, our non-GAAP Automotive gross margin declined 90 basis points over Q4 due to an increase in delivery mix of Model X, which carries a lower margin during its ongoing production ramp phase. | ||
|
Q1 Services and other revenue was $121 million, up 160% from a year ago. The strong growth was driven primarily by higher pre-owned Model S sales. Q1 Services and other gross margin increased sequentially to 4.7%, due mainly to increased margin on pre-owned vehicle sales and service. |
| Our Q1 non-GAAP net loss decreased 34% sequentially to $75 million, or $0.57 loss per share based on 133 million basic shares, while our Q1 GAAP net loss was $282 million or $2.13 loss per basic share. Both figures include a $9 million gain, or almost $0.07 per share, related mostly to unrealized gains from revaluation of our foreign currency transactions. |
Outlook
| In Q2, we expect to produce about 20,000 vehicles, representing a sequential increase of nearly 30%, and will deliver as many of these cars as we can in Q2, with the rest being delivered in Q3. Due to a large number of vehicles in transit to customers in Europe and Asia at end of quarter, Q2 deliveries are expected to be approximately 17,000 vehicles. Importantly, now that supply chain constraints have been resolved, we plan to exit Q2 at a steady production rate of 2,000 vehicles per week, thus laying the foundation for a strong Q3 delivery number. |
| Looking out beyond Q2, we remain confident that we can deliver 80,000 to 90,000 new Model S and Model X vehicles in 2016. This is due to the growing demand we are seeing for Model S and Model X, the improved rate of production that we project for Q2, and the production increases planned for the back half of 2016. |
| Model S cost reductions and improving Model X manufacturing efficiency should cause Automotive gross margin to increase. We are on plan for Model S non-GAAP gross margin to approach 30% and Model X non-GAAP gross margin of about 25% by year-end, with higher Model X gross margin in 2017. |
| Total non-GAAP operating expenses in Q2 should increase slightly from Q1 as we grow our customer support infrastructure while maintaining our focus on expense management. Then, as we accelerate Model 3 development work in the back half of 2016, operating expense growth should increase, so that full year 2016 total non-GAAP operating expenses should increase by about 20-25%. |
| Given our plans to advance our 500,000 total unit build plan, essentially doubling the prior growth plan, we are re-evaluating our level of capital expenditures, but expect it will be about 50% higher than our previous guidance of $1.5 billion for 2016. Naturally, this will impact our ability to be net cash flow positive for the year, but given the demand for Model 3, investing to meet that demand is the best long-term decision for Tesla. |
| The overwhelming demand for Model 3 and our improving financial results in Q1 represent a strong start to 2016. We are looking forward to bringing Model 3 to market as together we advance the world’s transition to sustainable transportation. |

|

| |
| Elon Musk, Chairman & CEO | Jason Wheeler, Chief Financial Officer | |
Webcast Information
Tesla will provide a live webcast of its first quarter 2016 financial results conference call beginning at 2:30 p.m. PT on May 4, 2016, at ir.teslamotors.com. This webcast will also be available for replay for approximately one year thereafter.
Non-GAAP Financial Information
Consolidated financial information has been presented in accordance with GAAP as well as on a non-GAAP basis. On a non-GAAP basis, financial measures exclude non-cash items such as stock-based compensation, the change in fair value related to Tesla’s warrant liability, non-cash interest expense related to Tesla’s convertible senior notes. Non-GAAP financial measures also exclude the impact of lease accounting on related revenues and cost of revenues associated with Model S and Model X deliveries with the resale value guarantee and similar buy-back terms, as this perspective is useful in understanding the underlying cash flow activity and timing of vehicle deliveries. Management believes that it is useful to supplement its GAAP financial statements with this non-GAAP information because management uses such information internally for its operating, budgeting and financial planning purposes. These non-GAAP financial measures also facilitate management’s internal comparisons to Tesla’s historical performance as well as comparisons to the operating results of other companies. Non-GAAP information is not prepared under a comprehensive set of accounting rules and therefore, should only be read in conjunction with financial information reported under U.S. GAAP when understanding Tesla’s operating performance. A reconciliation between GAAP and non-GAAP financial information is provided below.
Forward-Looking Statements
Certain statements in this shareholder letter, including statements in the “Outlook” section; statements relating to the progress Tesla is making with respect to product development; statements regarding growth in the number of Tesla store, service center, Supercharger locations; statements relating to the production and delivery timing of future products such as Model 3; growth in demand and orders for Tesla products and the catalysts for that growth; the ability to achieve product demand, volume, production, delivery, revenue, cash flow, leasing, gross margin, spending, capital expenditure and profitability targets; productivity improvements and capacity expansion plans; and Tesla Gigafactory timing, plans and output expectations, including those related to cell and other production, are “forward-looking statements” that are subject to risks and uncertainties. These forward-looking statements are based on management’s current expectations, and as a result of certain risks and uncertainties, actual results may differ materially from those projected. The following important factors, without limitation, could cause actual results to differ materially from those in the forward-looking statements: the risk of delays in the manufacture, production and delivery of Model S and Model X vehicles and Tesla Energy products, and production and delivery of Model 3 vehicles; the ability to design and achieve market acceptance of Model S and its variants, as well as new vehicle models, specifically Model X and Model 3; the ability of suppliers to meet quality and part delivery expectations at increasing volumes; adverse foreign exchange movements; any failures by Tesla products to perform as expected or if product recalls occur; Tesla’s ability to continue to reduce or control manufacturing and other costs; consumers’ willingness to adopt electric vehicles; competition in the automotive market generally and the alternative fuel vehicle market in particular; Tesla’s ability to establish, maintain and strengthen the Tesla brand; Tesla’s ability to manage future growth effectively as we rapidly grow, especially internationally; the unavailability, reduction or elimination of government and economic incentives for electric vehicles; Tesla’s ability to establish, maintain and strengthen its relationships with strategic partners such as Panasonic; potential difficulties in finalizing, performing and realizing potential benefits under definitive agreements for the Tesla Gigafactory site, obtaining permits and incentives, negotiating terms with technology, materials and other partners for Gigafactory, and maintaining Gigafactory implementation schedules, output and costs estimates; and Tesla’s ability to execute on its retail strategy and for new store, service center and Tesla Supercharger openings. More information on potential factors that could affect our financial results is included from time to time in our Securities and Exchange Commission filings and reports, including the risks identified under the section captioned “Risk Factors” in our quarterly report on Form 10-K filed with the SEC on February 24, 2016. Tesla disclaims any obligation to update information contained in these forward-looking statements whether as a result of new information, future events, or otherwise.
| Investor Relations Contact: | Press Contact: | |||
| Jeff Evanson | Khobi Brooklyn | |||
| Investor Relations – Tesla | Communications – Tesla | |||
| ir@tesla.com | press@tesla.com |
Tesla Motors, Inc.
Condensed Consolidated Statements of Operations
(Unaudited)
(In thousands, except per share data)
| Three Months Ended | ||||||||||||
| Mar 31, 2016 |
Dec 31, 2015 |
Mar 31, 2015 |
||||||||||
| Revenues |
||||||||||||
| Automotive (1A) |
$ | 1,026,064 | $ | 1,117,007 | $ | 893,320 | ||||||
| Services and other |
120,984 | 97,372 | 46,560 | |||||||||
|
|
|
|
|
|
|
|||||||
| Total revenues |
1,147,048 | 1,214,379 | 939,880 | |||||||||
|
|
|
|
|
|
|
|||||||
| Cost of revenues |
||||||||||||
| Automotive (1B) |
779,316 | 896,441 | 631,745 | |||||||||
| Services and other |
115,264 | 99,374 | 48,062 | |||||||||
|
|
|
|
|
|
|
|||||||
| Total cost of revenues (2) |
894,580 | 995,815 | 679,807 | |||||||||
|
|
|
|
|
|
|
|||||||
| Gross profit |
252,468 | 218,564 | 260,073 | |||||||||
| Operating expenses |
||||||||||||
| Research and development (2) |
182,482 | 190,243 | 167,154 | |||||||||
| Selling, general and administrative (2) |
318,210 | 288,654 | 195,365 | |||||||||
|
|
|
|
|
|
|
|||||||
| Total operating expenses |
500,692 | 478,897 | 362,519 | |||||||||
|
|
|
|
|
|
|
|||||||
| Loss from operations |
(248,224 | ) | (260,333 | ) | (102,446 | ) | ||||||
| Interest income |
1,251 | 750 | 184 | |||||||||
| Interest expense |
(40,625 | ) | (38,617 | ) | (26,574 | ) | ||||||
| Other income (expense), net |
9,177 | (17,149 | ) | (22,305 | ) | |||||||
|
|
|
|
|
|
|
|||||||
| Loss before income taxes |
(278,421 | ) | (315,349 | ) | (151,141 | ) | ||||||
| Provision for income taxes |
3,846 | 5,048 | 3,040 | |||||||||
|
|
|
|
|
|
|
|||||||
| Net loss |
$ | (282,267 | ) | $ | (320,397 | ) | $ | (154,181 | ) | |||
|
|
|
|
|
|
|
|||||||
| Net loss per common share, basic and diluted |
$ | (2.13 | ) | $ | (2.44 | ) | $ | (1.22 | ) | |||
|
|
|
|
|
|
|
|||||||
| Shares used in per share calculation, basic and diluted |
132,676 | 131,100 | 125,947 | |||||||||
|
|
|
|
|
|
|
|||||||
Notes:
| (1) | Due to the application of lease accounting for Model S and Model X vehicles with the resale value guarantee or similar buy-back terms, the following is supplemental information for the periods presented: |
| (A) Net increase in deferred revenue and other long-term liabilities as a result of lease accounting and therefore not recognized in automotive sales |
$ | 454,678 | $ | 532,646 | $ | 163,676 | ||||||
|
|
|
|
|
|
|
|||||||
| (B) Net increase in operating lease vehicles as a result of lease accounting and therefore not recognized in automotive cost of sales |
$ | 359,098 | $ | 401,385 | $ | 113,823 | ||||||
|
|
|
|
|
|
|
The table above excludes assumed net warranty and stock based compensation amounts included in non-GAAP cost of sales.
| (2) | Includes stock-based compensation expense of the following for the periods presented: |
| Cost of revenues |
$ | 6,403 | $ | 5,995 | $ | 4,601 | ||||||
| Research and development |
39,602 | 25,452 | 19,792 | |||||||||
| Selling, general and administrative |
43,652 | 24,158 | 18,633 | |||||||||
|
|
|
|
|
|
|
|||||||
| Total stock-based compensation expense |
$ | 89,657 | $ | 55,605 | $ | 43,026 | ||||||
|
|
|
|
|
|
|
|||||||
Classification of Revenues and Costs of Revenues
Our income statement reflects the classifications of revenues and costs of revenues to segregate our new vehicle business from our other business activities. “Automotive” revenue and related costs now reflect activities related to the sale or lease of new vehicles including regulatory credits, data connectivity, Autopilot functionality and Supercharging. “Services and other” revenues and related costs include activities such as powertrain sales, service revenue, Tesla Energy and pre-owned Tesla vehicle sales.
Tesla Motors, Inc.
Condensed Consolidated Balance Sheets
(Unaudited)
(In thousands)
| Mar 31, 2016 |
Dec 31, 2015 |
|||||||
| Assets |
||||||||
| Cash and cash equivalents |
$ | 1,441,789 | $ | 1,196,908 | ||||
| Restricted cash and marketable securities - current |
23,980 | 22,628 | ||||||
| Accounts receivable |
318,056 | 168,965 | ||||||
| Inventory |
1,301,961 | 1,277,838 | ||||||
| Prepaid expenses and other current assets |
153,757 | 115,667 | ||||||
| Operating lease vehicles, net (1) |
2,244,210 | 1,791,403 | ||||||
| Property and equipment, net |
3,593,014 | 3,403,334 | ||||||
| Restricted cash - noncurrent |
47,783 | 31,522 | ||||||
| Other assets |
67,152 | 59,674 | ||||||
|
|
|
|
|
|||||
| Total assets |
$ | 9,191,702 | $ | 8,067,939 | ||||
|
|
|
|
|
|||||
| Liabilities and Stockholders' Equity |
||||||||
| Accounts payable and accrued liabilities |
$ | 1,452,008 | $ | 1,338,945 | ||||
| Deferred revenue (2) |
1,206,040 | 1,006,896 | ||||||
| Customer deposits |
391,363 | 283,370 | ||||||
| Long-term debt and capital leases |
3,119,615 | 2,649,019 | ||||||
| Other long-term liabilities (3) |
2,009,686 | 1,658,720 | ||||||
|
|
|
|
|
|||||
| Total liabilities |
8,178,712 | 6,936,950 | ||||||
| Mezzanine equity (4) |
42,626 | 47,285 | ||||||
| Stockholders' equity |
970,364 | 1,083,704 | ||||||
|
|
|
|
|
|||||
| Total liabilities and stockholders' equity |
$ | 9,191,702 | $ | 8,067,939 | ||||
|
|
|
|
|
|||||
Notes:
| (1) | Includes the following increase in operating lease vehicles related to deliveries and subject to lease accounting, net of depreciation recognized in automotive cost of sales, for the following periods: |
| Resale value guarantee program (and other vehicles with similar buy-back terms) |
||||||||
| Beginning balance |
$ | 1,556,528 | $ | 689,689 | ||||
| First quarter |
352,782 | 103,022 | ||||||
| Second quarter |
170,025 | |||||||
| Third quarter |
215,337 | |||||||
| Fourth quarter |
378,455 | |||||||
|
|
|
|
|
|||||
| Ending balance |
$ | 1,909,310 | $ | 1,556,528 | ||||
|
|
|
|
|
|||||
| Model S and Model X leasing program |
||||||||
| Beginning balance |
$ | 234,619 | $ | 81,636 | ||||
| First quarter |
99,976 | 35,687 | ||||||
| Second quarter |
39,587 | |||||||
| Third quarter |
25,162 | |||||||
| Fourth quarter |
52,547 | |||||||
|
|
|
|
|
|||||
| Ending balance |
$ | 334,595 | $ | 234,619 | ||||
|
|
|
|
|
|||||
| (2) | Includes the following increase in deferred revenue related to deliveries with the resale value guarantee and similar programs and subject to lease accounting, net of revenue amortized to automotive sales, for the following periods: |
| Beginning balance |
$ | 679,131 | $ | 376,471 | ||||
| First quarter |
121,836 | 45,334 | ||||||
| Second quarter |
60,767 | |||||||
| Third quarter |
67,522 | |||||||
| Fourth quarter |
129,037 | |||||||
|
|
|
|
|
|||||
| Ending balance |
$ | 800,967 | $ | 679,131 | ||||
|
|
|
|
|
| (3) Includes the following increase in other liabilities related to deliveries with the resale value guarantee and similar programs and subject to lease accounting for the following periods: |
||||||||
| Beginning balance |
$ | 1,430,573 | $ | 487,879 | ||||
| First quarter |
344,926 | 118,341 | ||||||
| Second quarter |
186,957 | |||||||
| Third quarter |
245,133 | |||||||
| Fourth quarter |
392,263 | |||||||
|
|
|
|
|
|||||
| Ending balance |
$ | 1,775,499 | $ | 1,430,573 | ||||
|
|
|
|
|
|||||
| (4) | Our common stock price exceeded the conversion threshold price of our convertible senior notes due 2018 (2018 Notes) issued in May 2013; therefore, the 2018 Notes are convertible at the holder’s option during the second quarter of 2016. As such, the carrying value of the 2018 Notes was classified as a current liability as of March 31, 2016 and the difference between the principal amount and the carrying value of the 2018 Notes was reflected as convertible debt in mezzanine equity on our condensed consolidated balance sheet as of March 31, 2016. |
Tesla Motors, Inc.
Supplemental Consolidated Financial Information
(Unaudited)
(In thousands)
| Three Months Ended | ||||||||||||
| Mar 31, 2016 |
Dec 31, 2015 |
Mar 31, 2015 |
||||||||||
| Selected Cash Flow Information |
||||||||||||
| Cash flows provided by (used in) operating activities (1) |
$ | (249,605 | ) | $ | (29,849 | ) | $ | (131,794 | ) | |||
| Cash flows used in investing activities |
(233,819 | ) | (414,280 | ) | (432,344 | ) | ||||||
| Cash flows provided by financing activities |
715,435 | 225,038 | 186,156 | |||||||||
| Other Selected Financial Information |
||||||||||||
| Cash flows provided by (used in) operating activities (1) |
$ | (249,605 | ) | $ | (29,849 | ) | $ | (131,794 | ) | |||
| Change in collateralized lease borrowing |
$ | 241,763 | $ | 208,793 | $ | 77,961 | ||||||
|
|
|
|
|
|
|
|||||||
| Cash flow from core operations |
$ | (7,842 | ) | $ | 178,944 | $ | (53,833 | ) | ||||
|
|
|
|
|
|
|
|||||||
| Capital expenditures |
(216,859 | ) | (411,222 | ) | (426,060 | ) | ||||||
| Depreciation and amortization |
$ | 156,460 | $ | 143,723 | $ | 77,112 | ||||||
| Mar 31, 2016 |
Dec 31, 2015 |
Mar 31, 2015 |
||||||||||
| Cash and Investments |
||||||||||||
| Cash and cash equivalents |
$ | 1,441,789 | $ | 1,196,908 | $ | 1,510,076 | ||||||
| Restricted cash and marketable securities - current |
23,980 | 22,628 | 20,693 | |||||||||
| Restricted cash - noncurrent |
47,783 | 31,522 | 13,846 | |||||||||
Supplemental Model S and Model X Leasing Program Information
(in thousands, except for vehicle deliveries)
| Three Months Ended | ||||||||||||
| Mar 31, 2016 |
Dec 31, 2015 |
Mar 31, 2015 |
||||||||||
| Vehicles delivered |
1,405 | 881 | 592 | |||||||||
| Average per unit price of vehicles delivered |
$ | 106 | $ | 97 | $ | 107 | ||||||
|
|
|
|
|
|
|
|||||||
| Aggregate value of vehicles delivered (1) |
$ | 148,994 | $ | 85,328 | $ | 63,359 | ||||||
|
|
|
|
|
|
|
|||||||
| Leasing revenue recognized |
$ | 16,692 | $ | 13,704 | $ | 6,469 | ||||||
| (1) | Aggregate value is the product of multiplying vehicles delivered by the average per unit price of vehicles delivered |
Non-GAAP Financial Information
This letter includes non-GAAP financial information because we plan and manage our business using such information. Our non-GAAP measures align the recognition of revenues and costs related to a vehicle sale with the time when the customer takes delivery of the car and cash is received or owed to us. This contrasts with the approach of other automotive manufacturers who under GAAP accounting recognize revenue when the vehicle is sold into dealership inventory rather than to end customers, even though in the case of a captive finance lease they may not collect cash for several years on a consolidated basis.
Our non-GAAP revenue and gross profit is determined by adding back the deferred revenue and related costs for cars sold with resale value guarantee and where we have collected, or will collect from a bank intermediary in a matter of days, the purchase price of the car in cash. For cars leased directly by Tesla, we recognize lease revenue and related costs over the lease term and the same way for both GAAP and non-GAAP purposes. Our non-GAAP expense and per share information also exclude non-cash interest expense and stock-based compensation.
Tesla Motors, Inc.
Reconciliation of GAAP to Non-GAAP Financial Information
(Unaudited)
(In thousands, except per share data)
| Three Months Ended | ||||||||||||
| Mar 31, 2016 |
Dec 31, 2015 |
Mar 31, 2015 |
||||||||||
| Net loss (GAAP) |
$ | (282,267 | ) | $ | (320,397 | ) | $ | (154,181 | ) | |||
| Stock-based compensation expense |
89,657 | 55,605 | 43,026 | |||||||||
| Non-cash interest expense related to convertible notes and other borrowing |
28,902 | 26,716 | 19,510 | |||||||||
|
|
|
|
|
|
|
|||||||
| Net income (loss) (Non-GAAP) including lease accounting |
(163,708 | ) | (238,076 | ) | (91,645 | ) | ||||||
|
|
|
|
|
|
|
|||||||
| Model S and Model X gross profit deferred due to lease accounting (1)(2) |
88,458 | 124,190 | 46,396 | |||||||||
|
|
|
|
|
|
|
|||||||
| Net income (loss) (Non-GAAP) |
$ | (75,250 | ) | $ | (113,886 | ) | $ | (45,249 | ) | |||
|
|
|
|
|
|
|
|||||||
| Net loss per share, basic (GAAP) |
$ | (2.13 | ) | $ | (2.44 | ) | $ | (1.22 | ) | |||
| Stock-based compensation expense |
0.67 | 0.42 | 0.34 | |||||||||
| Non-cash interest expense related to convertible notes and other borrowing |
0.22 | 0.20 | 0.15 | |||||||||
| Model S and Model X gross profit deferred due to lease accounting (1)(2) |
0.67 | 0.95 | 0.37 | |||||||||
|
|
|
|
|
|
|
|||||||
| Net income (loss) per share, basic (Non-GAAP) |
$ | (0.57 | ) | $ | (0.87 | ) | $ | (0.36 | ) | |||
|
|
|
|
|
|
|
|||||||
| Shares used in per share calculation, basic (GAAP and Non-GAAP) |
132,676 | 131,100 | 125,497 | |||||||||
|
|
|
|
|
|
|
|||||||
| Net loss per share, diluted (GAAP) |
$ | (2.13 | ) | $ | (2.44 | ) | $ | (1.22 | ) | |||
| Stock-based compensation expense |
0.67 | 0.42 | 0.34 | |||||||||
| Non-cash interest expense related to convertible notes and other borrowing |
0.22 | 0.20 | 0.15 | |||||||||
|
|
|
|
|
|
|
|||||||
| Net income (loss) (Non-GAAP) including lease accounting |
(1.23 | ) | (1.82 | ) | (0.73 | ) | ||||||
|
|
|
|
|
|
|
|||||||
| Model S and Model X gross profit deferred due to lease accounting (1)(2) |
0.67 | 0.95 | 0.37 | |||||||||
|
|
|
|
|
|
|
|||||||
| Net income (loss) per share, diluted (Non-GAAP) |
$ | (0.57 | ) | $ | (0.87 | ) | $ | (0.36 | ) | |||
|
|
|
|
|
|
|
|||||||
| Shares used in per share calculation, diluted (Non-GAAP) |
132,676 | 131,100 | 125,947 | |||||||||
|
|
|
|
|
|
|
|||||||
| (1) | Includes deliveries of Model S and Model X with the resale value guarantee or similar buy-back terms and not deliveries under the Model S leasing program. |
| (2) | Under GAAP, warranty costs are expensed as incurred for Model S and Model X vehicle deliveries with the resale value guarantee or similar buy-back terms and subject to lease accounting. For Non-GAAP purposes, an estimated incremental warranty reserve of $12.6 million, $14.9 million and $6.8 million is included for the three months ended March 31, 2016 , December 31, 2015, and March 31, 2015, respectively. Additionally, stock-based compensation of $3.5 million, $4.3 million and $1.7 million is excluded for non-GAAP purposes for the three months ended March 31, 2016, December 31, 2015, and March 31, 2015, respectively. |
Tesla Motors, Inc.
Reconciliation of GAAP to Non-GAAP Financial Information
(Unaudited)
(In thousands, except per share data)
| Three Months Ended | ||||||||||||
| Mar 31, 2016 |
Dec 31, 2015 |
Mar 31, 2015 |
||||||||||
| Revenues (GAAP) |
$ | 1,147,048 | $ | 1,214,379 | $ | 939,880 | ||||||
| Model S and Model X revenue deferred due to lease accounting (1) |
454,678 | 532,646 | 163,676 | |||||||||
|
|
|
|
|
|
|
|||||||
| Revenues (Non-GAAP) |
$ | 1,601,727 | $ | 1,747,025 | $ | 1,103,556 | ||||||
|
|
|
|
|
|
|
|||||||
| Gross profit (GAAP) |
$ | 252,468 | $ | 218,563 | $ | 260,073 | ||||||
| Model S and Model X gross profit deferred due to lease accounting (1)(2) |
88,458 | 124,190 | 46,396 | |||||||||
| Stock-based compensation expense |
6,403 | 5,995 | 4,601 | |||||||||
|
|
|
|
|
|
|
|||||||
| Gross profit (Non-GAAP) |
$ | 347,329 | $ | 348,748 | $ | 311,070 | ||||||
|
|
|
|
|
|
|
|||||||
| Research and development expenses (GAAP) |
$ | 182,482 | $ | 190,243 | $ | 167,154 | ||||||
| Stock-based compensation expense |
(39,602 | ) | (25,452 | ) | (19,792 | ) | ||||||
|
|
|
|
|
|
|
|||||||
| Research and development expenses (Non-GAAP) |
$ | 142,880 | $ | 164,791 | $ | 147,362 | ||||||
|
|
|
|
|
|
|
|||||||
| Selling, general and administrative expenses (GAAP) |
$ | 318,210 | $ | 288,654 | $ | 195,365 | ||||||
| Stock-based compensation expense |
(43,652 | ) | (24,158 | ) | (18,633 | ) | ||||||
|
|
|
|
|
|
|
|||||||
| Selling, general and administrative expenses (Non-GAAP) |
$ | 274,558 | $ | 264,496 | $ | 176,732 | ||||||
|
|
|
|
|
|
|
|||||||
| (1) | Includes deliveries of Model S and Model X with the resale value guarantee or similar buy-back terms and not deliveries under the Model S leasing program. |
| (2) | Under GAAP, warranty costs are expensed as incurred for Model S and Model X vehicle deliveries with the resale value guarantee or similar buy-back terms and subject to lease accounting. For Non-GAAP purposes, an estimated incremental warranty reserve of $12.6 million, $14.9 million and $6.8 million is included for the three months ended March 31, 2016 , December 31, 2015, and March 31, 2015, respectively. Additionally, stock-based compensation of $3.5 million, $4.3 million and $1.7 million is excluded for non-GAAP purposes for the three months ended March 31, 2016, December 31, 2015, and March 31, 2015, respectively. |