Attached files
| file | filename |
|---|---|
| 8-K - 8-K - OneMain Holdings, Inc. | omh-20160331xearningsrelea.htm |
Exhibit 99.1
ONEMAIN HOLDINGS, INC. REPORTS FIRST QUARTER 2016 RESULTS
Evansville, IN, May 4, 2016 - OneMain Holdings, Inc. (NYSE: OMF) today reported GAAP basis net income of $153 million, or $1.13 per diluted share, for the first quarter of 2016. Net Income includes a $229 million pretax net gain on the previously announced sale of the company’s interests in SpringCastle.
After tax Core Earnings (a non-GAAP measure) for the first quarter of 2016 was $141 million, and after tax Core Earnings per Diluted Share (a non-GAAP measure) was $1.05. Weighted average diluted shares outstanding increased to 134.9 million for the first quarter of 2016 from 115.0 million for the prior year quarter as a result of the company’s issuance of 19.4 million common shares on May 4, 2015.
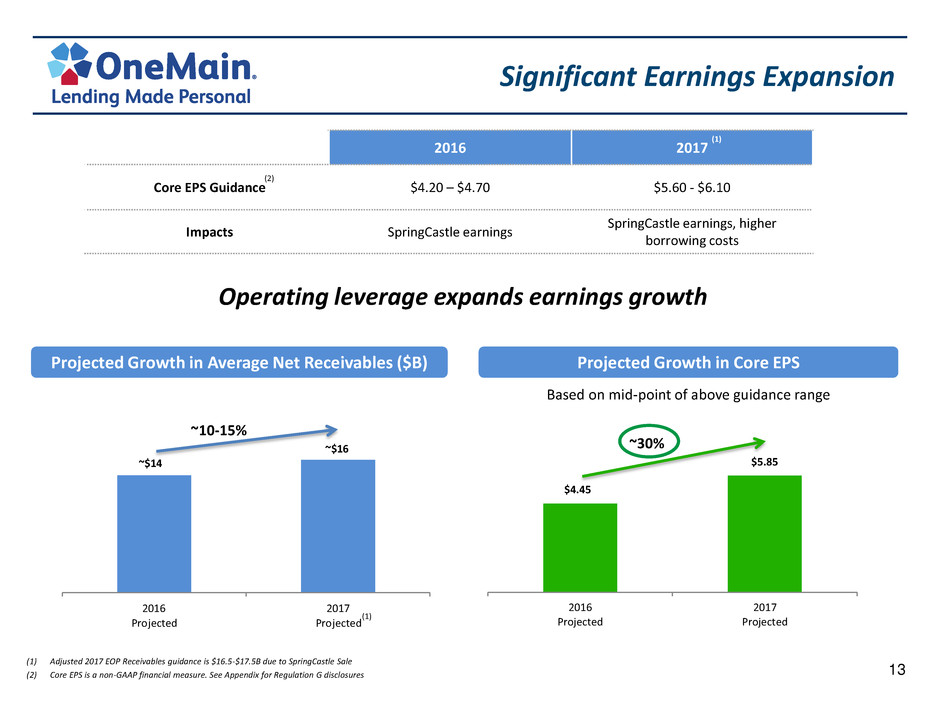
Jay Levine, President and CEO of OneMain Holdings, Inc. said, “This quarter represents the first full quarter since we completed the acquisition of OneMain, and we could not be more pleased with the results we have achieved thus far. The combination of Springleaf and OneMain has had an immediate, and very positive impact on our core earnings which, excluding SpringCastle, grew from $0.35 per share in last year’s first quarter to $0.94 in this year’s first quarter. We also made significant progress on driving incremental growth at the former OneMain, with higher levels of originations, particularly in the strategically key area of secured lending. Integration activities are on schedule, resulting in greater operational efficiencies, even as we continue to provide our customary high level of personalized service.”
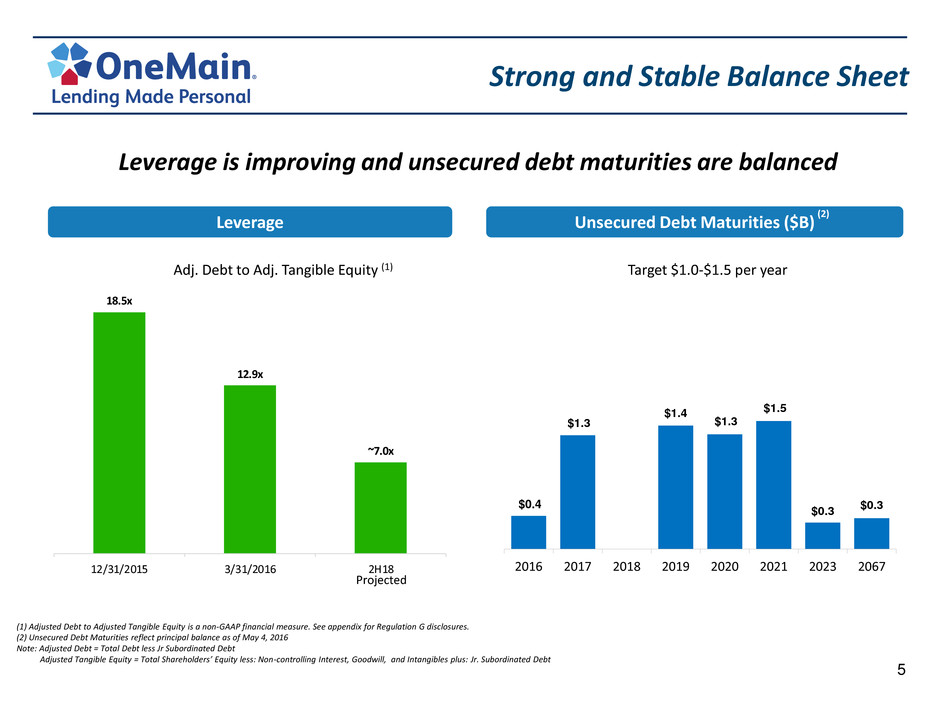
Levine added, “We also made material progress on strengthening our capital base, enhancing our liquidity and extending our debt maturities, all of which simplify our financial picture and help position us for sustained earnings growth and strong returns.”
Core Consumer Operations: (Reported on a Segment Accounting Basis, which is a non-GAAP measure. Refer to the reconciliation of non-GAAP to comparable GAAP measures on page 10. Includes the results of OneMain Financial beginning November 1, 2015).
Consolidated Pretax Core Earnings (non-GAAP) was $227 million for the first quarter of 2016. The Consumer and Insurance segment contributed $203 million to Pretax Core Earnings for the first quarter. The Acquisitions and Servicing segment contributed $24 million to Pretax Core Earnings for the first quarter. Pretax Core Earnings excludes $28 million of acquisition-related transaction and integration expenses reported in the Consumer and Insurance segment. Also excluded are the net gain and transaction costs related to the sale of the company’s interests in SpringCastle announced on March 31, 2016, loss on net repurchase and repayment of debt, and non-controlling interests.
1
Consumer and Insurance Segment1,2 (includes the results of OneMain Financial beginning November 1, 2015).
Consumer and Insurance pretax operating income was $167 million for the first quarter of 2016.
Consumer net finance receivables reached $13.6 billion at March 31, 2016, and consumer net finance receivables per branch totaled $6.9 million at March 31, 2016.
Net interest income was $674 million in the first quarter of 2016. Yield was 25.2% and risk adjusted yield was 17.7% in the first quarter of 2016.
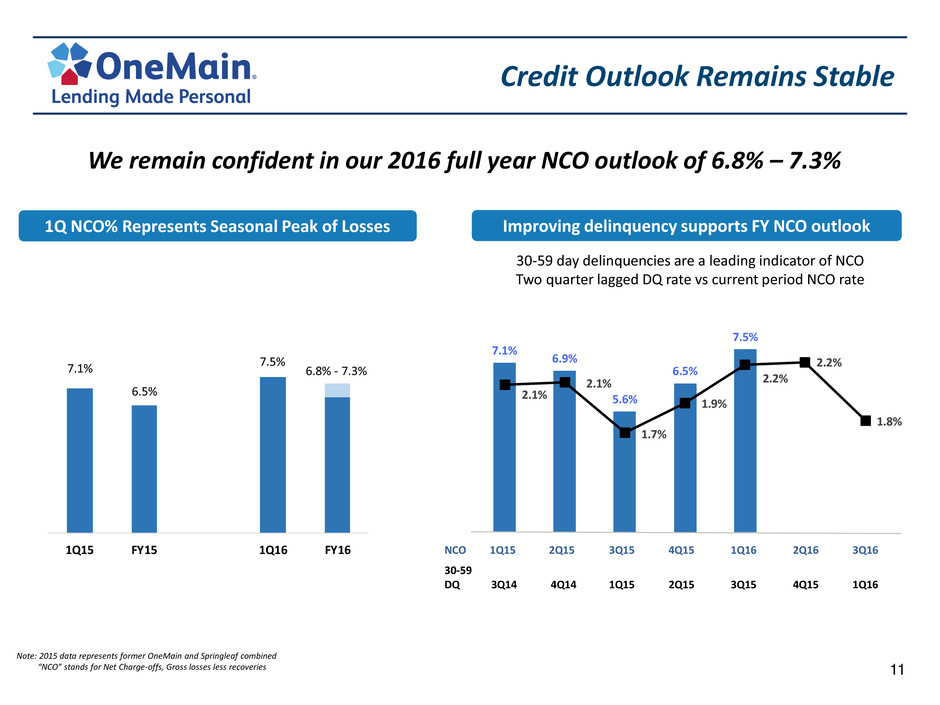
The annualized net charge-off ratio was 7.5% in the first quarter of 2016.
The annualized gross charge-off ratio was 8.1% and the recovery ratio was 62 basis points in the first quarter of 2016.
The 60+ delinquency ratio was 2.8% at March 31, 2016.
Acquisitions and Servicing Segment
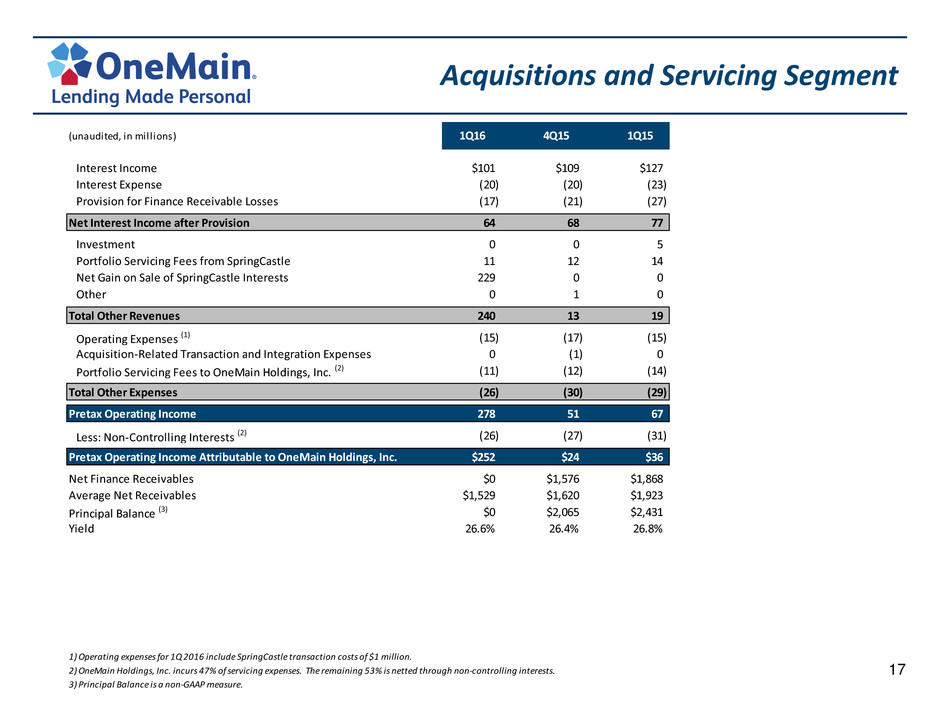
The Acquisitions and Servicing segment contributed $24 million to the company’s Pretax Core Earnings in the first quarter of 2016. The entire Acquisitions and Servicing segment, which included non-controlling interests, generated pretax operating income of $278 million in the first quarter of 2016, with net interest income of $81 million and a yield of 26.6%. Net finance receivables at March 31, 2016 were zero as a result of the sale of the company’s interests in SpringCastle.
The annualized net charge-off ratio was 4.7% in the first quarter of 2016, versus 5.4% in the prior year quarter and 4.6% in the prior quarter.
The annualized gross charge-off ratio was 5.4% in the quarter, down 70 basis points from the prior year quarter and up 5 basis points from the fourth quarter 2015. Recoveries were 71 basis points in the quarter versus 63 basis points in the prior year quarter.
Non-Core Portfolio: (Reported on a Segment Accounting Basis, which is a non-GAAP measure).
Legacy Real Estate and Other Non-Core
The Real Estate segment generated a pretax operating loss of $18 million in the first quarter of 2016. The loss resulted primarily from the reduction in interest earning assets attributable to real estate sales completed in 2014. Upon closing of the acquisition of OneMain, the majority of the debt allocated to the Real Estate segment and other non-core activities was re-allocated to the Consumer and Insurance
1 Consumer and Insurance segment reflects Segment Accounting Basis (which is a basis of accounting other than U.S. GAAP).
2 Includes both held for investment and held for sale finance receivables.
2
segment. The real estate loan portfolio was $712 million at March 31, 2016, down from $840 million at the prior year quarter-end.3
Our other non-core activities generated a pretax operating loss of $4 million in the first quarter of 2016.
Liquidity and Capital Resources
As of March 31, 2016, the company had $716 million of cash and cash equivalents, which included $450 million of available cash and highly liquid investment securities. The company had total outstanding debt of $14.9 billion at March 31, 2016, in a variety of debt instruments. As previously disclosed, the company completed the sale of 127 Springleaf Financial branches and certain related assets for proceeds of $624 million on May 2, 2016. In addition, on April 11, 2016, the company’s subsidiary, Springleaf Finance Corporation (“SFC”), issued $1 billion of 8.25% senior notes due 2020 and used approximately $600M to repurchase certain of SFC’s outstanding notes, primarily consisting of its 6.90% senior notes due December 2017.
Use of Non-GAAP Financial Measures
We report the operating results of our Core Consumer Operations (consisting of the results of our Consumer and Insurance and our Acquisitions and Servicing segments), Non-Core Portfolio (consisting of our Real Estate segment), and our other non-core activities using the Segment Accounting Basis, which differs from the “historical accounting basis” disclosed in our SEC filings prior to the company’s Annual Report on Form 10-K for the year ended December 31, 2015 filed with the SEC on February 29, 2016 (“2015 Form 10-K”), which (i) reflects our allocation methodologies for certain costs, primarily interest expense, loan loss reserves and acquisition costs to reflect the manner in which we assess our business results and (ii) excludes the impact of applying purchase accounting. These allocations and adjustments have a material effect on our reported segment basis income as compared to GAAP. We believe the Segment Accounting Basis (a basis other than U.S. GAAP) provides investors the basis for which management evaluates segment performance. For more information, please see Note 23 - Segment Information of the notes to our consolidated financial statements included in our 2015 Form 10-K.
Pretax Core Earnings, Core Earnings (which equals Pretax Core Earnings adjusted for estimated taxes), and Core Earnings per Diluted Share are key performance measures used by management in evaluating the performance of our business. Pretax Core Earnings represents our income before provision for income taxes on a Segment Accounting Basis and excludes results of operations from our Non-Core Portfolio (Real Estate segment) and other non-core, non-originating legacy operations, net gain on sale of SpringCastle interests related to Core Consumer Operations, acquisition-related transaction and integration expenses, losses resulting from accelerated long-term repayment and repurchases of long-term debt related to Core Consumer Operations, SpringCastle transaction costs, and results of operations attributable to non-controlling interests. Pretax Core Earnings, Core Earnings, and Core Earnings per Diluted Share assist us in comparing our business performance on a consistent basis. Management
3 Includes both held for investment and held for sale finance receivables.
3
believes these non-GAAP financial measures are useful in assessing the profitability of our core business operations and our management uses these non-GAAP financial measures in evaluating our operating performance. These non-GAAP financial measures should be considered supplemental to, but not as a substitute for or superior to, operating income, segment profit or loss, net income, or other measures of financial performance prepared in accordance with U.S. GAAP.
Conference Call & Webcast Information
OneMain management will host a conference call and webcast to discuss our first quarter 2016 results and other general matters at 10:00 am Eastern on Wednesday, May 4, 2016. Both the call and webcast are open to the general public. The general public is invited to listen to the call by dialing 877-330-3668 (U.S. domestic), or 678-304-6859 (international), conference ID 95831772, or via a live audio webcast through the Investor Relations section of the website. For those unable to listen to the live broadcast, a replay will be available on our website or by dialing 800-585-8367 (U.S. domestic), or 404-537-3406, conference ID 95831772, beginning approximately two hours after the event. The replay of the conference call will be available through May 18, 2016. An investor presentation will be available on the Investor Relations page of OneMain’s website at www.springleaf.com prior to the start of the conference call.
Cautionary Note Regarding Forward-Looking Statements
This document contains “forward‐looking statements” within the meaning of the Private Securities Litigation Reform Act of 1995. Forward-looking statements are not statements of historical fact but instead represent only management’s current beliefs regarding future events. By their nature, forward-looking statements involve inherent risks, uncertainties and other important factors that may cause actual results, performance or achievements to differ materially from those expressed in or implied by such forward‐looking statements. We caution you not to place undue reliance on these forward‐looking statements that speak only as of the date they were made. We do not undertake any obligation to publicly release any revisions to these forward‐looking statements to reflect events or circumstances after the date of this document or to reflect the occurrence of unanticipated events or the non-occurrence of anticipated events.
Forward‐looking statements include, without limitation, statements concerning future plans, objectives, goals, projections, strategies, events or performance, and underlying assumptions and other statements related thereto. Statements preceded by, followed by or that otherwise include the words “anticipates,” “appears,” “are likely,” “believes,” “estimates,” “expects,” “foresees,” “intends,” “plans,” “projects” and similar expressions or future or conditional verbs such as “would,” “should,” “could,” “may,” or “will,” are intended to identify forward‐looking statements. Important factors that could cause actual results, performance or achievements to differ materially from those expressed in or implied by forward-looking statements include, without limitation, the following: the inability to obtain, or delays in obtaining, cost savings and synergies from the OneMain Acquisition and risks and other uncertainties associated with
4
the integration of the companies; unanticipated expenditures relating to the OneMain Acquisition; any litigation, fines or penalties that could arise relating to the OneMain Acquisition; the impact of the OneMain Acquisition on each company’s relationships with employees and third parties; various risks relating to the sale of branches to Lendmark Financial Services, LLC (the “Lendmark Sale”) in connection with the previously disclosed settlement with the U.S. Department of Justice; changes in general economic conditions, including the interest rate environment in which we conduct business and the financial markets through which we can access capital and also invest cash flows from our Consumer and Insurance segment; levels of unemployment and personal bankruptcies; natural or accidental events such as earthquakes, hurricanes, tornadoes, fires, or floods affecting our customers, collateral, or branches or other operating facilities; war, acts of terrorism, riots, civil disruption, pandemics, cyber security breaches, or other events disrupting business or commerce; changes in the rate at which we can collect or potentially sell our finance receivables portfolio; the effectiveness of our credit risk scoring models in assessing the risk of customer unwillingness or lack of capacity to repay; changes in our ability to attract and retain employees or key executives to support our businesses; changes in the competitive environment in which we operate, including the demand for our products, customer responsiveness to our distribution channels, and the strength and ability of our competitors to operate independently or to enter into business combinations that result in a more attractive range of customer products or provide greater financial resources; shifts in collateral values, delinquencies, or credit losses; changes in federal, state or local laws, regulations, or regulatory policies and practices, including the Dodd-Frank Wall Street Reform and Consumer Protection Act (which, among other things, established the Consumer Financial Protection Bureau, which has broad authority to regulate and examine financial institutions, including us), that affect our ability to conduct business or the manner in which we conduct business, such as licensing requirements, pricing limitations or restrictions on the method of offering products, as well as changes that may result from increased regulatory scrutiny of the sub-prime lending industry; potential liability relating to real estate and personal loans which we have sold or may sell in the future, or relating to securitized loans, if it is determined that there was a non-curable breach of a representation or warranty made in connection with such transactions; the costs and effects of any actual or alleged violations of any federal, state or local laws, rules or regulations, including any litigation associated therewith, any impact to our business operations, reputation, financial position, results of operations or cash flows arising therefrom, any impact to our relationships with lenders, investors or other third parties attributable thereto, and the costs and effects of any breach of any representation, warranty or covenant under any of our contractual arrangements, including indentures or other financing arrangements or contracts, as a result of any such violation; the costs and effects of any fines, penalties, judgments, decrees, orders, inquiries, investigations, subpoenas, or enforcement or other proceedings of any governmental or quasi-governmental agency or authority and any litigation associated therewith; our continued ability to access the capital markets or the sufficiency of our current sources of funds to satisfy our cash flow requirements; our ability to comply with our debt covenants; our ability to generate sufficient cash to service all of our indebtedness; the effects of any downgrade of our debt ratings by
5
credit rating agencies, which could have a negative impact on our cost of and/or access to capital; our substantial indebtedness, which could prevent us from meeting our obligations under our debt instruments and limit our ability to react to changes in the economy or our industry, or our ability to incur additional borrowings; the impacts of our securitizations and borrowings; our ability to maintain sufficient capital levels in our regulated and unregulated subsidiaries; changes in accounting standards or tax policies and practices and the application of such new policies and practices to the manner in which we conduct business; any failure or inability to achieve the SpringCastle Portfolio performance requirements set forth in the SpringCastle Interests Sale purchase agreement; and the effect of future sales of our remaining portfolio of real estate loans and the transfer of servicing of these loans; and other risks and uncertainties described in the “Risk Factors” and “Management’s Discussion and Analysis” sections of the Company’s most recent Form 10‐K and Form 10-Qs filed with the SEC and in the Company’s other filings with the SEC from time to time. The foregoing list of factors that could cause actual results, performance or achievements to differ materially from those expressed in or implied by forward-looking statements does not purport to be complete and new factors, risks and uncertainties may arise in the future that are impossible for us to currently predict.
6
CONDENSED CONSOLIDATED STATEMENTS OF OPERATIONS (UNAUDITED)
(dollars in millions except earnings per share) | Three Months Ended March 31, | |||||||
2016 | 2015 | |||||||
Interest income: | ||||||||
Finance charges | $ | 779 | $ | 402 | ||||
Finance receivables held for sale originated as held for investment | 47 | 4 | ||||||
Total interest income | 826 | 406 | ||||||
Interest expense | 226 | 158 | ||||||
Net interest income | 600 | 248 | ||||||
Provision for finance receivable losses | 227 | 87 | ||||||
Net interest income after provision for finance receivable losses | 373 | 161 | ||||||
Other revenues: | ||||||||
Insurance | 114 | 36 | ||||||
Investment | 20 | 17 | ||||||
Net gain on sale of SpringCastle interests | 229 | — | ||||||
Other | (2 | ) | (2 | ) | ||||
Total other revenues | 361 | 51 | ||||||
Other expenses: | ||||||||
Operating expenses: | ||||||||
Salaries and benefits | 214 | 93 | ||||||
Acquisition-related transaction and integration expenses | 33 | 3 | ||||||
Other operating expenses | 167 | 62 | ||||||
Insurance policy benefits and claims | 45 | 16 | ||||||
Total other expenses | 459 | 174 | ||||||
Income before provision for income taxes | 275 | 38 | ||||||
Provision for income taxes | 96 | 7 | ||||||
Net income | 179 | 31 | ||||||
Net income attributable to non-controlling interests | 26 | 31 | ||||||
Net income attributable to OneMain Holdings, Inc. | $ | 153 | $ | — | ||||
Share Data: | ||||||||
Weighted average number of shares outstanding: | ||||||||
Basic | 134,694,759 | 115,027,470 | ||||||
Diluted | 134,907,748 | 115,027,470 | ||||||
Earnings per share: | ||||||||
Basic | $ | 1.14 | $ | — | ||||
Diluted | $ | 1.13 | $ | — | ||||
7
CONDENSED CONSOLIDATED BALANCE SHEETS (UNAUDITED)
(dollars in millions) | March 31, 2016 | December 31, 2015 | ||||||
Assets | ||||||||
Cash and cash equivalents | $ | 716 | $ | 939 | ||||
Investment securities | 1,872 | 1,867 | ||||||
Net finance receivables: | ||||||||
Personal loans | 13,209 | 13,267 | ||||||
SpringCastle Portfolio | — | 1,576 | ||||||
Real estate loans | 503 | 524 | ||||||
Retail sales finance | 19 | 23 | ||||||
Net finance receivables | 13,731 | 15,390 | ||||||
Unearned insurance premium and claim reserves | (643 | ) | (662 | ) | ||||
Allowance for finance receivable losses | (600 | ) | (587 | ) | ||||
Net finance receivables, less unearned insurance premium and claim reserves and allowance for finance receivable losses | 12,488 | 14,141 | ||||||
Finance receivables held for sale | 776 | 796 | ||||||
Restricted cash and cash equivalents | 588 | 676 | ||||||
Goodwill | 1,422 | 1,440 | ||||||
Other intangible assets | 539 | 559 | ||||||
Other assets | 654 | 638 | ||||||
Total assets | $ | 19,055 | $ | 21,056 | ||||
Liabilities and Shareholders’ Equity | ||||||||
Long-term debt | $ | 14,870 | $ | 17,300 | ||||
Insurance claims and policyholder liabilities | 747 | 747 | ||||||
Deferred and accrued taxes | 53 | 20 | ||||||
Other liabilities | 457 | 384 | ||||||
Total liabilities | 16,127 | 18,451 | ||||||
Shareholders’ equity: | ||||||||
Common stock | 1 | 1 | ||||||
Additional paid-in capital | 1,537 | 1,533 | ||||||
Accumulated other comprehensive loss | (13 | ) | (33 | ) | ||||
Retained earnings | 1,403 | 1,250 | ||||||
OneMain Holdings, Inc. shareholders’ equity | 2,928 | 2,751 | ||||||
Non-controlling interests | — | (146 | ) | |||||
Total shareholders’ equity | 2,928 | 2,605 | ||||||
Total liabilities and shareholders’ equity | $ | 19,055 | $ | 21,056 | ||||
8
CORE KEY METRICS
(dollars in millions) | At or for the Three Months Ended March 31, | |||||||
2016 | 2015 | |||||||
Consumer and Insurance | ||||||||
Finance receivables held for investment: | ||||||||
Net finance receivables | $ | 12,984 | $ | 3,895 | ||||
Number of accounts | 2,175,628 | 909,004 | ||||||
TDR finance receivables | $ | 474 | $ | 26 | ||||
Allowance for finance receivable losses - TDR | $ | 210 | $ | 3 | ||||
Finance receivables held for sale: | ||||||||
Net finance receivables | $ | 606 | $ | — | ||||
Number of accounts | 143,254 | — | ||||||
Finance receivables held for investment and held for sale: | ||||||||
Average net receivables | $ | 13,545 | $ | 3,831 | ||||
Yield | 25.15 | % | 26.88 | % | ||||
Gross charge-off ratio | 8.12 | % | 6.43 | % | ||||
Recovery ratio | (0.62 | )% | (0.79 | )% | ||||
Charge-off ratio | 7.50 | % | 5.64 | % | ||||
Delinquency ratio | 2.82 | % | 2.53 | % | ||||
Origination volume | $ | 2,343 | $ | 868 | ||||
Number of accounts originated | 328,057 | 157,403 | ||||||
Acquisitions and Servicing | ||||||||
Finance receivables held for investment: | ||||||||
Net finance receivables | $ | — | $ | 1,868 | ||||
Number of accounts | — | 264,830 | ||||||
Average net receivables | 1,529 | 1,923 | ||||||
Yield | 26.58 | % | 26.78 | % | ||||
Net charge-off ratio | 4.65 | % | 5.43 | % | ||||
Delinquency ratio | — | % | 4.22 | % | ||||
9
RECONCILIATIONS OF NON-GAAP FINANCIAL MEASURES
(dollars in millions, except per share data) | Three Months Ended March 31, | |||||||
2016 | 2015 | |||||||
Income before provision for income taxes - GAAP basis | $ | 275 | $ | 38 | ||||
Adjustments: | ||||||||
Interest income | 140 | (3 | ) | |||||
Interest expense | 18 | 30 | ||||||
Provision for finance receivable losses | (24 | ) | 2 | |||||
Repurchases and repayments of long-term debt | (5 | ) | — | |||||
Amortization of other intangible assets | 17 | 1 | ||||||
Other | 2 | 3 | ||||||
Income before provision for income taxes - Segment Accounting Basis | 423 | 71 | ||||||
Adjustments: | ||||||||
Pretax operating loss - Non-Core Portfolio Operations | 18 | 48 | ||||||
Pretax operating loss - Other non-core/non-originating legacy operations | 4 | 13 | ||||||
Net gain on sale of SpringCastle interests | (229 | ) | — | |||||
Acquisition-related transaction and integration expenses - Core Consumer Operations | 28 | — | ||||||
Net loss from accelerated repayment/repurchase of debt - Core Consumer Operations | 8 | — | ||||||
SpringCastle transaction costs | 1 | — | ||||||
Operating income attributable to non-controlling interests | (26 | ) | (31 | ) | ||||
Pretax core earnings (non-GAAP) | 227 | 101 | ||||||
Provision for income taxes | (86 | ) | (37 | ) | ||||
Core earnings | $ | 141 | $ | 64 | ||||
Weighted average number of shares outstanding - diluted | 134.9 | 115.0 | ||||||
Core earnings per share - diluted | $ | 1.05 | $ | 0.55 | ||||
OneMain Holdings, Inc.
Contact:
Craig Streem, 812-468-5752 Rohit Dewan, 812-492-2582
craig.streem@springleaf.com rohit.dewan@springleaf.com
Source: OneMain Holdings, Inc.
10