Attached files
| file | filename |
|---|---|
| EX-32.2 - EX-32.2 - NOW Inc. | dnow-ex322_8.htm |
| EX-31.2 - EX-31.2 - NOW Inc. | dnow-ex312_9.htm |
| EX-31.1 - EX-31.1 - NOW Inc. | dnow-ex311_7.htm |
| EX-32.1 - EX-32.1 - NOW Inc. | dnow-ex321_6.htm |
.
UNITED STATES
SECURITIES AND EXCHANGE COMMISSION
Washington, D.C. 20549
FORM 10-Q
(Mark one)
|
x |
QUARTERLY REPORT PURSUANT TO SECTION 13 OR 15(d) OF THE SECURITIES EXCHANGE ACT OF 1934 |
FOR THE QUARTERLY PERIOD ENDED MARCH 31, 2016
OR
|
o |
TRANSITION REPORT PURSUANT TO SECTION 13 OR 15(d) OF THE SECURITIES EXCHANGE ACT OF 1934 |
Commission File Number 001-36325
NOW INC.
(Exact name of registrant as specified in its charter)
|
Delaware |
|
46-4191184 |
|
(State or other jurisdiction of |
|
(I.R.S. Employer |
|
incorporation or organization) |
|
Identification No.) |
7402 North Eldridge Parkway,
Houston, Texas 77041
(Address of principal executive offices)
(281) 823-4700
(Registrant’s telephone number, including area code)
Indicate by check mark whether the registrant (1) has filed all reports required to be filed by Section 13 or 15(d) of the Securities Exchange Act of 1934 during the preceding 12 months (or for such shorter period that the registrant was required to file such reports), and (2) has been subject to such filing requirements for the past 90 days. Yes x No o
Indicate by check mark whether the registrant has submitted electronically and posted on its corporate Web site, if any, every Interactive Data File required to be submitted and posted pursuant to Rule 405 of Regulation S-T (§232.405 of this chapter) during the preceding 12 months (or for such shorter period that the registrant was required to submit and post such files). Yes x No o
Indicate by check mark whether the registrant is a large accelerated filer, an accelerated filer, a non-accelerated filer, or a smaller reporting company. See the definitions of “large accelerated filer,” “accelerated filer” and “smaller reporting company” in Rule 12b-2 of the Exchange Act. (Check one):
|
Large accelerated filer |
x |
|
Accelerated filer |
o |
|
|
|
|
|
|
|
Non-accelerated filer |
o |
(Do not check if a smaller reporting company) |
Smaller reporting company |
o |
Indicate by check mark whether the registrant is a shell company (as defined in Rule 12b-2 of the Exchange Act). Yes o No x
As of April 27, 2016 the registrant had 107,426,047 shares of common stock (excluding 2,062,817 unvested restricted shares), par value $0.01 per share, outstanding.
TABLE OF CONTENTS
2
NOW INC.
(In millions, except share data)
|
|
|
March 31, 2016 |
|
|
December 31, 2015 |
|
||
|
|
|
(Unaudited) |
|
|
|
|
|
|
|
ASSETS |
|
|
|
|
|
|||
|
Current assets: |
|
|
|
|
|
|
|
|
|
Cash and cash equivalents |
|
$ |
131 |
|
|
$ |
90 |
|
|
Receivables, net |
|
|
413 |
|
|
|
485 |
|
|
Inventories, net |
|
|
633 |
|
|
|
693 |
|
|
Prepaid and other current assets |
|
|
24 |
|
|
|
24 |
|
|
Total current assets |
|
|
1,201 |
|
|
|
1,292 |
|
|
Property, plant and equipment, net |
|
|
159 |
|
|
|
165 |
|
|
Deferred income taxes |
|
|
5 |
|
|
|
4 |
|
|
Goodwill |
|
|
210 |
|
|
|
205 |
|
|
Intangibles, net |
|
|
156 |
|
|
|
161 |
|
|
Other assets |
|
|
7 |
|
|
|
5 |
|
|
Total assets |
|
$ |
1,738 |
|
|
$ |
1,832 |
|
|
LIABILITIES AND STOCKHOLDERS' EQUITY |
|
|
|
|
|
|||
|
Current liabilities: |
|
|
|
|
|
|
|
|
|
Accounts payable |
|
$ |
208 |
|
|
$ |
211 |
|
|
Accrued liabilities |
|
|
94 |
|
|
|
94 |
|
|
Other current liabilities |
|
|
— |
|
|
|
2 |
|
|
Total current liabilities |
|
|
302 |
|
|
|
307 |
|
|
Long-term debt |
|
|
55 |
|
|
|
108 |
|
|
Deferred income taxes |
|
|
10 |
|
|
|
11 |
|
|
Other long-term liabilities |
|
|
3 |
|
|
|
3 |
|
|
Total liabilities |
|
|
370 |
|
|
|
429 |
|
|
Commitments and contingencies |
|
|
|
|
|
|
|
|
|
Stockholders' equity: |
|
|
|
|
|
|
|
|
|
Preferred stock—par value $0.01; 20 million shares authorized; no shares issued and outstanding |
|
|
— |
|
|
|
— |
|
|
Common stock - par value $0.01; 330 million shares authorized; 107,426,047 and 107,219,138 shares issued and outstanding at March 31, 2016 and December 31, 2015, respectively |
|
|
1 |
|
|
|
1 |
|
|
Additional paid-in capital |
|
|
1,985 |
|
|
|
1,980 |
|
|
Accumulated deficit |
|
|
(507 |
) |
|
|
(444 |
) |
|
Accumulated other comprehensive loss |
|
|
(111 |
) |
|
|
(134 |
) |
|
Total stockholders' equity |
|
|
1,368 |
|
|
|
1,403 |
|
|
Total liabilities and stockholders' equity |
|
$ |
1,738 |
|
|
$ |
1,832 |
|
See notes to unaudited consolidated financial statements.
3
NOW INC.
CONSOLIDATED STATEMENTS OF OPERATIONS (UNAUDITED)
(In millions, except per share data)
|
|
|
Three Months Ended March 31, |
|
|||||
|
|
|
2016 |
|
|
2015 |
|
||
|
Revenue |
|
$ |
548 |
|
|
$ |
863 |
|
|
Operating expenses: |
|
|
|
|
|
|
|
|
|
Cost of products |
|
|
461 |
|
|
|
708 |
|
|
Warehousing, selling and administrative |
|
|
152 |
|
|
|
163 |
|
|
Operating loss |
|
|
(65 |
) |
|
|
(8 |
) |
|
Other expense |
|
|
(2 |
) |
|
|
(4 |
) |
|
Loss before income taxes |
|
|
(67 |
) |
|
|
(12 |
) |
|
Income tax benefit |
|
|
(4 |
) |
|
|
(2 |
) |
|
Net loss |
|
$ |
(63 |
) |
|
$ |
(10 |
) |
|
Loss per share: |
|
|
|
|
|
|
|
|
|
Basic loss per common share |
|
$ |
(0.59 |
) |
|
$ |
(0.09 |
) |
|
Diluted loss per common share |
|
$ |
(0.59 |
) |
|
$ |
(0.09 |
) |
|
Weighted-average common shares outstanding, basic |
|
|
107 |
|
|
|
107 |
|
|
Weighted-average common shares outstanding, diluted |
|
|
107 |
|
|
|
107 |
|
See notes to unaudited consolidated financial statements.
4
NOW INC.
CONSOLIDATED STATEMENTS OF COMPREHENSIVE LOSS (UNAUDITED)
(In millions)
|
|
Three Months Ended March 31, |
|
|||||
|
|
2016 |
|
|
2015 |
|
||
|
Net loss |
$ |
(63 |
) |
|
$ |
(10 |
) |
|
Other comprehensive income (loss): |
|
|
|
|
|
|
|
|
Foreign currency translation adjustments |
|
23 |
|
|
|
(39 |
) |
|
Comprehensive loss |
$ |
(40 |
) |
|
$ |
(49 |
) |
See notes to unaudited consolidated financial statements.
5
NOW INC.
CONSOLIDATED STATEMENTS OF CASH FLOWS (UNAUDITED)
(In millions)
|
|
Three Months Ended March 31, |
|
|||||
|
|
2016 |
|
|
2015 |
|
||
|
Cash flows from operating activities: |
|
|
|
|
|
|
|
|
Net loss |
$ |
(63 |
) |
|
$ |
(10 |
) |
|
Adjustments to reconcile net loss to net cash provided by (used in) operating activities: |
|
|
|
|
|
|
|
|
Depreciation and amortization |
|
12 |
|
|
|
7 |
|
|
Deferred income taxes |
|
(2 |
) |
|
|
(4 |
) |
|
Stock-based compensation |
|
6 |
|
|
|
7 |
|
|
Provision for doubtful accounts |
|
7 |
|
|
|
5 |
|
|
Provision for inventory |
|
13 |
|
|
|
3 |
|
|
Other, net |
|
— |
|
|
|
(1 |
) |
|
Change in operating assets and liabilities, net of acquisitions: |
|
|
|
|
|
|
|
|
Receivables |
|
72 |
|
|
|
99 |
|
|
Inventories |
|
55 |
|
|
|
15 |
|
|
Prepaid and other current assets |
|
1 |
|
|
|
11 |
|
|
Accounts payable and accrued liabilities |
|
(7 |
) |
|
|
(139 |
) |
|
Income taxes receivable, net |
|
(3 |
) |
|
|
(7 |
) |
|
Other assets / liabilities, net |
|
(2 |
) |
|
|
1 |
|
|
Net cash provided by (used in) operating activities |
|
89 |
|
|
|
(13 |
) |
|
Cash flows from investing activities: |
|
|
|
|
|
|
|
|
Purchases of property, plant and equipment |
|
(1 |
) |
|
|
(3 |
) |
|
Business acquisitions, net of cash acquired |
|
— |
|
|
|
(183 |
) |
|
Other, net |
|
1 |
|
|
|
— |
|
|
Net cash provided by (used in) investing activities |
|
— |
|
|
|
(186 |
) |
|
Cash flows from financing activities: |
|
|
|
|
|
|
|
|
Borrowing under the revolving credit facility |
|
10 |
|
|
|
170 |
|
|
Repayments under the revolving credit facility |
|
(63 |
) |
|
|
(35 |
) |
|
Other |
|
(4 |
) |
|
|
(2 |
) |
|
Net cash provided by (used in) financing activities |
|
(57 |
) |
|
|
133 |
|
|
Effect of exchange rates on cash and cash equivalents |
|
9 |
|
|
|
(7 |
) |
|
Net change in cash and cash equivalents |
|
41 |
|
|
|
(73 |
) |
|
Cash and cash equivalents, beginning of period |
|
90 |
|
|
|
195 |
|
|
Cash and cash equivalents, end of period |
$ |
131 |
|
|
$ |
122 |
|
|
|
|
|
|
|
|
|
|
See notes to unaudited consolidated financial statements.
6
Notes to Unaudited Consolidated Financial Statements
1. Organization and Basis of Presentation
Nature of Operations
NOW Inc. (“NOW” or the “Company”) is a holding company headquartered in Houston, Texas that was incorporated in Delaware on November 22, 2013. NOW operates primarily under the DistributionNOW and Wilson Export brands. NOW is a global distributor of energy products as well as products for industrial applications through its locations in the U.S., Canada and internationally which are geographically positioned to serve the energy and industrial markets in over 90 countries. NOW’s energy product offerings are used in the oil and gas industry including upstream drilling and completion, exploration and production, midstream infrastructure development and downstream petroleum refining – as well as in other industries, such as chemical processing, power generation and industrial manufacturing operations. The industrial distribution portion of NOW’s business targets a diverse range of manufacturing and facilities across numerous industries and end markets. NOW also provides supply chain management to drilling contractors, E&P operators, midstream operators, downstream energy and industrial manufacturing companies. NOW’s supplier network consists of thousands of vendors in approximately 40 countries.
Basis of Presentation
All significant intercompany transactions and accounts have been eliminated. The unaudited consolidated financial information included in this report has been prepared in accordance with accounting principles generally accepted in the United States (“GAAP”) for interim financial information and Article 10 of SEC Regulation S-X. The principles for interim financial information do not require the inclusion of all the information and footnotes required by generally accepted accounting principles for complete financial statements. Therefore, these financial statements should be read in conjunction with the financial statements included in the Company’s most recent Annual Report on Form 10-K. In the opinion of the Company’s management, the consolidated financial statements include all adjustments, all of which are of a normal recurring nature, necessary for a fair presentation of the results for the interim periods. The results of operations for the three months ended March 31, 2016 are not necessarily indicative of the results to be expected for the full year.
The Separation
On May 1, 2014, the National Oilwell Varco, Inc. (“NOV”) Board of Directors approved the Spin-Off (the “Spin-Off” or “Separation”) of its distribution business into an independent, publicly traded company named NOW Inc. In accordance with a separation and distribution agreement, the two companies were separated by NOV distributing to its stockholders 107,053,031 shares of common stock of the Company after the market closed on May 30, 2014. Each NOV stockholder received one share of NOW common stock for every four shares of NOV common stock held at the close of business on the record date of May 22, 2014 and not sold prior to close of business on May 30, 2014. Fractional shares of NOW common stock were not distributed and any fractional shares of NOW common stock otherwise issuable to a NOV stockholder were sold in the open market on such stockholder’s behalf, and such stockholder received a cash payment with respect to that fractional share. In conjunction with the Spin-Off, NOV received an opinion from its legal counsel to the effect that, based on certain facts, assumptions, representations and undertakings, for U.S. federal income tax purposes, the distribution of NOW common stock and certain related transactions generally was not taxable to NOV or U.S. holders of NOV common stock, except in respect to cash received in lieu of fractional shares, which generally will be taxable to such holders as a capital gain. Following the Spin-Off, NOW became an independent, publicly traded company as NOV had no ownership interest in NOW. Each company has separate public ownership, boards of directors and management. A Registration Statement on Form 10, as amended, relating to the Spin-Off was filed by the Company with the U.S. Securities and Exchange Commission (“SEC”) and was declared effective on May 13, 2014. On June 2, 2014, NOW stock began trading the “regular-way” on the New York Stock Exchange under the ticker symbol “DNOW”.
Use of Estimates
The preparation of financial statements in conformity with GAAP requires management to make estimates and assumptions that affect reported and contingent amounts of assets and liabilities as of the date of the financial statements and reported amounts of revenues and expenses during the reporting period. Actual results could differ from those estimates.
7
Reclassification
Certain amounts in the prior periods presented have been reclassified to conform to the current period financial statement presentation. These reclassifications have no effect on previously reported operating loss, loss before income taxes or net loss.
Fair Value of Financial Instruments
The carrying amounts of cash and cash equivalents, receivables and payables approximated fair value because of the relatively short maturity of these instruments. Cash equivalents include only those investments having a maturity date of three months or less at the time of purchase. See Note 12 “Derivative Financial Instruments” for the fair value of derivative financial instruments.
Recently Issued Accounting Standards
In May 2014, the Financial Accounting Standards Board (“FASB”) issued Accounting Standard Update (“ASU”) No. 2014-09, Revenue from Contracts with Customers: Topic 606. ASU 2014-09 affects any entity using GAAP that either enters into contracts with customers to transfer goods or services or enters into contracts for the transfer of nonfinancial assets unless those contracts are within the scope of other standards (e.g., insurance contracts or lease contracts). This ASU will supersede the revenue recognition requirements in Topic 605, Revenue Recognition, and most industry-specific guidance. In addition, the existing requirements for the recognition of a gain or loss on the transfer of nonfinancial assets that are not in a contract with a customer (e.g., assets within the scope of Topic 360, Property, Plant, and Equipment, and intangible assets within the scope of Topic 350, Intangibles—Goodwill and Other) are amended to be consistent with the guidance on recognition and measurement (including the constraint on revenue) in this ASU. Early application is not permitted. The ASU provides two transition methods: (i) retrospectively to each prior reporting period presented (ii) retrospectively with the cumulative effect of initially applying this ASU recognized at the date of initial application. The amendments in this ASU were originally set up to be effective for annual reporting periods beginning after December 15, 2016, including interim periods within that reporting period. In August 2015, FASB proposed the effective date to be the annual reporting periods beginning after December 15, 2017, and interim periods therein. Early application is permitted as early as the original effective date. The Company is currently assessing the impact of ASU No. 2014-09 on its financial position and results of operations.
In July 2015, the FASB issued ASU No. 2015-11, Simplifying the Measurement of Inventory. Under ASU 2015-11, inventory will be measured at the “lower of cost and net realizable value.” ASU 2015-11 defines net realizable value as the “estimated selling prices in the ordinary course of business, less reasonably predictable costs of completion, disposal, and transportation.” ASU 2015-11 is effective for interim and annual periods beginning after December 15, 2016. Early application is permitted and should be applied prospectively. The Company is currently assessing the impact of ASU 2015-11 on its financial position and results of operations.
In February 2016, the FASB issued ASU No. 2016-02, Leases: Topic 842. ASU 2016-02 requires lessees to recognize a lease liability and a right-to-use asset for all leases, including operating leases, with a term greater than twelve months on its balance sheet. ASU 2016-02 is effective in annual and interim periods in fiscal years beginning after December 15, 2018, with early adoption permitted, and requires a modified retrospective transition method. The Company is currently assessing the impact of ASU 2016-02 on its financial position and results of operations.
In March 2016, the FASB issued ASU No. 2016-09, Improvements to Employee Share-Based Payment Accounting, which simplifies the accounting for income taxes, forfeitures, and statutory tax withholding requirements, as well as classification in the statement of cash flows. ASU 2016-09 is effective in annual and interim periods in fiscal years beginning after December 15, 2016, with early adoption permitted. The Company is currently assessing the impact of ASU 2016-09 on its financial position and results of operations.
8
2. Property, Plant and Equipment, net
Property, plant and equipment consist of (in millions):
|
|
|
Estimated Useful Lives |
|
March 31, 2016 |
|
|
December 31, 2015 |
|
||
|
Information technology assets |
|
1-7 Years |
|
$ |
49 |
|
|
$ |
48 |
|
|
Operating equipment |
|
2-15 Years |
|
|
84 |
|
|
|
84 |
|
|
Buildings and land (1) |
|
5-35 Years |
|
|
100 |
|
|
|
98 |
|
|
Total property, plant and equipment |
|
|
|
|
233 |
|
|
|
230 |
|
|
Less: accumulated depreciation |
|
|
|
|
(74 |
) |
|
|
(65 |
) |
|
Property, plant and equipment, net |
|
|
|
$ |
159 |
|
|
$ |
165 |
|
|
|
(1) |
Land has an indefinite life. |
3. Accrued Liabilities
Accrued liabilities consist of (in millions):
|
|
|
March 31, 2016 |
|
|
December 31, 2015 |
|
||
|
Compensation and other related expenses |
|
$ |
33 |
|
|
$ |
26 |
|
|
Customer credits and prepayments |
|
|
21 |
|
|
|
21 |
|
|
Taxes (non income) |
|
|
10 |
|
|
|
18 |
|
|
Other |
|
|
30 |
|
|
|
29 |
|
|
Total |
|
$ |
94 |
|
|
$ |
94 |
|
4. Debt
On January 20, 2016, the Company entered into an amendment (the “Amendment”) to its credit facility dated as of April 18, 2014 (the “Credit Agreement”). The Amendment, among other things, (i) suspends, until the Company elects otherwise, the Credit Agreement’s minimum interest coverage ratio effective as of December 30, 2015, (ii) adds a minimum asset coverage ratio (as defined in the Credit Agreement), which requires that the ratio of the value of the Company’s eligible assets to the amount of its outstanding obligations under the Credit Agreement is no less than 1.50 to 1.00, (iii) reduces the maximum capitalization ratio (as defined in the Credit Agreement) from 50% to 45%, and (iv) increases the applicable interest margin on current borrowings by 75 basis points and the current commitment fee by 5 basis points. In connection with the Amendment, the Company also entered into a Security Agreement dated as of January 20, 2016 (the “Security Agreement”) pursuant to which it granted the lenders under the Credit Agreement customary security interests in substantially all of the Company’s U.S. assets and in approximately 65% of the equity interests of the Company’s first-tier foreign subsidiaries. As of March 31, 2016, the Company was in compliance with all financial covenants in the credit facility.
Total commitments under the amended credit facility remain at $750 million (provided that borrowings above 75% of such commitments are conditioned upon compliance with a minimum fixed charge ratio (as defined in the Credit Agreement)). The amended credit facility continues to include the $250 million accordion feature and still expires on April 18, 2019.
As of March 31, 2016, the Company had borrowed $55 million against its senior secured revolving credit facility. The Company was not obligated to pay back the borrowing against the senior secured revolving credit facility until the expiration date of April 18, 2019.
9
5. Accumulated Other Comprehensive Loss
The components of accumulated other comprehensive loss are as follows (in millions):
|
|
|
Foreign |
|
|
|
|
|
Currency |
|
|
|
|
|
Translation |
|
|
|
|
|
Adjustments |
|
|
|
Balance at December 31, 2015 |
|
$ |
(134 |
) |
|
Other comprehensive gain |
|
|
23 |
|
|
Balance at March 31, 2016 |
|
$ |
(111 |
) |
The Company’s reporting currency is the U.S. dollar. A majority of the Company’s international entities in which there is a substantial investment have the local currency as their functional currency. As a result, foreign currency translation adjustments resulting from the process of translating the entities’ financial statements into the reporting currency are reported in Other Comprehensive Income or Loss in accordance with ASC Topic 830 “Foreign Currency Matters” (“ASC Topic 830”).
6. Business Segments
Operating results by reportable segment are as follows (in millions):
|
|
Three Months Ended March 31, |
|
|
|||||
|
|
2016 |
|
|
2015 |
|
|
||
|
Revenue: |
|
|
|
|
|
|
|
|
|
United States |
$ |
357 |
|
|
$ |
601 |
|
|
|
Canada |
|
63 |
|
|
|
116 |
|
|
|
International |
|
128 |
|
|
|
146 |
|
|
|
Total revenue |
$ |
548 |
|
|
$ |
863 |
|
|
|
Operating profit (loss): |
|
|
|
|
|
|
|
|
|
United States |
$ |
(59 |
) |
|
$ |
(12 |
) |
|
|
Canada |
|
(6 |
) |
|
|
3 |
|
|
|
International |
|
— |
|
|
|
1 |
|
|
|
Total operating profit (loss) |
$ |
(65 |
) |
|
$ |
(8 |
) |
|
|
Operating profit (loss) % of revenue: |
|
|
|
|
|
|
|
|
|
United States |
|
(16.5 |
%) |
|
|
(2.0 |
%) |
|
|
Canada |
|
(9.5 |
%) |
|
|
2.6 |
% |
|
|
International |
|
— |
|
|
|
0.7 |
% |
|
|
Total operating profit (loss) % |
|
(11.9 |
%) |
|
|
(0.9 |
%) |
|
7. Income Taxes
In connection with the Separation, the Company and NOV entered into a Tax Matters Agreement, dated as of May 29, 2014 (the “Tax Matters Agreement”). The Tax Matters Agreement sets forth the Company and NOV’s rights and obligations related to the allocation of federal, state, local and foreign taxes for periods before and after the Spin-Off, as well as taxes attributable to the Spin-Off, and related matters such as the filing of tax returns and the conduct of IRS and other audits. Pursuant to the Tax Matters Agreement, NOV has prepared and filed the consolidated federal income tax return, and any other tax returns that include both NOV and the Company for all the liability periods ended on or prior to May 30, 2014. The income tax provision (benefit) for periods prior to the Separation has been computed as if NOW were a stand-alone company. NOV will indemnify and hold harmless the Company for any income tax liability for periods before the Separation date. The Company will prepare and file all tax returns that include solely the Company for all taxable periods ending after that date. Settlements of tax payments between NOV and the Company were generally treated as contributions from or distributions to NOV in periods prior to the Separation date.
10
The effective tax rate for the three months ended March 31, 2016 was 5.2%, compared to 19.0% for the same period in 2015. Compared to the U.S. statutory rate, the effective tax rate was impacted by recurring items, such as lower tax rates on income earned in foreign jurisdictions that is permanently reinvested, offset by nondeductible expenses, state income taxes and the change in valuation allowance recorded against deferred tax assets.
Effective December 31, 2015, we early adopted, on a prospective basis, FASB ASU No. 2015-17, “Balance Sheet Classification of Deferred Taxes”. This ASU requires all deferred tax assets and liabilities to be reported as noncurrent.
To the extent penalties and interest would be assessed on any underpayment of income tax, such accrued amounts have been classified as a component of income tax provision (benefit) in the financial statements consistent with the Company’s policy.
The Company is subject to taxation in the United States, various states and foreign jurisdictions. The Company has significant operations in the United States and Canada and to a lesser extent in various other international jurisdictions. Tax years that remain subject to examination by major tax jurisdictions vary by legal entity, but are generally open in the U.S. for the tax years ending after 2012 and outside the U.S. for the tax years ending after 2010. The Company is indemnified for any income tax exposures related to the periods prior to the Separation.
8. Loss Per Share (“EPS”)
For the three months ended March 31, 2016 and 2015, 6,951,056 and 6,544,288, respectively, of potentially dilutive shares were excluded from the computation of diluted loss per share due to the Company recognizing a net loss for the period.
Basic and diluted loss per share follows (in millions, except share data):
|
|
Three Months Ended March 31, |
|
|||||
|
|
2016 |
|
|
2015 |
|
||
|
|
|
|
|
|
|
|
|
|
Numerator for basic and diluted net loss per share attributable to the Company's stockholders: |
|
|
|
|
|
|
|
|
Net loss attributable to the Company |
$ |
(63 |
) |
|
$ |
(10 |
) |
|
Less: net loss attributable to nonvested shares (1) |
|
— |
|
|
|
— |
|
|
Net loss attributable to the Company's stockholders |
$ |
(63 |
) |
|
$ |
(10 |
) |
|
Denominator for basic loss per share attributable to the Company's stockholders: |
|
|
|
|
|
|
|
|
Weighted average common shares outstanding |
|
107,272,937 |
|
|
|
107,114,897 |
|
|
Effect of dilutive securities: |
|
|
|
|
|
|
|
|
Dilutive effect of stock-based compensation |
|
— |
|
|
|
— |
|
|
Denominator for diluted loss per share attributable to the Company's stockholders |
|
107,272,937 |
|
|
|
107,114,897 |
|
|
Loss per share attributable to the Company's stockholders: |
|
|
|
|
|
|
|
|
Basic |
$ |
(0.59 |
) |
|
$ |
(0.09 |
) |
|
Diluted |
$ |
(0.59 |
) |
|
$ |
(0.09 |
) |
|
(1) |
ASC Topic 260, “Earnings Per Share” (“ASC Topic 260”) requires companies with unvested participating securities to utilize a two-class method for the computation of net income attributable to the Company per share. The two-class method requires a portion of net income attributable to the Company to be allocated to participating securities, which are unvested awards of share-based payments with non-forfeitable rights to receive dividends or dividend equivalents, if declared. Net losses are not allocated to nonvested shares in periods that the Company determines that those shares are not obligated to participate in losses. For the periods that the Company recognized net income, net income attributable to the Company allocated to these participating securities was excluded from net income attributable to the Company’s stockholders in the numerator of the earnings per share computation. |
11
9. Stock-based Compensation and Outstanding Awards
The Company has a stock-based compensation plan known as the NOW Inc. Long-Term Incentive Plan (the “Plan”). Under the Plan, the Company’s employees are eligible to be granted stock options, restricted stock awards (“RSAs”), restricted stock units (“RSUs”), and performance stock awards (“PSAs”).
On February 19, 2016, the Company granted 915,592 stock options with a fair value of $5.17 per share and 220,521 shares of RSAs and RSUs with a fair value of $13.71 per share. In addition, the Company granted PSAs to senior management employees with potential payouts varying from zero to 280,842 shares. The stock options were granted February 19, 2016 with an exercise price of $13.71. These options vest over a three-year period from the grant date on a straight-line basis over the requisite service period for each separately vesting portion of the award as if the award was, in-substance, multiple awards. The RSAs and RSUs vest on the third anniversary of the date of grant. The PSAs can be earned based on performance against established metrics over a three-year performance period. The PSAs are divided into three equal, independent parts that are subject to three separate performance metrics: (i) one-third of the PSAs have a Total Shareholder Return (TSR) metric, (ii) one-third of the PSAs have an EBITDA metric, and (iii) one-third of the PSAs have a Working Capital (WC) metric.
Performance against the TSR metric is determined by comparing the performance of the Company’s TSR with the TSR performance of designated peer companies for the three year performance period. Performance against the EBITDA metric is determined by comparing the performance of the Company’s actual EBITDA average for each of the three-years of the performance period against the EBITDA metrics set by the Company’s Compensation Committee of the Board of Directors. Performance against the WC metric is determined by comparing the performance of the Company’s actual WC average for each of the three-years of the performance period against the WC metrics set by the Company’s Compensation Committee of the Board of Directors.
Stock-based compensation expense recognized in the three months ended March 31, 2016 and 2015 totaled $6 million and $7 million, respectively.
10. Commitments and Contingencies
The Company is involved in various claims, regulatory agency audits and pending or threatened legal actions involving a variety of matters. At March 31, 2016, the Company recorded an immaterial amount for contingent liabilities representing all contingencies believed to be probable. The Company has also assessed the potential for additional losses above the amounts accrued as well as potential losses for matters that are not probable, but are reasonably possible. The total potential loss on these matters cannot be determined; however, in the Company’s opinion, any ultimate liability, to the extent not otherwise recorded or accrued for, will not materially affect the Company’s financial position, cash flow or results of operations. These estimated liabilities are based on the Company’s assessment of the nature of these matters, their progress toward resolution, the advice of legal counsel and outside experts as well as management’s intention and experience.
The Company’s business is affected both directly and indirectly by governmental laws and regulations relating to the oilfield service industry in general, as well as by environmental and safety regulations that specifically apply to the Company’s business. Although the Company has not incurred material costs in connection with its compliance with such laws, there can be no assurance that other developments, such as new environmental laws, regulations and enforcement policies hereunder may not result in additional, presently unquantifiable, costs or liabilities to the Company.
The Company does not accrue for contingent losses that, in its judgment, are considered to be reasonably possible, but not probable. Estimating reasonably possible losses also requires the analysis of multiple possible outcomes that often depend on judgments about potential actions by third parties. NOW’s management currently estimates a range of loss for reasonably possible losses for which an estimate can be made is between zero and $18 million in the international segment primarily attributable to accounts receivable with one customer. The Company has accrued its best estimate for loss at March 31, 2016. Factors underlying this estimated range of loss may change from time to time, and actual results may vary significantly from this estimate.
In connection with one of the Company’s acquisitions in 2015, the Company agreed to make contingent consideration payments of up to $6 million upon the attainment of certain profitability milestones through February 2018. As of March 31, 2016, the estimated fair value of the contingent consideration of approximately $1 million was recorded in other long-term liabilities.
The Company maintains credit arrangements with several banks providing for short-term borrowing capacity, overdraft protection and other bonding requirements. As of March 31, 2016, these credit arrangements totaled approximately $52 million, of which the Company was contingently liable for approximately $8 million of outstanding standby letters of credit, including bid and performance related bonds and surety bonds. The Company does not believe, based on historical experience and information currently available, that it is probable that any amounts will be required to be paid.
12
11. Related Party Transactions
In connection with the Spin-Off, the Company and NOV entered into a Separation and Distribution Agreement, Tax Matters Agreement, Employee Matters Agreement, and Transition Service Agreement each dated May 29, 2014.
The Separation and Distribution Agreement contains the key provisions related to the separation from NOV and the distribution of the Company’s common stock to NOV shareholders. The Separation and Distribution Agreement separated the assets related to the Company’s business from NOV, along with liabilities related to such assets, which now reside with the Company. In general, the Company agrees to indemnify NOV from liabilities arising from the Company’s business and assets, and NOV agrees to indemnify the Company from liabilities arising from NOV’s business and assets (that remained with NOV), except as otherwise provided in such agreement.
The Tax Matters Agreement governs the respective rights, responsibilities and obligations of each party with respect to taxes and tax benefits, the filing of tax returns, the control of audits, restrictions to preserve the tax-free status of the Spin-Off and other tax matters.
The Employee Matters Agreement governs the Company and NOV’s compensation and employee benefit obligations with respect to current and former employees of each company, and generally allocates liabilities and responsibilities relating to employee compensation and benefit plans and programs. Such agreement also provides the adjustment mechanisms to be applied as a result of the Spin-Off to convert outstanding NOV equity awards held by Company employees to Company awards.
12. Derivative Financial Instruments
The Company is exposed to certain risks relating to its ongoing business operations. The primary risk managed by using derivative instruments is foreign currency exchange rate risk. The Company has entered into certain financial derivative instruments to manage this risk.
The derivative financial instruments the Company has entered into are forward exchange contracts which have terms of less than one year to economically hedge foreign currency exchange rate risk on recognized nonfunctional currency monetary accounts. The purpose of the Company’s foreign currency economic hedging activities is to economically hedge the Company’s risk from changes in the fair value of non-functional currency denominated monetary accounts.
The Company records all derivative financial instruments at their fair value in its consolidated balance sheets. None of the derivative financial instruments that the Company holds are designated as either a fair value hedge or cash flow hedge and the gain or loss on the derivative instrument is recorded in earnings. The Company has determined that the fair value of its derivative financial instruments are determined using level 2 inputs (inputs other than quoted prices in active markets for identical assets and liabilities that are observable either directly or indirectly for substantially the full term of the asset or liability) in the fair value hierarchy as the fair value is based on publicly available foreign exchange rates at each financial reporting date. At March 31, 2016, the fair value of the Company’s foreign currency forward contracts totaled an asset of less than $1 million and is included in other current assets in the accompanying consolidated balance sheets; a liability of less than $1 million and is included in other current liabilities in the accompanying consolidated balance sheets; and a loss of less than $1 million is included in other income (expense) in the accompanying consolidated statements of operations. The notional principal associated with those contracts was $97 million as of March 31, 2016.
At March 31, 2016, the Company’s financial instruments do not contain any credit-risk-related or other contingent features that could cause accelerated payments when the Company’s financial instruments are in net liability positions. The Company does not use derivative financial instruments for trading or speculative purposes.
13. Subsequent Event
Subsequent to March 31, 2016, the Company entered into a stock purchase agreement to purchase the businesses of Power Service, Inc., Industrial Tool & Repair, Inc. & Power Transportation LLC (collectively, “Power Service”). The completion of this acquisition is subject to customary closing conditions, including regulatory approval. Power Service is a distributor of OEM parts including pumps, generator sets, air compressors and blowers, and a fabricator of custom Lease Automatic Custody Transfer (LACT) units, Vapor Recovery Units, ASME Code Vessels and Water Production skids serving the Upstream, Midstream & Downstream oil and gas markets, as well as the Mining, Power Generation and General Industrial industries.
13
Item 2. Management’s Discussion and Analysis of Financial Condition and Results of Operations
Forward-Looking Statements
Some of the information in this document contains, or has incorporated by reference, forward-looking statements within the meaning of Section 27A of the Securities Act of 1933, as amended, and Section 21E of the Securities Exchange Act of 1934, as amended. Statements that are not historical facts, including statements about our beliefs and expectations, are forward-looking statements. Forward-looking statements typically are identified by use of terms such as “may,” “believe,” “anticipate,” “expect,” “plan,” “predict,” “estimate,” “will be” or other similar words and phrases, although some forward-looking statements are expressed differently. You should be aware that our actual results could differ materially from results anticipated in the forward-looking statements due to a number of factors, including, but not limited to, changes in oil and gas prices, changes in the energy markets, customer demand for our products, significant changes in the size of our customers, difficulties encountered in integrating mergers and acquisitions, general volatility in the capital markets, changes in applicable government regulations, the inability to realize the benefits of the Spin-Off, increased borrowing costs, competition between us and our former parent company, NOV, unfavorable reactions from our employees, the triggering of rights and obligations by the Spin-Off or any litigation arising out of or related to the Separation, impairments in goodwill or other intangible assets and worldwide economic activity. You should also consider carefully the statements under “Risk Factors,” as disclosed in our Form 10-K, which address additional factors that could cause our actual results to differ from those set forth in the forward-looking statements. Given these uncertainties, current or prospective investors are cautioned not to place undue reliance on any such forward-looking statements. We undertake no obligation to update any such factors or forward-looking statements to reflect future events or developments.
Company Overview
We are a global distributor to the oil and gas and industrial markets with a legacy of over one-hundred and fifty years. We operate primarily under the DistributionNOW and Wilson Export brands. Through our network of over 300 locations and approximately 4,500 employees worldwide, we stock and sell a comprehensive offering of energy products as well as an extensive selection of products for industrial applications. Our energy product offering is required throughout all sectors of the oil and gas industry – from upstream drilling and completion, exploration and production (“E&P”), midstream infrastructure development to downstream petroleum refining – as well as in other industries, such as chemical processing, utilities and industrial manufacturing operations. The industrial distribution portion of our business targets a diverse range of end markets, including manufacturing, engineering and construction and refineries. We also provide supply chain management to drilling contractors, E&P operators, midstream operators and downstream energy and industrial manufacturing companies around the world.
Our global product offering includes consumable maintenance, repair and operating (“MRO”) supplies, pipe, valves, fittings, flanges, electrical, artificial lift solutions, pumps, mill tools, safety supplies and spare parts to support customers’ operations. We provide a one-stop shop value proposition within the energy market and particularly in targeted areas of artificial lift, pumping solutions, measurement and controls and valve actuation. We also offer warehouse and inventory management solutions as part of a comprehensive supply chain and materials management offering. Through focused effort, we have developed expertise in providing application systems and parts integration, optimization solutions and after-sales support.
Our supply chain solutions include outsourcing the functions of procurement, inventory and warehouse management, logistics, point of issue technology, project management, business process and performance metrics reporting. This solution allows us to leverage the infrastructure of our SAP™ Enterprise Resource Planning (“ERP”) system and others to streamline our customers’ purchasing process, from requisition to procurement to payment, by digitally managing workflow, improving approval routing and providing robust reporting functionality.
We support major land and offshore operations for all the major oil and gas producing regions around the world through our comprehensive network of energy branch locations. Our key markets, beyond North America, include Latin America, the North Sea, the Middle East, Asia Pacific and the Former Soviet Union (“FSU”). Products sold through our energy branch locations support greenfield and expansion upstream capital projects, midstream infrastructure and MRO and manufacturing consumables used in day-to-day production. We provide downstream energy and industrial products for petroleum refining, chemical processing, power generation and industrial manufacturing operations through Supply Chain and customer on-site locations.
We stock or sell more than 300,000 stock keeping units (“SKUs”) through our branch network. Our supplier network consists of thousands of vendors in approximately 40 countries. From our operations in over 20 countries we sell to customers operating in approximately 90 countries. The supplies and equipment stocked by each of our branches are customized to meet varied and changing local customer demands. The breadth and scale of our offering enhances our value proposition to vendors, customers and shareholders.
14
We employ advanced information technologies, including a common ERP platform across much of our business, to provide complete procurement, materials management and logistics coordination to our customers around the globe. Having a common ERP platform allows immediate visibility into the financials and operations of most branches worldwide, enhancing decision making and efficiency.
Demand for our products is driven primarily by the level of oil and gas drilling, servicing and production, transmission, refining and petrochemical activities. It is also influenced by the global economy in general and by government policies. Several factors drive spending, such as investment in energy infrastructure, the North American shale plays and market expectations of future developments in the oil, natural gas, liquids, refined products, petrochemical, plant maintenance and other industrial, manufacturing and energy sectors. These arrangements are generally repetitive activities that address recurring maintenance, repair, operational work, well hookups and drilling activities. Project activities, including facility maintenance (turnarounds), expansions, exploration and new construction projects, are usually associated with customers’ capital expenditure budgets, sometimes in association with their construction partners. We mitigate our exposure to price volatility by limiting the length of price protection on such projects which allows us to adjust pricing depending on factors that influence our supply chain.
We have benefited from several strategic acquisitions during the past several years, including Wilson International, Inc. (“Wilson”) and CE Franklin Ltd. (“CE Franklin”), both of which were completed in 2012. We have also expanded globally, through acquisitions and organic investments, into Australia, Azerbaijan, Brazil, Canada, Colombia, England, Kazakhstan, Mexico, Netherlands, Norway, Philippines, Russia, Scotland, Singapore, United Arab Emirates and the United States.
Summary of Reportable Segments
We operate through three reportable segments: United States (“U.S.”), Canada and International. The segment data included in our Management’s Discussion and Analysis (“MD&A”) are presented on a basis consistent with our internal management reporting. Segment information appearing in Note 6 “Business Segments” of the notes to unaudited consolidated financial statements (Part I, Item 1 of this Form 10-Q) is also presented on this basis.
United States
We have more than 200 locations in the U.S., which are geographically positioned to best serve the upstream, midstream and downstream energy and industrial markets.
We also have extensive one-stop shop specialty operations in the U.S. that provide our customers a unique opportunity to purchase artificial lift, pumps, valves and valve actuation, measurement and controls and fluid transfer products which enables them to better focus on their core business. In these businesses, we provide additional value to our customers through the design, assembly, fabrication and optimization of products and equipment essential to the safe and efficient production of oil and gas and industrial manufacturing processes.
Canada
We have a network of approximately 60 locations in the Canadian oilfield, predominantly in the oil rich provinces of Alberta and Saskatchewan in Western Canada. Our Canada segment primarily serves the energy exploration, production and drilling business, offering customers the same products and value-added solutions that we perform in the U.S. In Canada, we also provide training for and supervise the installation of fiberglass pipe, supported by substantial inventory and product expertise to serve our customers.
International
We operate in approximately 20 countries and serve the needs of our international customers from approximately 40 locations outside of the U.S. and Canada, all of which are strategically located in major oil and gas development areas. Our approach in these markets is similar to our approach in the U.S., as our customers turn to us to provide inventory and support closer to their drilling and exploration activities. Our long legacy of operating in many international regions, combined with significant expansion into several new key markets, provides a competitive advantage as few of our competitors have a presence in the U.S., Canada and international markets.
15
The Separation
On May 1, 2014, the NOV Board of Directors approved the Spin-Off of its distribution business into an independent, publicly traded company named NOW Inc. In accordance with a separation and distribution agreement, the two companies were separated by NOV distributing to its stockholders all 107,053,031 shares of common stock of NOW Inc. after the market closed on May 30, 2014. Each NOV stockholder received one share of NOW common stock for every four shares of NOV common stock held at the close of business on the record date of May 22, 2014 and not sold prior to close of business May 30, 2014. Fractional shares of NOW common stock were not distributed and any fractional shares of NOW common stock otherwise issuable to a NOV stockholder were sold in the open market on such stockholder’s behalf, and such stockholder received a cash payment with respect to that fractional share. In conjunction with the separation, NOV received an opinion from its legal counsel to the effect that, based on certain facts, assumptions, representations and undertakings, for U.S. federal income tax purposes, the distribution of NOW common stock and certain related transactions generally was not taxable to NOV or U.S. holders of NOV common stock, except in respect to cash received in lieu of fractional shares, which generally will be taxable to such holders as capital gain. Following the separation, NOW is an independent, publicly traded company, and NOV has no ownership interest in NOW. Each company now has separate public ownership, boards of directors and management. A Registration Statement on Form 10, as amended, relating to the Spin-Off was filed by the Company with the SEC and was declared effective on May 13, 2014. On June 2, 2014, NOW Inc. stock began trading the “regular-way” on the New York Stock Exchange under the symbol “DNOW”.
Basis of Presentation
All significant intercompany transactions and accounts have been eliminated. The unaudited consolidated financial information included in this report has been prepared in accordance with accounting principles generally accepted in the United States (“GAAP”) for interim financial information and Article 10 of SEC Regulation S-X. The principles for interim financial information do not require the inclusion of all the information and footnotes required by generally accepted accounting principles for complete financial statements. Therefore, these financial statements should be read in conjunction with the financial statements included in the Company’s most recent Annual Report on Form 10-K. In the opinion of the Company’s management, the consolidated financial statements include all adjustments, all of which are of a normal recurring nature, necessary for a fair presentation of the results for the interim periods. The results of operations for the three months ended March 31, 2016, are not necessarily indicative of the results to be expected for the full year.
Operating Environment Overview
The Company’s results are dependent on, among other things, the level of worldwide oil and gas drilling, well remediation activity, crude oil and natural gas prices, capital spending by oilfield service companies and drilling contractors, and worldwide oil and gas inventory levels. Key industry indicators for the first quarter of 2016 and 2015 and the fourth quarter of 2015 include the following:
|
|
|
|
|
|
|
|
|
|
|
% |
|
|
|
|
|
|
% |
|
||
|
|
|
|
|
|
|
|
|
|
|
1Q16 v |
|
|
|
|
|
|
1Q16 v |
|
||
|
|
|
1Q16* |
|
|
1Q15* |
|
|
1Q15 |
|
|
4Q15* |
|
|
4Q15 |
|
|||||
|
Active Drilling Rigs: |
|
|
|
|
|
|
|
|
|
|
|
|
|
|
|
|
|
|
|
|
|
U.S. |
|
|
555 |
|
|
|
1,380 |
|
|
|
(59.8 |
%) |
|
|
755 |
|
|
|
(26.5 |
%) |
|
Canada |
|
|
164 |
|
|
|
309 |
|
|
|
(46.9 |
%) |
|
|
174 |
|
|
|
(5.7 |
%) |
|
International |
|
|
1,016 |
|
|
|
1,261 |
|
|
|
(19.4 |
%) |
|
|
1,105 |
|
|
|
(8.1 |
%) |
|
Worldwide |
|
|
1,735 |
|
|
|
2,950 |
|
|
|
(41.2 |
%) |
|
|
2,034 |
|
|
|
(14.7 |
%) |
|
|
|
|
|
|
|
|
|
|
|
|
|
|
|
|
|
|
|
|
|
|
|
West Texas Intermediate Crude Prices (per barrel) |
|
$ |
33.18 |
|
|
$ |
48.54 |
|
|
|
(31.6 |
%) |
|
$ |
41.96 |
|
|
|
(20.9 |
%) |
|
Natural Gas Prices ($/MMBtu) |
|
$ |
2.00 |
|
|
$ |
2.90 |
|
|
|
(31.0 |
%) |
|
$ |
2.12 |
|
|
|
(5.7 |
%) |
|
Hot-Rolled Coil Prices (steel) ($/short ton) |
|
$ |
399.89 |
|
|
$ |
551.53 |
|
|
|
(27.5 |
%) |
|
$ |
404.11 |
|
|
|
(1.0 |
%) |
|
* |
Averages for the quarters indicated. See sources on following page. |
16
The following table details the U.S., Canadian and international rig activity and West Texas Intermediate oil prices for the past nine quarters ended March 31, 2016, on a quarterly basis:
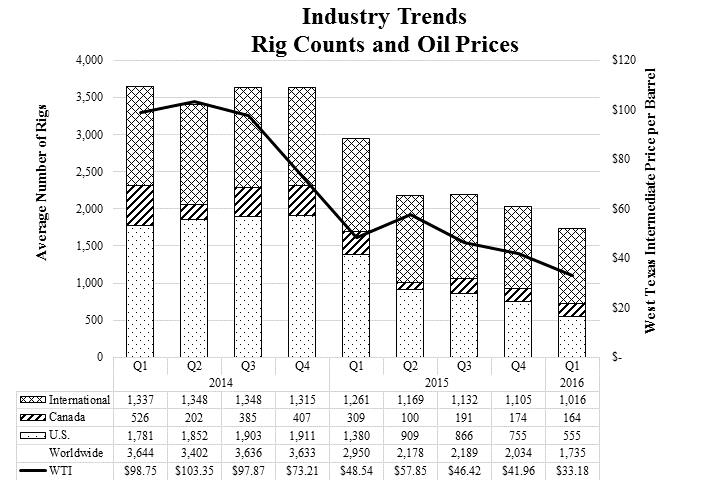
Sources: Rig count: Baker Hughes, Inc. (www.bakerhughes.com); West Texas Intermediate Crude and Natural Gas Prices: Department of Energy, Energy Information Administration (www.eia.doe.gov); Hot-Rolled Coil Prices: American Metal Market SteelBenchmarker™ Hot Roll Coil USA (www.amm.com).
The worldwide quarterly average rig count declined 14.7% (from 2,034 rigs to 1,735 rigs) and the U.S. declined 26.5% (from 755 rigs to 555 rigs) in the first quarter of 2016 compared to the fourth quarter of 2015. The average price per barrel of West Texas Intermediate Crude declined 20.9% (from $41.96 per barrel to $33.18 per barrel) and natural gas prices declined 5.7% (from $2.12 per MMBtu to $2.00 per MMBtu) in the first quarter of 2016 compared to the fourth quarter of 2015. The average price per short ton of Hot-Rolled Coil declined 1.0% (from $404.11 per short ton to $399.89 per short ton) in the first quarter of 2016 compared to the fourth quarter of 2015.
U.S. rig count at April 15, 2016 was 440 rigs, down 115 rigs compared to the first quarter average of 555 rigs. The price for West Texas Intermediate Crude was $40.40 per barrel at April 15, 2016, up 21.8% from the first quarter average. The price for natural gas was $1.71 per MMBtu at April 15, 2016, down 14.5% from the first quarter average. The price for Hot-Rolled Coil was $457.23 per short ton at April 11, 2016, up 14.3% from the first quarter average.
17
Executive Summary
For the three months ended March 31, 2016, the Company generated a net loss of $63 million on $548 million in revenue. Revenue decreased $315 million or 36.5% for the three months ended March 31, 2016, when compared to the corresponding period of 2015. For the three months ended March 31, 2016, net loss increased $53 million when compared to the corresponding period of 2015.
For the three months ended March 31, 2016, the Company generated an operating loss of $65 million or negative 11.9% of revenue, compared to an operating loss of $8 million or negative 0.9% of revenue for the corresponding period of 2015.
Outlook
Our outlook for the Company remains tied to worldwide rig count, particularly in North America. The significant declines in rig count contribute to an unpredictable environment and several factors could alter activity significantly. Projections for oil and gas prices and resulting rig counts fluctuate considerably and energy-related companies are taking varied approaches during these uncertain times. Sustained lower oil prices may heighten the risk of political disturbances in oil-export-dependent economies, but can also offer an incentive to maximize output and stimulate growth.
Given the lack of visibility into when this market will recover, our approach during this time is to focus on what we can control. We take a quarter-to-quarter approach to managing the Company based on market conditions, while also continuing to advance our long-term strategic goals. We believe recent and current market conditions present a unique opportunity to execute strategic acquisitions that will help position the Company to emerge as a stronger global distribution business as the market recovers. We also believe that our long history of managing through these cycles will enable us to capitalize on new opportunities.
Operating results by reportable segment are as follows (in millions):
|
|
Three Months Ended March 31, |
|
|
|||||
|
|
2016 |
|
|
2015 |
|
|
||
|
Revenue: |
|
|
|
|
|
|
|
|
|
United States |
$ |
357 |
|
|
$ |
601 |
|
|
|
Canada |
|
63 |
|
|
|
116 |
|
|
|
International |
|
128 |
|
|
|
146 |
|
|
|
Total revenue |
$ |
548 |
|
|
$ |
863 |
|
|
|
Operating profit (loss): |
|
|
|
|
|
|
|
|
|
United States |
$ |
(59 |
) |
|
$ |
(12 |
) |
|
|
Canada |
|
(6 |
) |
|
|
3 |
|
|
|
International |
|
— |
|
|
|
1 |
|
|
|
Total operating profit (loss) |
$ |
(65 |
) |
|
$ |
(8 |
) |
|
|
Operating profit (loss) % of revenue: |
|
|
|
|
|
|
|
|
|
United States |
|
(16.5 |
%) |
|
|
(2.0 |
%) |
|
|
Canada |
|
(9.5 |
%) |
|
|
2.6 |
% |
|
|
International |
|
— |
|
|
|
0.7 |
% |
|
|
Total operating profit (loss) % |
|
(11.9 |
%) |
|
|
(0.9 |
%) |
|
United States
For the three months ended March 31, 2016, revenue was $357 million, a decline of $244 million or 40.6%, when compared to the corresponding period of 2015. This decrease was driven by a sixty percent decline in U.S. rig count, slightly offset by incremental revenue gains of approximately $40 million from acquisitions in the period.
For the three months ended March 31, 2016, the U.S. generated an operating loss of $59 million or negative 16.5% of revenue, a decline of $47 million, when compared to the corresponding period of 2015. For the three months ended March 31, 2016, U.S. operating loss increased due to lower volumes and increased inventory charges.
18
Canada
For the three months ended March 31, 2016, revenue was $63 million, a decline of $53 million or 45.7%, when compared to the corresponding period of 2015. This decrease was in line with the decline in Canadian rig count coupled with the impact of the strengthening of the U.S. dollar.
For the three months ended March 31, 2016, Canada generated an operating loss of $6 million or negative 9.5% of revenue, a decline of $9 million, when compared to the corresponding period of 2015. Operating profit decreased in the period primarily due to the decline in revenue discussed above, offset by expense reductions realized in the period.
International
For the three months ended March 31, 2016, revenue was $128 million, a decline of $18 million or 12.3% from the same quarter in the prior year. This decrease was a result of an overall decline in international drilling activity and reduced customer spend, partially offset by incremental revenue gains from acquisitions of approximately $30 million in the respective period of 2015.
For the three months ended March 31, 2016, the international segment broke even, a decline of $1 million, when compared to the corresponding period of 2015. The decrease was primarily attributable to volume declines offset by reduced costs related to acquisitions in the period.
Cost of products
For the three months ended March 31, 2016, cost of products was $461 million compared to $708 million for the corresponding period in 2015, a decrease of $247 million, primarily due to the decline in revenue, coupled with inventory adjustments made in the period. Cost of products includes the cost of inventory sold and related items, such as vendor consideration, inventory allowances, amortization of intangibles and inbound and outbound freight.
Warehousing, selling and administrative
For the three months ended March 31, 2016, warehousing, selling and administrative costs were $152 million, compared to $163 million for the corresponding period of 2015. For the three months ended March 31, 2016, the decrease is related to cost-cutting initiatives taken as a result of the decline in market activity, offset by the impact of additional operating expenses associated with newly acquired companies. Warehousing, selling and administrative costs include branch location, distribution center and regional expenses (including costs such as compensation, benefits and rent) as well as corporate general selling and administrative expenses.
Other expense
For the three months ended March 31, 2016, other expense was $2 million, compared to $4 million for the corresponding period of 2015. These changes were mainly attributable to exchange rate fluctuations.
Income tax benefit
The effective tax rate for the three months ended March 31, 2016 was 5.2%, compared to 19.0%, for the same period in 2015. Compared to the U.S. statutory rate, the effective tax rate was impacted by recurring items, such as lower tax rates on income earned in foreign jurisdictions that is permanently reinvested, offset by nondeductible expenses, state income taxes and the change in valuation allowance recorded against deferred tax assets.
Non-GAAP Financial Measure and Reconciliation
In an effort to provide investors with additional information regarding our results as determined by GAAP, we disclose a non-GAAP financial measure in our quarterly earnings press releases and other public disclosures. The primary non-GAAP financial measure we focus on is earnings before interest, taxes, depreciation and amortization, excluding other costs (“EBITDA excluding other costs.”) This financial measure excludes the impact of certain amounts as further identified below and has not been calculated in accordance with GAAP. A reconciliation of this non-GAAP financial measure to its most comparable GAAP financial measure is included below.
19
We use this non-GAAP financial measure internally to evaluate and manage the Company’s operations because we believe it provides useful supplemental information regarding the Company’s ongoing economic performance. We have chosen to provide this information to investors to enable them to perform more meaningful comparisons of operating results, and as a means to emphasize the results of ongoing operations.
The following table sets forth the reconciliation of EBITDA excluding other costs to its most comparable GAAP financial measure (in millions):
EBITDA excluding other costs
|
|
|
Three Months Ended March 31, |
|
|||||
|
|
|
2016 |
|
|
2015 |
|
||
|
Net loss (1) |
|
$ |
(63 |
) |
|
$ |
(10 |
) |
|
Interest, net (2) |
|
|
— |
|
|
|
— |
|
|
Income tax benefit |
|
|
(4 |
) |
|
|
(2 |
) |
|
Depreciation and amortization |
|
|
12 |
|
|
|
7 |
|
|
Other costs (3) |
|
|
4 |
|
|
|
9 |
|
|
EBITDA excluding other costs |
|
$ |
(51 |
) |
|
$ |
4 |
|
|
EBITDA % excluding other costs (4) |
|
|
(9.3 |
%) |
|
|
0.5 |
% |
|
(1) |
We believe that net loss is the financial measure calculated and presented in accordance with U.S. generally accepted accounting principles that is most directly comparable to EBITDA excluding other costs. EBITDA excluding other costs measures the Company’s operating performance without regard to certain expenses. EBITDA excluding other costs is not a presentation made in accordance with GAAP and the Company’s computation of EBITDA excluding other costs may vary from others in the industry. EBITDA excluding other costs has important limitations as an analytical tool and should not be considered in isolation or as a substitute for analysis of the Company’s results as reported under GAAP. |
|
(2) |
Interest, net was less than $1 million for all periods presented. |
|
(3) |
Other costs primarily includes the transaction costs associated with acquisition activity, including the cost of inventory that was stepped up to fair value during purchase accounting related to acquisitions and severance expenses which are included in operating loss. |
|
(4) |
EBITDA % excluding other costs is defined as EBITDA excluding other costs divided by Revenue. |
Liquidity and Capital Resources
We assess liquidity in terms of our ability to generate cash to fund operating, investing and financing activities. We expect to remain in a strong financial position, with resources expected to be available to reinvest in existing businesses, strategic acquisitions and capital expenditures to meet short- and long-term objectives. We believe that cash on hand, cash generated from expected results of operations and amounts available under our revolving credit facility will be sufficient to fund operations, anticipated working capital needs and other cash requirements, including capital expenditures.
As of March 31, 2016 and December 31, 2015, we had cash and cash equivalents of $131 million and $90 million, respectively. As of March 31, 2016, approximately $90 million of our cash and cash equivalents was maintained in the accounts of our various foreign subsidiaries and, if such amounts were transferred among countries or repatriated to the U.S., such amounts may be subject to additional tax liabilities, which would be recognized in our financial statements in the period during which such decisions were made. We currently have the intent and ability to permanently reinvest the cash held by our foreign subsidiaries and there are currently no plans for the repatriation of such amounts.
At March 31, 2016, the Company had $55 million of borrowings against its revolving credit facility. The credit facility contains usual and customary affirmative and negative covenants for credit facilities of this type including financial covenants. As of March 31, 2016, the Company was in compliance with all covenants. The Company continuously monitors compliance with debt covenants. A default, if not waived or amended, would prevent the Company from taking certain actions, such as incurring additional debt.
20
The following table summarizes our net cash flows provided by operating activities, net cash used in investing activities and net cash provided by financing activities for the periods presented (in millions):
|
|
|
Three Months Ended March 31, |
|
|||||
|
|
|
2016 |
|
|
2015 |
|
||
|
Net cash provided by (used in) operating activities |
|
$ |
89 |
|
|
$ |
(13 |
) |
|
Net cash provided by (used in) investing activities |
|
|
− |
|
|
|
(186 |
) |
|
Net cash provided by (used in) financing activities |
|
|
(57 |
) |
|
|
133 |
|
Operating Activities
For the three months ended March 31, 2016, net cash provided by operating activities was $89 million, compared to net cash used in operating activities of $13 million in the corresponding period of 2015. For the three months ended March 31, 2016, net cash provided by operating activities was negatively impacted by a decrease in accounts payable and accrued liabilities of $7 million and a net decrease in other liabilities of $2 million, offset by a decrease in receivables and inventories of $72 million and $55 million, respectively. The decreases in accounts payable and accrued liabilities are a result of paying down outstanding liabilities as well as limiting new purchases due to the market conditions. Accounts receivable and inventories had a positive impact on cash flow in the period as a result of improved collections and curtailed spending.
Investing Activities
For the three months ended March 31, 2016, net cash provided by investing activities was nil compared to net cash used in investing activities of $186 million in the corresponding period of 2015. For the three months ended March 31, 2016, the Company had minimal purchases of property, plant and equipment, which was offset by proceeds from the disposals of fixed assets. In the comparative period in 2015, the Company used $183 million for business acquisitions, net of cash acquired, and $3 million for purchases of property, plant and equipment.
Financing Activities
For the three months ended March 31, 2016, net cash used in financing activities was $57 million compared to net cash provided by financing activities of $133 million for the corresponding period of 2015. The activity for both periods was primarily attributed to the Company making repayments under, and borrowing against, its credit facility.
Other
For the three months ended March 31, 2016, the effect of the change in exchange rates on cash and cash equivalents was an increase of $9 million compared to a decrease of $7 million for the corresponding period of 2015. The primary reason for the change in 2016 compared to 2015 was a decline in the foreign exchange rate for the Australian dollar, British pound, Canadian dollar and Kazakhstan tenge compared to the U.S. dollar.
We intend to pursue additional acquisition candidates, but the timing, size or success of any acquisition effort and the related potential capital commitments cannot be determined with certainty. We continue to expect to fund future acquisitions primarily with cash flows from operations and borrowings, including the undrawn portion of the credit facility or new debt issuances, but may also issue additional equity either directly or in connection with acquisitions. There can be no assurance that additional financing for acquisitions will be available at terms acceptable to us.
Critical Accounting Policies and Estimates
For a discussion of the critical accounting policies and estimates that we use in the preparation of our consolidated financial statements, see “Management’s Discussion and Analysis of Financial Condition and Results of Operations” included in our Annual Report on Form 10-K. In preparing the financial statements, we make assumptions, estimates and judgments that affect the amounts reported. We periodically evaluate our estimates and judgments that are most critical in nature which are related to allowance for doubtful accounts, inventory reserves, goodwill, purchase price allocation of acquisitions, vendor consideration and income taxes. Our estimates are based on historical experience and on our future expectations that we believe are reasonable. The combination of these factors forms the basis for making judgments about the carrying values of assets and liabilities that are not readily apparent from other sources. Actual results may differ from our current estimates and those differences may be material.
21
Generally accepted accounting principles require the Company to test goodwill and other indefinite-lived intangible assets for impairment at least annually (performed in the fourth quarter) or more frequently whenever events or circumstances occur indicating that goodwill or other indefinite-lived intangible assets might be impaired. Adverse market conditions could result in the recognition of impairment if the Company determines that the fair values of its reporting units have fallen below their carrying values. Events or circumstances which could require interim testing include (but are not limited to) a significant reduction in worldwide oil and gas prices or drilling; a significant reduction in profitability or cash flow of oil and gas companies or drilling contractors; a significant reduction in worldwide well remediation activity; a significant reduction in capital investment by other oilfield service companies; or a significant increase in worldwide inventories of oil or gas.
22
Item 3. Quantitative and Qualitative Disclosures About Market Risk
We are exposed to certain market risks that are inherent in our financial instruments and arise from changes in interest rates and foreign currency exchange rates. We may enter into derivative financial instrument transactions to manage or reduce market risk but do not enter into derivative financial instrument transactions for speculative purposes. We do not currently have any material outstanding derivative instruments. See Note 12 “Derivative Financial Instruments” to the consolidated financial statements.
A discussion of our primary market risk exposure in financial instruments is presented below.
Foreign Currency Exchange Rate Risk
We have operations in foreign countries and transact business globally in multiple currencies. Our net assets as well as our revenue and costs and expenses denominated in foreign currencies, expose us to the risk of fluctuations in foreign currency exchange rates against the U.S. dollar. Because we operate globally and approximately one-third of our year-to-date 2016 revenue was outside the United States, foreign currency exchange rates can impact our financial position, results of operations and competitive position. We are a net receiver of foreign currencies and therefore benefit from a weakening of the U.S. dollar and are adversely affected by a strengthening of the U.S. dollar relative to the foreign currency. As of March 31, 2016, our most significant foreign currency exposure was to the Canadian dollar with less significant foreign currency exposures to the Australian dollar, British pound and Kazakhstan tenge.
The financial statements of foreign subsidiaries are translated into their U.S. dollar equivalents at end-of-period exchange rates for assets and liabilities, while revenue, costs and expenses are translated at average monthly exchange rates. Translation gains and losses are components of other comprehensive income (loss) as reported in the consolidated statements of comprehensive income (loss). For year-to-date 2016, we realized a net foreign currency translation gain totaling $23 million, which was included in other comprehensive income (loss).
Foreign currency exchange rate fluctuations generally do not materially affect our earnings since the functional currency is typically the local currency; however, our operations also have net assets not denominated in their functional currency, which exposes us to changes in foreign currency exchange rates that impact our earnings as foreign currency transaction gains and losses. Foreign currency transaction gains and losses arising from fluctuations in currency exchange rates on transactions denominated in currencies other than the functional currency are recognized in the consolidated statements of operations as a component of other income (expense). For year-to-date 2016 and 2015, we reported foreign currency transaction losses of less than $1 million and $3 million, respectively. Gains and losses are primarily due to exchange rate fluctuations related to monetary asset balances denominated in currencies other than the functional currency and fair value adjustments to economically hedged positions as a result of changes in foreign currency exchange rates.
Some of our revenue for our foreign operations are denominated in U.S. dollars, and therefore, changes in foreign currency exchange rates impact earnings to the extent that costs associated with those U.S. dollar revenues are denominated in the local currency. Similarly some of our revenue for our foreign operations are denominated in foreign currencies, but have associated U.S. dollar costs, which also give rise to foreign currency exchange rate exposure. In order to mitigate those risks, we may utilize foreign currency forward contracts to better match the currency of the revenues and the associated costs. Although we may utilize foreign currency forward contracts to economically hedge certain foreign currency denominated balances or transactions, we do not currently hedge the net investments in our foreign operations. The counterparties to our forward contracts are major financial institutions. The credit ratings and concentration of risk of these financial institutions are monitored by us on a continuing basis. In the event that the counterparties fail to meet the terms of a foreign currency contract, our exposure is limited to the foreign currency rate differential.
The average foreign exchange rate for year-to-date 2016 compared to the average for the same period in 2015 decreased by approximately 11% compared to the U.S. dollar based on the aggregated weighted average revenue of our foreign-currency denominated foreign operations. The average foreign exchange rate for year-to-date 2016 compared to the average for the same period in 2015 of the Australian dollar, British pound, Canadian dollar and Kazakhstan tenge compared to the U.S. dollar decreased by approximately 8%, 6%, 10% and 48%, respectively, compared to the U.S. dollar.
We utilized a sensitivity analysis to measure the potential impact on earnings based on a hypothetical 10% change in foreign currency rates. A 10% strengthening from the levels experienced during year-to-date 2016 of the U.S. dollar relative to foreign currencies that affected the Company would have resulted in an approximate $1 million increase in net loss for the same period. A 10% weakening from the levels experienced during year-to-date 2016 of the U.S. dollar relative to foreign currencies that affected the Company would have resulted in an approximate $1 million decrease in net loss for the same period.
23
Commodity Steel Pricing
Our business is sensitive to steel prices, which can impact our product pricing, with steel tubular prices generally having the highest degree of sensitivity. While we cannot predict steel prices, we manage this risk by managing our inventory levels, including maintaining sufficient quantity on hand to meet demand, while reducing the risk of overstocking.
Interest Rates
We are subject to interest rate risk with our credit facility. The credit facility requires us to pay interest on outstanding borrowings at variable rates. Each one percentage point change in interest rates associated with the facility would result in a less than one million dollars change in our quarterly cash interest expense based on the balance at March 31, 2016.
Item 4. Controls and Procedures
Evaluation of Disclosure Controls and Procedures
As of the end of the period covered by this report, we carried out an evaluation, under the supervision and with the participation of the Company’s management, including the Company’s Chief Executive Officer and Chief Financial Officer, of the effectiveness of the design and operation of the Company’s disclosure controls and procedures. The Company’s disclosure controls and procedures are designed to provide reasonable assurance that the information required to be disclosed by the Company in the reports it files under the Exchange Act is accumulated and communicated to the Company’s management, including the Company’s Chief Executive Officer and Chief Financial Officer, as appropriate, to allow timely decisions regarding required disclosures and is recorded, processed, summarized and reported within the time period specified in the rules and forms of the Securities and Exchange Commission. Based upon that evaluation, the Company’s Chief Executive Officer and Chief Financial Officer concluded that the Company’s disclosure controls and procedures are effective as of the end of the period covered by this report at a reasonable assurance level.
Changes in Internal Control Over Financial Reporting
There has been no change in our internal control over financial reporting (as defined in Rule 13a-15(f) under the Exchange Act) that occurred during our last fiscal quarter that has materially affected, or is reasonably likely to materially affect, our internal control over financial reporting.
24
Reference is hereby made to the Index to Exhibits commencing on page 26.
25
SIGNATURE
Pursuant to the requirements of the Securities Exchange Act of 1934, the registrant has duly caused this report to be signed on its behalf by the undersigned thereunto duly authorized.
Date: May 4, 2016
|
By: |
|
/s/ Daniel L. Molinaro |
|
|
|
Daniel L. Molinaro |
|
|
|
Senior Vice President and Chief Financial Officer |
26
(a) Exhibits
|
Exhibit |
|
Exhibit Description |
|
|
|
|
|
2.1 |
|
Separation and Distribution Agreement between National Oilwell Varco, Inc. and NOW Inc. dated May 29, 2014 (1) |
|
|
|
|
|
3.1 |
|
NOW Inc. Amended and Restated Certificate of Incorporation (1) |
|
|
|
|
|
3.2 |
|
NOW Inc. Amended and Restated Bylaws (1) |
|
|
|
|
|
10.1 |
|
Tax Matters Agreement between National Oilwell Varco, Inc. and NOW Inc. dated May 29, 2014 (1) |
|
|
|
|
|
10.2 |
|
Employee Matters Agreement between National Oilwell Varco, Inc. and NOW Inc. dated May 29, 2014 (1) |
|
|
|
|
|
10.3 |
|
Master Distributor Agreement between National Oilwell Varco, L.P. and DNOW L.P. dated May 29, 2014 (1) |
|
|
|
|
|
10.4 |
|
Master Service Agreement between National Oilwell Varco, L.P. and DNOW L.P. dated May 29, 2014 (1) |
|
|
|
|
|
10.5 |
|
Employment Agreement of Merrill A. Miller, Jr. dated May 30, 2014 (1) |
|
|
|
|
|
10.6 |
|
Form of Employment Agreement for Executive Officers (1) |
|
|
|
|
|
10.7 |
|
NOW Inc. 2014 Incentive Compensation Plan (2) |
|
|
|
|
|
10.8 |
|
Credit Agreement among NOW Inc., Wells Fargo Bank, National Association, as Administrative Agent, and the lenders and other financial institutions named therein, dated as of April 18, 2014 (3) |
|
|
|
|
|
10.9 |
|
Agreement and Amendment No. 1 to Credit Agreement among NOW Inc., and Wells Fargo Bank, National Association, as administrative agent, and the lenders and other financial institutions named thereto, dated as of January 20, 2016 (4) |
|
|
|
|
|
10.10 |
|
Pledge and Security Agreement, dated as of January 20, 2016 (4) |
|
|
|
|
|
10.11 |
|
Form of Restricted Stock Award Agreement (6 year cliff vest) (5) |
|
|
|
|
|
10.12 |
|
Form of Nonqualified Stock Option Agreement (6) |
|
|
|
|
|
10.13 |
|
Form of Restricted Stock Award Agreement (3 year cliff vest) (6) |
|
|
|
|
|
10.14 |
|
Form of Performance Award Agreement (6) |
|
|
|
|
|
31.1 |
|
Certification pursuant to Rule 13a-14a and Rule 15d-14(a) of the Securities and Exchange Act, as amended |
|
|
|
|
|
31.2 |
|
Certification pursuant to Rule 13a-14a and Rule 15d-14(a) of the Securities and Exchange Act, as amended |
|
|
|
|
|
32.1 |
|
Certification pursuant to Section 906 of the Sarbanes-Oxley Act of 2002 |
|
|
|
|
|
32.2 |
|
Certification pursuant to Section 906 of the Sarbanes-Oxley Act of 2002 |
|
|
|
|
|
101.INS |
|
XBRL Instance Document |
|
|
|
|
|
101.SCH |
|
XBRL Taxonomy Extension Schema Document |
|
|
|
|
|
101.CAL |
|
XBRL Taxonomy Extension Calculation Linkbase Document |
|
|
|
|
|
101.DEF |
|
XBRL Taxonomy Extension Definition Linkbase Document |
|
|
|
|
|
101.LAB |
|
XBRL Taxonomy Extension Label Linkbase Document |
|
|
|
|
|
101.PRE |
|
XBRL Taxonomy Extension Presentation Linkbase Document |
|
(1) |
Filed as an Exhibit to our Current Report on Form 8-K filed on May 30, 2014 |
|
(2) |
Filed as an Exhibit to our Amendment No.1 to Form 10, as amended, Registration Statement filed on April 8, 2014 |
|
(3) |
Filed as an Exhibit to our Amendment No. 2 to Form 10, as amended, Registration Statement filed on April 23, 2014 |
|
(4) |
Filed as an Exhibit to our Current Report on Form 8-K filed on January 21, 2016 |
|
(5) |
Filed as an Exhibit to our Current Report on Form 8-K filed on November 19, 2014 |
|
(6) |
Filed as an Exhibit to our Quarterly Report on Form 10-Q filed on May 7, 2015 |
27
We hereby undertake, pursuant to Regulation S-K, Item 601(b), paragraph (4) (iii), to furnish to the U.S. Securities and Exchange Commission, upon request, all constituent instruments defining the rights of holders of our long-term debt not filed herewith.
28