Attached files
| file | filename |
|---|---|
| 8-K - 8-K - BERKSHIRE HILLS BANCORP INC | a16-10464_18k.htm |
Exhibit 99.1
Investor Deck April 2016

Table of Contents Who We Are – pg. 3 1Q16 Strategic Highlights – pg. 4 Core Earnings Momentum – pg. 5 Loan and Deposit Growth – pgs. 6-9 Customer Engagement – pg. 10 Fee Business Growth – pg. 11 Controlled Expenses – pg. 12 Talent Recruitment – pg. 13 AMEB Culture – pg. 14 Acquisition Discipline – pg. 15 Long-term Focus – pg. 16 Why Invest In Us – pg. 17 Appendix – pg. 18-21 2
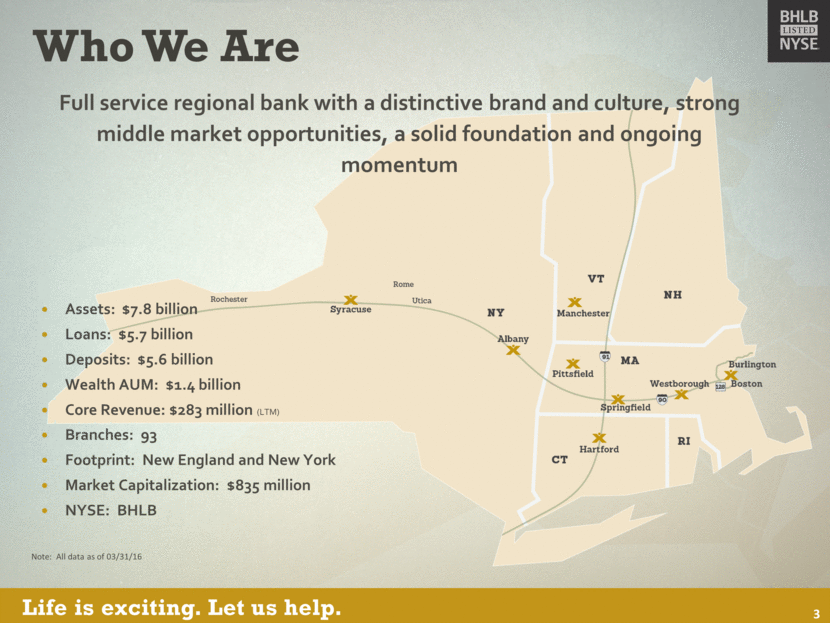
Who We Are Full service regional bank with a distinctive brand and culture, strong middle market opportunities, a solid foundation and ongoing momentum Assets: $7.8 billion Loans: $5.7 billion Deposits: $5.6 billion Wealth AUM: $1.4 billion Core Revenue: $283 million (LTM) Branches: 93 Footprint: New England and New York Market Capitalization: $835 million NYSE: BHLB 3 Note: All data as of 03/31/16
1Q16 Strategic Highlights Demonstrating positive operating leverage Core revenue increased 3% Q/Q Core expenses decreased 2% Q/Q Efficiency ratio of 59.9% Active balance sheet management Improving asset mix to support yields Focused on balanced loan and deposit growth Developing secondary market channels to broaden loan origination capacity Maintained asset sensitive IRR profile Expanded SBA platform Welcomed 44 Business Capital operations and team Added to overall SBA leadership team #13 in the US for SBA unit production Ongoing branch optimization Announced sale of 2 NY branches (expected to close in 3Q16) 23 branches consolidated, closed or sold in last 4 years Rolled out Text: AMEB1 platform and instant customer feedback tool in branches 4
Core Earnings Momentum 5 Note: Growth includes acquisitions. GAAP EPS was $1.49 for FY12 and $2.08 for 1Q16 annualized. GAAP revenue was $197 million and $292 million for those same periods. 8% Core EPS Growth (1Q16/1Q15) 26% Core Revenue Growth (1Q16/1Q15) (annualized) $196 $293 $1.98 $2.16 $1.50 $1.60 $1.70 $1.80 $1.90 $2.00 $2.10 $2.20 $100 $120 $140 $160 $180 $200 $220 $240 $260 $280 $300 2012 2013 2014 2015 1Q16 Core Revenue Core EPS $ Millions
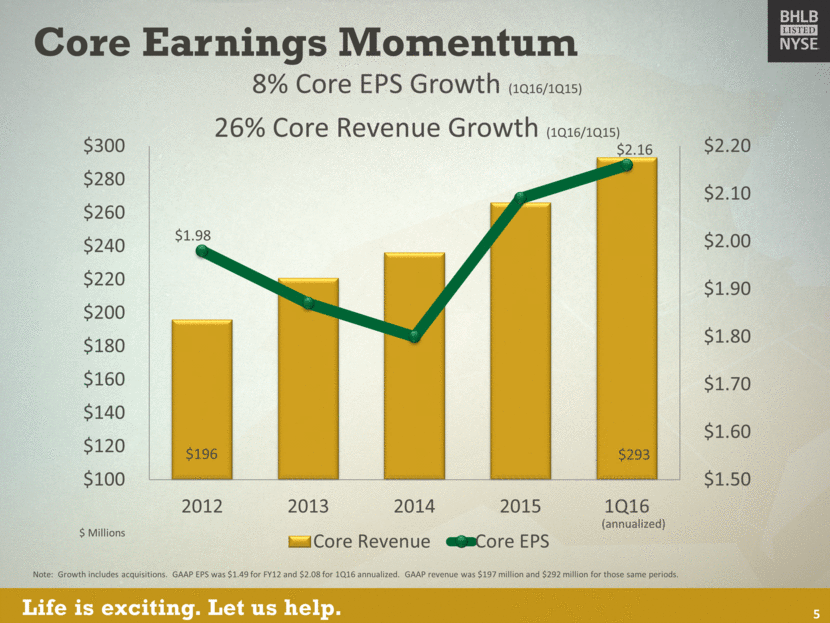
Diversified Loan and Deposit Mix 6 Note: CML Portfolio 55% of Total Loans Note: Non-maturity Deposits 63% of Total Deposits 19% 8% 25% 11% 37% Deposit Mix DDA NOW MM Savings Time 5% 26% 6% 18% 31% 14% Loan Mix CML Construction Investment CRE Owner Occ CRE C&I Residential Mortgage Consumer
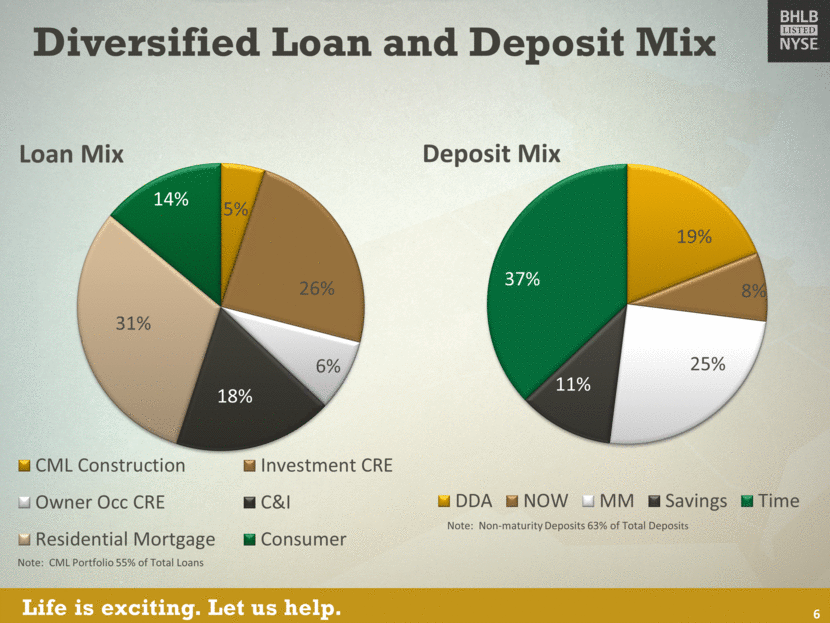
Diversified Loan Growth Strategies $ Millions 21% increase in total loans LTM 7% total organic loan growth LTM 7% organic CML loan growth LTM Strategic growth in relationship based C&I Leveraging deal flow from team recruitment Continued market share growth Specialty lending expertise ABL Equipment financing (Firestone Financial) SBA guaranteed 7 Note: LTM loan growth as of 3/31/16; organic growth excludes acquisitions $500 $700 $900 $1,100 $1,300 $1,500 $1,700 $1,900 $2,100 $2,300 Mortgage CRE C&I Consumer $1,754 $2,100 $1,054 $819 2012 2013 2014 2015 1Q16
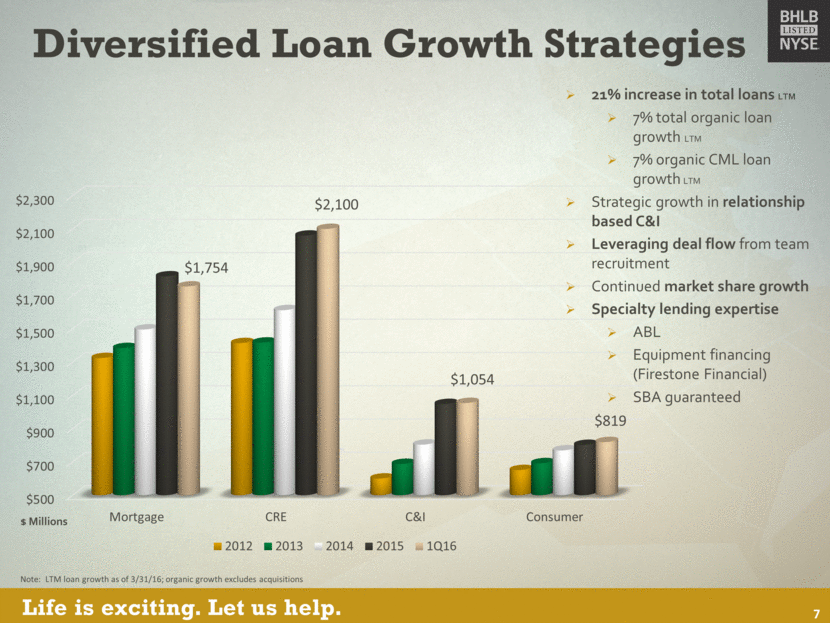
Strong Credit Quality 8 Disciplined credit standards Continued improvement in overall credit quality 193% ALLL to Non-accrual loans (1Q16) 0.26% 0.23% 0.52% 0.28% 0.00% 0.10% 0.20% 0.30% 0.40% 0.50% 0.60% 0.70% 0.80% 0.90% 1.00% 2012 2013 2014 2015 1Q16 NCO/Avg Loans NPA/Assets
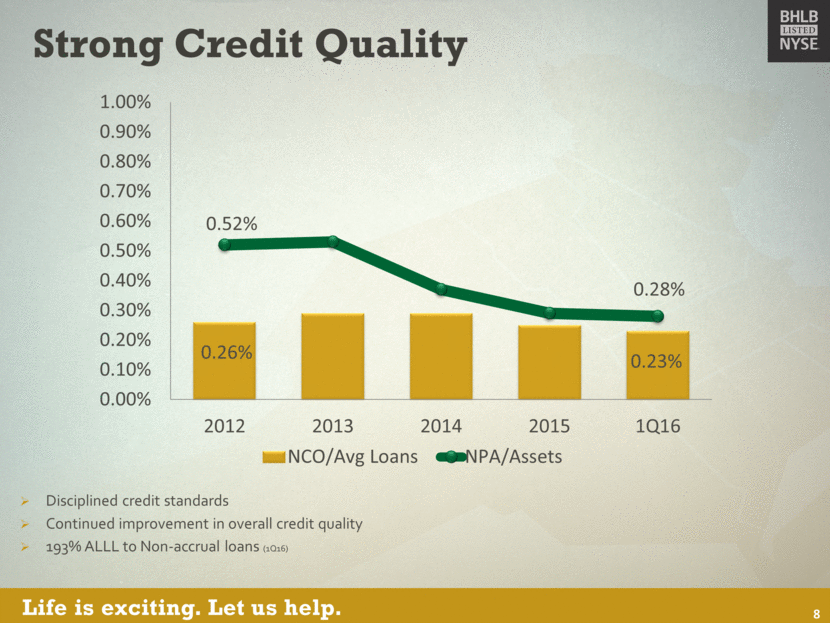
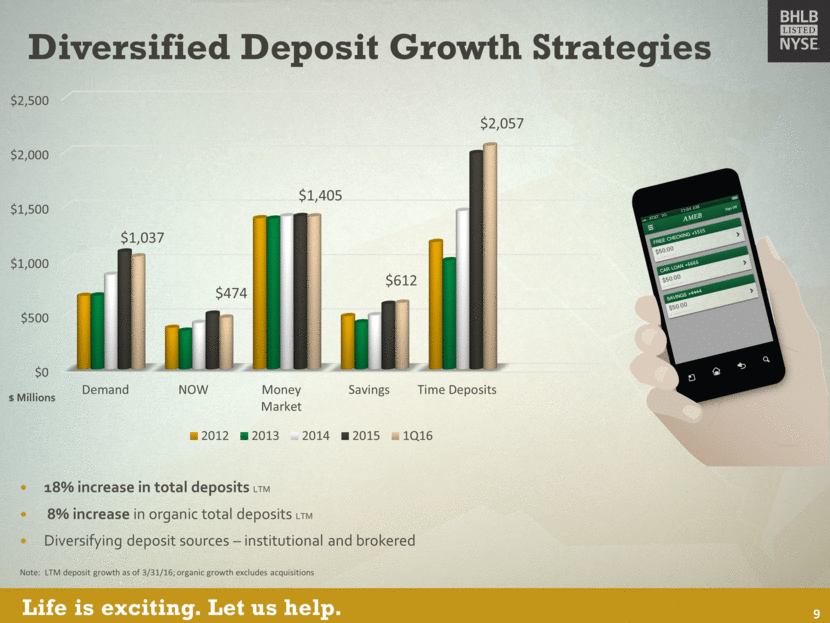
Diversified Deposit Growth Strategies 18% increase in total deposits LTM 8% increase in organic total deposits LTM Diversifying deposit sources – institutional and brokered 9 Note: LTM deposit growth as of 3/31/16; organic growth excludes acquisitions $0 $500 $1,000 $1,500 $2,000 $2,500 Demand NOW Money Market Savings Time Deposits $1,037 $474 $1,405 $612 $2,057 2012 2013 2014 2015 1Q16 $ Millions
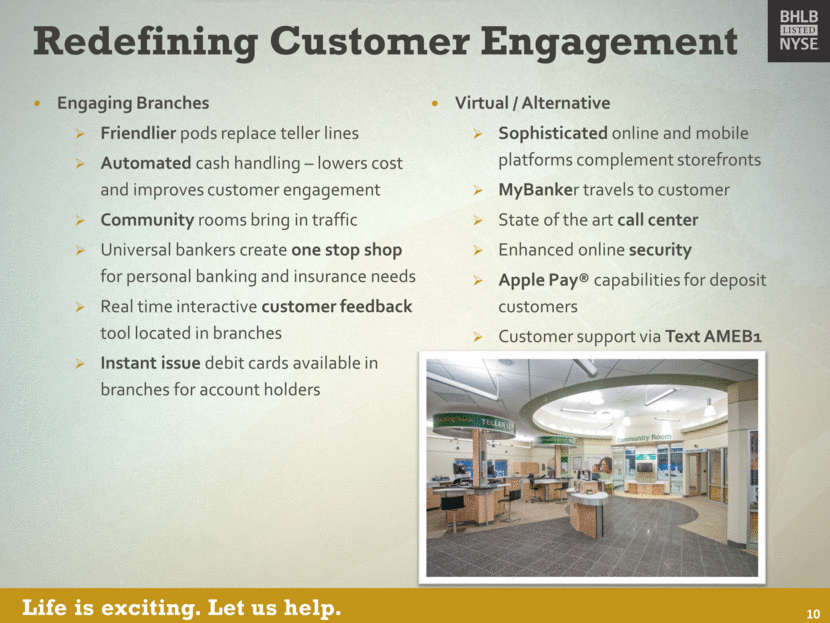
Redefining Customer Engagement Engaging Branches Friendlier pods replace teller lines Automated cash handling – lowers cost and improves customer engagement Community rooms bring in traffic Universal bankers create one stop shop for personal banking and insurance needs Real time interactive customer feedback tool located in branches Instant issue debit cards available in branches for account holders Virtual / Alternative Sophisticated online and mobile platforms complement storefronts MyBanker travels to customer State of the art call center Enhanced online security Apple Pay® capabilities for deposit customers Customer support via Text AMEB1 10
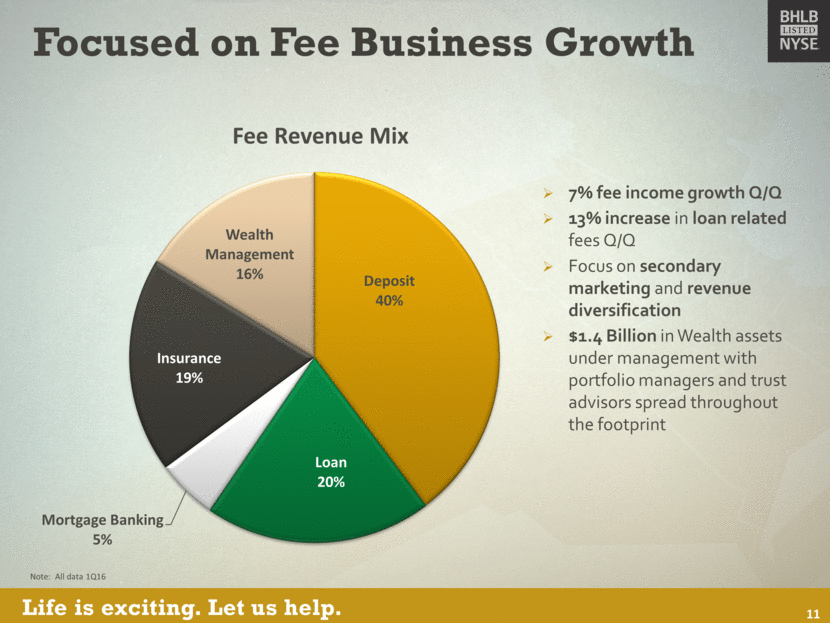
Note: All data 1Q16 Focused on Fee Business Growth 11 7% fee income growth Q/Q 13% increase in loan related fees Q/Q Focus on secondary marketing and revenue diversification $1.4 Billion in Wealth assets under management with portfolio managers and trust advisors spread throughout the footprint Deposit 40% Loan 20% Mortgage Banking 5% Insurance 19% Wealth Management 16% Fee Revenue Mix
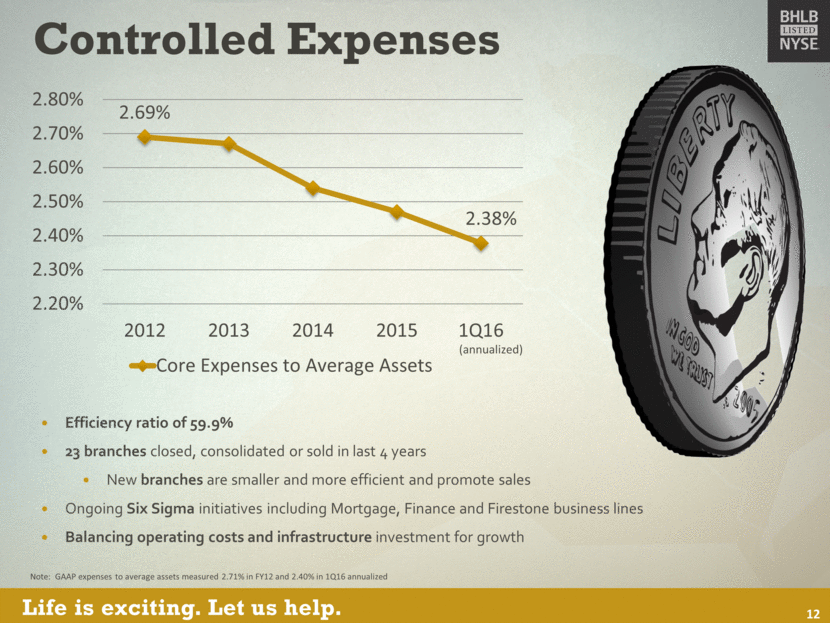
Controlled Expenses Efficiency ratio of 59.9% 23 branches closed, consolidated or sold in last 4 years New branches are smaller and more efficient and promote sales Ongoing Six Sigma initiatives including Mortgage, Finance and Firestone business lines Balancing operating costs and infrastructure investment for growth 12 Note: GAAP expenses to average assets measured 2.71% in FY12 and 2.40% in 1Q16 annualized (annualized) 2.69% 2.38% 2.20% 2.30% 2.40% 2.50% 2.60% 2.70% 2.80% 2012 2013 2014 2015 1Q16 Core Expenses to Average Assets
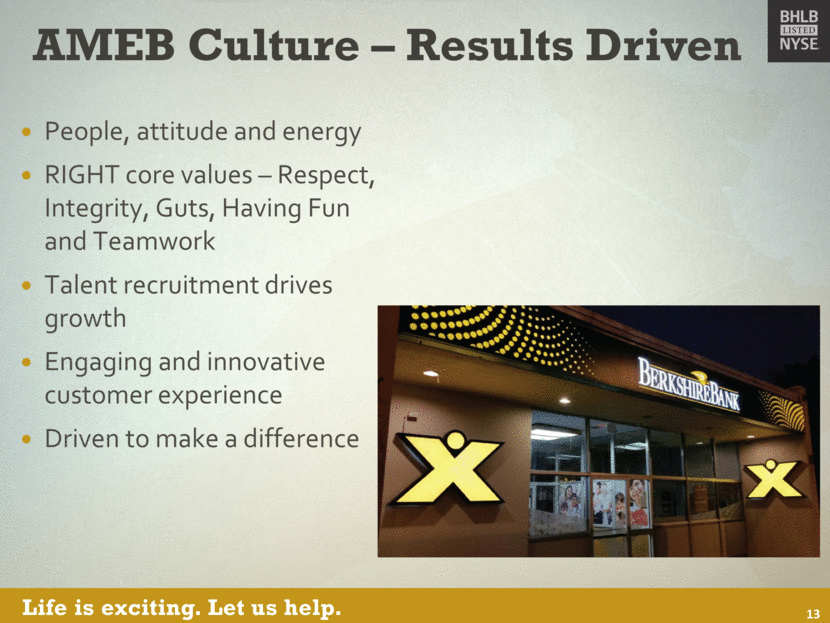
AMEB Culture – Results Driven People, attitude and energy RIGHT core values – Respect, Integrity, Guts, Having Fun and Teamwork Talent recruitment drives growth Engaging and innovative customer experience Driven to make a difference 13
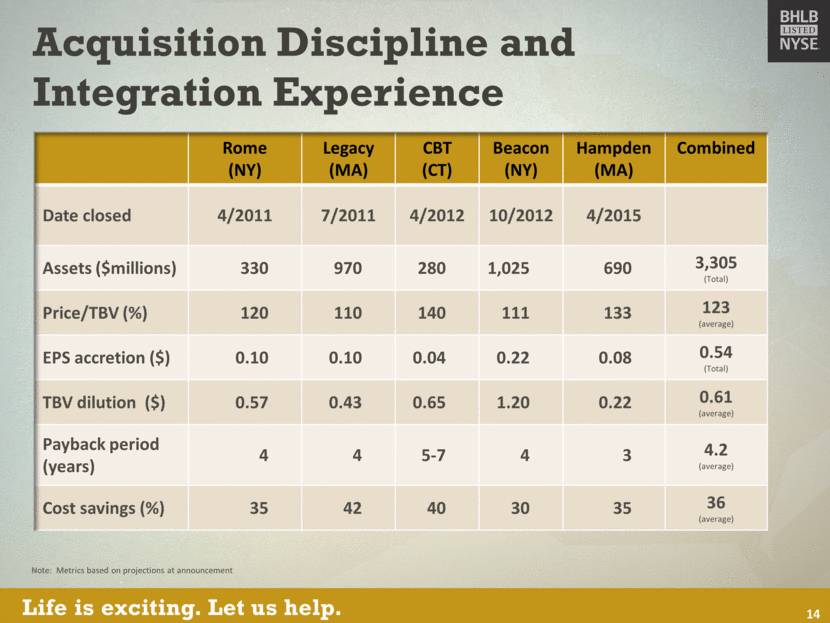
Acquisition Discipline and Integration Experience 14 Rome (NY) Legacy (MA) CBT (CT) Beacon (NY) Hampden (MA) Combined Date closed 4/2011 7/2011 4/2012 10/2012 4/2015 Assets ($millions) 330 970 280 1,025 690 3,305 (Total) Price/TBV (%) 120 110 140 111 133 123 (average) EPS accretion ($) 0.10 0.10 0.04 0.22 0.08 0.54 (Total) TBV dilution ($) 0.57 0.43 0.65 1.20 0.22 0.61 (average) Payback period (years) 4 4 5-7 4 3 4.2 (average) Cost savings (%) 35 42 40 30 35 36 (average) Note: Metrics based on projections at announcement
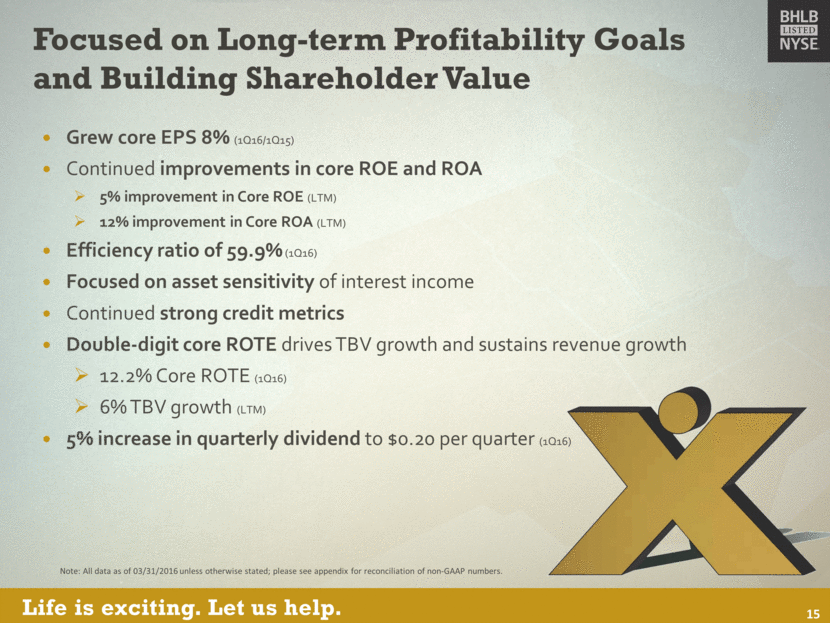
Focused on Long-term Profitability Goals and Building Shareholder Value Grew core EPS 8% (1Q16/1Q15) Continued improvements in core ROE and ROA 5% improvement in Core ROE (LTM) 12% improvement in Core ROA (LTM) Efficiency ratio of 59.9% (1Q16) Focused on asset sensitivity of interest income Continued strong credit metrics Double-digit core ROTE drives TBV growth and sustains revenue growth 12.2% Core ROTE (1Q16) 6% TBV growth (LTM) 5% increase in quarterly dividend to $0.20 per quarter (1Q16) Note: All data as of 03/31/2016 unless otherwise stated; please see appendix for reconciliation of non-GAAP numbers. 15
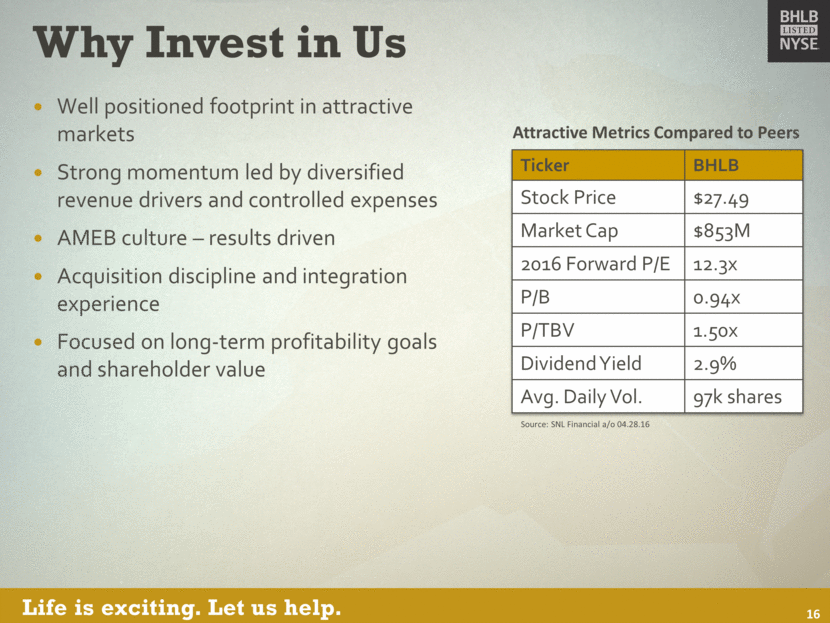
Why Invest in Us Well positioned footprint in attractive markets Strong momentum led by diversified revenue drivers and controlled expenses AMEB culture – results driven Acquisition discipline and integration experience Focused on long-term profitability goals and shareholder value Ticker BHLB Stock Price $27.49 Market Cap $853M 2016 Forward P/E 12.3x P/B 0.94x P/TBV 1.50x Dividend Yield 2.9% Avg. Daily Vol. 97k shares Source: SNL Financial a/o 04.28.16 Attractive Metrics Compared to Peers 16
Appendix Financial Performance and Goals Non-GAAP Reconciliation Forward-Looking Statements Disclaimer 17
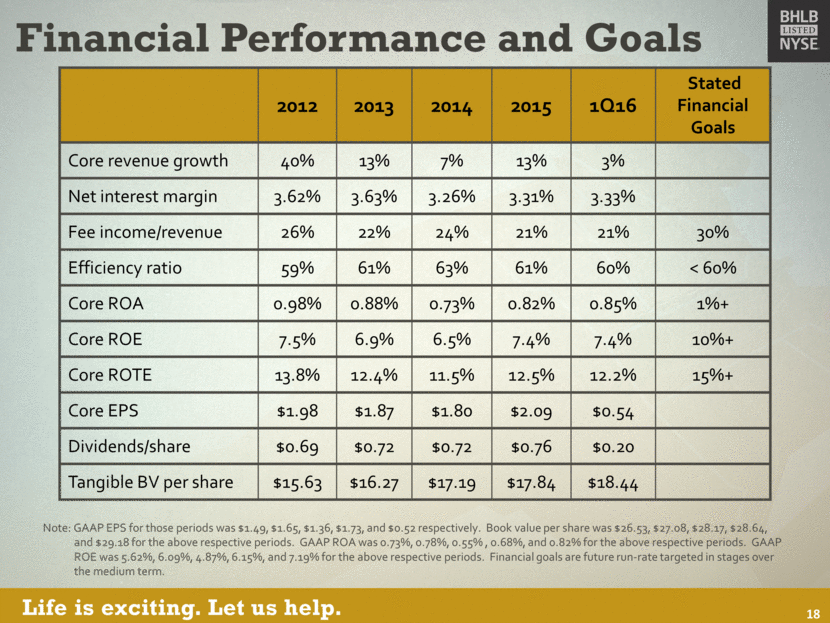
Financial Performance and Goals 2012 2013 2014 2015 1Q16 Stated Financial Goals Core revenue growth 40% 13% 7% 13% 3% Net interest margin 3.62% 3.63% 3.26% 3.31% 3.33% Fee income/revenue 26% 22% 24% 21% 21% 30% Efficiency ratio 59% 61% 63% 61% 60% < 60% Core ROA 0.98% 0.88% 0.73% 0.82% 0.85% 1%+ Core ROE 7.5% 6.9% 6.5% 7.4% 7.4% 10%+ Core ROTE 13.8% 12.4% 11.5% 12.5% 12.2% 15%+ Core EPS $1.98 $1.87 $1.80 $2.09 $0.54 Dividends/share $0.69 $0.72 $0.72 $0.76 $0.20 Tangible BV per share $15.63 $16.27 $17.19 $17.84 $18.44 18 Note: GAAP EPS for those periods was $1.49, $1.65, $1.36, $1.73, and $0.52 respectively. Book value per share was $26.53, $27.08, $28.17, $28.64, and $29.18 for the above respective periods. GAAP ROA was 0.73%, 0.78%, 0.55% , 0.68%, and 0.82% for the above respective periods. GAAP ROE was 5.62%, 6.09%, 4.87%, 6.15%, and 7.19% for the above respective periods. Financial goals are future run-rate targeted in stages over the medium term.
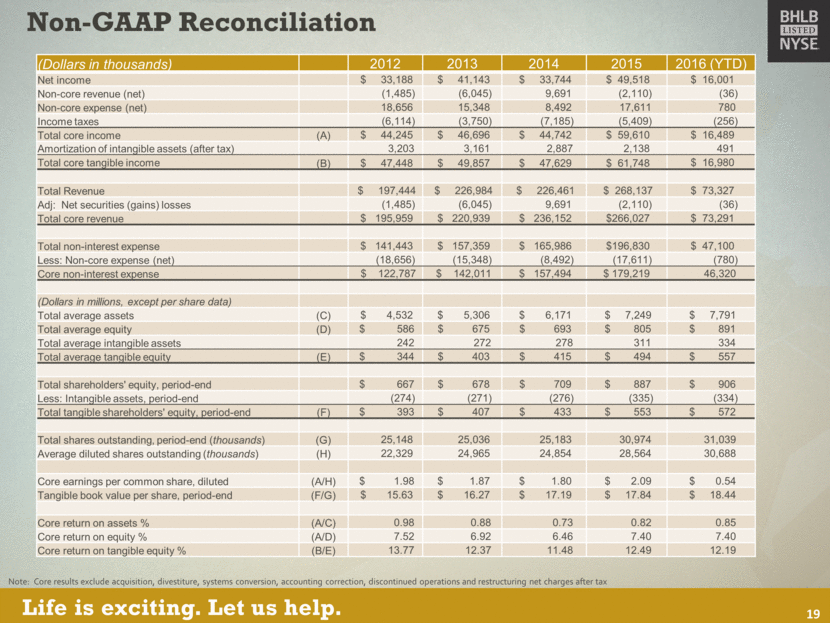
Non-GAAP Reconciliation Note: Core results exclude acquisition, divestiture, systems conversion, accounting correction, discontinued operations and restructuring net charges after tax 19 (Dollars in thousands) 2012 2013 2014 2015 2016 (YTD) Net income $ 33,188 $ 41,143 $ 33,744 $ 49,518 $ 16,001 Non-core revenue (net) (1,485) (6,045) 9,691 (2,110) (36) Non-core expense (net) 18,656 15,348 8,492 17,611 780 Income taxes (6,114) (3,750) (7,185) (5,409) (256) Total core income (A) $ 44,245 $ 46,696 $ 44,742 $ 59,610 $ 16,489 Amortization of intangible assets (after tax) 3,203 3,161 2,887 2,138 491 Total core tangible income (B) $ 47,448 $ 49,857 $ 47,629 $ 61,748 $ 16,980 Total Revenue $ 197,444 $ 226,984 $ 226,461 $ 268,137 $ 73,327 Adj: Net securities (gains) losses (1,485) (6,045) 9,691 (2,110) (36) Total core revenue $ 195,959 $ 220,939 $ 236,152 $266,027 $ 73,291 Total non-interest expense $ 141,443 $ 157,359 $ 165,986 $196,830 $ 47,100 Less: Non-core expense (net) (18,656) (15,348) (8,492) (17,611) (780) Core non-interest expense $ 122,787 $ 142,011 $ 157,494 $ 179,219 46,320 (Dollars in millions, except per share data) Total average assets (C) $ 4,532 $ 5,306 $ 6,171 $ 7,249 $ 7,791 Total average equity (D) $ 586 $ 675 $ 693 $ 805 $ 891 Total average intangible assets 242 272 278 311 334 Total average tangible equity (E) $ 344 $ 403 $ 415 $ 494 $ 557 Total shareholders' equity, period-end $ 667 $ 678 $ 709 $ 887 $ 906 Less: Intangible assets, period-end (274) (271) (276) (335) (334) Total tangible shareholders' equity, period-end (F) $ 393 $ 407 $ 433 $ 553 $ 572 Total shares outstanding, period-end (thousands) (G) 25,148 25,036 25,183 30,974 31,039 Average diluted shares outstanding (thousands) (H) 22,329 24,965 24,854 28,564 30,688 Core earnings per common share, diluted (A/H) $ 1.98 $ 1.87 $ 1.80 $ 2.09 $ 0.54 Tangible book value per share, period-end (F/G) $ 15.63 $ 16.27 $ 17.19 $ 17.84 $ 18.44 Core return on assets % (A/C) 0.98 0.88 0.73 0.82 0.85 Core return on equity % (A/D) 7.52 6.92 6.46 7.40 7.40 Core return on tangible equity % (B/E) 13.77 12.37 11.48 12.49 12.19
Forward Looking Statements This document contains forward-looking statements as defined in the Private Securities Litigation Reform Act of 1995. There are several factors that could cause actual results to differ significantly from expectations described in the forward-looking statements. For a discussion of such factors, please see Berkshire’s most recent reports on Forms 10-K and 10-Q filed with the Securities and Exchange Commission and available on the SEC’s website at www.sec.gov. Berkshire does not undertake any obligation to update forward looking statements. NON-GAAP FINANCIAL MEASURES This presentation references non-GAAP financial measures incorporating tangible equity and related measures, and core earnings excluding merger and other non-recurring costs. These measures are commonly used by investors in evaluating business combinations and financial condition. GAAP earnings are lower than core earnings primarily due to non-recurring merger and systems conversion related expenses. Reconciliations are in earnings releases at www.berkshirebank.com and attached in this presentation. 20
21 Notes

22 Notes

23 Notes

Life is exciting. Let us help. If you have any questions, please contact: Allison O’Rourke 99 North Street Pittsfield, MA 01202 Investor Relations Officer (413) 236-3149 aorourke@berkshirebank.com
