Attached files
| file | filename |
|---|---|
| EX-99.01 - EXHIBIT 99.01 - GLU MOBILE INC | a51333572ex99_01.htm |
| 8-K - GLU MOBILE INC. 8-K - GLU MOBILE INC | a51333572.htm |
Exhibit 99.02

Glu Mobile Inc.Q1 2016 Earnings CallMay 3, 2016 1
Safe Harbor Statement 2 This presentation contains "forward-looking" statements including: that we intend to focus on “winner takes all” “blue ocean genres, and our four game labels are ones where we believe we can be the best in the world in 2016/2017; that we are minimally exposed to increases in CPI; that strong social features in a game will lead to long tail revenues; Glu has multiple growth opportunities through wearables, the quad screen future, mobile ad spending and international expansion; the planned evolution of Glu’s business, including our intention to have our games function as platforms, our catalog cover fixed operating expenses and for new launches to account for less than 25% of revenues in a given year; the expected launch dates of Frontline Commando Rivals in various territories; that certain features in this game will be implemented in future updates; that the usage of chat and discussion boards in QuizUp drives retention; that there is an opportunity to create a primetime TV show featuring QuizUp; the expected launch dates of games featuring celebrities we have signed to long-term partnerships; that we believe we have a strong pipeline of games featuring celebrities that will be released in 2016 through 2017; our expected title release slate for 2016, including that additional games may be launched in the second half of 2016 if they pass our new central milestone process; the expected contribution margin flow through of our gross revenue; and our Q2-2016 and full year 2016 guidance. These forward-looking statements are subject to material risks and uncertainties that could cause actual results to differ materially from those in the forward-looking statements. Investors should consider important risk factors, which include: consumer demand for smartphones, tablets and next-generation platforms does not grow as significantly as we anticipate or that we will be unable to capitalize on any such growth; the risk that we do not realize a sufficient return on our investment with respect to our efforts to develop free-to-play games for smartphones and tablets; the risk that we do not maintain our good relationships with Apple and Google; the risk that Glu does not realize the anticipated strategic benefits from its celebrity partnerships and strategic investments; the risk that our development expenses are greater than we anticipate or that we experience product delays; the risk that our recently and newly launched games are less popular than anticipated; the risk that our newly released games will be of a quality less than desired by reviewers and consumers; the risk that the mobile games market, particularly with respect to social, free-to-play gaming, is smaller than anticipated; risks related to the restatement of certain of our historical financial statements and other risks detailed under the caption "Risk Factors" in our Form 10-K filed with the Securities and Exchange Commission on March 4, 2016 and our other SEC filings. You can locate these reports through our website at http://www.glu.com/investors. These "forward-looking" statements are based on estimates and information available to us on May 3, 2016 and we are under no obligation, and expressly disclaim any obligation, to update or alter our forward-looking statements whether as a result of new information, future events or otherwise.
Use of Non-GAAP Financial Measures 3 Glu uses in this presentation certain non-GAAP measures of financial performance. The presentation of these non-GAAP financial measures is not intended to be considered in isolation from, as a substitute for, or superior to, the financial information prepared and presented in accordance with GAAP, and may be different from non-GAAP financial measures used by other companies. In addition, these non-GAAP measures have limitations in that they do not reflect all of the amounts associated with Glu's results of operations as determined in accordance with GAAP. The non-GAAP financial measures used by Glu include non-GAAP revenue, non-GAAP smartphone revenue, non-GAAP cost of revenue, non-GAAP gross profit, non-GAAP gross margin, non-GAAP operating expenses, non-GAAP operating margin, non-GAAP net income/(loss), non-GAAP net income/(loss) per share, Adjusted EBITDA and Adjusted EBITDA margin. These non-GAAP financial measures exclude the following items from Glu's unaudited consolidated statements of operations: Change in deferred revenue and deferred cost of revenue;Amortization of intangible assets; Non-cash warrant expense;Stock-based compensation expense; Restructuring charges; Transitional costs; Litigation proceeds and costs;Change in fair value of strategic investments;Release of tax liabilities and valuation allowance; andForeign currency exchange gains and losses primarily related to the revaluation of assets and liabilities. In addition, Glu has included in this presentation “Adjusted EBITDA” figures which are used to evaluate Glu’s operating performance and is defined as non-GAAP operating income/(loss) excluding depreciation. Adjusted EBITDA margin is defined as Adjusted EBITDA divided by non-GAAP revenue.Glu believes that these non-GAAP financial measures, when taken together with the corresponding GAAP financial measures, provide meaningful supplemental information regarding Glu's performance by excluding certain items that may not be indicative of Glu's core business, operating results or future outlook. Glu's management uses, and believes that investors benefit from referring to, these non-GAAP financial measures in assessing Glu's operating results, as well as when planning, forecasting and analyzing future periods. These non-GAAP financial measures also facilitate comparisons of Glu's performance to prior periods. For a reconciliation of these non-GAAP financial measures to their most directly comparable GAAP financial measures, please refer to the tables at the end of this presentation.
4 Executive Summary

5

Strong Management Team Chris AkhavanChief Revenue Officer Eric R. LudwigCOO & CFO Niccolo de MasiChairman & CEO 6 Tim WilsonChief Technology Officer Nick EarlPresident of Studios
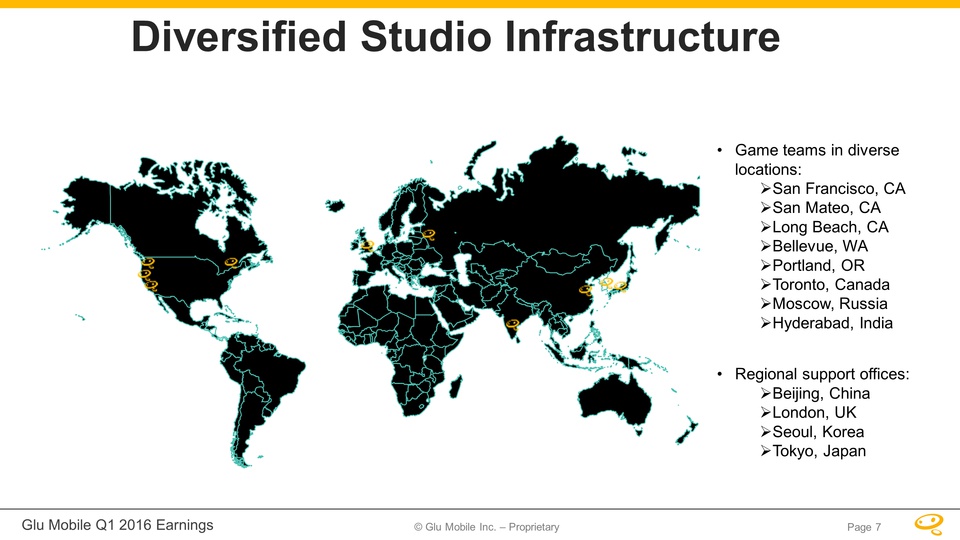
Diversified Studio Infrastructure Game teams in diverse locations:San Francisco, CASan Mateo, CALong Beach, CABellevue, WAPortland, ORToronto, CanadaMoscow, RussiaHyderabad, IndiaRegional support offices:Beijing, ChinaLondon, UKSeoul, KoreaTokyo, Japan 7
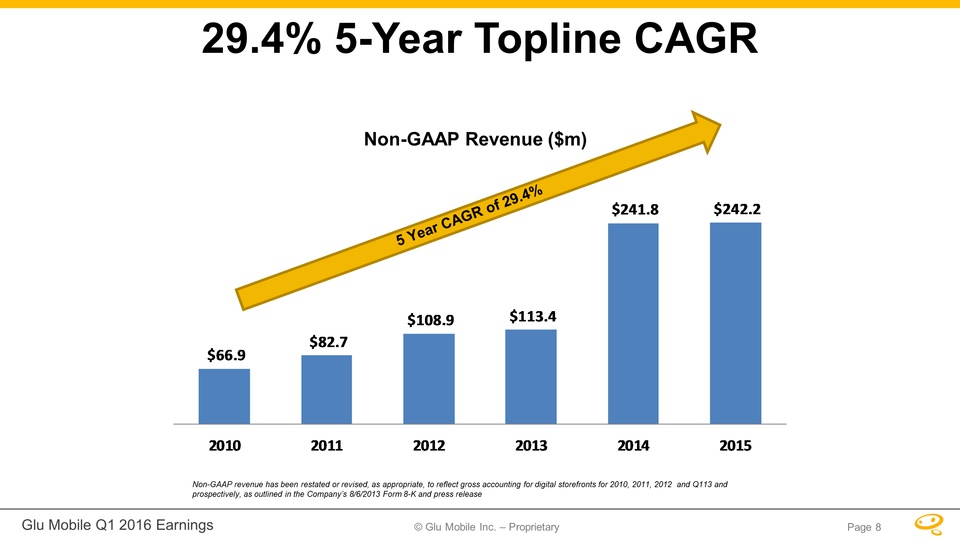
29.4% 5-Year Topline CAGR 5 Year CAGR of 29.4% Non-GAAP revenue has been restated or revised, as appropriate, to reflect gross accounting for digital storefronts for 2010, 2011, 2012 and Q113 and prospectively, as outlined in the Company’s 8/6/2013 Form 8-K and press release Non-GAAP Revenue ($m) 8
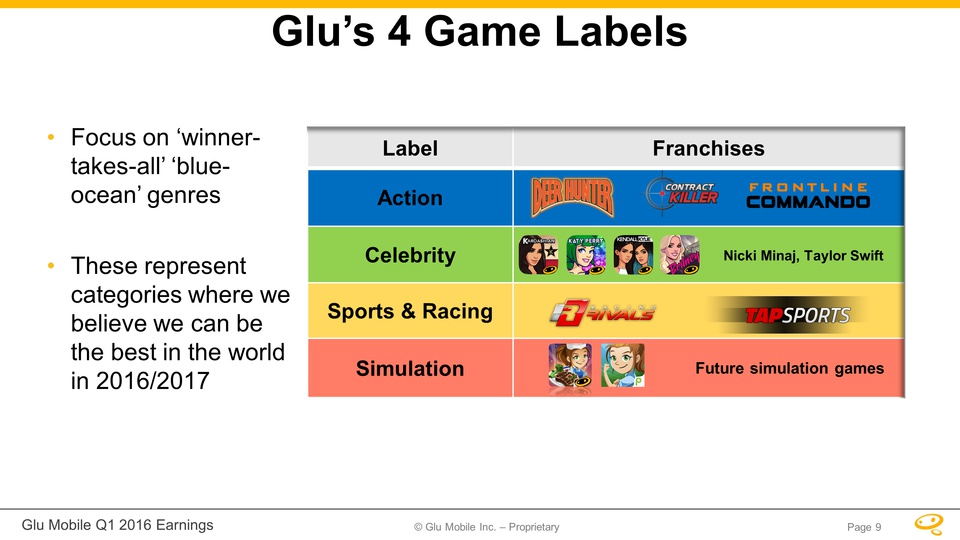
Glu’s 4 Game Labels 9 Label Franchises Action Celebrity Sports & Racing Simulation Focus on ‘winner-takes-all’ ‘blue-ocean’ genresThese represent categories where we believe we can be the best in the world in 2016/2017 Nicki Minaj, Taylor Swift Future simulation games
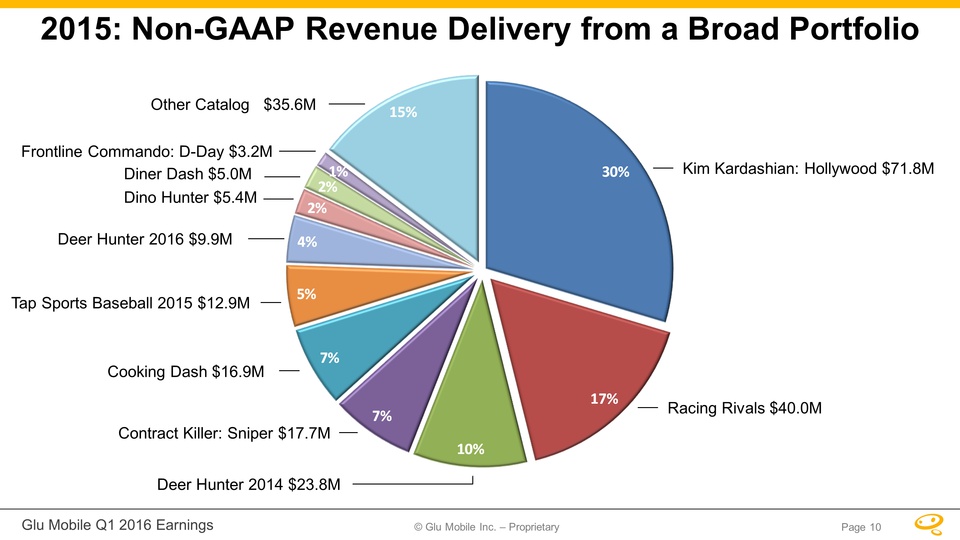
Deer Hunter 2016 $9.9M Kim Kardashian: Hollywood $71.8M Deer Hunter 2014 $23.8M Contract Killer: Sniper $17.7M Cooking Dash $16.9M Tap Sports Baseball 2015 $12.9M Dino Hunter $5.4M Diner Dash $5.0M Other Catalog $35.6M Frontline Commando: D-Day $3.2M 2015: Non-GAAP Revenue Delivery from a Broad Portfolio 10 Racing Rivals $40.0M
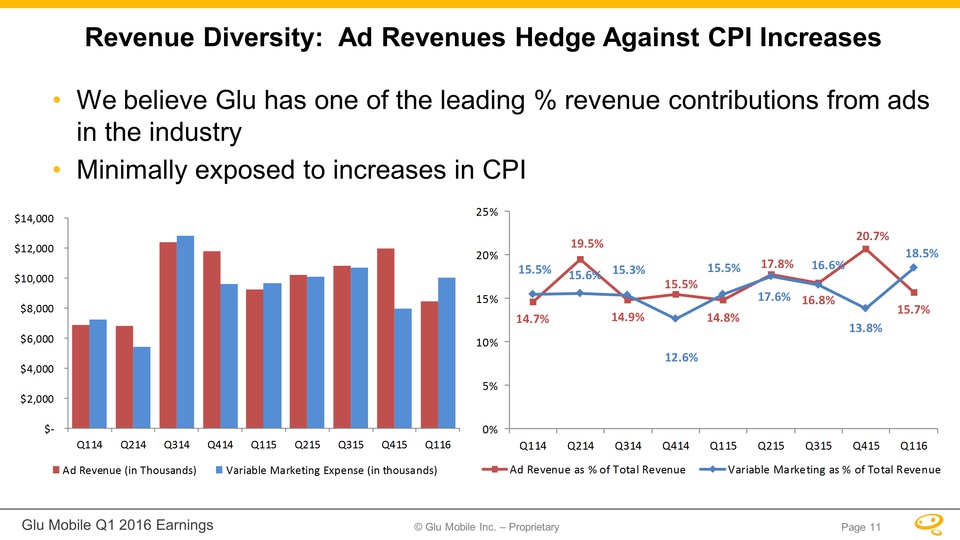
Revenue Diversity: Ad Revenues Hedge Against CPI Increases 11 We believe Glu has one of the leading % revenue contributions from ads in the industryMinimally exposed to increases in CPI
12

Growth Landscape 13
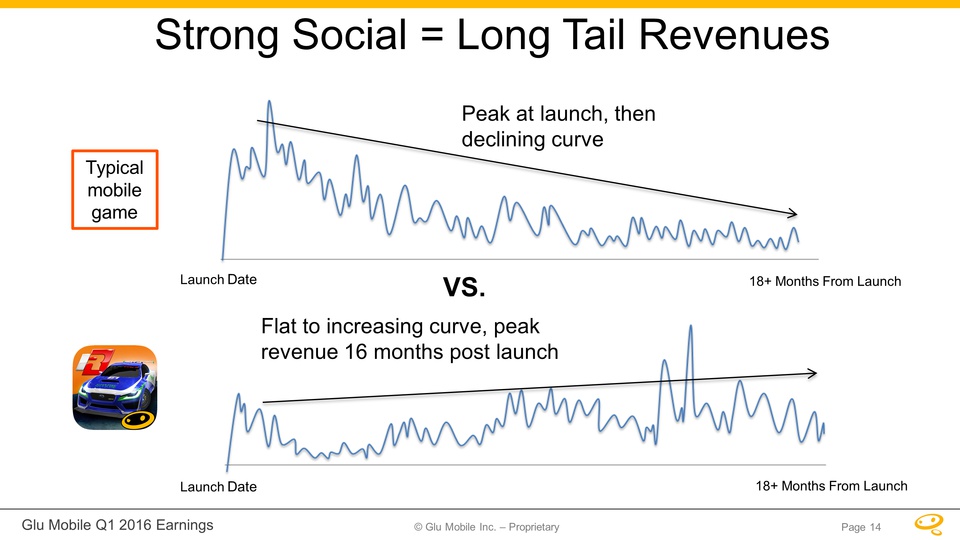
Typical mobile game Strong Social = Long Tail Revenues Peak at launch, then declining curve Flat to increasing curve, peak revenue 16 months post launch 14 VS. Launch Date 18+ Months From Launch 18+ Months From Launch Launch Date
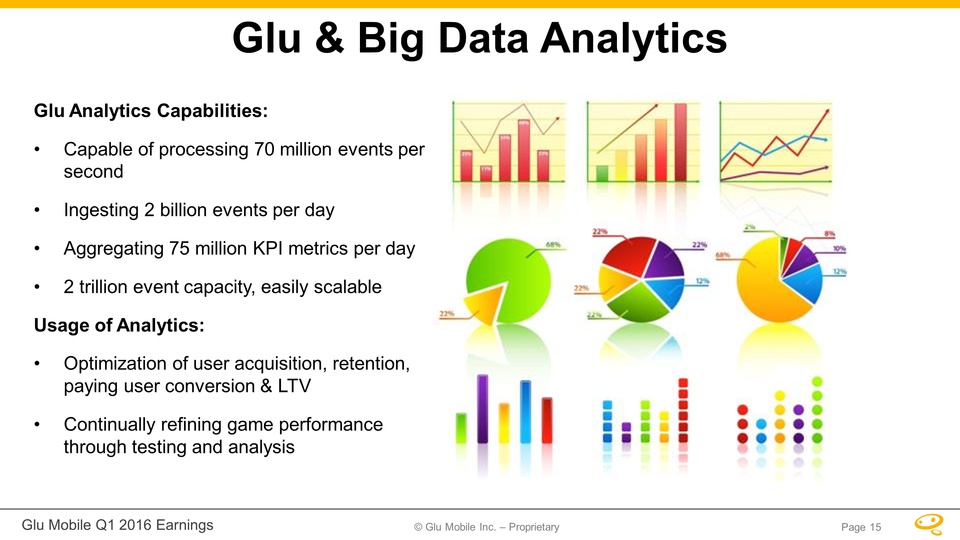
15 Glu Analytics Capabilities:Capable of processing 70 million events per secondIngesting 2 billion events per dayAggregating 75 million KPI metrics per day2 trillion event capacity, easily scalableUsage of Analytics:Optimization of user acquisition, retention, paying user conversion & LTVContinually refining game performance through testing and analysis Glu & Big Data Analytics
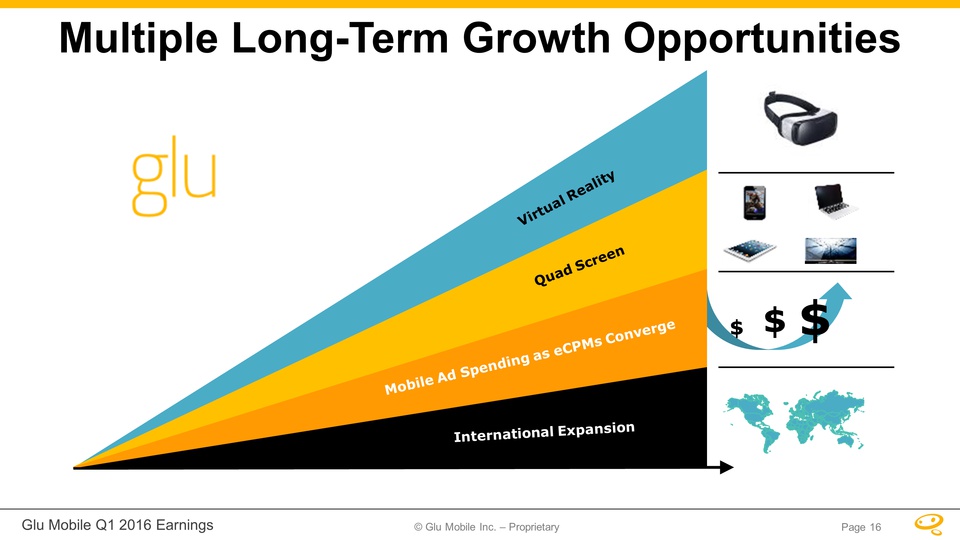
16 Multiple Long-Term Growth Opportunities $ $ $ Virtual Reality Quad Screen Mobile Ad Spending as eCPMs Converge International Expansion
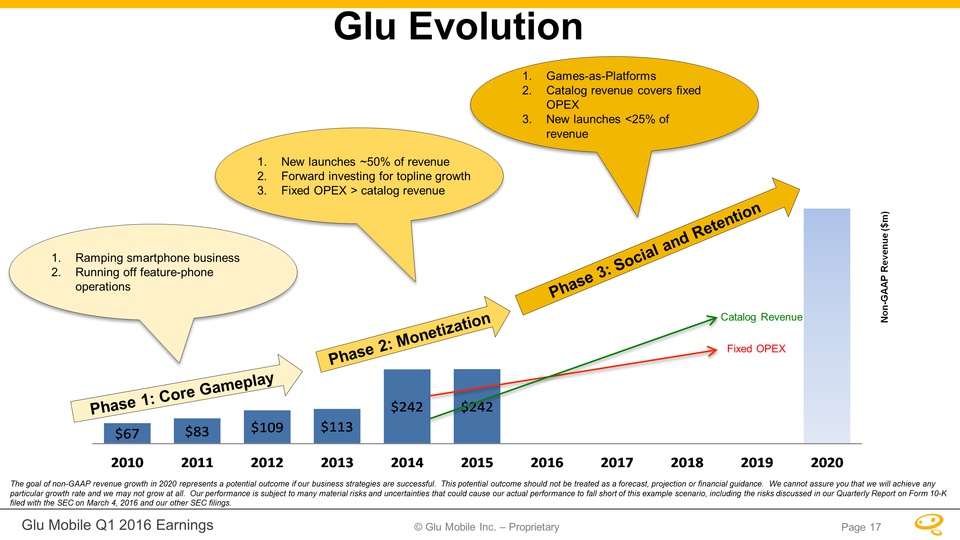
Glu Evolution Phase 1: Core Gameplay Phase 2: Monetization Phase 3: Social and Retention Ramping smartphone businessRunning off feature-phone operations New launches ~50% of revenueForward investing for topline growthFixed OPEX > catalog revenue Games-as-PlatformsCatalog revenue covers fixed OPEXNew launches <25% of revenue 17 Non-GAAP Revenue ($m) The goal of non-GAAP revenue growth in 2020 represents a potential outcome if our business strategies are successful. This potential outcome should not be treated as a forecast, projection or financial guidance. We cannot assure you that we will achieve any particular growth rate and we may not grow at all. Our performance is subject to many material risks and uncertainties that could cause our actual performance to fall short of this example scenario, including the risks discussed in our Quarterly Report on Form 10-K filed with the SEC on March 4, 2016 and our other SEC filings. Fixed OPEX Catalog Revenue

Tencent ‘WeFire West’ Publishing Partnership 18
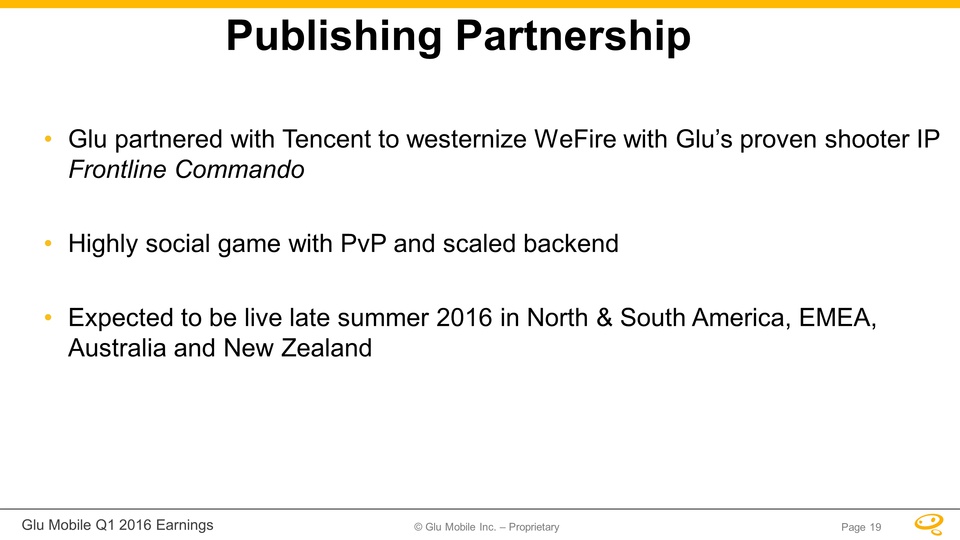
Publishing Partnership 19 Glu partnered with Tencent to westernize WeFire with Glu’s proven shooter IP Frontline CommandoHighly social game with PvP and scaled backendExpected to be live late summer 2016 in North & South America, EMEA, Australia and New Zealand
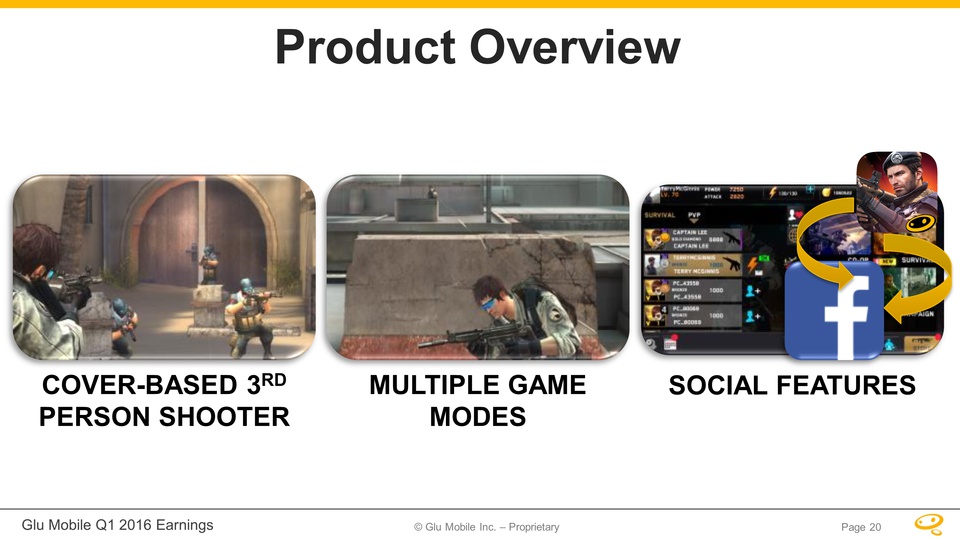
Product Overview COVER-BASED 3RD PERSON SHOOTER MULTIPLE GAME MODES SOCIAL FEATURES 20
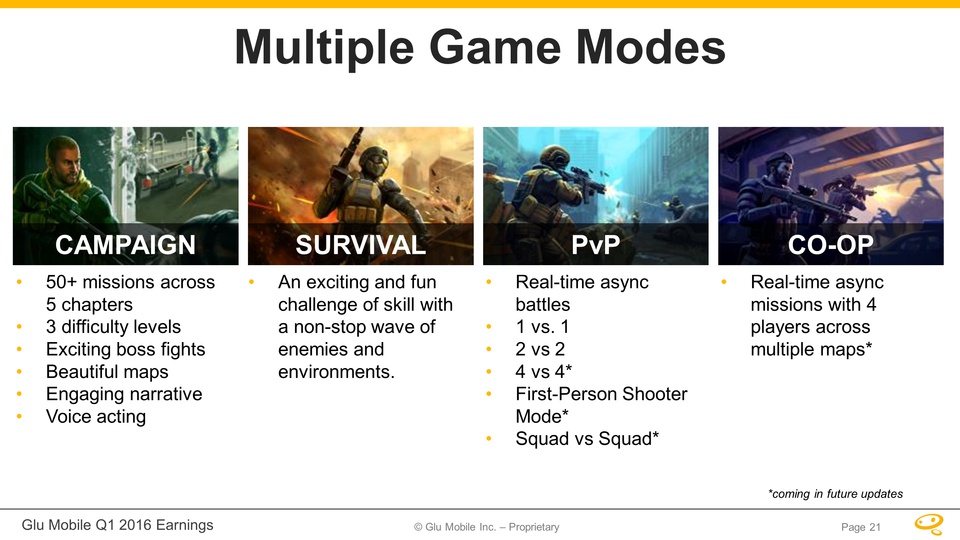
Multiple Game Modes CAMPAIGN SURVIVAL PvP CO-OP 50+ missions across 5 chapters3 difficulty levelsExciting boss fightsBeautiful mapsEngaging narrativeVoice acting An exciting and fun challenge of skill with a non-stop wave of enemies and environments. Real-time async battles1 vs. 1 2 vs 24 vs 4*First-Person Shooter Mode*Squad vs Squad* Real-time async missions with 4 players across multiple maps* 21 *coming in future updates

QuizUp Investment + Option to Buy 100%
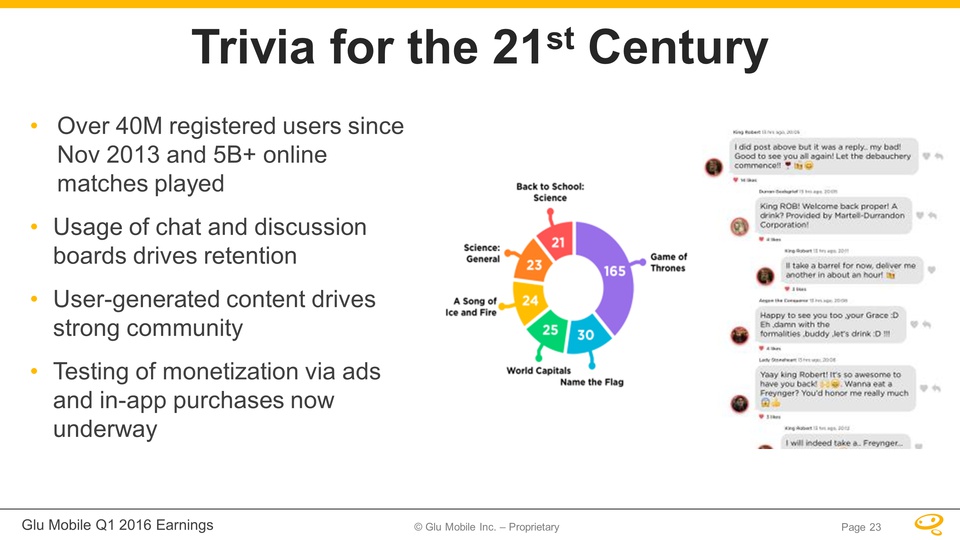
Trivia for the 21st Century Over 40M registered users since Nov 2013 and 5B+ online matches playedUsage of chat and discussion boards drives retention User-generated content drives strong communityTesting of monetization via ads and in-app purchases now underway 23

Opportunity for Primetime TV 24
User Engagement 25
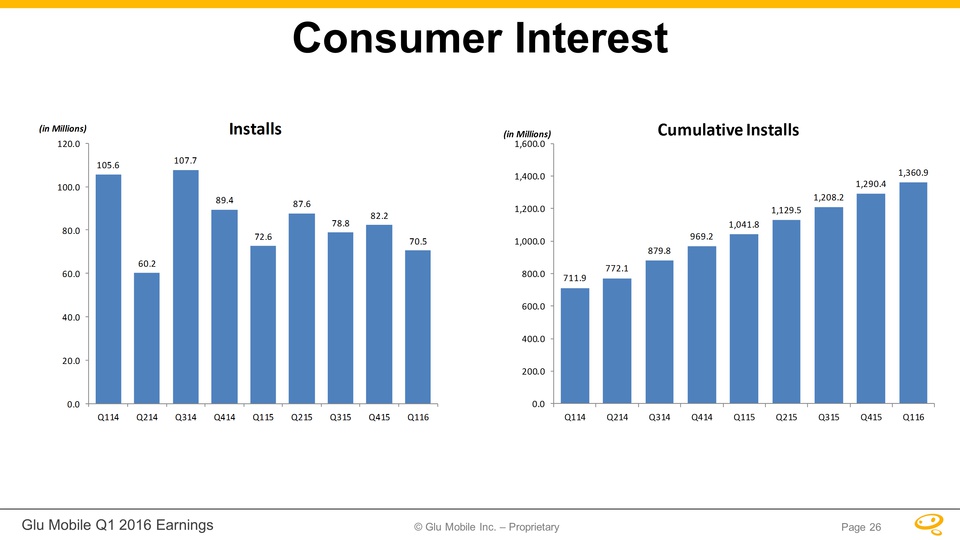
26 Consumer Interest
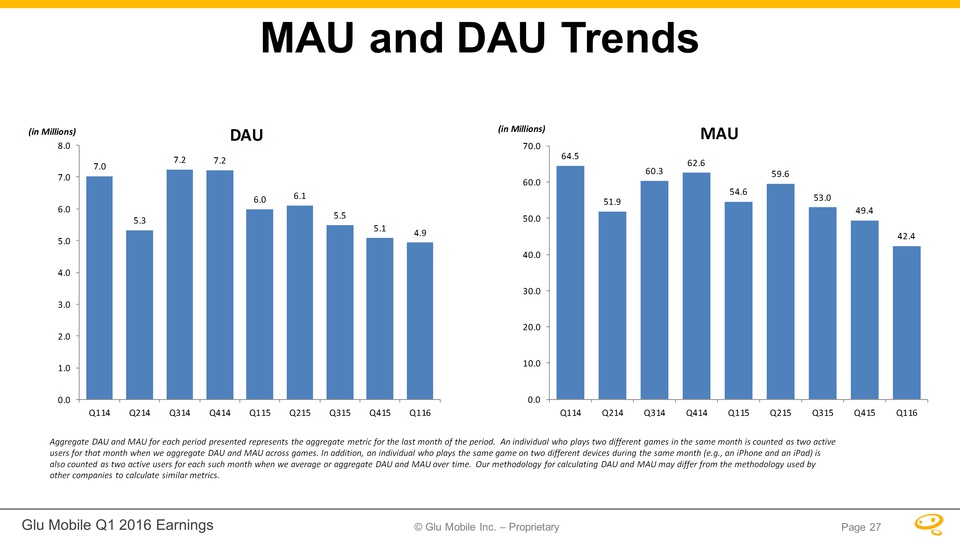
27 MAU and DAU Trends Aggregate DAU and MAU for each period presented represents the aggregate metric for the last month of the period. An individual who plays two different games in the same month is counted as two active users for that month when we aggregate DAU and MAU across games. In addition, an individual who plays the same game on two different devices during the same month (e.g., an iPhone and an iPad) is also counted as two active users for each such month when we average or aggregate DAU and MAU over time. Our methodology for calculating DAU and MAU may differ from the methodology used by other companies to calculate similar metrics.
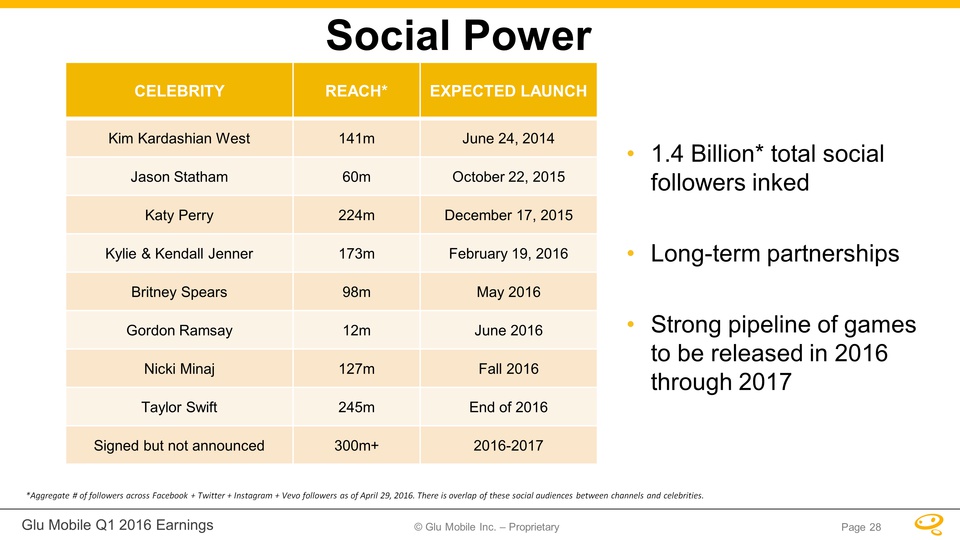
1.4 Billion* total social followers inkedLong-term partnershipsStrong pipeline of games to be released in 2016 through 2017 Social Power CELEBRITY REACH* EXPECTED LAUNCH Kim Kardashian West 141m June 24, 2014 Jason Statham 60m October 22, 2015 Katy Perry 224m December 17, 2015 Kylie & Kendall Jenner 173m February 19, 2016 Britney Spears 98m May 2016 Gordon Ramsay 12m June 2016 Nicki Minaj 127m Fall 2016 Taylor Swift 245m End of 2016 Signed but not announced 300m+ 2016-2017 *Aggregate # of followers across Facebook + Twitter + Instagram + Vevo followers as of April 29, 2016. There is overlap of these social audiences between channels and celebrities. 28

Financial Overview 29
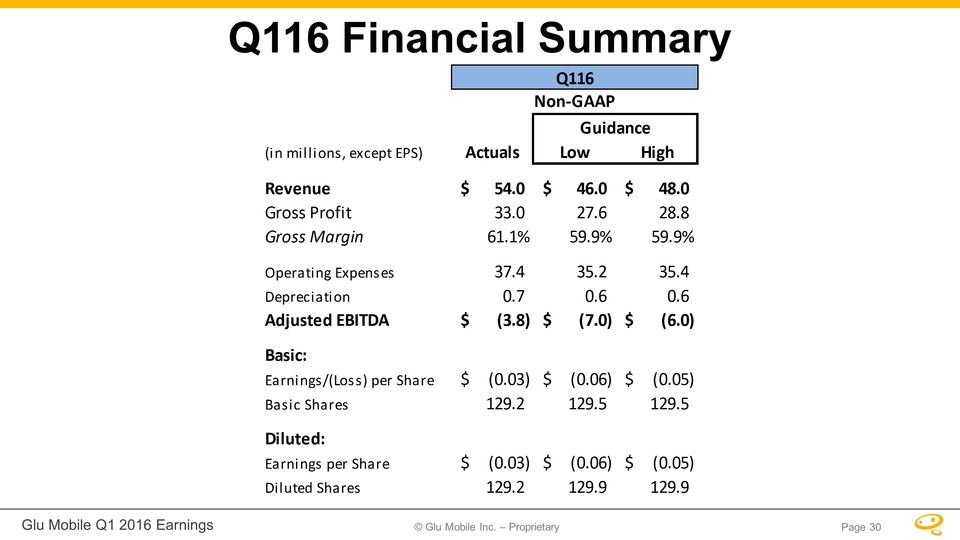
30 Q116 Financial Summary
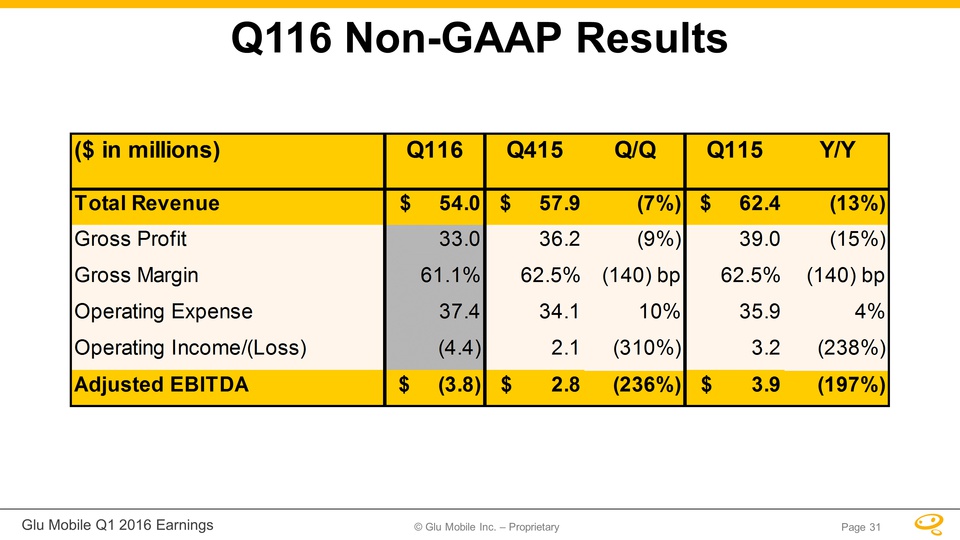
31 Q116 Non-GAAP Results
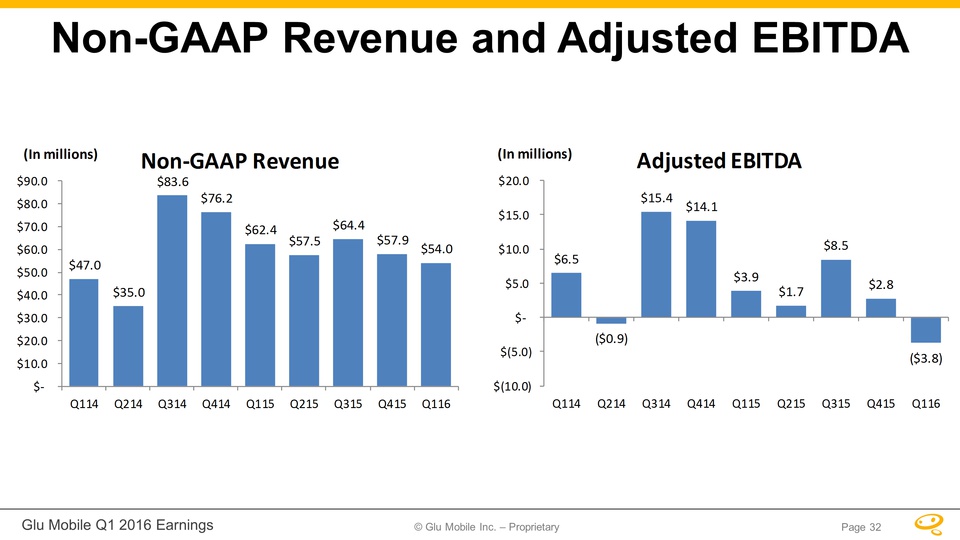
32 Non-GAAP Revenue and Adjusted EBITDA
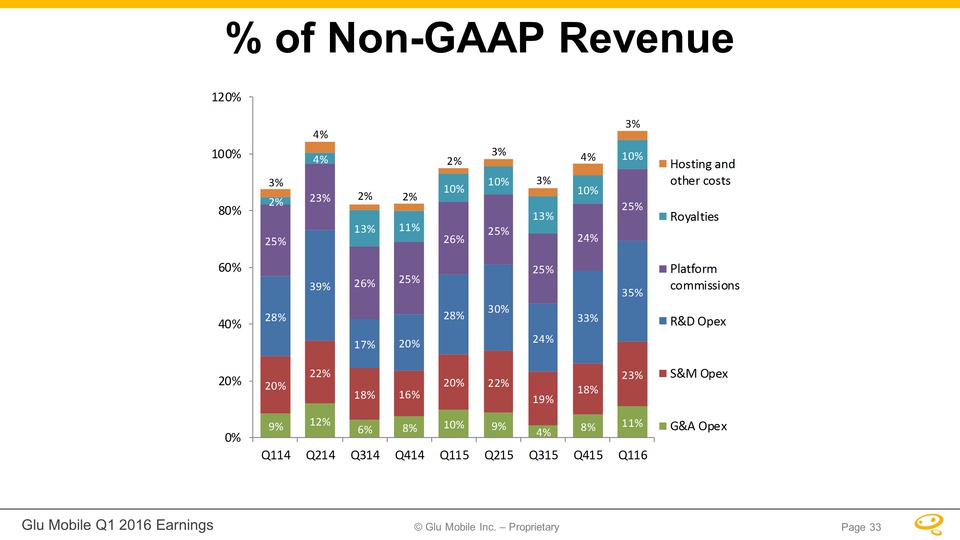
33 % of Non-GAAP Revenue
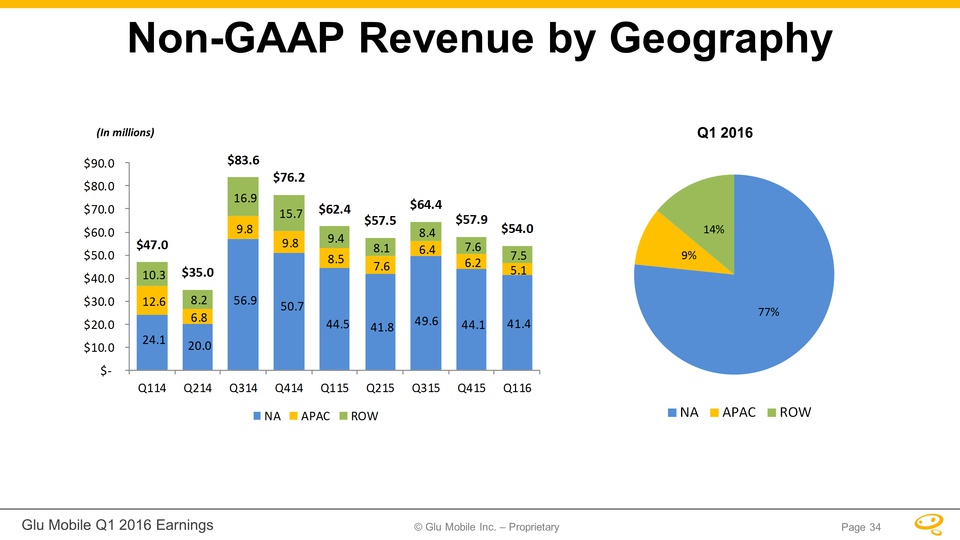
34 Non-GAAP Revenue by Geography Q1 2016 (In millions)
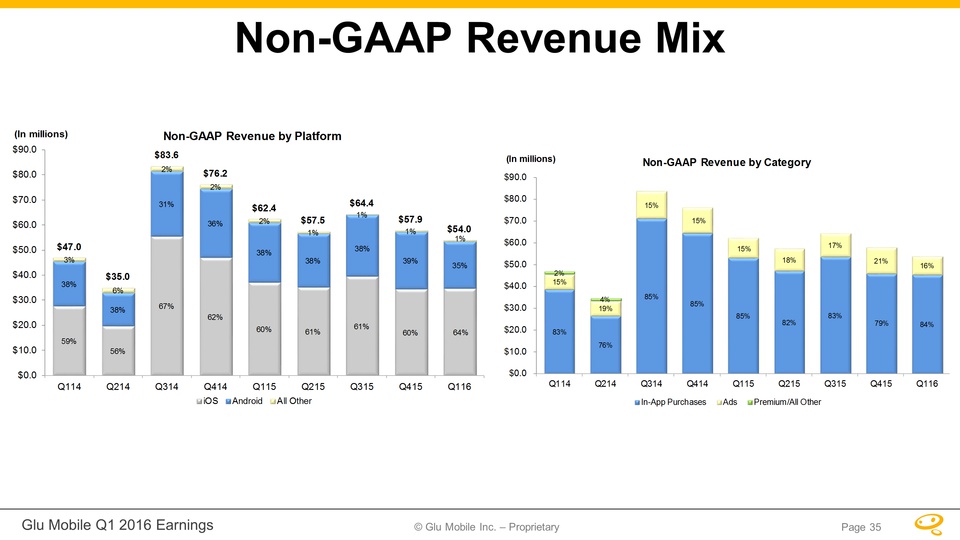
35 Non-GAAP Revenue Mix
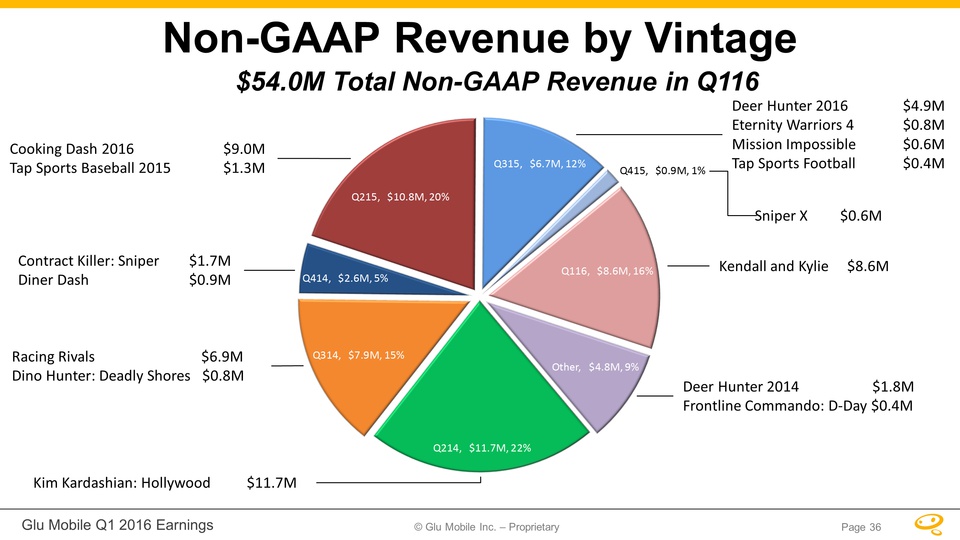
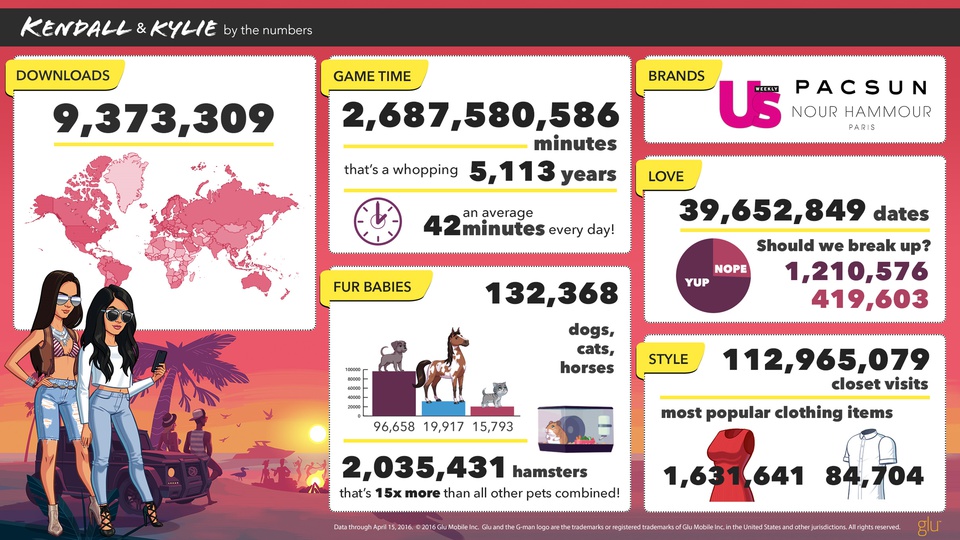
36 Non-GAAP Revenue by Vintage $54.0M Total Non-GAAP Revenue in Q116 Kim Kardashian: Hollywood $11.7M Racing Rivals $6.9MDino Hunter: Deadly Shores $0.8M Contract Killer: Sniper $1.7MDiner Dash $0.9M Cooking Dash 2016 $9.0MTap Sports Baseball 2015 $1.3M Deer Hunter 2016 $4.9MEternity Warriors 4 $0.8MMission Impossible $0.6MTap Sports Football $0.4M Deer Hunter 2014 $1.8MFrontline Commando: D-Day $0.4M Sniper X $0.6M Kendall and Kylie $8.6M
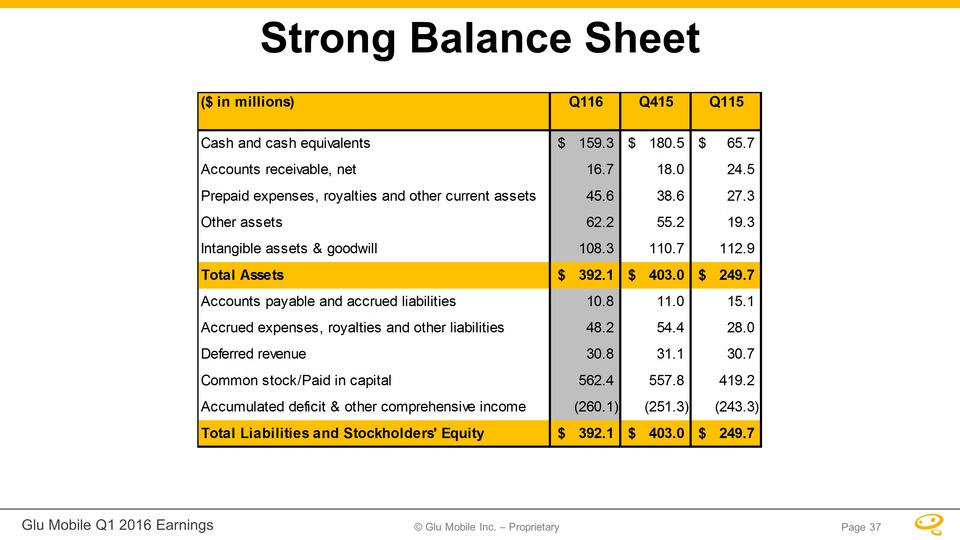
37 Strong Balance Sheet
38 Guidance
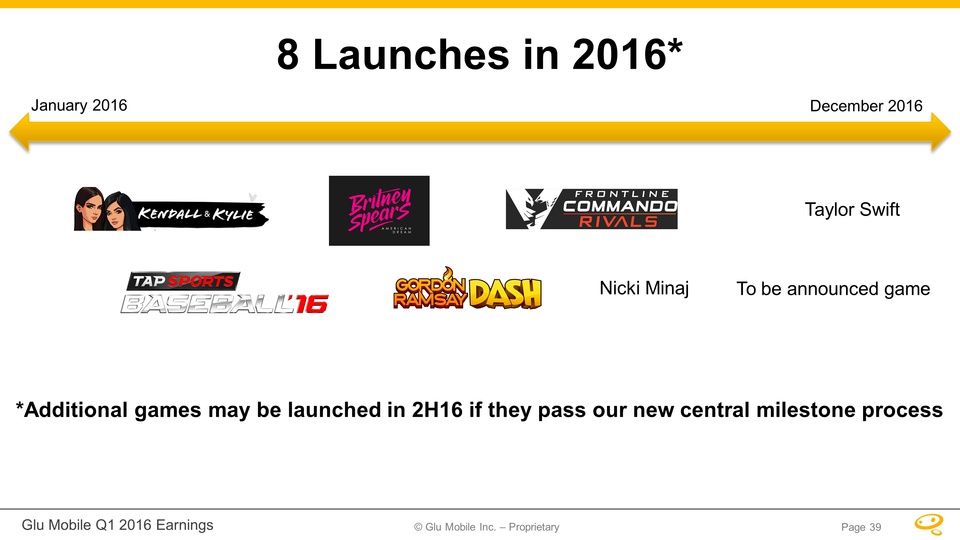
8 Launches in 2016* 39 *Additional games may be launched in 2H16 if they pass our new central milestone process January 2016 December 2016 Nicki Minaj Taylor Swift To be announced game
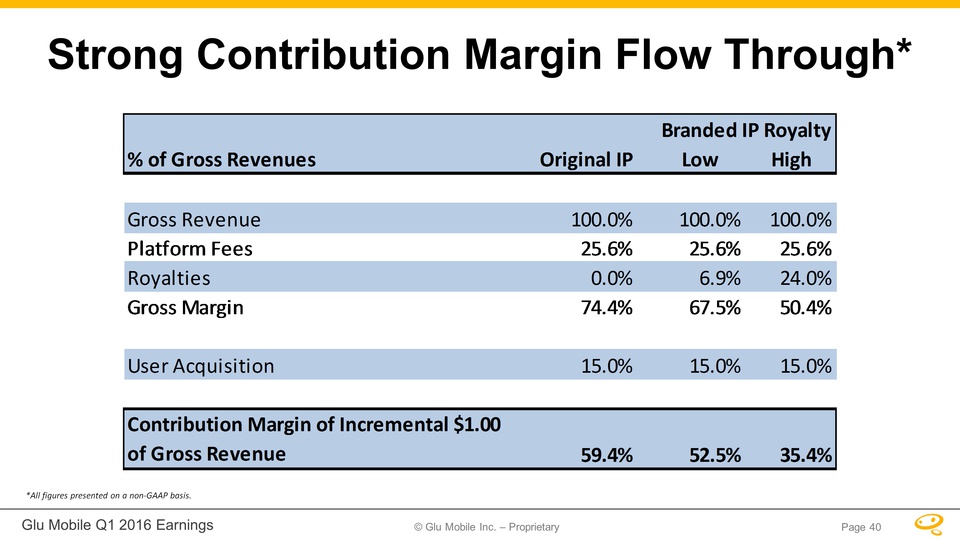
Strong Contribution Margin Flow Through* 40 *All figures presented on a non-GAAP basis.
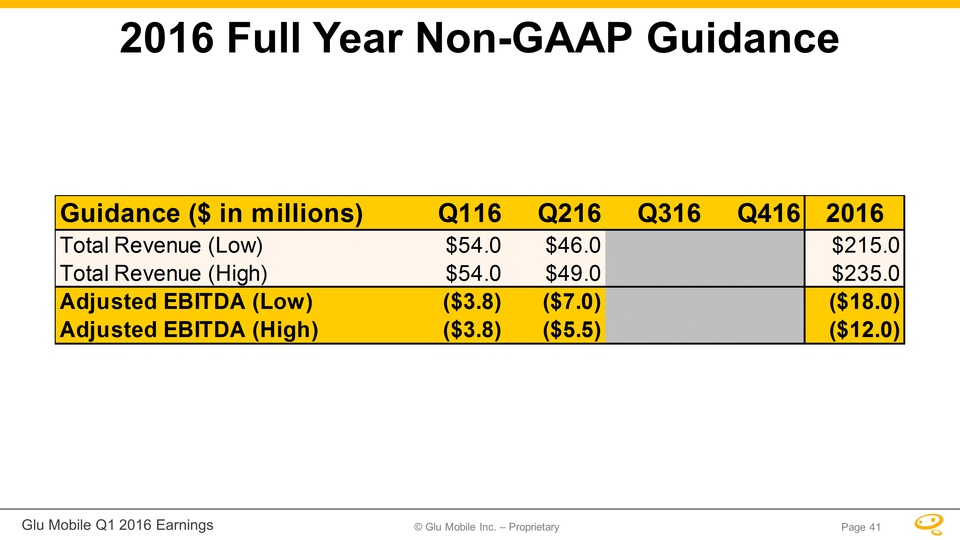
41 2016 Full Year Non-GAAP Guidance
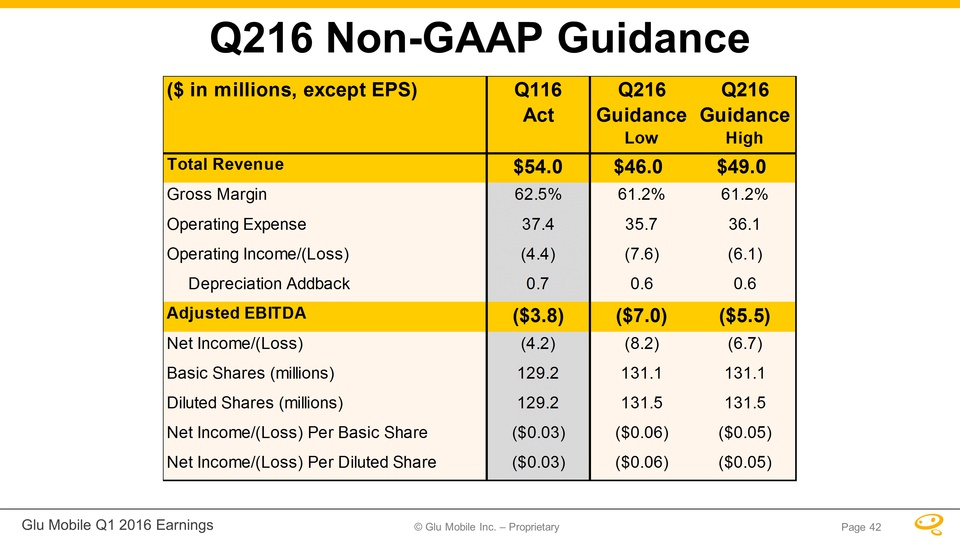
42 Q216 Non-GAAP Guidance
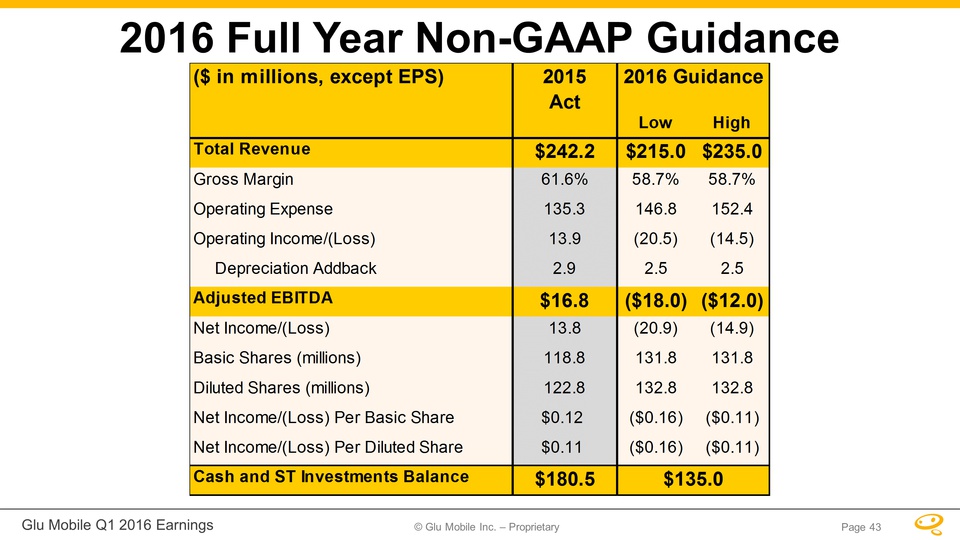
43 2016 Full Year Non-GAAP Guidance
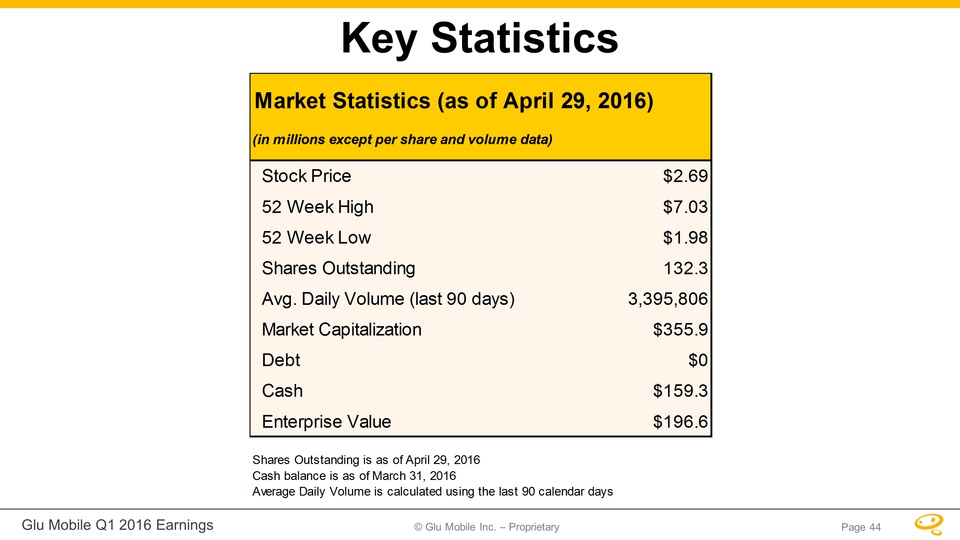
44 Key Statistics
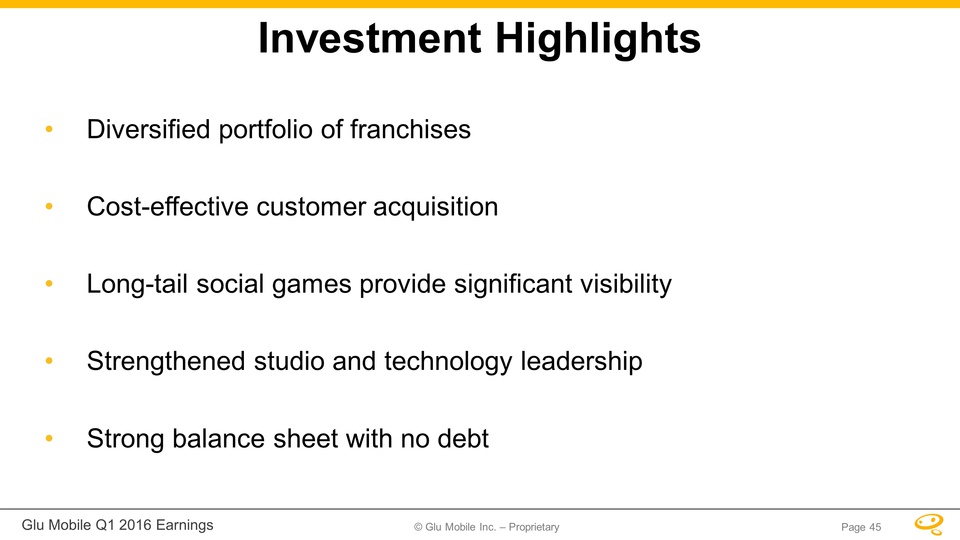
45 Investment Highlights Diversified portfolio of franchisesCost-effective customer acquisitionLong-tail social games provide significant visibilityStrengthened studio and technology leadershipStrong balance sheet with no debt
46 Non-GAAP Reconciliations
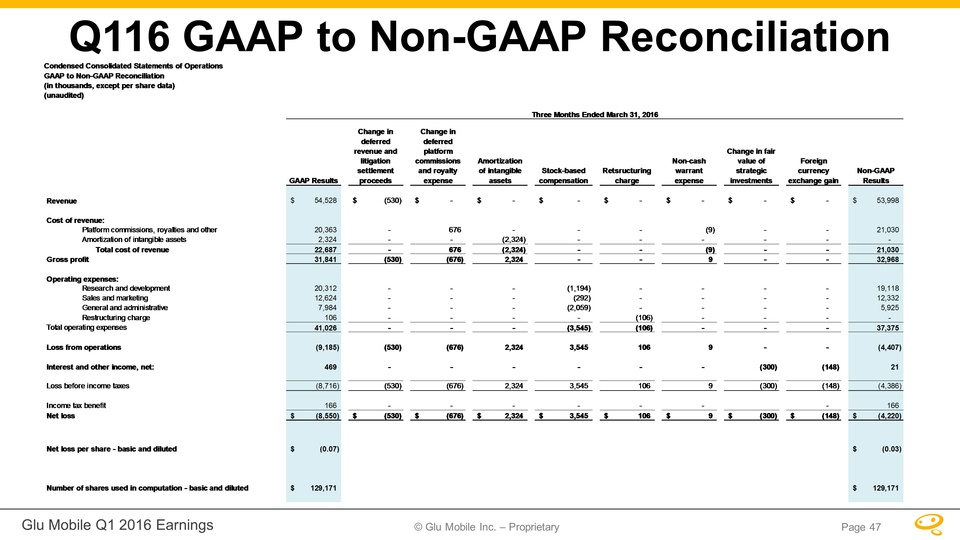
47 Q116 GAAP to Non-GAAP Reconciliation
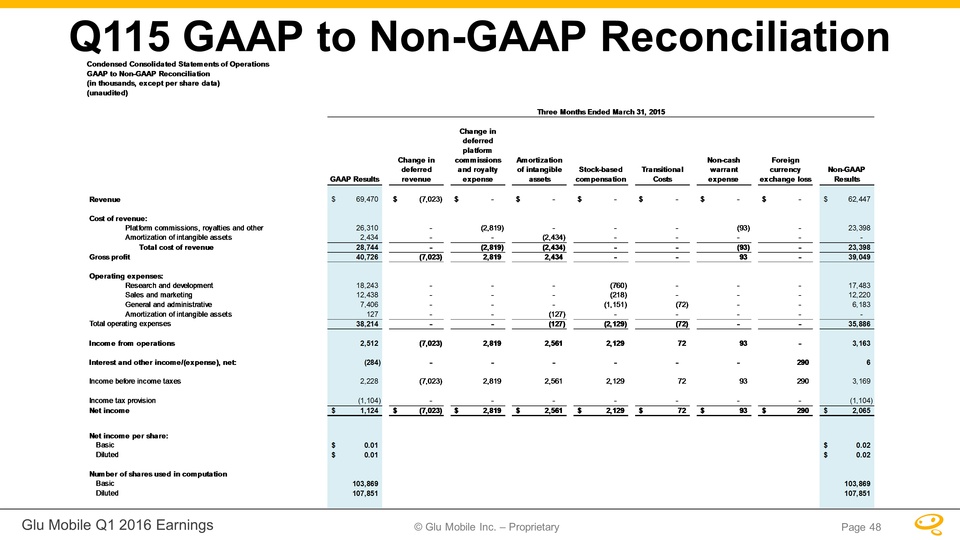
48 Q115 GAAP to Non-GAAP Reconciliation
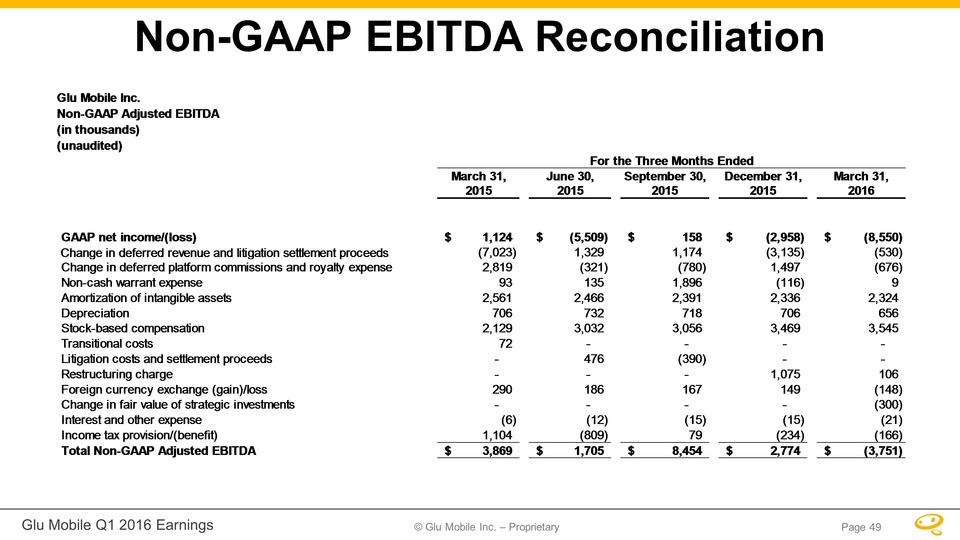
49 Non-GAAP EBITDA Reconciliation
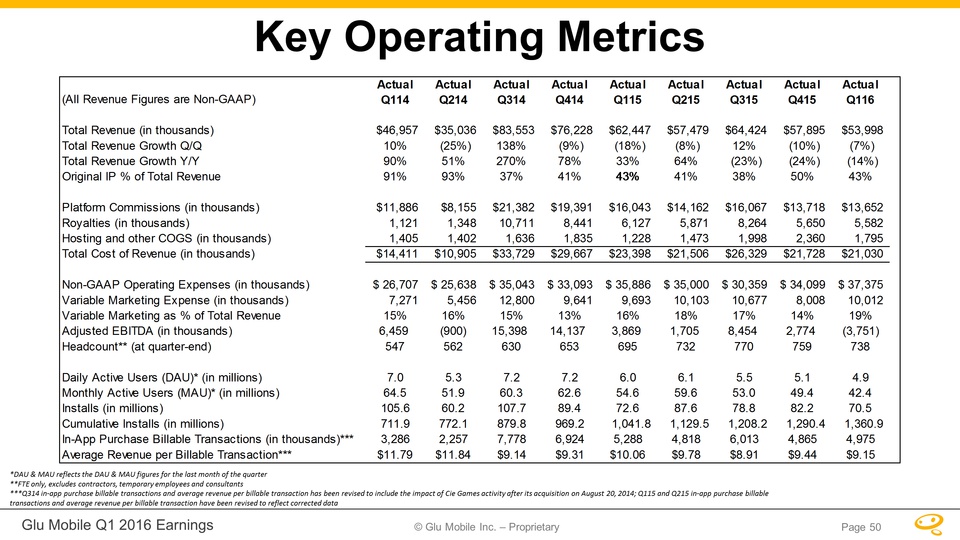
50 Key Operating Metrics *DAU & MAU reflects the DAU & MAU figures for the last month of the quarter**FTE only, excludes contractors, temporary employees and consultants***Q314 in-app purchase billable transactions and average revenue per billable transaction has been revised to include the impact of Cie Games activity after its acquisition on August 20, 2014; Q115 and Q215 in-app purchase billable transactions and average revenue per billable transaction have been revised to reflect corrected data