Attached files
| file | filename |
|---|---|
| 8-K - 8-K - FEDERAL HOME LOAN MORTGAGE CORP | d172955d8k.htm |
| EX-99.2 - EXHIBIT 99.2 - FEDERAL HOME LOAN MORTGAGE CORP | d172955dex992.htm |
Exhibit 99.1

|

|
| News Release | For Immediate Release // May 3, 2016 |
Freddie Mac Reports First Quarter 2016 Financial Results
$354 Million Net Loss and $200 Million Comprehensive Loss; No Draw Needed from U.S. Treasury;
$98.2 Billion Returned to Taxpayers To Date
| First Quarter 2016 Results
Results Dominated by Negative Market-Related Items of $2.0 Billion, Offsetting Positive Business Results
• $1.4 billion (after-tax) estimated fair value loss driven by measurement differences between the company’s derivatives, which are measured at fair value, and certain hedged assets and liabilities, which are not.
• $0.6 billion (after-tax) estimated fair value loss due to the impact of spread widening on certain mortgage loans and mortgage-related securities measured at fair value.
• $3.4 billion of net interest income of which approximately 45 percent was derived from management and guarantee fees, up from 37 percent in the first quarter of 2015, as the mortgage-related investments portfolio continued to decline. |
Net Loss 1Q16 = $(354) Million | |||
| Comprehensive Loss 1Q16 = $(200) Million | ||||
| Available PSPA Funding 1Q16 = $140.5 Billion | ||||
| First Quarter 2016 Business Highlights |
||||
|
Business Fundamentals Remain Strong Single-family Guarantee Business • Core (post-2008) book, which excludes HARP and other relief refinance loans, grew to 68 percent of credit guarantee portfolio, while management and guarantee fee income has increased significantly over the past two years • Purchase volume of $69 billion, down $7 billion from the fourth quarter of 2015 driven by a seasonal slowdown in home purchase activity Multifamily Business • Record purchase volume of $18 billion, up from $13 billion in the fourth quarter of 2015
Reduced Taxpayer Exposure Through Innovative Credit Risk Transfer Programs Single-family Guarantee Business • Transferred a portion of the credit risk on $54 billion of loans, and have now transferred a portion of the credit risk on $440 billion since 2013 Multifamily Business • Transferred credit risk associated with $10.8 billion of loans
Continued Reduction of Legacy Assets Single-family Guarantee Business • Legacy book declined to 15 percent of the credit guarantee portfolio from 16 percent in the fourth quarter of 2015 • Serious delinquency rate of 1.20 percent, down from 1.32 percent at the end of 2015 • Sold $0.8 billion of seriously delinquent loans, and $4.3 billion since 2013 Investments Business • Sold $0.8 billion of non-agency securities, and $29 billion since 2013
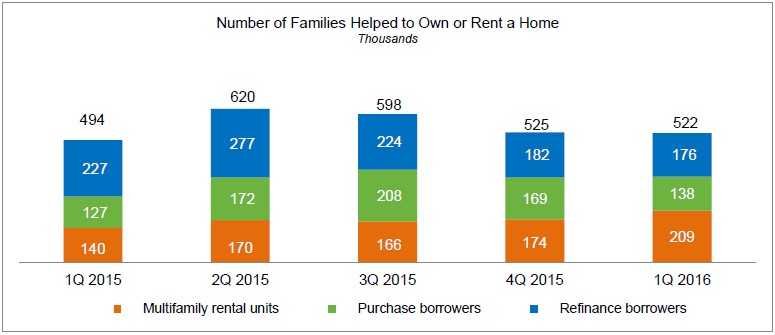
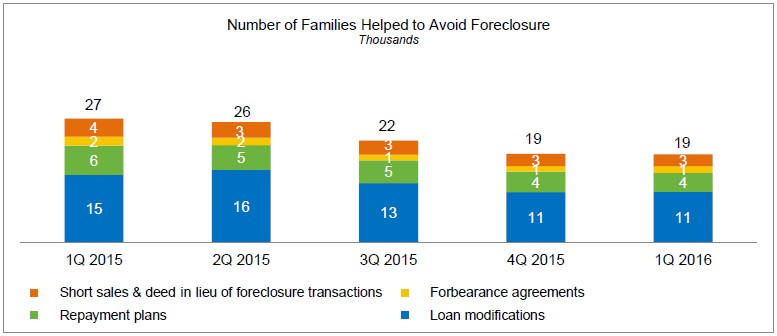
Strong Housing Market Support – Helping Families Buy, Rent or Keep Their Homes • Provided approximately $87 billion in liquidity to the mortgage market – funding more than 313,000 single-family homes and approximately 209,000 multifamily rental units • Helped approximately 19,000 borrowers avoid foreclosure
Net Worth of $1.0 Billion; No Draw Request or Dividend Obligation • Returned $98.2 billion to taxpayers through dividend payments to date • Available funding under the Purchase Agreement remains $140.5 billion |
“Freddie Mac’s first quarter business results continued to be strong, reflecting our transformation to be a more competitive company. We’re serving our customers better and also more effectively executing on our mission to responsibly support homeowners and renters nationwide. The percentage of our purchases of loans to first-time homebuyers hit a 10-year high and we continue to finance record levels of rental housing. Also, the transfer of mortgage credit risk away from taxpayers, which we pioneered, proved its resiliency through the quarter’s significant financial market distress. While the resulting flight-to-quality decrease in interest rates reduced our GAAP results this quarter, an impact which is non-economic in nature, the fundamentals of our business are very solid and continue to improve.”
Donald H. Layton Chief Executive Officer |
Freddie Mac First Quarter 2016 Financial Results
May 3, 2016
Page 2
McLean, VA — Freddie Mac (OTCQB: FMCC) today reported a net loss of $354 million for the first quarter of 2016, compared to net income of $2.2 billion for the fourth quarter of 2015. The company also reported a comprehensive loss of $200 million for the first quarter of 2016, compared to comprehensive income of $1.6 billion for the fourth quarter of 2015.
Summary Consolidated Statements of Comprehensive Income (Loss)
| Three Months Ended | ||||||||||||||
| ($ Millions) | 3/31/16 | 12/31/15 | Change | |||||||||||
| 1 |
Net interest income | $ | 3,405 | $ | 3,587 | $ | (182 | ) | ||||||
| 2 |
Benefit for credit losses | 467 | 781 | (314 | ) | |||||||||
| 3 |
Derivative gains (losses) | (4,561 | ) | 744 | (5,305 | ) | ||||||||
| 4 |
Other non-interest income (loss) | 1,138 | (896 | ) | 2,034 | |||||||||
|
|
|
|
|
|
|
|||||||||
| 5 |
Non-interest income (loss) | (3,423 | ) | (152 | ) | (3,271 | ) | |||||||
| 6 |
Administrative expense | (448 | ) | (510 | ) | 62 | ||||||||
| 7 |
Other non-interest expense | (509 | ) | (629 | ) | 120 | ||||||||
|
|
|
|
|
|
|
|||||||||
| 8 |
Non-interest expense | (957 | ) | (1,139 | ) | 182 | ||||||||
| 9 |
Pre-tax (loss) income | (508 | ) | 3,077 | (3,585 | ) | ||||||||
| 10 |
Income tax benefit (expense) | 154 | (919 | ) | 1,073 | |||||||||
|
|
|
|
|
|
|
|||||||||
| 11 |
Net (loss) income | $ | (354 | ) | $ | 2,158 | $ | (2,512 | ) | |||||
| 12 |
Total other comprehensive income (loss) | 154 | (517 | ) | 671 | |||||||||
|
|
|
|
|
|
|
|||||||||
| 13 |
Comprehensive (loss) income | $ | (200 | ) | $ | 1,641 | $ | (1,841 | ) | |||||
|
|
|
|
|
|
|
|||||||||
|
|
|
|
|
|
|
|||||||||
Financial Results Discussion
Freddie Mac’s first quarter 2016 net loss of $354 million and comprehensive loss of $200 million were a decrease of $2.5 billion and $1.8 billion, respectively, from the fourth quarter of 2015. The decline in the company’s first quarter 2016 results was primarily driven by two market-related items:
| ● | Net Interest Rate Effect: $1.4 billion (after-tax) estimated fair value loss for the first quarter of 2016 as interest rates decreased, compared to a $0.3 billion (after-tax) estimated fair value gain for the fourth quarter of 2015 as interest rates increased. (See Net Interest Rate Effect table for additional details.) |
| ¡ | Through its use of derivatives, the company continues to manage its interest-rate risk on an economic basis to a low level as measured by its models. However, significant GAAP earnings volatility can occur as the derivative instruments are measured at fair value each period while certain hedged assets and liabilities are not. |
| ● | Spread Change Effect: $0.6 billion (after-tax) estimated loss for the first quarter of 2016, compared to a $0.3 billion (after-tax) estimated loss for the fourth quarter of 2015, as spreads on certain mortgage loans and mortgage-related securities measured at fair value widened more in the first quarter than in the fourth quarter. |
Freddie Mac First Quarter 2016 Financial Results
May 3, 2016
Page 3
Net Interest Rate Effect
| Three Months Ended | ||||||||||||||
| ($ Billions) | 3/31/16 | 12/31/15 | Change | |||||||||||
| Components of Derivative Gains (Losses) |
||||||||||||||
| 1 | Derivative Gains (Losses) | $ | (4.6 | ) | $ | 0.7 | $ | (5.3 | ) | |||||
| 2 | Less: Accrual of Periodic Cash Settlements | (0.5 | ) | (0.6 | ) | 0.1 | ||||||||
|
|
|
|
|
|
|
|||||||||
| 3 | Derivative Fair Value Changes | $ | (4.1 | ) | $ | 1.3 | $ | (5.4 | ) | |||||
|
|
|
|
|
|
|
|||||||||
| Estimated Net Interest Rate Effect |
||||||||||||||
| 4 | Interest Rate Effect on Derivative Fair Values | $ | (4.0 | ) | $ | 1.3 | $ | (5.3 | ) | |||||
| 5 | Estimate of Offsetting Interest Rate Effect Related to Financial Instruments Measured at Fair Value | 1.9 | (0.9 | ) | 2.8 | |||||||||
| 6 | Income Tax Benefit (Expense) - @ 35% | 0.7 | (0.1 | ) | 0.8 | |||||||||
|
|
|
|
|
|
|
|||||||||
| 7 | Estimated Net Effect on Comprehensive Income (4+5+6) | $ | (1.4 | ) | $ | 0.3 | $ | (1.7 | ) | |||||
|
|
|
|
|
|
|
|||||||||
|
|
|
|
|
|
|
|||||||||
Net Interest Income
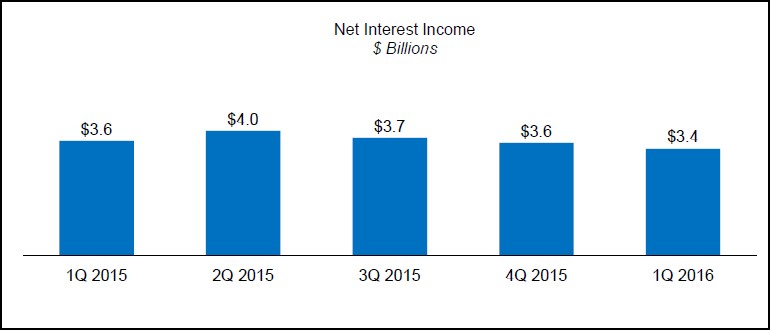
| ● | Net interest income was $3.4 billion for the first quarter of 2016, a decrease of $182 million from the fourth quarter of 2015. |
| ¡ | The decrease in net interest income primarily reflects lower amortization income due to lower prepayments. |
| ¡ | Approximately 45 percent of net interest income for the first quarter of 2016 was derived from management and guarantee fees, up from 37 percent in the first quarter of 2015. |
Freddie Mac First Quarter 2016 Financial Results
May 3, 2016
Page 4
Variability of Earnings
Freddie Mac’s financial results are subject to significant earnings variability from period to period. This variability is primarily driven by:
| • | Interest-Rate Volatility – Freddie Mac holds assets and liabilities that expose it to interest-rate risk. Through its use of derivatives, the company manages its exposure to interest-rate risk on an economic basis to a low level as measured by the company’s models. However, the way the company accounts for its financial assets and liabilities (i.e., some are measured at amortized cost, while others are measured at fair value), including derivatives, creates volatility in the company’s GAAP earnings when interest rates fluctuate. Based upon the composition of its financial assets and liabilities, including derivatives, at March 31, 2016, the company generally recognizes fair value losses in earnings when interest rates decline. This volatility generally is not indicative of the underlying economics of its business. |
| • | Spread Volatility – Spread volatility (i.e., credit spreads, liquidity spreads, risk premiums, etc.), or option-adjusted spreads, is the risk associated with changes in the excess of interest rates over benchmark rates. Freddie Mac holds assets and liabilities that expose it to spread volatility, which may contribute to significant earnings volatility. For financial assets and liabilities measured at fair value, the company generally recognizes fair value losses when spreads widen. |
The variability of earnings and the declining capital reserve required under the terms of the Purchase Agreement (ultimately reaching zero in 2018) increase the risk of the company having a negative net worth and being required to draw from Treasury. Freddie Mac currently faces a risk of a draw for a variety of reasons, including if it were to experience a large decrease in interest rates coupled with a large widening of spreads. The company continues to assess certain transactions and activities that may reduce or limit its exposure to this variability.
Total Segment Earnings (Loss)
Freddie Mac has three reportable segments – Single-family Guarantee, Multifamily, and Investments. The company presents Segment Earnings for its individual segments by reclassifying certain credit guarantee-related activities and investment-related activities between various line items on the company’s GAAP consolidated statements of comprehensive income and allocating certain revenue and expenses, including certain returns on assets and funding costs, and all administrative expenses to its three reportable segments.
In addition to analyzing the company’s results on a GAAP basis, management reviews the company’s business results on a Total Segment Earnings basis. Because of the reclassifications and allocations the company makes to present its segment results, certain operating measures presented on a Total Segment Earnings basis differ from the amounts for the comparable measures on a GAAP basis. Each measure of operating results presented on a Total Segment Earnings basis that differs from the comparable amount on a GAAP basis is a non-GAAP measure. Management believes these non-GAAP measures are meaningful to the company, as well as investors, because they help to better understand how the company generates revenue and better reflect how management assesses segment and overall company performance.
Freddie Mac First Quarter 2016 Financial Results
May 3, 2016
Page 5
Total Segment Earnings (Loss) (1)
| Three Months Ended | ||||||||||||||
| ($ Millions) | 3/31/16 | 12/31/15 | Change | |||||||||||
| 1 |
Net interest income | $ | 882 | $ | 981 | $ | (99 | ) | ||||||
| 2 |
Management and guarantee fee income | 1,393 | 1,388 | 5 | ||||||||||
| 3 |
Benefit for credit losses | 294 | 365 | (71 | ) | |||||||||
|
|
|
|
|
|
|
|||||||||
| 4 |
Net interest income and management and guarantee income after benefit for credit losses | 2,569 | 2,734 | (165 | ) | |||||||||
| 5 |
Derivative gains (losses) | (3,790 | ) | 1,516 | (5,306 | ) | ||||||||
| 6 |
Other non-interest income (loss) | 1,371 | (453 | ) | 1,824 | |||||||||
| 7 |
Administrative expenses | (448 | ) | (510 | ) | 62 | ||||||||
| 8 |
Other non-interest expense | (210 | ) | (210 | ) | — | ||||||||
| 9 |
Income tax benefit (expense) | 154 | (919 | ) | 1,073 | |||||||||
|
|
|
|
|
|
|
|||||||||
| 10 |
Net (loss) income | (354 | ) | 2,158 | (2,512 | ) | ||||||||
| 11 |
Total other comprehensive income (loss), net of tax | 154 | (517 | ) | 671 | |||||||||
|
|
|
|
|
|
|
|||||||||
| 12 |
Comprehensive (loss) income | $ | (200 | ) | $ | 1,641 | $ | (1,841 | ) | |||||
|
|
|
|
|
|
|
|||||||||
|
|
|
|
|
|
|
|||||||||
| (1) | The Total Segment Earnings measures presented on lines 1 through 6 and Line 8 differ from the comparable amounts on a GAAP basis and are non-GAAP measures. For reconciliations to comparable amounts under GAAP, see page 17 of this press release. |
Selected Total Segment Earnings Financial Highlights
| (1) | Non-GAAP measure. For reconciliations to the comparable amounts under GAAP, see page 18 of this press release. |
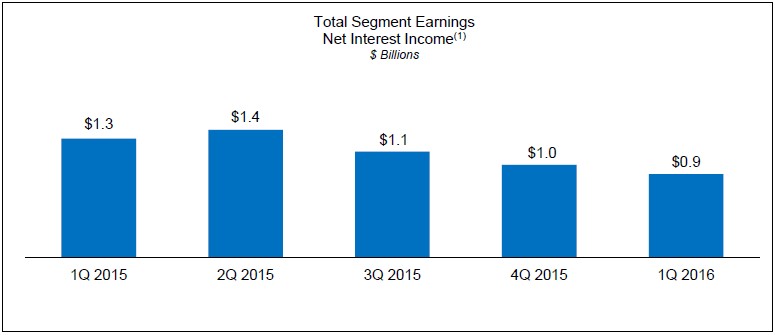
| ● | Total segment net interest income was $882 million for the first quarter of 2016, a decrease of $99 million from the fourth quarter of 2015. |
| ¡ | The decrease in total segment net interest income primarily reflects lower amortization income as liquidations declined in the first quarter. |
| ¡ | Total segment net interest income continues to decline as the company reduces the mortgage-related investments portfolio in accordance with the requirements of the Purchase Agreement and FHFA. |
Freddie Mac First Quarter 2016 Financial Results
May 3, 2016
Page 6
| (1) | Non-GAAP measure. For reconciliations to the comparable amounts under GAAP, see page 18 of this press release. |
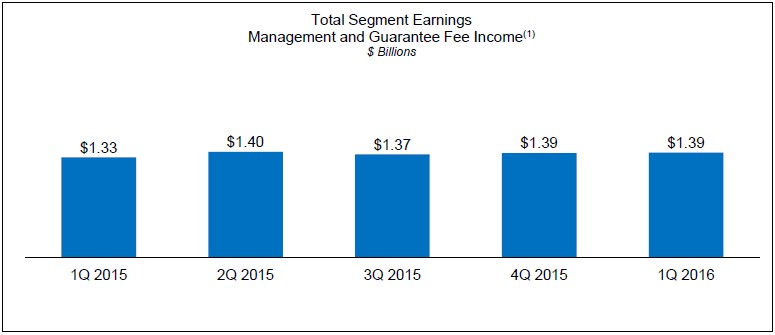
| ● | Total segment management and guarantee fee income was $1.4 billion for the first quarter of 2016, a slight increase of $5 million from the fourth quarter of 2015. |
Freddie Mac First Quarter 2016 Financial Results
May 3, 2016
Page 7
Segment Financial Results and Business Highlights
Segment Earnings and Comprehensive Income (1)
| Three Months Ended | ||||||||||||||
| ($ Millions) | 3/31/16 | 12/31/15 | Change | |||||||||||
| Single-family Guarantee Segment | ||||||||||||||
| 1 |
Management and guarantee fee income | $ | 1,285 | $ | 1,288 | $ | (3 | ) | ||||||
| 2 |
Benefit for credit losses | 289 | 359 | (70 | ) | |||||||||
| 3 |
Administrative expenses | (295 | ) | (347 | ) | 52 | ||||||||
| 4 |
Other | (115 | ) | (392 | ) | 277 | ||||||||
| 5 |
Income tax (expense) benefit | (354 | ) | (272 | ) | (82 | ) | |||||||
|
|
|
|
|
|
|
|||||||||
| 6 |
Segment Earnings, net of taxes | 810 | 636 | 174 | ||||||||||
| 7 |
Total other comprehensive income (loss), net of tax | 1 | 13 | (12 | ) | |||||||||
|
|
|
|
|
|
|
|||||||||
| 8 |
Total comprehensive income | $ | 811 | $ | 649 | $ | 162 | |||||||
|
|
|
|
|
|
|
|||||||||
| Multifamily Segment | ||||||||||||||
| 9 |
Net interest income | $ | 252 | $ | 257 | $ | (5 | ) | ||||||
| 10 |
Management and guarantee fee income | 108 | 100 | 8 | ||||||||||
| 11 |
Gains (losses) on loans and other non-interest income | 737 | (377 | ) | 1,114 | |||||||||
| 12 |
Derivative gains (losses) | (787 | ) | 366 | (1,153 | ) | ||||||||
| 13 |
Administrative expenses | (80 | ) | (85 | ) | 5 | ||||||||
| 14 |
Other | (19 | ) | (17 | ) | (2 | ) | |||||||
| 15 |
Income tax (expense) benefit | (64 | ) | (69 | ) | 5 | ||||||||
|
|
|
|
|
|
|
|||||||||
| 16 |
Segment Earnings, net of taxes | 147 | 175 | (28 | ) | |||||||||
| 17 |
Total other comprehensive income (loss), net of tax | 3 | (153 | ) | 156 | |||||||||
|
|
|
|
|
|
|
|||||||||
| 18 |
Total comprehensive income | $ | 150 | $ | 22 | $ | 128 | |||||||
|
|
|
|
|
|
|
|||||||||
| Investments Segment | ||||||||||||||
| 19 |
Net interest income | $ | 748 | $ | 776 | $ | (28 | ) | ||||||
| 20 |
Derivative gains (losses) | (2,995 | ) | 1,151 | (4,146 | ) | ||||||||
| 21 |
Other non-interest income | 439 | 78 | 361 | ||||||||||
| 22 |
Administrative expenses | (73 | ) | (78 | ) | 5 | ||||||||
| 23 |
Other | (2 | ) | (2 | ) | — | ||||||||
| 24 |
Income tax (expense) benefit | 572 | (578 | ) | 1,150 | |||||||||
|
|
|
|
|
|
|
|||||||||
| 25 |
Segment Earnings, net of taxes | (1,311 | ) | 1,347 | (2,658 | ) | ||||||||
| 26 |
Total other comprehensive income (loss), net of tax | 150 | (378 | ) | 528 | |||||||||
|
|
|
|
|
|
|
|||||||||
| 27 |
Total comprehensive income | $ | (1,161 | ) | $ | 969 | $ | (2,130 | ) | |||||
|
|
|
|
|
|
|
|||||||||
|
|
|
|
|
|
|
|||||||||
| (1) | During the three months ended March 31, 2016, Freddie Mac changed how it calculates certain components of the company’s Segment Earnings for the Single-family Gurantee and Investments segments. The purpose of these changes is to simplify Segment Earnings results relative to GAAP results, as well as to reduce operational complexity. Prior period results have been revised to conform to the current period presentation. See Note 11 of the company’s Quarterly Report on Form 10-Q for the quarter ended March 31, 2016 for additional information. |
Freddie Mac First Quarter 2016 Financial Results
May 3, 2016
Page 8
Single-family Guarantee Segment
Providing liquidity to the U.S. housing market while continuing to transfer credit risk to the private market
Financial Results
| ● | Single-family Guarantee segment earnings were $810 million for the first quarter of 2016, an increase of $174 million from the fourth quarter of 2015. |
| ¡ | Management and guarantee fee income remained steady, while the increase in segment earnings was primarily driven by fewer seriously delinquent single-family loans being reclassified from held-for-investment to held-for-sale in the first quarter of 2016. |
Business Highlights
| ● | Core book continued to grow and was 68 percent of the single-family credit guarantee portfolio at March 31, 2016. |
| ¡ | HARP and other relief refinance loans were an additional 17 percent. |
| ¡ | Legacy book declined to 15 percent. |
| ● | Average management and guarantee fees charged on new acquisitions were 46.4 basis points (net of the legislated 10 basis point guarantee fee remitted to Treasury as part of the Temporary Payroll Tax Cut Continuation Act of 2011) for the first quarter of 2016, up from 43.7 basis points in the fourth quarter of 2015. |
| ● | Sold $0.8 billion in UPB of seriously delinquent single-family loans during the first quarter of 2016, and $4.3 billion since 2013. |
| ● | Completed credit risk transfer transactions during the first quarter of 2016 that, upon initial execution, covered $53.8 billion in principal of the mortgage loans in the Core book. |
Multifamily Segment
Providing financing for workforce housing while continuing to transfer credit risk to the private market
Financial Results
| ● | Multifamily segment comprehensive income was $150 million for the first quarter of 2016, an increase of $128 million from the fourth quarter of 2015. |
| ¡ | Net interest income was relatively stable, while the increase in comprehensive income was primarily driven by lower fair value losses due to less spread widening on held-for-sale mortgage loans in the first quarter of 2016 compared to the fourth quarter of 2015. |
| – | Derivative gains (losses) for the Multifamily segment are offset by fair value changes of the loans and investment securities being economically hedged. As a result, there is no net impact on total comprehensive income for the Multifamily segment from fair value changes related to interest-rate related derivatives. |
Business Highlights
| ● | Record new purchase volume of $17.5 billion in the first quarter of 2016, an increase of $4.3 billion from the fourth quarter of 2015. |
| ¡ | The 2016 Conservatorship Scorecard goal is to maintain the dollar volume of multifamily new business activity at or below a production cap of $31.0 billion. Business activity associated with certain targeted loan types is excluded from the production cap. |
| ¡ | Approximately 69 percent of the $17.5 billion in new business activity for the first quarter of 2016 counted towards the 2016 production cap, while the remaining 31 percent was not subject to the cap. |
| ● | Held-for-sale loans totaled $23.6 billion at March 31, 2016, up from $19.6 billion at December 31, 2015. |
| ¡ | This balance is expected to decline during the year as the company continues to securitize loans into K-Deals and other securitization products. |
| ● | Executed nine K-Deal transactions that transferred credit risk associated with $9.8 billion in UPB of loans during the first quarter of 2016. |
Freddie Mac First Quarter 2016 Financial Results
May 3, 2016
Page 9
| ¡ | In addition, transferred credit risk associated with $1.0 billion of additional loans through other securitization products, such as small balance loan securitizations. |
| ● | Provided financing for approximately 209,000 rental units in the first quarter of 2016. Nearly 85 percent of the eligible units financed are affordable to families earning low to median area incomes. |
Investments Segment
Enhancing the liquidity of the company’s securities in the secondary mortgage market while reducing less liquid assets using an economically sensible approach
Financial Results
| ● | Investments segment comprehensive loss was $1.2 billion for the first quarter of 2016, a shift from comprehensive income of $969 million in the fourth quarter of 2015. |
| ¡ | Net interest income was relatively unchanged, while the shift to a comprehensive loss was primarily driven by derivative losses of $3.0 billion as interest rates declined in the first quarter of 2016, compared to derivative gains of $1.2 billion in the fourth quarter of 2015. |
Business Highlights
| ● | Continued to actively reduce the balance of the company’s mortgage-related investments portfolio, focusing on reducing the balance of less liquid assets. Investments segment less liquid assets were $94.8 billion at March 31, 2016, down $6.0 billion, or 6 percent, from December 31, 2015, due to ongoing portfolio liquidations and: |
| ¡ | Sales of $0.8 billion of non-agency mortgage-related securities. |
| ¡ | Securitization of $3.5 billion of single-family reperforming loans and performing modified loans. |
| ● | The Investments segment securitization pipeline assets, which represent the company’s performing single-family loans purchased for cash and held until securitized, were $10.6 billion at March 31, 2016, up $532 million from December 31, 2015. |
| ● | Continued to maintain a presence in the agency mortgage-related securities market. Liquid assets held by the Investments segment were $149.8 billion at March 31, 2016, up $923 million from December 31, 2015. |
Housing Market Support
Freddie Mac supports the U.S. housing market by executing its charter mission to ensure credit availability for new and refinanced mortgages as well as rental housing and helping struggling homeowners avoid foreclosure. A significant company-wide focus in 2016 is to responsibly make housing more accessible for borrowers and renters, especially for low- and moderate-income households and those in underserved markets.
Mortgage Funding - Freddie Mac provided approximately $87 billion in liquidity to the market in the first quarter of 2016, funding:
| • | More than 313,000 single-family homes, nearly 176,000 of which were refinance loans. |
| • | Approximately 209,000 multifamily rental units. |
Freddie Mac First Quarter 2016 Financial Results
May 3, 2016
Page 10
Preventing Foreclosures – Freddie Mac continued to help struggling borrowers retain their homes or otherwise avoid foreclosure in the first quarter.
| ● | The company completed approximately 19,000 single-family loan workouts. |
| ● | The declining trend over the past year in the company’s single-family workouts reflects rising house prices and improving economic conditions. |
| ● | When foreclosure is unavoidable, Freddie Mac has helped to further stabilize communities by focusing its real estate owned home sales on owner-occupants, who made up nearly two–thirds of its purchasers in the first quarter. |
Freddie Mac First Quarter 2016 Financial Results
May 3, 2016
Page 11
About Freddie Mac’s Conservatorship
Since September 2008, Freddie Mac has been operating under conservatorship, with FHFA as Conservator. The support provided by Treasury pursuant to the Senior Preferred Stock Purchase Agreement (Purchase Agreement) enables the company to maintain access to the debt markets and have adequate liquidity to conduct its normal business operations.
Treasury Draw Requests and Dividend Payments
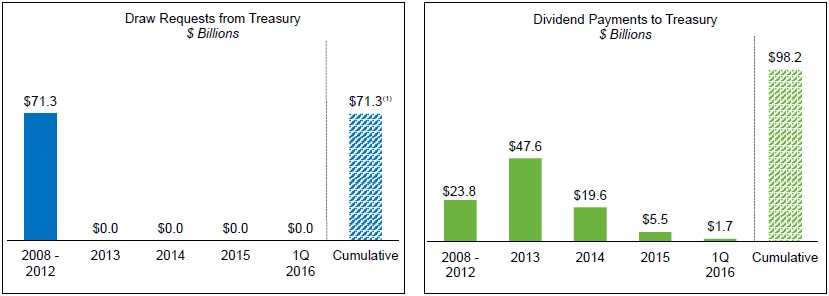
| (1) | Excludes the initial $1 billion liquidation preference of senior preferred stock issued to Treasury in September 2008 as consideration for Treasury’s funding commitment. The company received no cash proceeds as a result of issuing this initial $1 billion liquidation preference of senior preferred stock. |
| ● | As a result of the company’s comprehensive loss in the first quarter of 2016, Freddie Mac’s total equity declined to $1.0 billion at March 31, 2016. Due to the positive total equity, the company will not request a draw from Treasury under the Purchase Agreement. |
| ● | Because the company’s net worth of $1.0 billion as of March 31, 2016 was less than the applicable capital reserve amount for 2016 of $1.2 billion, the company will not have a dividend obligation in June 2016. |
| ¡ | The applicable capital reserve amount will be reduced by $600 million each year until it reaches zero on January 1, 2018. |
| ● | Aggregate cash dividends paid to Treasury totaled $98.2 billion as of March 31, 2016, $26.9 billion more than cumulative cash draws of $71.3 billion received from Treasury through March 31, 2016. |
| ● | The amount of remaining funding available to Freddie Mac under the Purchase Agreement remains unchanged at $140.5 billion, and will be reduced by any future draws. |
| ● | Treasury still maintains a liquidation preference of $72.3 billion on the company’s senior preferred stock as of March 31, 2016. |
| ¡ | The payment of dividends does not reduce the outstanding liquidation preference under the Purchase Agreement. |
| ¡ | Freddie Mac is not permitted to redeem the senior preferred stock prior to the termination of Treasury’s funding commitment under the Purchase Agreement. |
Additional Information
For more information, including that related to Freddie Mac’s financial results, conservatorship and related matters, see the company’s Quarterly Report on Form 10-Q for the quarter ended March 31, 2016, and the company’s Financial Results Supplement. These documents are available on the Investor Relations page of the company’s Web site at www.FreddieMac.com/investors.
Freddie Mac First Quarter 2016 Financial Results
May 3, 2016
Page 12
Additional information about Freddie Mac and its business is also set forth in the company’s filings with the SEC, which are available on the Investor Relations page of the company’s Web site at www.FreddieMac.com/investors and the SEC’s Web site at www.sec.gov. Freddie Mac encourages all investors and interested members of the public to review these materials for a more complete understanding of the company’s financial results and related disclosures.
Webcast Announcement
Management will host a conference call at 9 a.m. Eastern Time on May 3, 2016 to discuss the company’s results with the media. The conference call will be concurrently webcast. To access the live audio webcast, use the following link: https://www.webcaster4.com/Webcast/Page/1315/14626. The replay will be available on the company’s Web site at www.FreddieMac.com/investors for approximately 30 days. All materials related to the call will be available on the Investor Relations page of the company’s Web site at www.FreddieMac.com/investors.
| Media Contact: Lisa Gagnon (703) 903-3385 | Investor Contact: Robin Phillips (571) 382-4732 | |
* * * *
This press release contains forward-looking statements, which may include statements pertaining to the conservatorship, the company’s current expectations and objectives for its Single-family Guarantee, Multifamily and Investments segments, its efforts to assist the U.S. residential mortgage market, liquidity, capital management, economic and market conditions and trends, market share, the effect of legislative and regulatory developments and new accounting guidance, credit quality of loans the company owns or guarantees, and results of operations and financial condition on a GAAP, Segment Earnings, Total Segment Earnings and fair value basis. Forward-looking statements involve known and unknown risks and uncertainties, some of which are beyond the company’s control. Management’s expectations for the company’s future necessarily involve a number of assumptions, judgments and estimates, and various factors, including changes in market conditions, liquidity, mortgage spreads, credit outlook, actions by the U.S. government (including FHFA, Treasury and Congress), and the impacts of legislation or regulations and new or amended accounting guidance, could cause actual results to differ materially from these expectations. These assumptions, judgments, estimates and factors are discussed in the company’s Annual Report on Form 10-K for the year ended December 31, 2015, Quarterly Report on Form 10-Q for the quarter ended March 31, 2016 and Current Reports on Form 8-K, which are available on the Investor Relations page of the company’s Web site at www.FreddieMac.com/investors and the SEC’s Web site at www.sec.gov. The company undertakes no obligation to update forward-looking statements it makes to reflect events or circumstances occurring after the date of this press release.
Freddie Mac was established by Congress in 1970 to provide liquidity, stability and affordability to the nation’s residential mortgage markets. Freddie Mac supports communities across the nation by providing mortgage capital to lenders. Today Freddie Mac is making home possible for approximately one in four home borrowers and is the largest source of financing for multifamily housing. Additional information is available at FreddieMac.com, Twitter @FreddieMac and Freddie Mac’s blog FreddieMac.com/blog.
FREDDIE MAC
CONDENSED CONSOLIDATED STATEMENTS OF COMPREHENSIVE INCOME (LOSS)
(UNAUDITED)
| Three Months Ended | ||||||||
| March 31, 2016 | December 31, 2015 | |||||||
| (in millions, except share-related amounts) | ||||||||
| Interest income |
||||||||
| Mortgage loans |
$ | 15,818 | $ | 15,793 | ||||
| Investments in securities |
969 | 1,058 | ||||||
| Other |
57 | 25 | ||||||
|
|
|
|
|
|||||
| Total interest income |
16,844 | 16,876 | ||||||
|
|
|
|
|
|||||
| Interest expense |
(13,388 | ) | (13,237 | ) | ||||
| Expense related to derivatives |
(51 | ) | (52 | ) | ||||
|
|
|
|
|
|||||
| Net interest income |
3,405 | 3,587 | ||||||
| Benefit (provision) for credit losses |
467 | 781 | ||||||
|
|
|
|
|
|||||
| Net interest income after benefit (provision) for credit losses |
3,872 | 4,368 | ||||||
|
|
|
|
|
|||||
| Non-interest income (loss) |
||||||||
| Gains (losses) on extinguishment of debt |
(55 | ) | (85 | ) | ||||
| Derivative gains (losses) |
(4,561 | ) | 744 | |||||
| Impairment of available-for-sale securities: |
||||||||
| Total other-than-temporary impairment of available-for-sale securities |
(52 | ) | (37 | ) | ||||
| Portion of other-than-temporary impairment recognized in AOCI |
(5 | ) | (10 | ) | ||||
|
|
|
|
|
|||||
| Net impairment of available-for-sale securities recognized in earnings |
(57 | ) | (47 | ) | ||||
| Other gains (losses) on investment securities recognized in earnings |
303 | (317 | ) | |||||
| Other income (loss) |
947 | (447 | ) | |||||
|
|
|
|
|
|||||
| Non-interest income (loss) |
(3,423 | ) | (152 | ) | ||||
|
|
|
|
|
|||||
| Non-interest expense |
||||||||
| Salaries and employee benefits |
(239 | ) | (233 | ) | ||||
| Professional services |
(101 | ) | (136 | ) | ||||
| Occupancy expense |
(13 | ) | (16 | ) | ||||
| Other administrative expense |
(95 | ) | (125 | ) | ||||
|
|
|
|
|
|||||
| Total administrative expense |
(448 | ) | (510 | ) | ||||
| Real estate owned operations (expense) income |
(84 | ) | (95 | ) | ||||
| Temporary Payroll Tax Cut Continuation Act of 2011 expense |
(272 | ) | (262 | ) | ||||
| Other (expense) income |
(153 | ) | (272 | ) | ||||
|
|
|
|
|
|||||
| Non-interest expense |
(957 | ) | (1,139 | ) | ||||
|
|
|
|
|
|||||
| (Loss) income before income tax benefit (expense) |
(508 | ) | 3,077 | |||||
| Income tax benefit (expense) |
154 | (919 | ) | |||||
|
|
|
|
|
|||||
| Net (loss) income |
(354 | ) | 2,158 | |||||
|
|
|
|
|
|||||
| Other comprehensive income (loss), net of taxes and reclassification adjustments: |
||||||||
| Changes in unrealized gains (losses) related to available-for-sale securities |
119 | (588 | ) | |||||
| Changes in unrealized gains (losses) related to cash flow hedge relationships |
34 | 50 | ||||||
| Changes in defined benefit plans |
1 | 21 | ||||||
|
|
|
|
|
|||||
| Total other comprehensive income (loss), net of taxes and reclassification adjustments |
154 | (517 | ) | |||||
|
|
|
|
|
|||||
| Comprehensive (loss) income |
$ | (200 | ) | $ | 1,641 | |||
|
|
|
|
|
|||||
| Net (loss) income |
$ | (354 | ) | $ | 2,158 | |||
| Undistributed net worth sweep and senior preferred stock dividends |
— | (1,740 | ) | |||||
|
|
|
|
|
|||||
| Net (loss) income attributable to common stockholders |
$ | (354 | ) | $ | 418 | |||
|
|
|
|
|
|||||
| Net (loss) income per common share — basic and diluted |
$ | (0.11 | ) | $ | 0.13 | |||
| Weighted average common shares outstanding (in millions) — basic and diluted |
3,234 | 3,234 | ||||||
Page 13
FREDDIE MAC
CONDENSED CONSOLIDATED BALANCE SHEETS
(UNAUDITED)
| March 31, 2016 | December 31, 2015 | |||||||
| (in millions, except share-related amounts) | ||||||||
| Assets |
||||||||
| Cash and cash equivalents |
$ | 6,158 | $ | 5,595 | ||||
| Restricted cash and cash equivalents |
16,671 | 14,533 | ||||||
| Securities purchased under agreements to resell |
40,098 | 63,644 | ||||||
| Investments in securities, at fair value |
107,595 | 114,215 | ||||||
| Mortgage loans held-for-sale (includes $22,415 and $17,660 at fair value) |
27,085 | 24,992 | ||||||
| Mortgage loans held-for-investment (net of allowance for loan losses of $14,521 and $15,331) |
1,735,548 | 1,729,201 | ||||||
| Accrued interest receivable |
6,091 | 6,074 | ||||||
| Derivative assets, net |
814 | 395 | ||||||
| Real estate owned, net |
1,571 | 1,725 | ||||||
| Deferred tax assets, net |
18,123 | 18,205 | ||||||
| Other assets |
9,346 | 7,313 | ||||||
|
|
|
|
|
|||||
| Total assets |
$ | 1,969,100 | $ | 1,985,892 | ||||
|
|
|
|
|
|||||
| Liabilities and equity |
||||||||
| Liabilities |
||||||||
| Accrued interest payable |
$ | 6,047 | $ | 6,183 | ||||
| Debt, net (includes $6,915 and $7,184 at fair value) |
1,955,618 | 1,970,269 | ||||||
| Derivative liabilities, net |
1,632 | 1,254 | ||||||
| Other liabilities |
4,803 | 5,246 | ||||||
|
|
|
|
|
|||||
| Total liabilities |
1,968,100 | 1,982,952 | ||||||
|
|
|
|
|
|||||
| Commitments and contingencies |
||||||||
| Equity |
||||||||
| Senior preferred stock, at redemption value |
72,336 | 72,336 | ||||||
| Preferred stock, at redemption value |
14,109 | 14,109 | ||||||
| Common stock, $0.00 par value, 4,000,000,000 shares authorized, 725,863,886 shares issued and 650,046,828 shares and 650,045,962 shares outstanding |
— | — | ||||||
| Additional paid-in capital |
— | — | ||||||
| Retained earnings (accumulated deficit) |
(82,867 | ) | (80,773 | ) | ||||
| AOCI, net of taxes, related to: |
||||||||
| Available-for-sale securities (includes $578 and $778, related to net unrealized gains on securities for which other-than-temporary impairment has been recognized in earnings) |
1,859 | 1,740 | ||||||
| Cash flow hedge relationships |
(587 | ) | (621 | ) | ||||
| Defined benefit plans |
35 | 34 | ||||||
|
|
|
|
|
|||||
| Total AOCI, net of taxes |
1,307 | 1,153 | ||||||
| Treasury stock, at cost, 75,817,058 shares and 75,817,924 shares |
(3,885 | ) | (3,885 | ) | ||||
|
|
|
|
|
|||||
| Total equity |
1,000 | 2,940 | ||||||
|
|
|
|
|
|||||
| Total liabilities and equity |
$ | 1,969,100 | $ | 1,985,892 | ||||
|
|
|
|
|
|||||
Page 14
Freddie Mac
Segment Descriptions
First Quarter 2016 Financial Results
Freddie Mac has three reportable segments, which are based on the type of business activities each performs – Single-family Guarantee, Multifamily, and Investments. The chart below provides a summary of the company’s three reportable segments and the All Other category.
| Segment | Description | Activities / Items | Financial Performance Measurement Basis | |||
| Single-family Guarantee |
The Single-family Guarantee segment reflects results from the segment’s credit guarantee activities. This segment purchases, securitizes, and guarantees single-family loans originated by its seller/servicers and manages its seriously delinquent loans. In most instances, the company securitizes the loan and guarantees the payment of principal and interest on the mortgage-related securities in exchange for management and guarantee fees.
Segment Earnings for this segment consist primarily of management and guarantee fee income, less credit-related expenses, administrative expenses, allocated funding costs, and amounts related to net float income or expenses. |
• Management and guarantee fees on PCs, including those retained by the company, and certain single-family loans in the mortgage-related investments portfolio, inclusive of upfront credit delivery and buy-down fees
• Adjustments to management and guarantee fees for the price performance of the company’s PCs relative to comparable Fannie Mae securities
• Costs of recoveries of risk transfer transactions
• Credit losses on all single-family assets
• Net float income or expense on the single-family credit guarantee portfolio
• Settlements, including legal settlements related to representation and warranty claims
• Gains (losses) on sale of non-performing loans
• Tax expense/benefit and changes in the deferred tax asset valuation allowance (if any)
• Allocated debt costs and administrative expenses |
Contribution to GAAP net income (loss) | |||
| Multifamily | The Multifamily segment reflects results from the segment’s investment, securitization, and guarantee activities in multifamily loans and securities. The segment’s primary business model is to purchase multifamily loans for aggregation and then securitization through issuance of multifamily K Certificates. In addition, it also issues and guarantees other securitization products as well as provides other mortgage-related guarantees.
Segment Earnings for this segment consist primarily of returns on assets related to multifamily investment activities and management and guarantee fee income, less credit-related expenses, administrative expenses, and allocated funding costs. |
• Multifamily loans held-for-sale and associated securitization activities
• Investments in CMBS and multifamily loans held-for-investments
• Other mortgage-related guarantees
• Other securitization products
• Tax expense/benefit and changes in the deferred tax asset valuation allowance (if any)
• Allocated debt costs and administrative expenses |
Contribution to GAAP comprehensive income (loss) |
Page 15
Freddie Mac
Segment Descriptions
First Quarter 2016 Financial Results
| Segment | Description | Activities / Items | Financial Performance Measurement Basis | |||
| Investments | The Investments segment reflects results from managing the company’s mortgage-related investments portfolio (excluding Multifamily segment investments and single-family seriously delinquent loans), Freddie Mac’s treasury function (including funding and liquidity) and interest rate risk.
Segment Earnings by this segment consist primarily of the returns on these investments, less the related funding, hedging and administrative expenses. |
• Investments in mortgage-related securities and single-family performing loans
• All other traded instruments and securities, excluding CMBS and multifamily housing revenue bonds
• Debt issuance
• Interest rate risk management
• Guarantee buy-ups, net of execution gains/losses
• Cash and liquidity management
• Settlements, including legal settlements, relating to non-agency mortgage-related securities
• Tax expense/benefit and changes to the deferred tax asset valuation allowance (if any)
• Allocated administrative expenses |
Contribution to GAAP comprehensive income (loss) | |||
| All Other | The All Other category consists of material corporate-level activities that are infrequent in nature and based on decisions outside the control of the management of the company’s reportable segments. |
• Tax settlements, as applicable
• Legal settlements, as applicable
• Tax expense/benefit and changes in the deferred tax asset valuation allowance (if any), including the release of the deferred tax asset valuation allowance
• FHFA-mandated termination of the company’s pension plan |
N/A |
Page 16
Freddie Mac
Segment Earnings, Total Segment Earnings and Reconciliation to GAAP Results
| Three Months Ended March 31, 2016 | ||||||||||||||||||||||||||||
| ($ Millions) | Single-family Guarantee |
Multifamily | Investments | All Other | Total Segment Earnings (Loss) |
Reclassifications | Total per Consolidated Statements of Comprehensive Income |
|||||||||||||||||||||
| Net interest income (loss) (1), (2), (3), (4), (5) |
$ | (118 | ) | $ | 252 | $ | 748 | $ | — | $ | 882 | $ | 2,523 | $ | 3,405 | |||||||||||||
| Management and guarantee fee income* (1), (2), (3), (6) |
1,285 | 108 | — | — | 1,393 | (1,283 | ) | 110 | ||||||||||||||||||||
| Benefit for credit losses (7) |
289 | 5 | — | — | 294 | 173 | 467 | |||||||||||||||||||||
|
|
|
|||||||||||||||||||||||||||
| Net interest income and management and guarantee income after benefit (provision) for credit losses |
1,456 | 365 | 748 | — | 2,569 | 1,413 | 3,982 | |||||||||||||||||||||
| Derivative gains (losses) (4), (5) |
(8 | ) | (787 | ) | (2,995 | ) | — | (3,790 | ) | (771 | ) | (4,561 | ) | |||||||||||||||
| Other non-interest income (loss) (7) |
195 | 737 | 439 | — | 1,371 | (343 | ) | 1,028 | ||||||||||||||||||||
| Administrative expenses |
(295 | ) | (80 | ) | (73 | ) | — | (448 | ) | — | (448 | ) | ||||||||||||||||
| Other non-interest expense (6), (7) |
(184 | ) | (24 | ) | (2 | ) | — | (210 | ) | (299 | ) | (509 | ) | |||||||||||||||
| Income tax (expense) benefit |
(354 | ) | (64 | ) | 572 | — | 154 | — | 154 | |||||||||||||||||||
|
|
|
|||||||||||||||||||||||||||
| Net income (loss) |
810 | 147 | (1,311 | ) | — | (354 | ) | — | (354 | ) | ||||||||||||||||||
| Total other comprehensive income (loss), net of taxes |
1 | 3 | 150 | — | 154 | — | 154 | |||||||||||||||||||||
|
|
|
|||||||||||||||||||||||||||
| Comprehensive income (loss) |
$ | 811 | $ | 150 | $ | (1,161 | ) | $ | — | $ | (200 | ) | $ | — | $ | (200 | ) | |||||||||||
|
|
|
|||||||||||||||||||||||||||
|
Three Months Ended December 31, 2015 |
||||||||||||||||||||||||||||
| ($ Millions) | Single-family Guarantee |
Multifamily | Investments | All Other | Total Segment Earnings (Loss) |
Reclassifications | Total per Consolidated Statements of Comprehensive Income |
|||||||||||||||||||||
| Net interest income (loss) (1), (2), (3), (4), (5) |
$ | (52 | ) | $ | 257 | $ | 776 | $ | — | $ | 981 | $ | 2,606 | $ | 3,587 | |||||||||||||
| Management and guarantee fee income* (1), (2), (3), (6) |
1,288 | 100 | — | — | 1,388 | (1,288 | ) | 100 | ||||||||||||||||||||
| Benefit for credit losses (7) |
359 | 6 | — | — | 365 | 416 | 781 | |||||||||||||||||||||
|
|
|
|||||||||||||||||||||||||||
| Net interest income and management and guarantee income after benefit (provision) for credit losses |
1,595 | 363 | 776 | — | 2,734 | 1,734 | 4,468 | |||||||||||||||||||||
| Derivative gains (losses) (4), (5) |
(1 | ) | 366 | 1,151 | — | 1,516 | (772 | ) | 744 | |||||||||||||||||||
| Other non-interest income (loss) (7) |
(154 | ) | (377 | ) | 78 | — | (453 | ) | (543 | ) | (996 | ) | ||||||||||||||||
| Administrative expenses |
(347 | ) | (85 | ) | (78 | ) | — | (510 | ) | — | (510 | ) | ||||||||||||||||
| Other non-interest expense (6), (7) |
(185 | ) | (23 | ) | (2 | ) | — | (210 | ) | (419 | ) | (629 | ) | |||||||||||||||
| Income tax (expense) benefit |
(272 | ) | (69 | ) | (578 | ) | — | (919 | ) | — | (919 | ) | ||||||||||||||||
|
|
|
|||||||||||||||||||||||||||
| Net income (loss) |
636 | 175 | 1,347 | — | 2,158 | — | 2,158 | |||||||||||||||||||||
| Total other comprehensive income (loss), net of taxes |
13 | (153 | ) | (378 | ) | 1 | (517 | ) | — | (517 | ) | |||||||||||||||||
|
|
|
|||||||||||||||||||||||||||
| Comprehensive income (loss) |
$ | 649 | $ | 22 | $ | 969 | $ | 1 | $ | 1,641 | $ | — | $ | 1,641 | ||||||||||||||
|
|
|
|||||||||||||||||||||||||||
* Management and guarantee fee income is included in Other income (loss) on Freddie Mac’s GAAP consolidated statements of comprehensive income. As a result, on the Summary Consolidated Statements of Comprehensive Income (Loss) table on page 2 of this press release, management and guarantee fee income is included in line 4, Other non-interest income (loss).
For notes on reclassifications, see pages 19 and 20.
Page 17
Freddie Mac
Non-GAAP Reconciliations
$ Millions, Pre-Tax
| Reconciliation of GAAP Net Interest Income to Total Segment Earnings Net Interest Income | ||||||||||||||||||||||
| 1Q 2015 | 2Q 2015 | 3Q 2015 | 4Q 2015 | 1Q 2016 | ||||||||||||||||||
| 1 |
GAAP Net Interest Income | $ | 3,647 | $ | 3,969 | $ | 3,743 | $ | 3,587 | $ | 3,405 | |||||||||||
| Reclassifications: | ||||||||||||||||||||||
| 2 |
Management and guarantee fee income reclassified out of net interest income (1), (2), (3) | (1,464 | ) | (1,546 | ) | (1,529 | ) | (1,550 | ) | (1,555 | ) | |||||||||||
| 3 |
Accrual of periodic cash settlements reclassified into net interest income (4) | (571 | ) | (532 | ) | (536 | ) | (559 | ) | (490 | ) | |||||||||||
| 4 |
Other reclassifications (5) | (352 | ) | (538 | ) | (554 | ) | (497 | ) | (478 | ) | |||||||||||
|
|
|
|
|
|
|
|
|
|
|
|||||||||||||
| 5 |
Total reclassifications | $ | (2,387 | ) | $ | (2,616 | ) | $ | (2,619 | ) | $ | (2,606 | ) | $ | (2,523 | ) | ||||||
|
|
|
|
|
|
|
|
|
|
|
|||||||||||||
| 6 |
Total Segment Earnings Net Interest Income | $ | 1,260 | $ | 1,353 | $ | 1,124 | $ | 981 | $ | 882 | |||||||||||
|
|
|
|
|
|
|
|
|
|
|
|||||||||||||
|
Reconciliation of GAAP Management and Guarantee Fee Income to Total Segment Earnings Management and Guarantee Fee Income |
||||||||||||||||||||||
| 1Q 2015 | 2Q 2015 | 3Q 2015 | 4Q 2015 | 1Q 2016 | ||||||||||||||||||
| 1 |
GAAP Management and Guarantee Fee Income | $ | 88 | $ | 92 | $ | 90 | $ | 100 | $ | 110 | |||||||||||
| Reclassifications: | ||||||||||||||||||||||
| 2 |
Management and guarantee fee income reclassified from net interest income (1), (2), (3) | 1,464 | 1,546 | 1,529 | 1,550 | 1,555 | ||||||||||||||||
| 3 |
Temporary Payroll Tax Cut Continuation Act of 2011 expense reclassified from other non-interest expense (6) | (222 | ) | (235 | ) | (248 | ) | (262 | ) | (272 | ) | |||||||||||
|
|
|
|
|
|
|
|
|
|
|
|||||||||||||
| 4 |
Total reclassifications | 1,242 | 1,311 | 1,281 | 1,288 | 1,283 | ||||||||||||||||
|
|
|
|
|
|
|
|
|
|
|
|||||||||||||
| 5 |
Total Segment Earnings Management and Guarantee Fee Income | $ | 1,330 | $ | 1,403 | $ | 1,371 | $ | 1,388 | $ | 1,393 | |||||||||||
|
|
|
|
|
|
|
|
|
|
|
|||||||||||||
Note: Columns may not add due to rounding.
For notes on reclassifications, see pages 19 and 20.
Page 18
Freddie Mac
Notes on Non-GAAP Financial Measures
First Quarter 2016 Financial Results
During the three months ended March 31, 2016, Freddie Mac changed how it calculates certain components of the company’s Segment Earnings for the Single-family Guarantee and Investments segments. The purpose of these changes is to simplify Segment Earnings results relative to GAAP results, as well as to reduce operational complexity. Prior period results have been revised to conform to the current period presentation. Changes include:
| ● | The discontinuation of adjustments to net interest income and management and guarantee fee income which reflected the amortization of cash premiums and discounts on the consolidated Freddie Mac mortgage-related securities the company purchased as investments, as well as the amortization of certain guarantee buy-up and buy-down fees and credit delivery fees on mortgage loans it purchased. The discontinuation of the adjustments resulted in an increase to net interest income for the Investments segment of $179 million and a decrease to management and guarantee fee income for the Single-family Guarantee segment of $52 million for the three months ended December 31, 2015 to align with the current presentation. |
| ● | When the company securitizes loans into PCs, the premiums and discounts on the loans were previously to be amortized in net interest income. This amortization will now be reflected in other non-interest income, consistent with the amortization of the premiums and discounts on the securitized PCs themselves. The company reclassified $342 million of expense from net interest income into other non-interest income for the Investments segment for the three months ended December 31, 2015 to align with the current presentation. |
| ● | Impacts from the reclassification of mortgage loans from held-for-investment to held-for-sale will be reflected in aggregate as other non-interest income. The company reclassified $336 million of benefit from (provision) benefit for credit losses and $157 million of expense from other non-interest expense into other non-interest income for the Single-family Guarantee segment for the three months ended December 31, 2015 to align with the current presentation. |
Notes on Significant Reclassifications
(1) Net guarantee fees are reclassified in Segment Earnings from net interest income to management and guarantee fee income.
(2) Implied management and guarantee fee income related to unsecuritized loans held in the mortgage investments portfolio is reclassified in Segment Earnings from net interest income to management and guarantee fee income.
(3) The portion of the amount reversed for accrued but uncollected interest upon placing loans on a non-accrual status that relates to management and guarantee fees is reclassified in Segment Earnings from net interest income to management and guarantee fee income. The remaining portion of the allowance for lost interest is reclassified in Segment Earnings from net interest income to provision for credit losses.
(4) The accrual of periodic cash settlements of all derivatives is reclassified in Segment Earnings from derivative gains (losses) into net interest income to fully reflect the periodic cost associated with the protection provided by these contracts.
(5) Up-front cash paid or received upon the purchase or writing of swaptions and other option contracts is reclassified in Segment Earnings prospectively on a straight-line basis from derivative gains (losses) into net interest income over the contractual life of the instrument to fully reflect the periodic cost associated with the protection provided by these contracts.
Page 19
Freddie Mac
Notes on Non-GAAP Financial Measures
First Quarter 2016 Financial Results
(6) The expense related to the Temporary Payroll Tax Cut Continuation Act of 2011 is reclassified in Segment Earnings from other non-interest expense to management and guarantee fee income. As a result of the reclassification, the revenue and expense related to the legislated 10 basis point increase are netted within management and guarantee fee income.
(7) Impacts from the reclassification of seriously delinquent single-family mortgage loans from held-for-investment to held-for-sale and other subsequent activity is moved from benefit for credit losses and other non-interest expense and shown in aggregate in non-interest income.
Page 20