Attached files
| file | filename |
|---|---|
| 8-K - 8-K - CubeSmart | a16-10326_18k.htm |
Exhibit 99.1
1 MAY 2016

[LOGO]
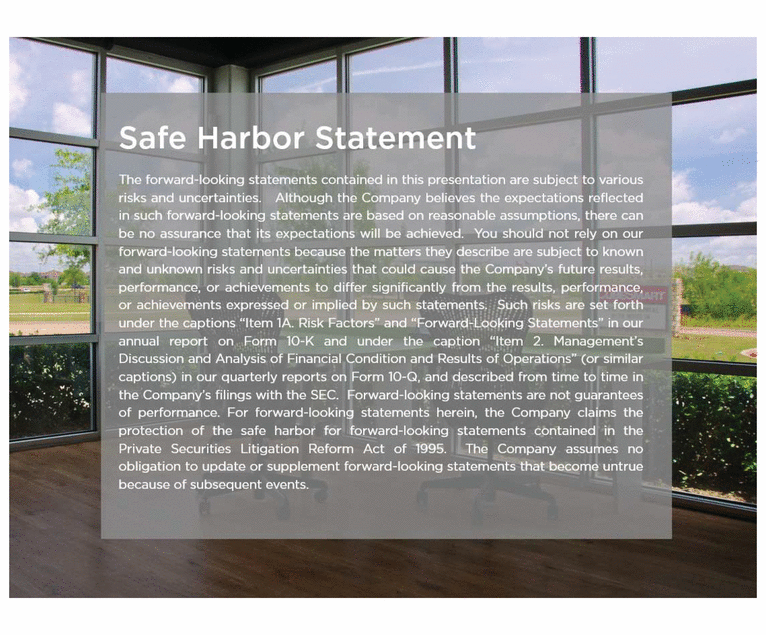
3 708 456 252
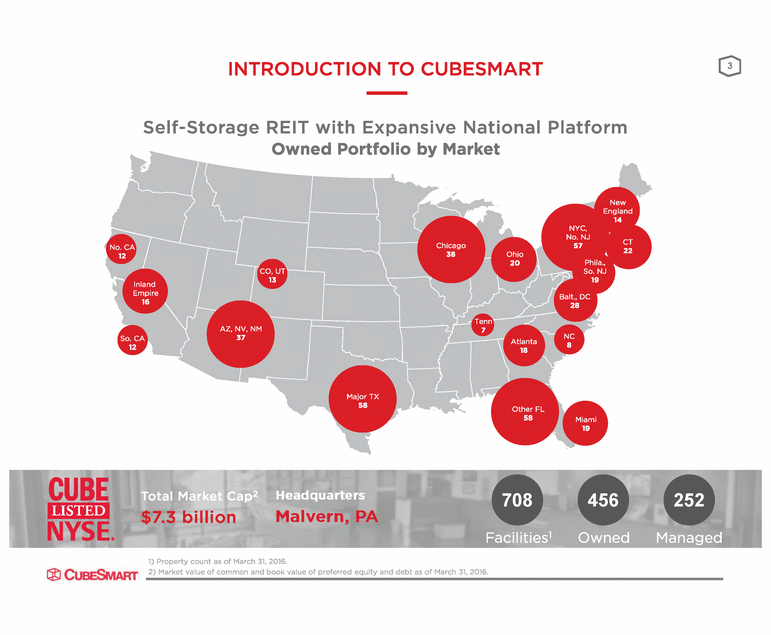
4 Leading Demographics A Focus on Supply Constrained Markets (in ‘000) 1 ($ in ‘000)
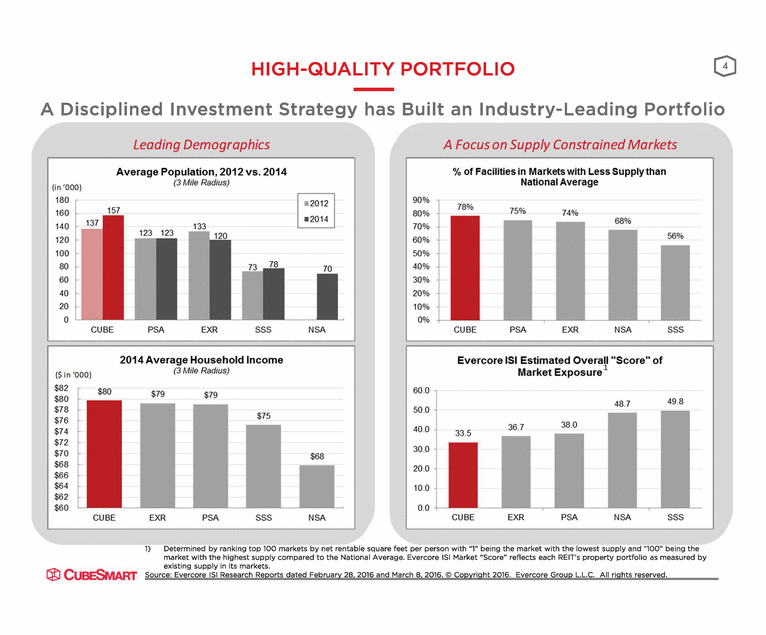
5 120.0% 110.8% 100.0% 80.0% 60.0% 40.0% 20.0% 0.0% -20.0% S& P500 RMZ Self-Storage REITs CUBE 94 .1% 37.9% 1 Year 2 Year 3 Year
LONG-TERM ®C-----------------INTERNAL GROWTH Maximize portfolio value through continued focus on customer service and operational enhancements.
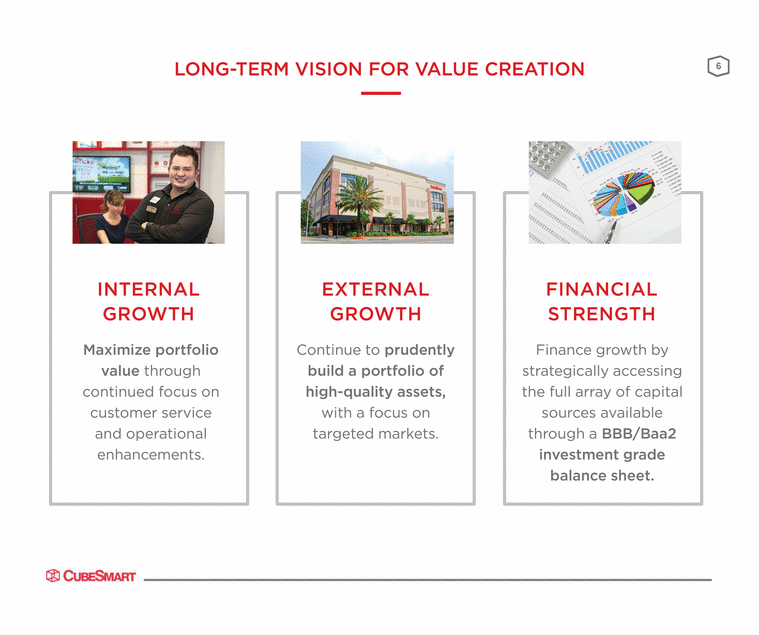
Expens 1) Financial data from January 1,2016 thr 2) Net operating income, or revenues le and how it reconciles to a GAAP measu ® CUBESNIARr3) As provided in the Company's Earnin Revenue Average Occupancy Revenue Expen
INTERNAL GROWTH: PERFORMANCE FUELED BY INNOVATION Enhancing the customer experience at all points of engagement through proprietary systems and processes.

INTERNAL GROWTH: Enhancing the custom through pro Constantly testing digital platforms, utilizing marketing advancements, sophisticated systems, and new programs that strengthen customer relationships before, during and after the storage rental process. t ®C----------------
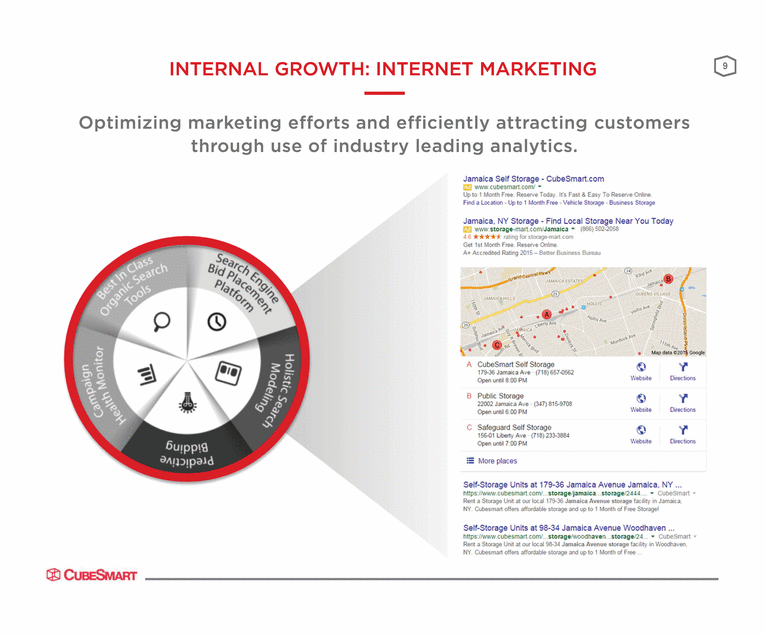
INTERNAL G Optimizing marketing through us ®CUBE5MART
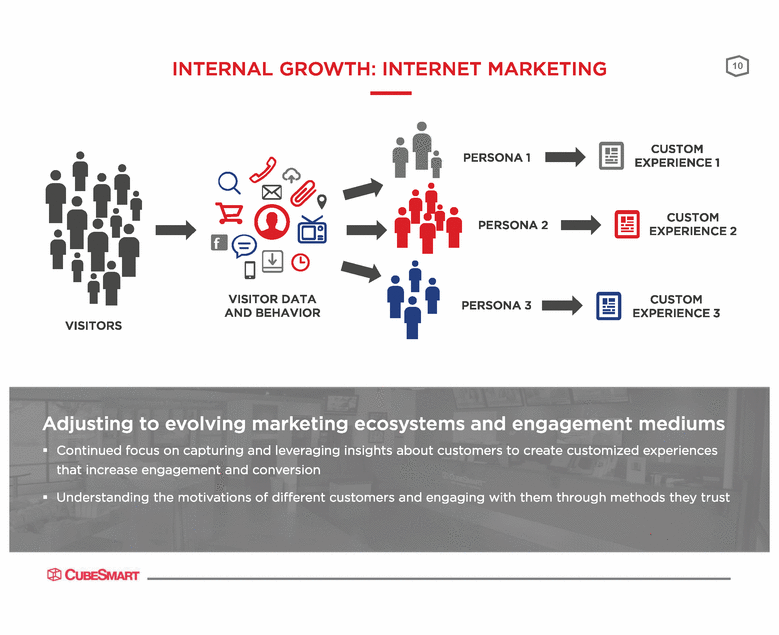
INTERNAL G • Q cl Q ,,.i .,,. l8J ,, . l2 [I®fi\ oC9 VISITOR D AND BEHA il VISITORS ®-----------------
11 ƒ ƒ ƒ
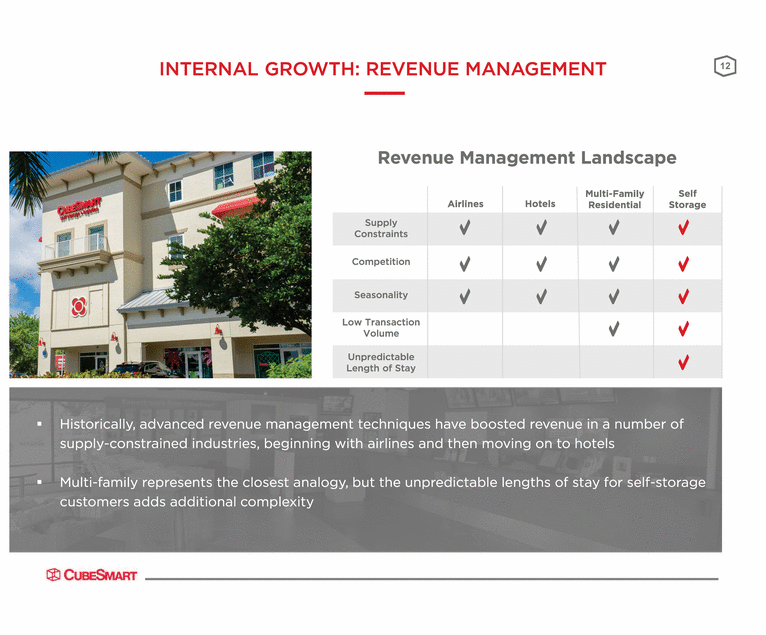
INTERNAL G • Historically, advanced revenue ma supply-constrained industries, beg • Multi-family represents the closes customers adds additional comple ®C-----------------
13 ƒ ƒƒ ƒƒ ƒƒ ƒ
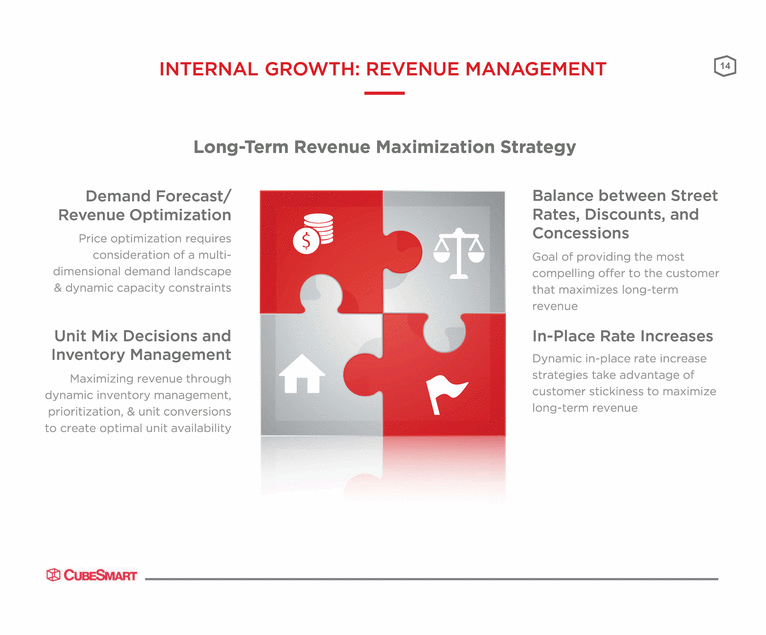
INTERNAL G Long-Term Demand Forecast/ Revenue Optimization Price optimization requires consideration of a multi dimensional demand landscape & dynamic capacity constraints Unit Mix Decisions and Inventory Management Maximizing revenue through dynamic inventory management, prioritization, & unit conversions to create optimal unit availability ®C-----------------------------
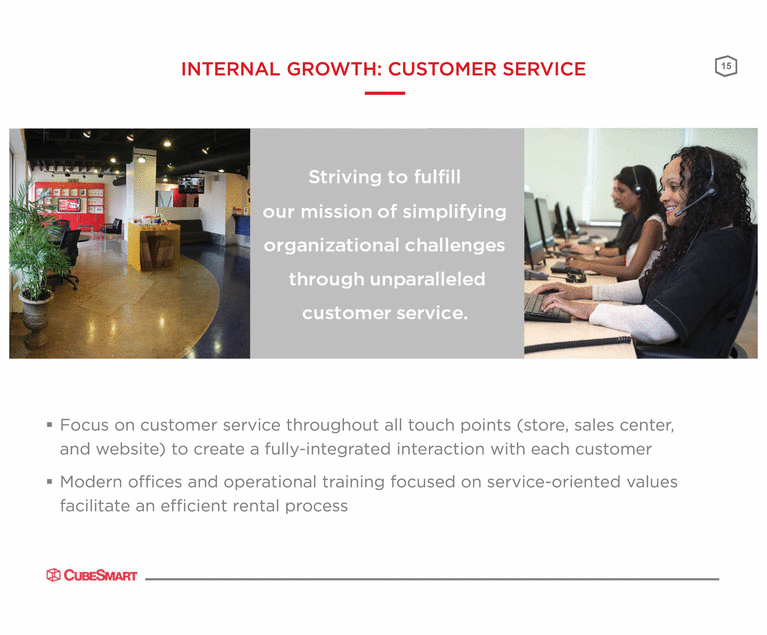
INTERNAL • Focus on customer service and website) to create a full • Modern offices and operatio facilitate an efficient rental ®C-----------------
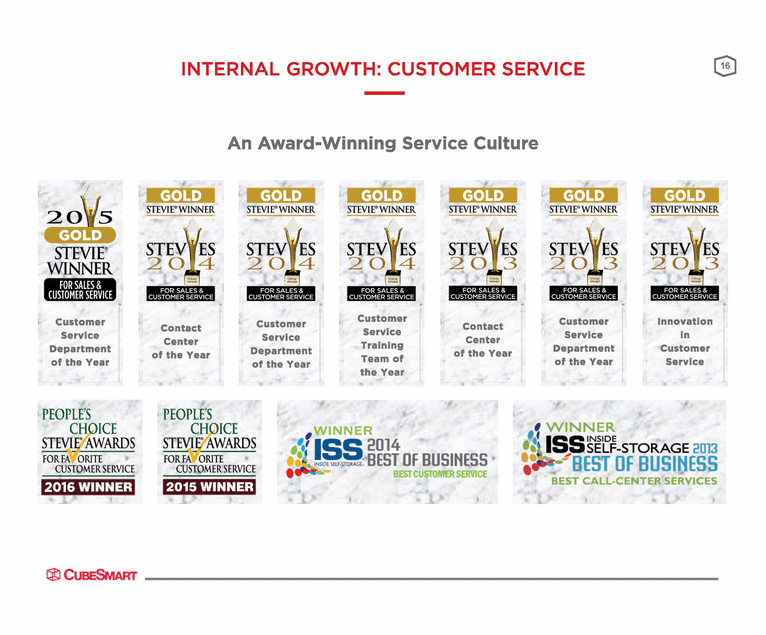
INTERNAL An Aw GOLD GOL STEVI WIN SfEVIE WINNER FOR SALES & FOR SA CUSTOMER SERVICE CUSTOMER Customer Service Department of the Year Custo Contact Center of the Year Servi Depart of the PEOPLE'S CHOICE STEVI 1\.WARDS FORFA ORITE CUSTOMER SERVICE FORFA ORITE CUSTOMER SERVICE WINNER 2015 WINNER --- ®Cu---------------2016 - -
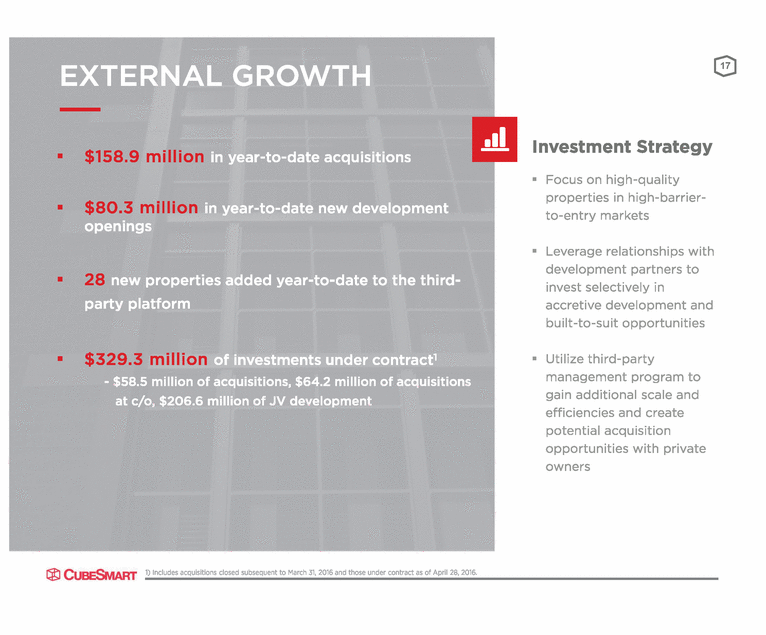
17 ƒ ƒ ƒ ƒ ƒ ƒ ƒ
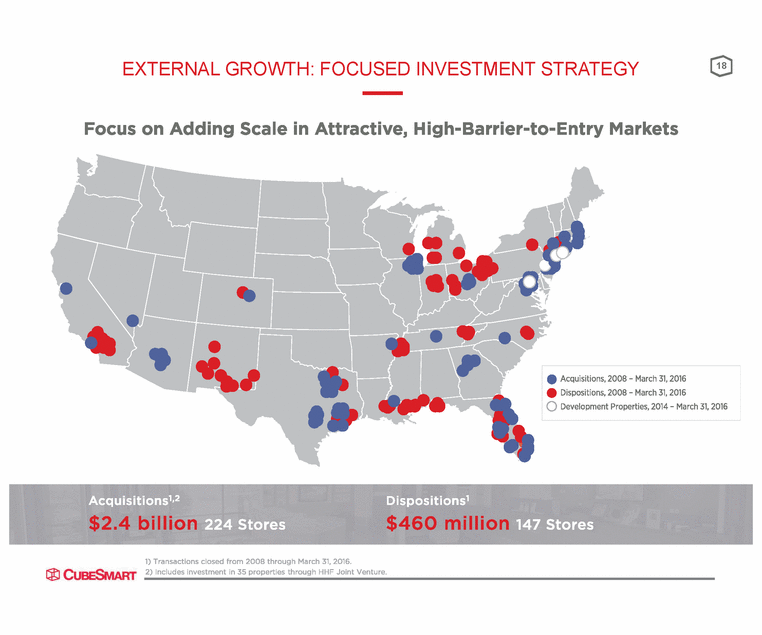
EXTERNAL GROW Focus on Adding Scale 1) Transactions closed from 2008 throu 2) Includes investment in 35 properties ® CUBESNIARr
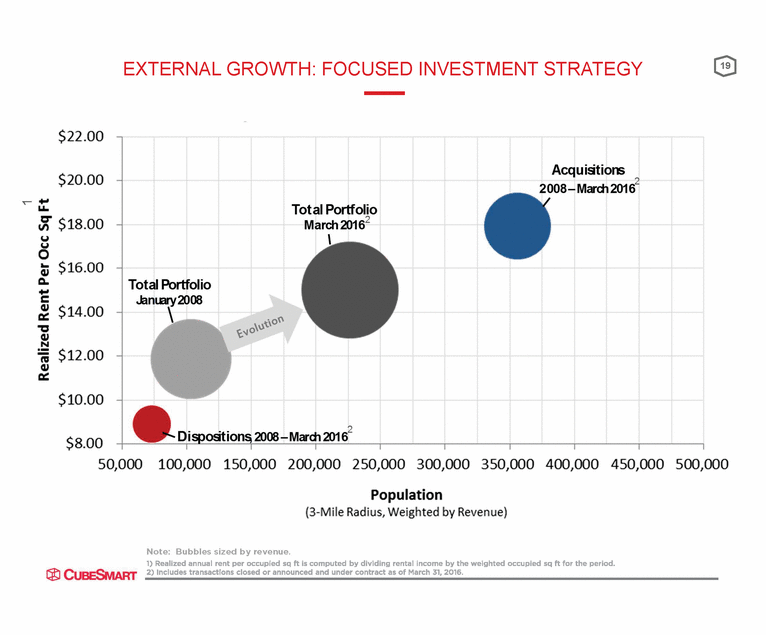
EXTERNAL GROWTH: FOCUSED INVESTMENT STRATEGY 19 2 2 2 1
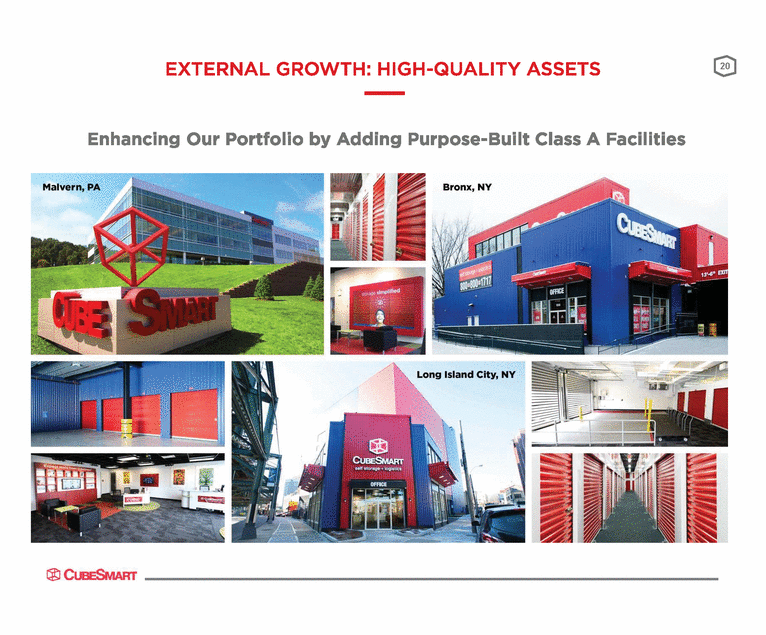
EXTERNAL G Enhancing Our Portfol Malvern, PA ®C-----------------
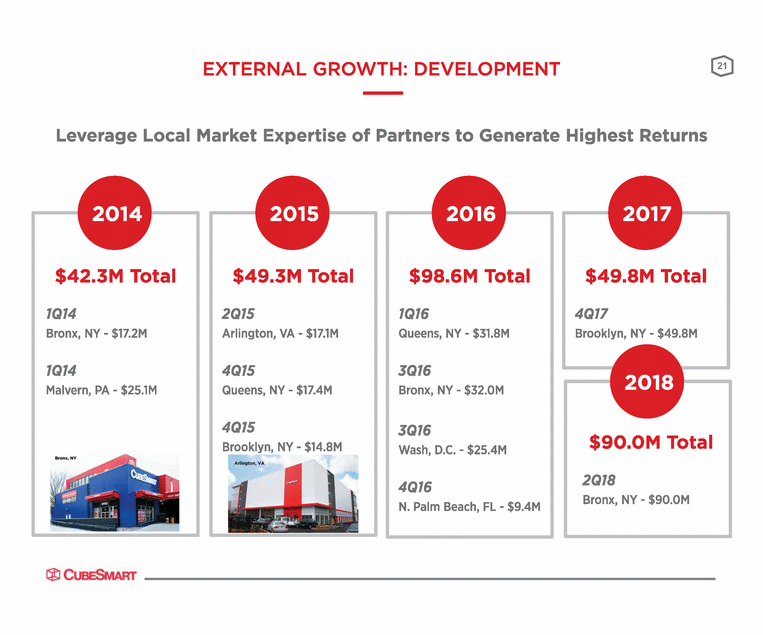
EXTERN Leverage Local Market Ex $42.3M Total $49.3 7Q14 Bronx, NY - $17.2M 2Q15 Arlington, V 1Q14 Malvern, PA-$25.1M 4Q15 Queens, NY 4Q15 Brooklyn, N ®CWESMMrr --------------
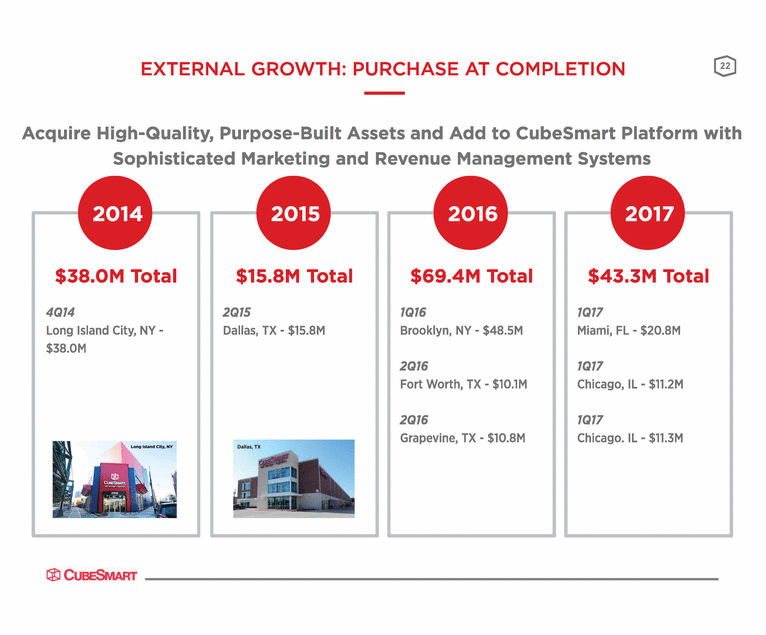
EXTERNAL GR Acquire High-Quality, Purpose Sophisticated Mark $15.8 2Q15 Dallas, TX - $38.0M Dallas, TX ®Cu------------------------------------$3 4Q14 Long 8.0M Total Island City, NY -
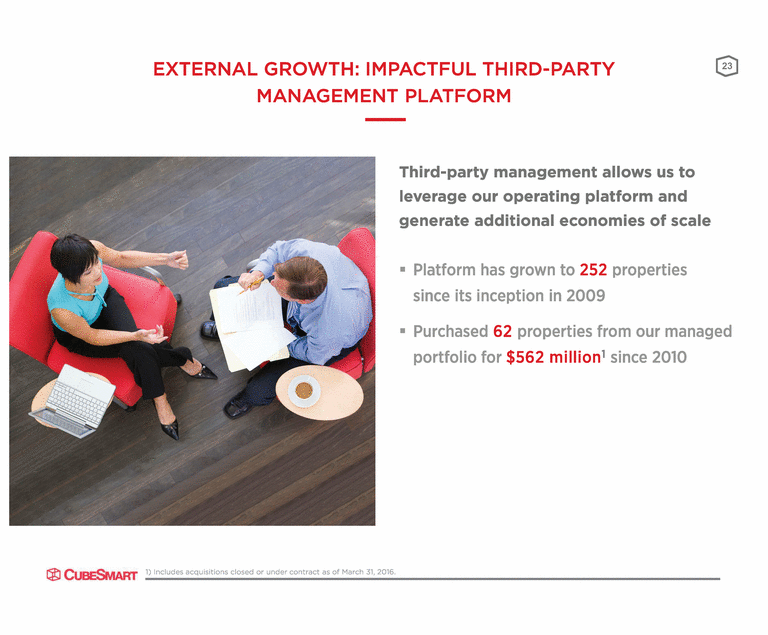
23 ƒ ƒ
24 ƒ ƒ

24 ƒ ƒ ƒ ƒ ƒ
25 1) Based on EBITDA and average debt outstanding during 1Q16. (in thousands)
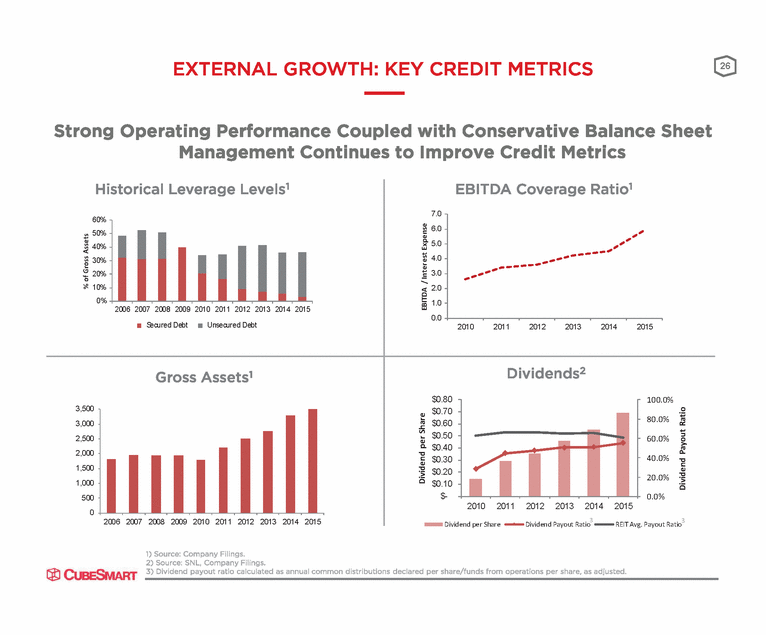
26 2010 2011 2012 2013 2014 2015 $0.70 $0.40 $0.20 Dividend per Share Dividend Payout Ratio REIT Avg. Payout Ratio % of Gross Assets Dividend per Share EBITDA / Interest Expense Dividend Payout Ratio 60% 50% 40% 30% 20% 10% 0% 2006 2007 2008 2009 2010 2011 2012 2013 2014 2015 Secured DebtUnsecured Debt 7.0 6.0 5.0 4.0 3.0 2.0 1.0 0.0 3,500 3,000 2,500 2,000 1,500 1,000 500 0 2006 2007 2008 2009 2010 2011 2012 2013 2014 2015 $0.80 100.0% $0.60 80.0% $0.50 60.0% $0.30 40.0% $0.10 20.0% $-0.0% 2010 2011 2012 2013 2014 2015 3 3
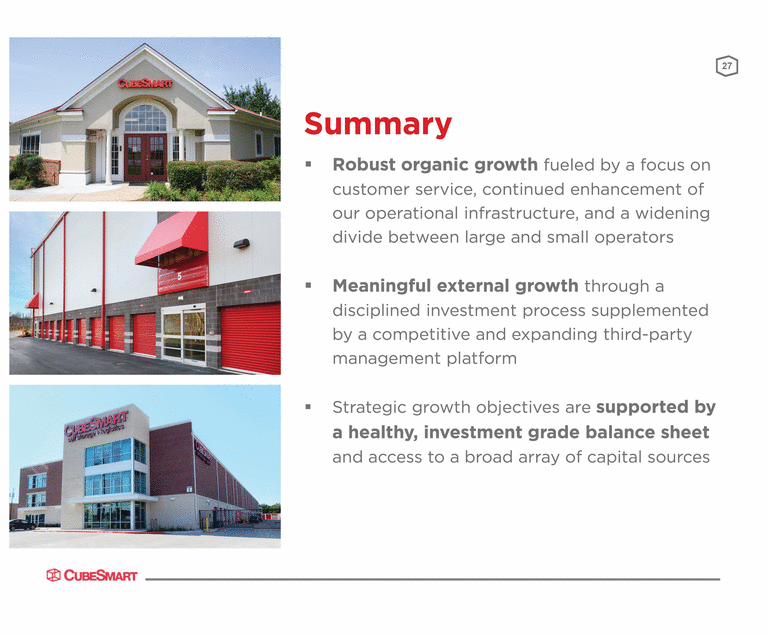
27 ƒ ƒ ƒ
