Attached files
| file | filename |
|---|---|
| 8-K - ARROW ELECTRONICS, INC. 8-K - ARROW ELECTRONICS INC | a51333514.htm |
| EX-99.1 - EXHIBIT 99.1 - ARROW ELECTRONICS INC | a51333514_ex991.htm |
Exhibit 99.2
2016 First-Quarter CFO Commentary As reflected in our earnings release, there are a number of items that impact the comparability of our results with those in the trailing quarter and prior quarter of last year. Any discussion of our results will exclude these items to give you a better sense of our operating results. As always, the operating information we provide to you should be used as a complement to GAAP numbers. For a complete reconciliation between our GAAP and non-GAAP results, please refer to our earnings release and the earnings reconciliation found at the end of this document. The following reported and adjusted information included in this CFO commentary is unaudited and should be read in conjunction with the company’s Form 10-Q for the quarterly period ended April 2, 2016 and the Annual Report on Form 10-K as filed with the Securities and Exchange Commission. First-quarter 2016 Non-GAAP earnings per share of $1.43 grew 8% Y/Y.Five Years Out investor.arrow.com
First-Quarter 2016 CFO Commentary First-Quarter Summary We again posted strong quarterly results in the first quarter of 2016 with record first-quarter sales and earnings per share. Sales and earnings per share were also above the midpoints of our expectations. Both business segments and all regions delivered growth year over year. Our first-quarter 2016 global component sales advanced 10 percent year over year. The market generally tracked to our expectations. Our strategic focus continues to be on small-to-medium-sized manufacturing customers. Europe again delivered robust sales growth this quarter. Our Americas business returned to growth as we anticipated. Asia sales exceeded our own expectations. In the first quarter, enterprise computing solutions again delivered growth that was above most measures of IT spending. Our unique focus on selling comprehensive solutions has allowed us to further differentiate our value-added distribution business from the competition. Our suppliers and customers value our solutions-driven approach, and continue to award us with more business as a result. ECS sales advanced 9 percent year over year. ECS achieved record first-quarter sales, operating income, and operating margin. We delivered record first-quarter sales and earnings per share. 2 Five Years Out investor.arrow.com
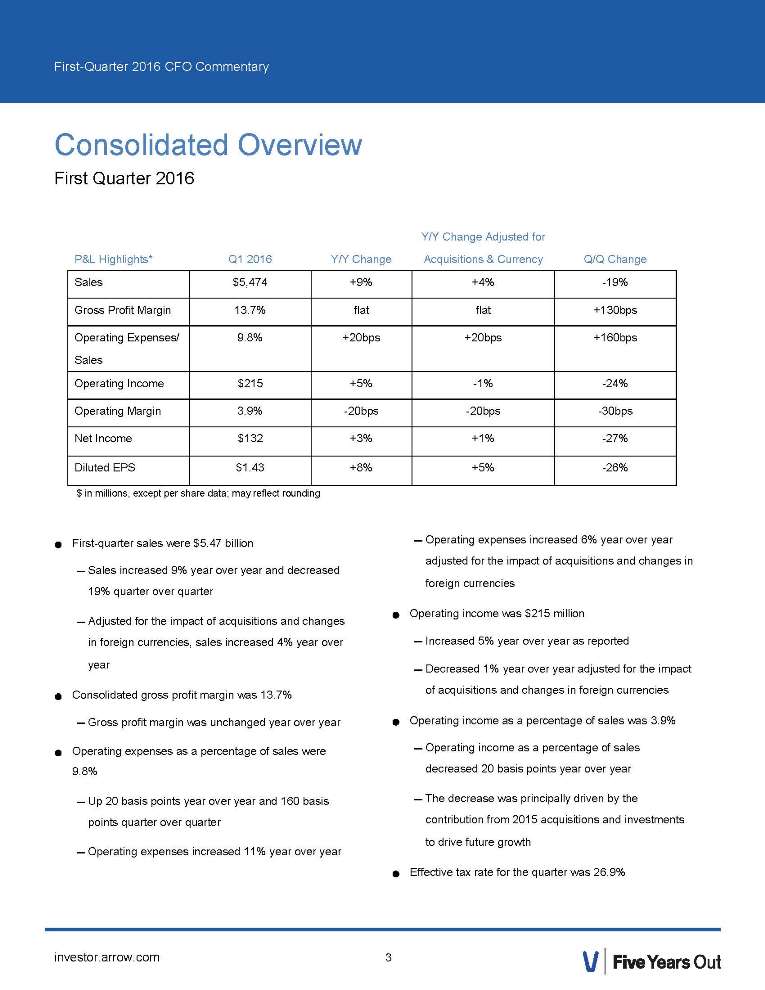
First-Quarter 2016 CFO Commentary P&L Highlights* Q1 2016 Y/Y Change Y/Y Change Adjusted for Acquisitions & Currency Q/Q Change Sales $5,474 +9% +4% -19% Gross Profit Margin 13.7% flat flat 130bps Operating Expenses/ Sales 9.8% +20bps +20bps +160bps Operating Income $215 +5% -1% -24% Operating Margin 3.9% -20bps -20bps -30bps Net Income $132 +3% +1% -27% Diluted EPS $1.43 +8% +5% -26% Consolidated Overview First Quarter 2016 First-quarter sales were $5.47 billion – Sales increased 9% year over year and decreased 19% quarter over quarter – Adjusted for the impact of acquisitions and changes in foreign currencies, sales increased 4% year over year Consolidated gross profit margin was 13.7% – Gross profit margin was unchanged year over year Operating expenses as a percentage of sales were 9.8% – Up 20 basis points year over year and 160 basis points quarter over quarter – Operating expenses increased 11% year over year – Operating expenses increased 6% year over year adjusted for the impact of acquisitions and changes in foreign currencies Operating income was $215 million – Increased 5% year over year as reported – Decreased 1% year over year adjusted for the impact of acquisitions and changes in foreign currencies Operating income as a percentage of sales was 3.9% – Operating income as a percentage of sales decreased 20 basis points year over year – The decrease was principally driven by the contribution from 2015 acquisitions and investments to drive future growth Effective tax rate for the quarter was 26.9% $ in millions, except per share data; may reflect rounding 3 Five Years Out investor.arrow.com
First-Quarter 2016 CFO Commentary Five Years Out investor.arrow.com Net income was $132 million – Increased 3% year over year – Adjusted for the impact of acquisitions and changes in foreign currencies, net income increased by 1% year over year Earnings per share were $1.43 on a diluted basis – Diluted EPS increased 8% year over year – Adjusted for the impact of acquisitions and changes in foreign currencies, diluted EPS increased by 5% year over year A reconciliation of non-GAAP adjusted financial measures, including sales, as adjusted, operating income, as adjusted, net income attributable to shareholders, as adjusted, and net income per share, as adjusted, to GAAP financial measures is presented in the reconciliation tables included herein. 4
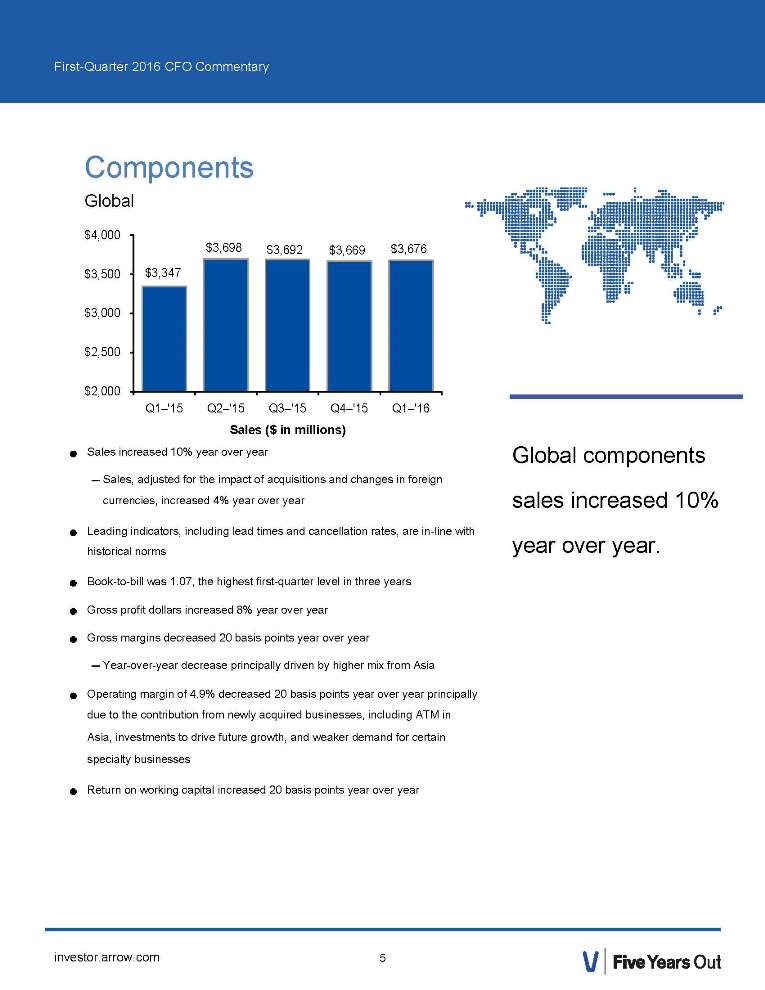
Five Years Out investor.arrow.com First-Quarter 2016 CFO Commentary Components Global Global components sales increased 10% year over year. Sales increased 10% year over year – Sales, adjusted for the impact of acquisitions and changes in foreign currencies, increased 4% year over year Leading indicators, including lead times and cancellation rates, are in-line with historical norms Book-to-bill was 1.07, the highest first-quarter level in three years Gross profit dollars increased 8% year over year Gross margins decreased 20 basis points year over year – Year-over-year decrease principally driven by higher mix from Asia Operating margin of 4.9% decreased 20 basis points year over year principally due to the contribution from newly acquired businesses, including ATM in Asia, investments to drive future growth, and weaker demand for certain specialty businesses Return on working capital increased 20 basis points year over year $3,698 $3,692 $3,669 $3,676 $3,347 $2,000 $2,500 $3,000 $3,500 $4,000 Q1–'15 Q2–'15 Q3–'15 Q4–'15 Q1–'16 Sales ($ in millions) 5
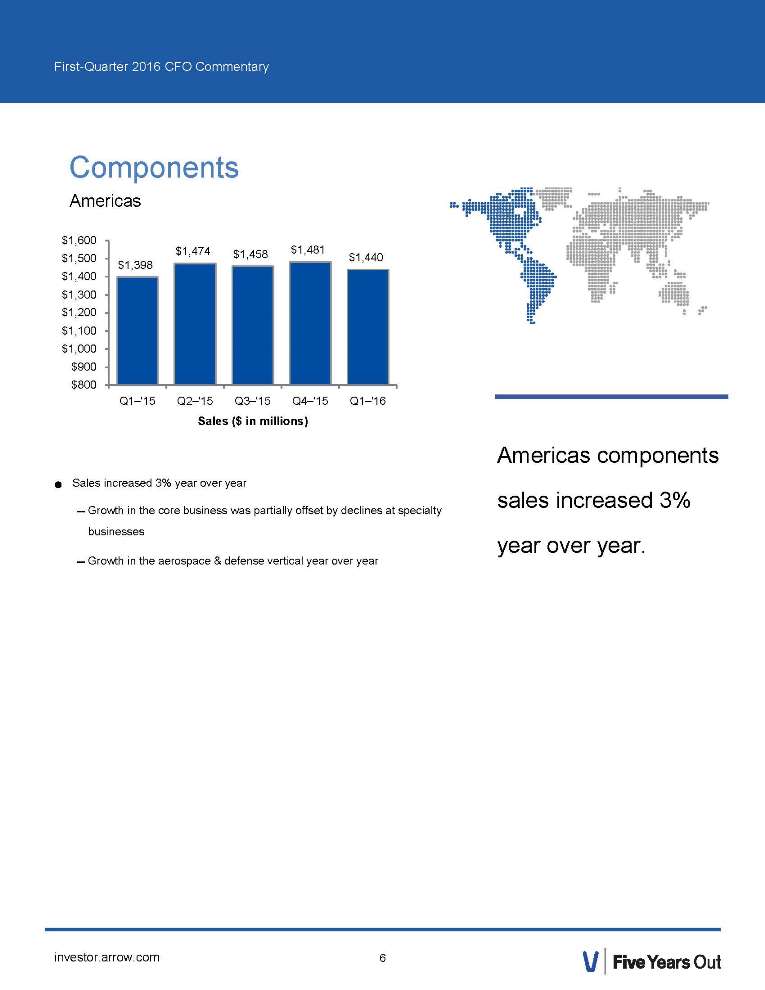
Five Years Out investor.arrow.com First-Quarter 2016 CFO Commentary Components Americas Americas components sales increased 3% year over year. Sales increased 3% year over year – Growth in the core business was partially offset by declines at specialty businesses – Growth in the aerospace & defense vertical year over year $1,398 $1,474 $1,458 $1,481 $1,440 $800 $900 $1,000 $1,100 $1,200 $1,300 $1,400 $1,500 $1,600 Q1–'15 Q2–'15 Q3–'15 Q4–'15 Q1–'16 Sales ($ in millions) 6
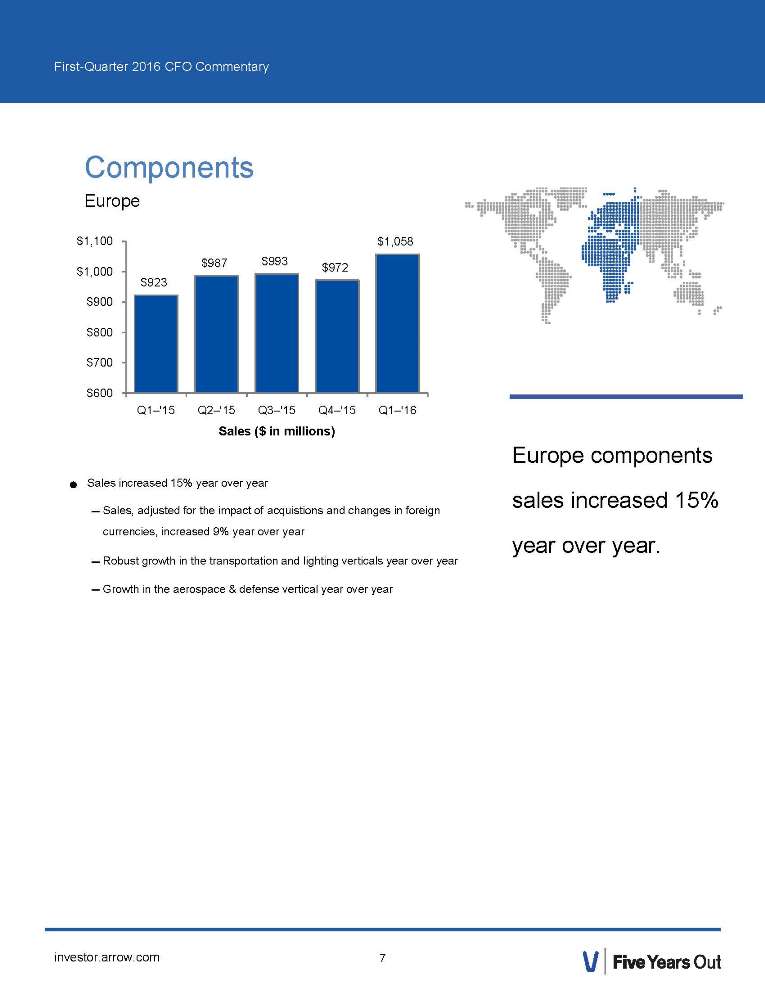
Five Years Out investor.arrow.com First-Quarter 2016 CFO Commentary Components Europe Europe components sales increased 15% year over year. Sales increased 15% year over year – Sales, adjusted for the impact of acquistions and changes in foreign currencies, increased 9% year over year – Robust growth in the transportation and lighting verticals year over year – Growth in the aerospace & defense vertical year over year $923 $987 $993 $972 $1,058 $600 $700 $800 $900 $1,000 $1,100 Q1–'15 Q2–'15 Q3–'15 Q4–'15 Q1–'16 Sales ($ in millions) 7
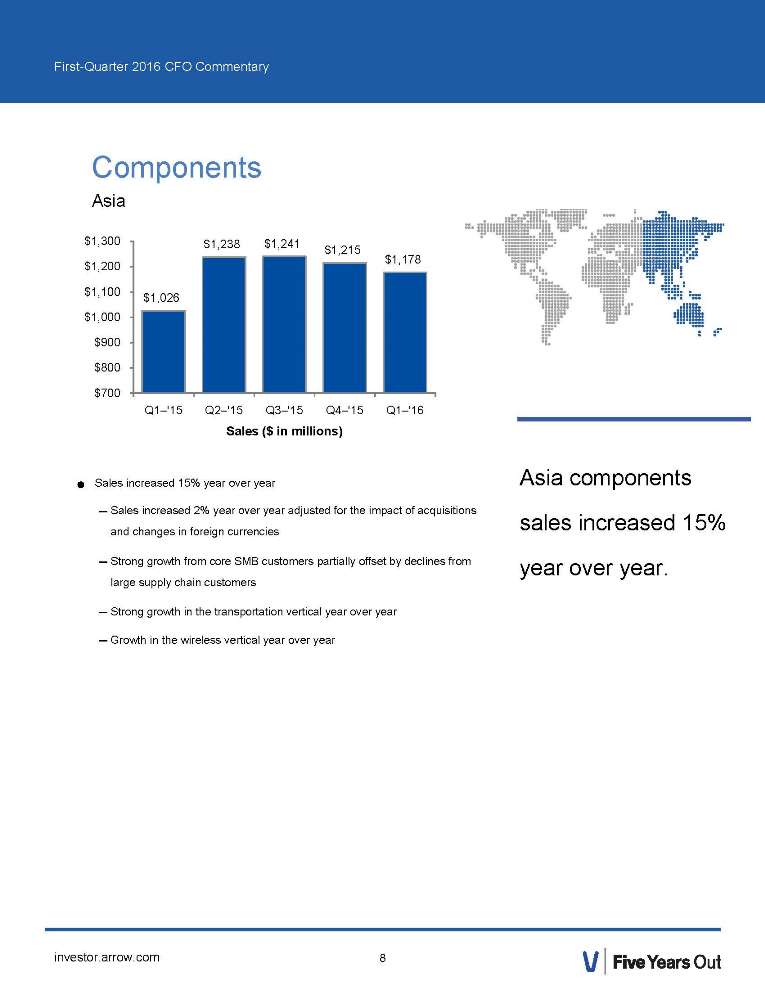
Five Years Out investor.arrow.com First-Quarter 2016 CFO Commentary Components Asia Asia omponents sales increased 15% year over year. Sales increased 15% year over year – Sales increased 2% year over year adjusted for the impact of acquisitions and changes in foreign currencies – Strong growth from core SMB customers partially offset by declines from large supply chain customers – Strong growth in the transportation vertical year over year – Growth in the wireless vertical year over year $1,026 $1,238 $1,241 $1,215 $1,178 $700 $800 $900 $1,000 $1,100 $1,200 $1,300 Q1–'15 Q2–'15 Q3–'15 Q4–'15 Q1–'16 Sales ($ in millions) 8
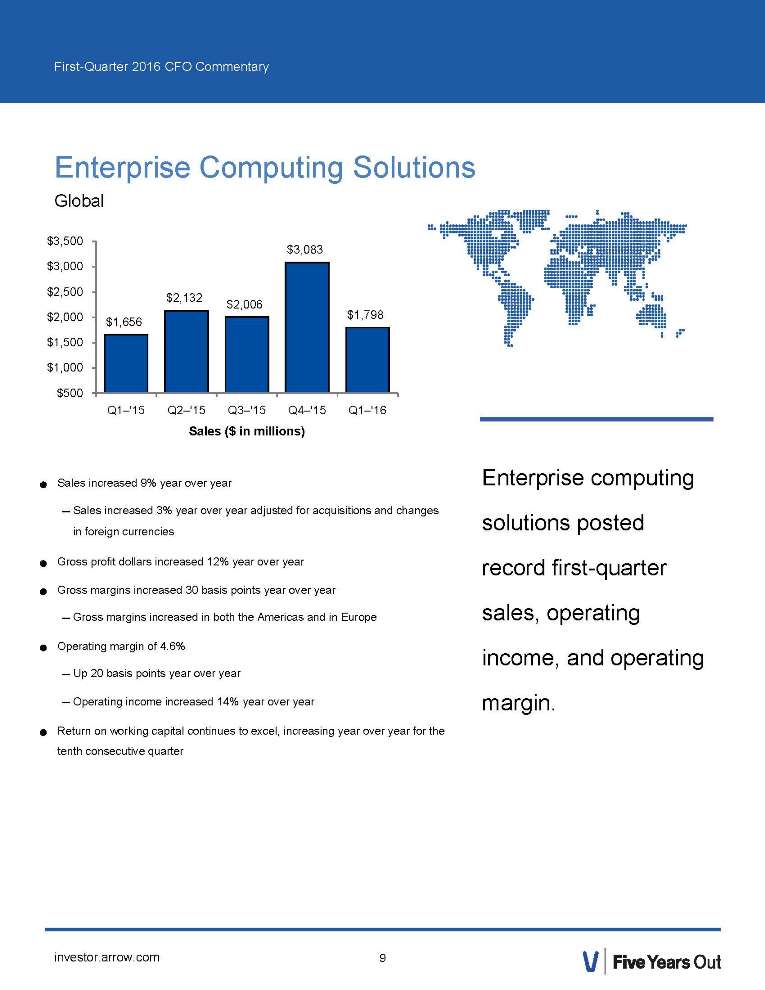
Five Years Out investor.arrow.com First-Quarter 2016 CFO Commentary Enterprise Computing Solutions Global Enterprise computing solutions posted record first-quarter sales, operating income, and operating margin. Sales increased 9% year over year – Sales increased 3% year over year adjusted for acquisitions and changes in foreign currencies Gross profit dollars increased 12% year over year Gross margins increased 30 basis points year over year – Gross margins increased in both the Americas and in Europe Operating margin of 4.6% – Up 20 basis points year over year – Operating income increased 14% year over year Return on working capital continues to excel, increasing year over year for the tenth consecutive quarter $1,656 $2,132 $2,006 $3,083 $1,798 $500 $1,000 $1,500 $2,000 $2,500 $3,000 $3,500 Q1–'15 Q2–'15 Q3–'15 Q4–'15 Q1–'16 Sales ($ in millions) 9
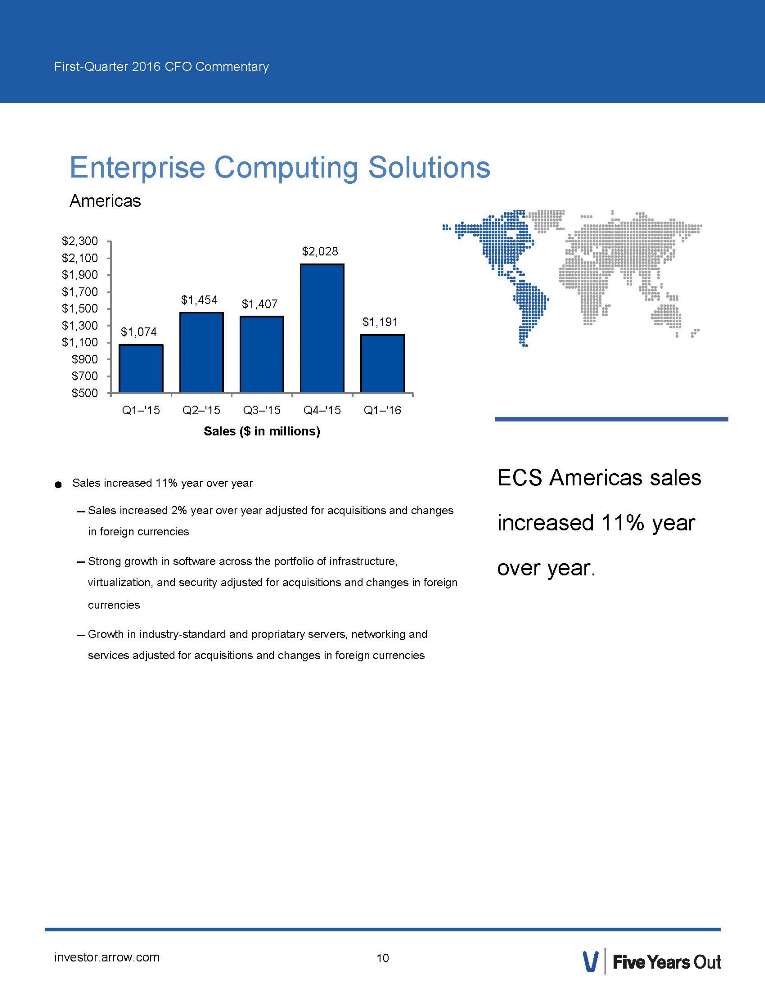
Five Years Out investor.arrow.com First-Quarter 2016 CFO Commentary Enterprise Computing Solutions Americas ECS Americas sales increased 11% year over year. Sales increased 11% year over year – Sales increased 2% year over year adjusted for acquisitions and changes in foreign currencies – Strong growth in software across the portfolio of infrastructure, virtualization, and security adjusted for acquisitions and changes in foreign currencies – Growth in industry-standard and propriatary servers, networking and services adjusted for acquisitions and changes in foreign currencies $1,074 $1,454 $1,407 $2,028 $1,191 $500 $700 $900 $1,100 $1,300 $1,500 $1,700 $1,900 $2,100 $2,300 Q1–'15 Q2–'15 Q3–'15 Q4–'15 Q1–'16 Sales ($ in millions) 10
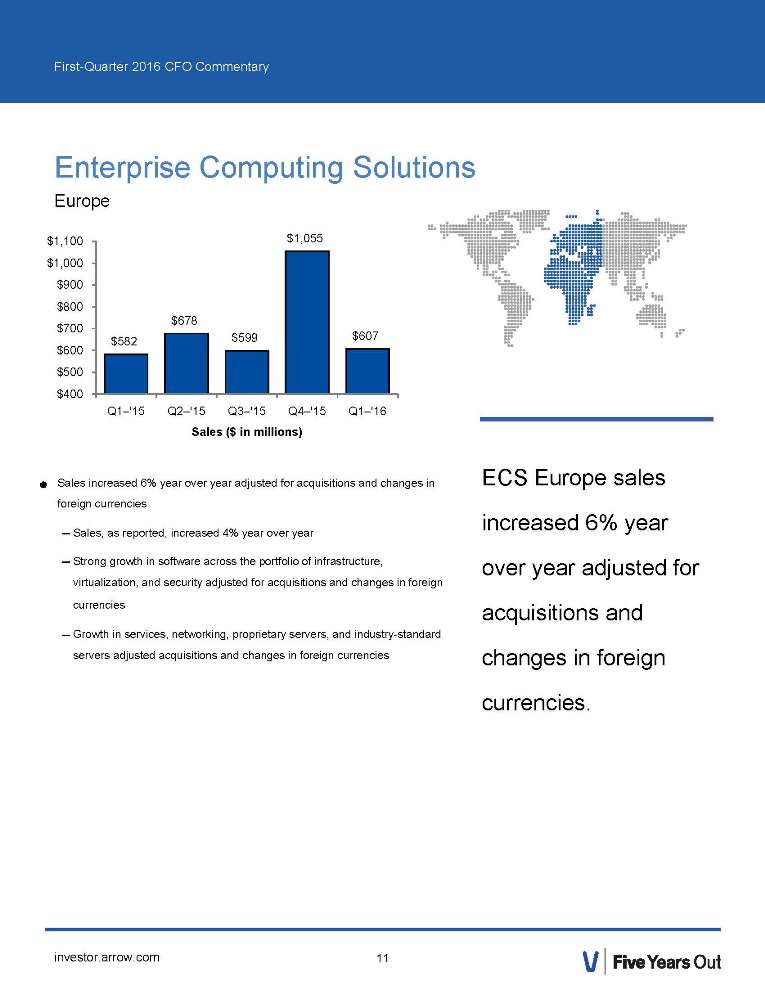
Five Years Out investor.arrow.com First-Quarter 2016 CFO Commentary Enterprise Computing Solutions Europe ECS Europe sales increased 6% year over year adjusted for acquisitions and changes in foreign currencies. Sales increased 6% year over year adjusted for acquisitions and changes in foreign currencies – Sales, as reported, increased 4% year over year – Strong growth in software across the portfolio of infrastructure, virtualization, and security adjusted for acquisitions and changes in foreign currencies – Growth in services, networking, proprietary servers, and industry-standard servers adjusted acquisitions and changes in foreign currencies $582 $678 $599 $1,055 $607 $400 $500 $600 $700 $800 $900 $1,000 $1,100 Q1–'15 Q2–'15 Q3–'15 Q4–'15 Q1–'16 Sales ($ in millions) 11
Five Years Out investor.arrow.com First-Quarter 2016 CFO Commentary Cash Flow and Balance Sheet Highlights Cash Flow from Operations Cash from operating activities was negative $37 million in the quarter and was $860 million on a trailing 12-month basis Working Capital Working capital to sales was 15.9% in the quarter. Return on working capital was 24.6% in the first quarter, up 120 basis points year over year. Return on Invested Capital Return on invested capital was 9.5% in the quarter and ahead of our weighted average cost of capital. Share Buyback We repurchased approximately $2.5 million of our stock, bringing our total cash returned to shareholders over the last 12 months to approximately $280 million. Debt and Liquidity Net-debt-to-last-12-months EBITDA ratio is approximately 2.2x. Our total liquidity is $2.4 billion when including our cash of $395 million. Trailing twelve-month cash flow from operations was $860 million. 12
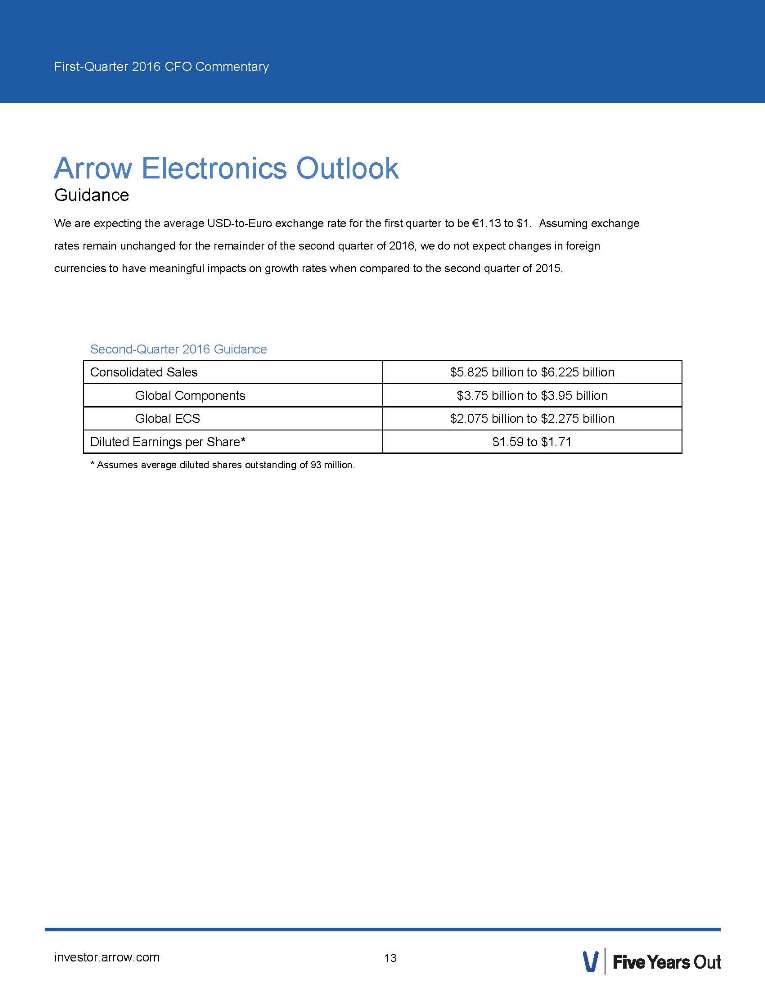
Five Years Out investor.arrow.com First-Quarter 2016 CFO Commentary Second-Quarter 2016 Guidance Consolidated Sales $5.825 billion to $6.225 billion Global Components $3.75 billion to $3.95 billion Global ECS $2.075 billion to $2.275 billion Diluted Earnings per Share* $1.59 to $1.71 * Assumes average diluted shares outstanding of 93 million. Arrow Electronics Outlook Guidance We are expecting the average USD-to-Euro exchange rate for the first quarter to be €1.13 to $1. Assuming exchange rates remain unchanged for the remainder of the second quarter of 2016, we do not expect changes in foreign currencies to have meaningful impacts on growth rates when compared to the second quarter of 2015. 13
Five Years Out investor.arrow.com First-Quarter 2016 CFO Commentary Risk Factors The discussion of the company’s business and operations should be read together with the risk factors contained in Item 1A of its 2015 Annual Report on Form 10-K, filed with the Securities and Exchange Commission, which describe various risks and uncertainties to which the company is or may become subject. If any of the described events occur, the company’s business, results of operations, financial condition, liquidity, or access to the capital markets could be materially adversely affected. Information Relating to Forward- Looking Statements This press release includes forward-looking statements that are subject to numerous assumptions, risks, and uncertainties, which could cause actual results or facts to differ materially from such statements for a variety of reasons, including, but not limited to: industry conditions, company’s implementation of its new enterprise resource planning system, changes in product supply, pricing and customer demand, competition, other vagaries in the global components and global enterprise computing solutions markets, changes in relationships with key suppliers, increased profit margin pressure, effects of additional actions taken to become more efficient or lower costs, risks related to the integration of acquired businesses, changes in legal and regulatory matters, and the company’s ability to generate additional cash flow. Forward-looking statements are those statements which are not statements of historical fact. These forward-looking statements can be identified by forward-looking words such as “expects,” “anticipates,” “intends,” “plans,” “may,” “will,” “believes,” “seeks,” “estimates,” and similar expressions. Shareholders and other readers are cautioned not to place undue reliance on these forward-looking statements, which speak only as of the date on which they are made. The company undertakes no obligation to update publicly or revise any of the forward-looking statements. For a further discussion of factors to consider in connection with these forward-looking statements, investors should refer to Item 1A Risk Factors of the company’s Annual Report on Form 10-K for the year ended December 31, 2015. 14
Five Years Out investor.arrow.com First-Quarter 2016 CFO Commentary Certain Non-GAAP Financial Information In addition to disclosing financial results that are determined in accordance with accounting principles generally accepted in the United States (“GAAP”), the company also provides certain non-GAAP financial information relating to sales, operating income, net income attributable to shareholders, and net income per basic and diluted share. The company provides sales on a non-GAAP basis adjusted for the impact of changes in foreign currencies and the impact of acquisitions by adjusting the company’s operating results for businesses acquired, including the amortization expense related to acquired intangible assets, as if the acquisitions had occurred at the beginning of the earliest period presented (referred to as “impact of acquisitions”). Operating income, net income attributable to shareholders, and net income per basic and diluted share are adjusted for certain charges, credits, gains, and losses that the company believes impact the comparability of its results of operations. These charges, credits, gains, and losses arise out of the company’s efficiency enhancement initiatives, acquisitions (including intangible assets amortization expense), loss on prepayment of debt, and (gain)/loss on investments. A reconciliation of the company’s non-GAAP financial information to GAAP is set forth in the tables below. The company believes that such non-GAAP financial information is useful to investors to assist in assessing and understanding the company’s operating performance and underlying trends in the company’s business because management considers these items referred to above to be outside the company’s core operating results. This non- GAAP financial information is among the primary indicators management uses as a basis for evaluating the company’s financial and operating performance. In addition, the company’s Board of Directors may use this non-GAAP financial information in evaluating management performance and setting management compensation. The presentation of this additional non-GAAP financial information is not meant to be considered in isolation or as a substitute for, or alternative to, operating income, net income attributable to shareholders and net income per basic and diluted share determined in accordance with GAAP. Analysis of results and outlook on a non-GAAP basis should be used as a complement to, and in conjunction with, data presented in accordance with GAAP. The company believes that such non-GAAP financial information is useful to investors to assist in assessing and understanding the company’s operating performance. 15
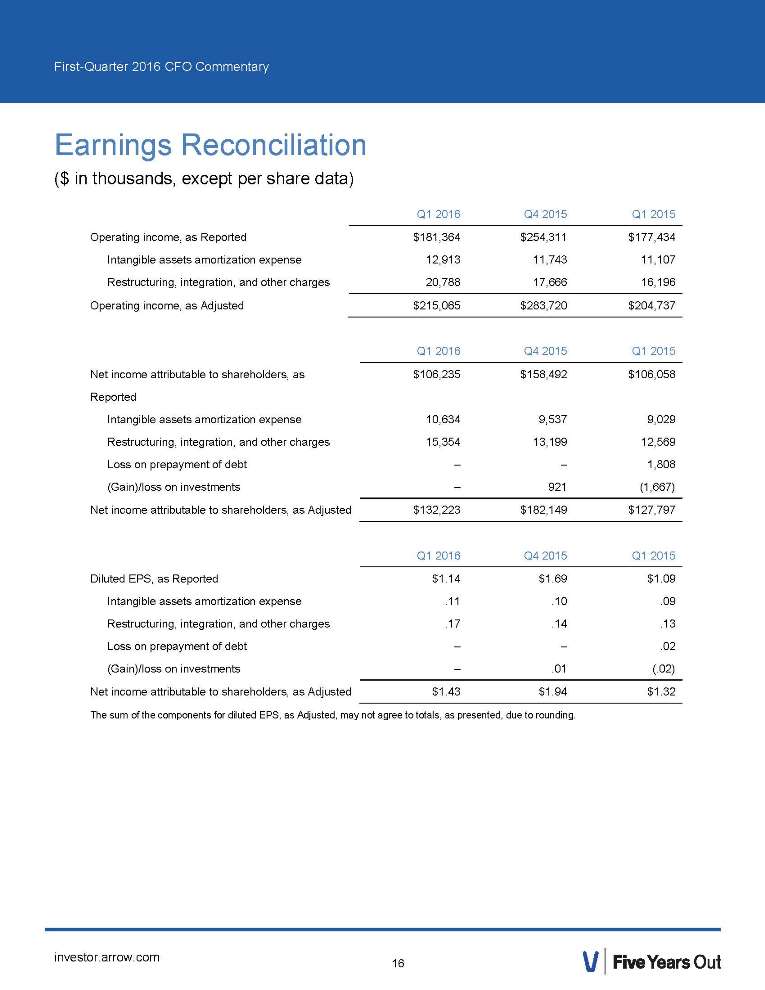
Five Years Out investor.arrow.com First-Quarter 2016 CFO Commentary Q1 2016 Q4 2015 Q1 2015 Operating income, as Reported $181,364 $254,311 $177,434 Intangible assets amortization expense 12,913 11,743 11,107 Restructuring, integration, and other charges 20,788 17,666 16,196 Operating income, as Adjusted $215,065 $283,720 $204,737 Q1 2016 Q4 2015 Q1 2015 Net income attributable to shareholders, as Reported $106,235 $158,492 $106,058 Intangible assets amortization expense 10,634 9,537 9,029 Restructuring, integration, and other charges 15,354 13,199 12,569 Loss on prepayment of debt – – 1,808 (Gain)/loss on investments – 921 (1,667) Net income attributable to shareholders, as Adjusted $132,223 $182,149 $127,797 Q1 2016 Q4 2015 Q1 2015 Diluted EPS, as Reported $1.14 $1.69 $1.09 Intangible assets amortization expense .11 .10 .09 Restructuring, integration, and other charges .17 .14 .13 Loss on prepayment of debt – – .02 (Gain)/loss on investments – .01 (.02) Net income attributable to shareholders, as Adjusted $1.43 $1.94 $1.32 The sum of the components for diluted EPS, as Adjusted, may not agree to totals, as presented, due to rounding. Earnings Reconciliation ($ in thousands, except per share data) 16
First-Quarter 2016 CFO Commentary Earnings Reconciliation References to restructuring and other charges refer to the following incremental charges taken in the periods indicated: Q1-16 Intangible Assets Amortization Expense During the first quarter of 2016, the company recorded intangible assets amortization expense of $12.9 million ($10.6 million net of related taxes or $.11 per share on a diluted basis). Q1-16 Restructuring, Integration, and Other Charges During the first quarter of 2016, the company recorded restructuring, integration, and other charges of $20.8 million ($15.4 million net of related taxes or $.17 per share on a diluted basis). Q4-15 Intangible Assets Amortization Expense During the fourth quarter of 2015, the company recorded intangible assets amortization expense of $11.7 million ($9.5 million net of related taxes or $.10 per share on a diluted basis). Q4-15 Restructuring, Integration, and Other Charges During the fourth quarter of 2015, the company recorded estructuring, integration, and other charges of $17.7 million ($13.2 million net of related taxes or $.14 per share on a diluted basis). Q4-15 Net Loss During the fourth quarter of 2015, the company recorded a net loss of $3.9 million ($0.9 million net of related taxes or $.01 per share on a diluted basis). The net loss consisted of a $2.9 million loss on prepayment of debt and $3 million other loss, offset partially by a $2 million gain on sale of investment. Q1-15 Intangible Assets Amortization Expense During the first quarter of 2015, the company recorded intangible assets amortization expense of $11.1 million ($9.0 million net of related taxes or $.09 per share on a diluted basis). Q1-15 Restructuring, Integration, and Other Charges During the first quarter of 2015, the company recorded restructuring, integration, and other charges of $16.2 million ($12.6 million net of related taxes or $.13 per share on a diluted basis). Q1-15 Loss on prepayment of debt During the first quarter of 2015, the company recorded a loss on prepayment of debt of $2.9 million ($1.8 million net of related taxes or $.02 per share on a diluted basis), related to the redemption of $250.0 million principal amount of its 3.375% notes due November 2015. Q1-15 Gain on sale of investment During the first quarter of 2015, the company recorded a gain on sale of investment of $2.0 million ($1.7 million net of related taxes or $.02 per share on a diluted basis). 17