Attached files
| file | filename |
|---|---|
| EX-99.1 - EX-99.1 - AMAG PHARMACEUTICALS, INC. | a16-10005_1ex99d1.htm |
| 8-K - 8-K - AMAG PHARMACEUTICALS, INC. | a16-10005_18k.htm |
Exhibit 99.2
AMAG Pharmaceuticals Q1-2016 Financial Results May 3, 2016
This presentation contains forward-looking statements within the meaning of the Private Securities Litigation Reform Act of 1995 and other federal securities laws. Any statements contained herein which do not describe historical facts, including among others, statements regarding the impact of investments in AMAG’s next generation development programs on the future growth of Makena and Feraheme; expectations for AMAG’s next generation development programs for Makena, including positive indicators on Makena growth after the commercial launch of the single-dose formulation of Makena; future growth drivers for Makena, including a new partnership with provider of home nursing services, share gains from compounders, formulary expansions, the impact of the increased size of the sales force and physician base, and patient support services and their effect on brand loyalty from physicians and patients; future growth drivers for CBR, including increased birth rates, market expansion opportunities, the impact of the increased size of the sales force and its effect on market share, and potential future medical applications in regenerative medicine; future growth drivers for Feraheme, including opportunities and plans to grow market share in the hospital and hematology/oncology segments, optimization of net revenue per gram, and the impact of potential approval of Feraheme, including timing of approval for the broad IDA indication; expectations for the Makena subcutaneous auto-injector, including its development and advantages, estimated filing timeline of the sNDA and FDA review period; plans and expectations, including the size, timing of data and potential commercial launch of the head-to-head Phase 3 clinical trial for the broad IDA indication for Feraheme and the potential increase in size of the addressable market for Feraheme; expected first quarter 2016 financial results and 2016 financial guidance, including revenues, adjusted EBITDA and net income; and AMAG’s 2016 key priorities, including plans to achieve financial, commercial, product development and portfolio expansion objectives are forward-looking statements which involve risks and uncertainties that could cause actual results to differ materially from those discussed in such forward-looking statements. Such risks and uncertainties include, among others, those risks identified in AMAG’s filings with the U.S. Securities and Exchange Commission (SEC), including its Annual Report on Form 10-K for the year ended December 31, 2015 and subsequent filings with the SEC. Any of the above risks and uncertainties could materially and adversely affect AMAG’s results of operations, its profitability and its cash flows, which would, in turn, have a significant and adverse impact on AMAG’s stock price. Use of the term “including” in this paragraph shall mean in each case “including, but not limited to.” AMAG cautions you not to place undue reliance on any forward-looking statements, which speak only as of the date they are made. Forward-Looking Statements
Q1-2016 Earnings Call Agenda Q1-2016 Highlights 1 5 2016 Key Priorities and Closing Remarks 5 Q&A 6 2 Commercial Updates 4 Q1-2016 Financial Update 3 Pipeline Updates
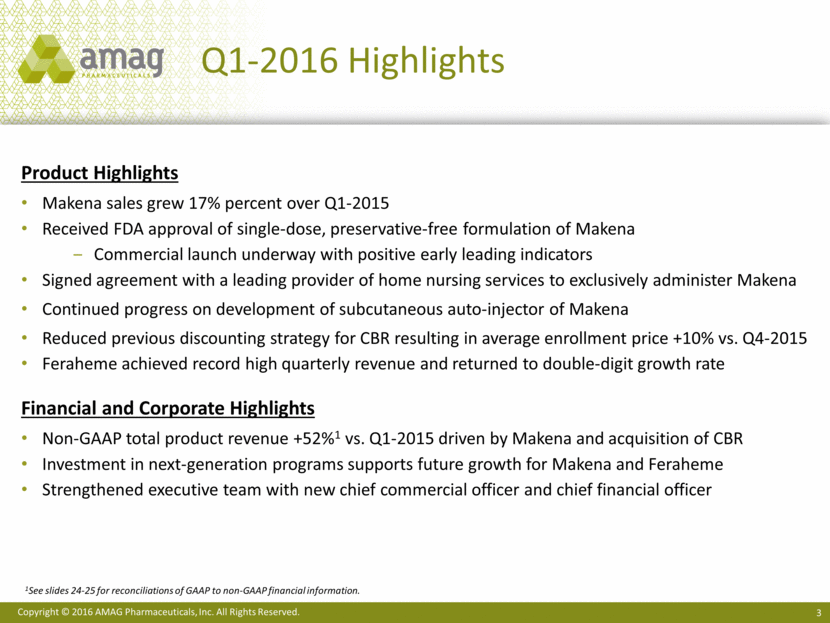
Q1-2016 Highlights Product Highlights Makena sales grew 17% percent over Q1-2015 Received FDA approval of single-dose, preservative-free formulation of Makena Commercial launch underway with positive early leading indicators Signed agreement with a leading provider of home nursing services to exclusively administer Makena Continued progress on development of subcutaneous auto-injector of Makena Reduced previous discounting strategy for CBR resulting in average enrollment price +10% vs. Q4-2015 Feraheme achieved record high quarterly revenue and returned to double-digit growth rate Financial and Corporate Highlights Non-GAAP total product revenue +52%1 vs. Q1-2015 driven by Makena and acquisition of CBR Investment in next-generation programs supports future growth for Makena and Feraheme Strengthened executive team with new chief commercial officer and chief financial officer 1See slides 24-25 for reconciliations of GAAP to non-GAAP financial information.
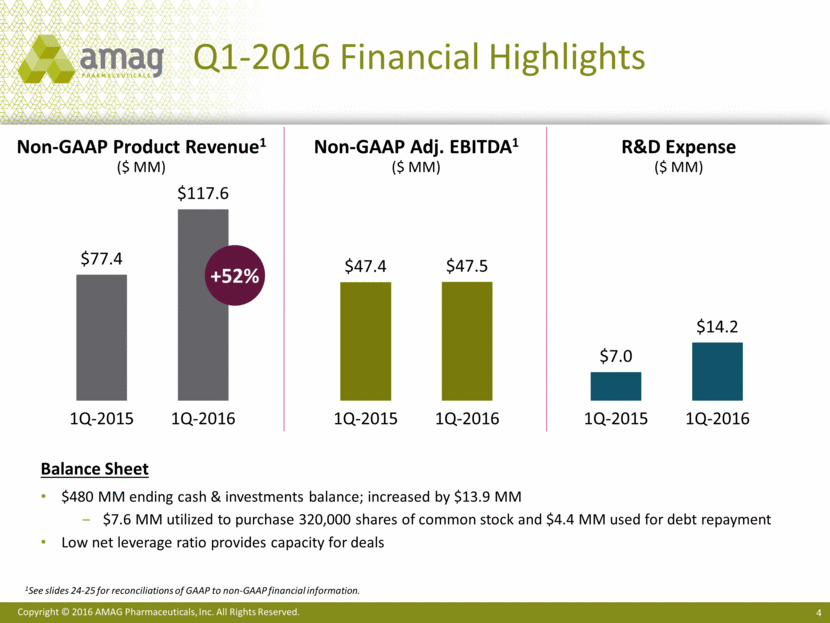
Q1-2016 Financial Highlights Non-GAAP Product Revenue1 ($ MM) +52% 1See slides 24-25 for reconciliations of GAAP to non-GAAP financial information. Balance Sheet $480 MM ending cash & investments balance; increased by $13.9 MM $7.6 MM utilized to purchase 320,000 shares of common stock and $4.4 MM used for debt repayment Low net leverage ratio provides capacity for deals Non-GAAP Adj. EBITDA1 ($ MM) R&D Expense ($ MM) $77.4 $117.6 1Q-2015 1Q-2016 $47.4 $47.5 1Q-2015 1Q-2016 $7.0 $14.2 1Q-2015 1Q-2016
Commercial Update: Maternal Health

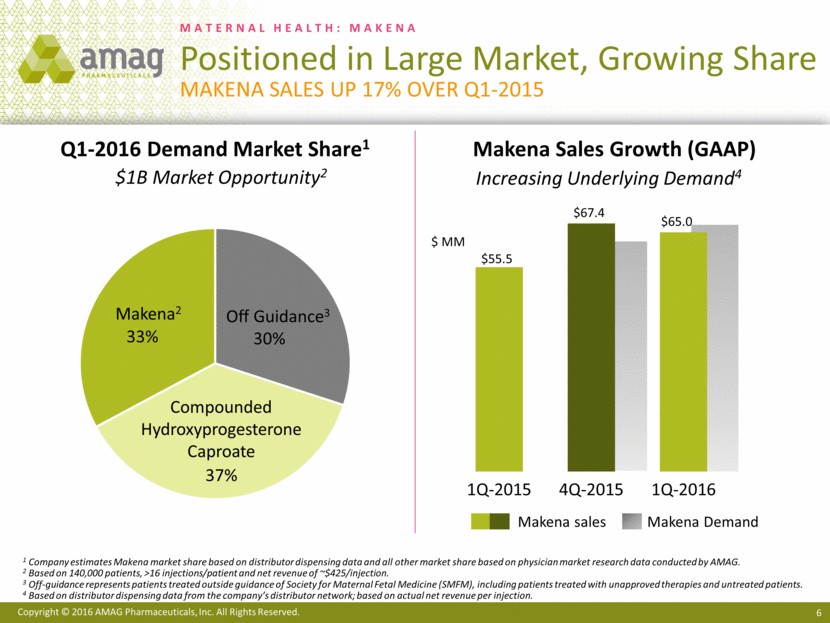
MATERNAL HEALTH: MAKENA Positioned in Large Market, Growing Share Makena Sales up 17% over Q1-2015 1 Company estimates Makena market share based on distributor dispensing data and all other market share based on physician market research data conducted by AMAG. 2 Based on 140,000 patients, >16 injections/patient and net revenue of ~$425/injection. 3 Off-guidance represents patients treated outside guidance of Society for Maternal Fetal Medicine (SMFM), including patients treated with unapproved therapies and untreated patients. 4 Based on distributor dispensing data from the company’s distributor network; based on actual net revenue per injection. Compounded Hydroxyprogesterone Caproate Makena2 Off Guidance3 Q1-2016 Demand Market Share1 Makena Sales Growth (GAAP) $ MM Increasing Underlying Demand4 $1B Market Opportunity2 Makena sales Makena Demand 30% 37% 33% $55.5 $67.4 $65.0 1Q-2015 4Q-2015 1Q-2016
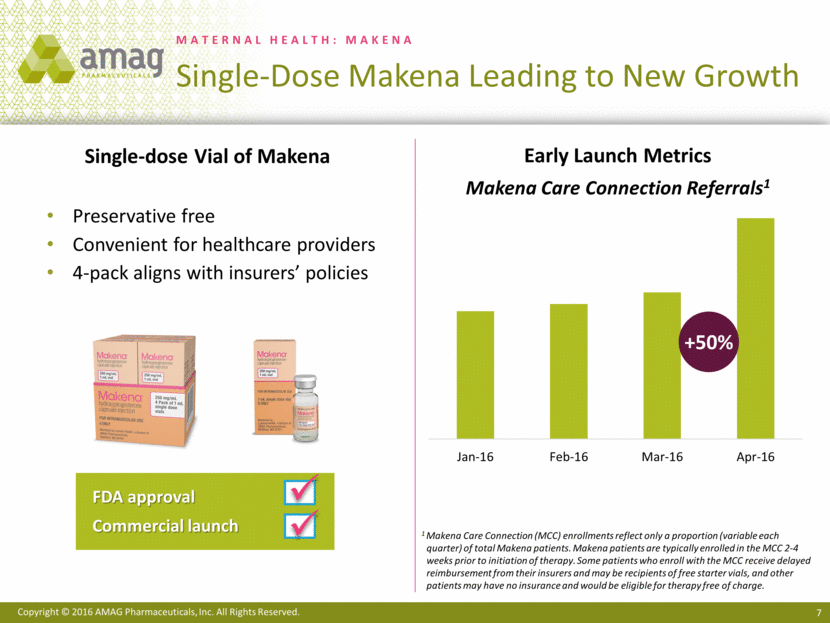
MATERNAL HEALTH: MAKENA Single-Dose Makena Leading to New Growth Single-dose Vial of Makena Preservative free Convenient for healthcare providers 4-pack aligns with insurers’ policies FDA approval Commercial launch ü ü Early Launch Metrics Makena Care Connection Referrals1 1 Makena Care Connection (MCC) enrollments reflect only a proportion (variable each quarter) of total Makena patients. Makena patients are typically enrolled in the MCC 2-4 weeks prior to initiation of therapy. Some patients who enroll with the MCC receive delayed reimbursement from their insurers and may be recipients of free starter vials, and other patients may have no insurance and would be eligible for therapy free of charge. +50% Jan-16 Feb-16 Mar-16 Apr-16
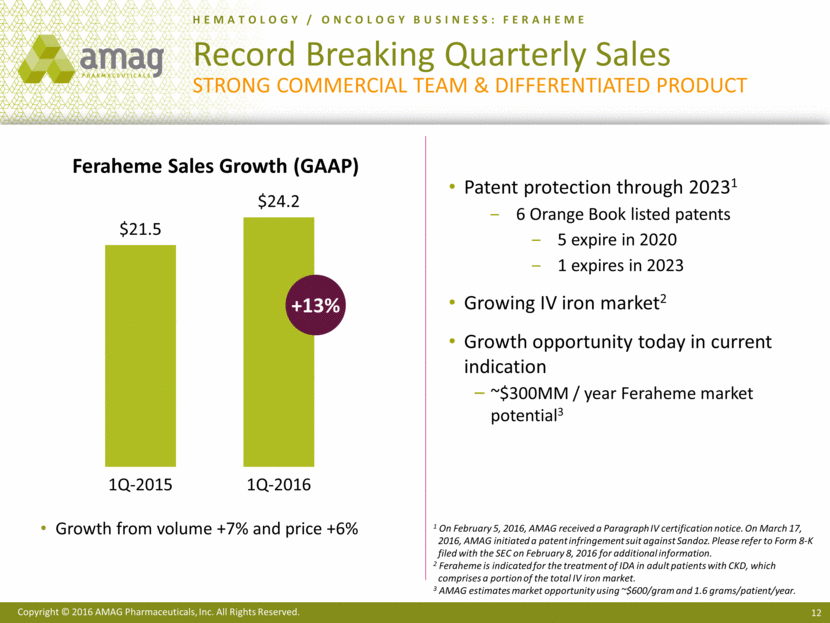
New partnership with a leading provider of home nursing services At-home administration by a healthcare professional Continued share gains from compounders Preservative-free launch could expand compounder pharmacy conversion to become Makena distributor Continue to pull through formulary expansions Maternal health sales force increased to 104 reps from 76 reps (+37%) in Q3-2015 Target physician base doubled to 16,000 OB/GYNs Enhance physician and patient brand loyalty with valued support services, such as Makena Care Connection and nurse-supported adherence program Growth Drivers MATERNAL HEALTH: MAKENA Growth Drivers in 2016 and Beyond
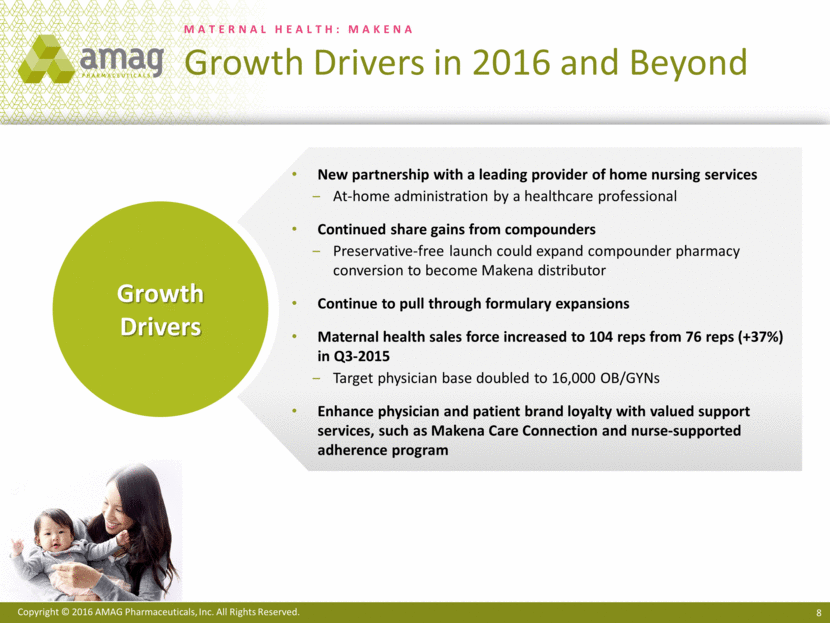
MATERNAL HEALTH: CBR CBR: Market Leader, Long Growth Runway 9 Attractive business model One-time upfront collection fee Ongoing annual storage fee (high margin) High loyalty; <1% annual attrition Market for Stored Cord Blood CBR Non-GAAP Pro Forma Revenue1 ($ MM) 2.5% bank publicly 2.5% bank privately 95% of families do not bank CBR Today CBR Future Stored Units 596K 644K 1See slides 24-25 for reconciliations of GAAP to non-GAAP financial information. $30.3 $28.1 Q1-2015 Q1-2016
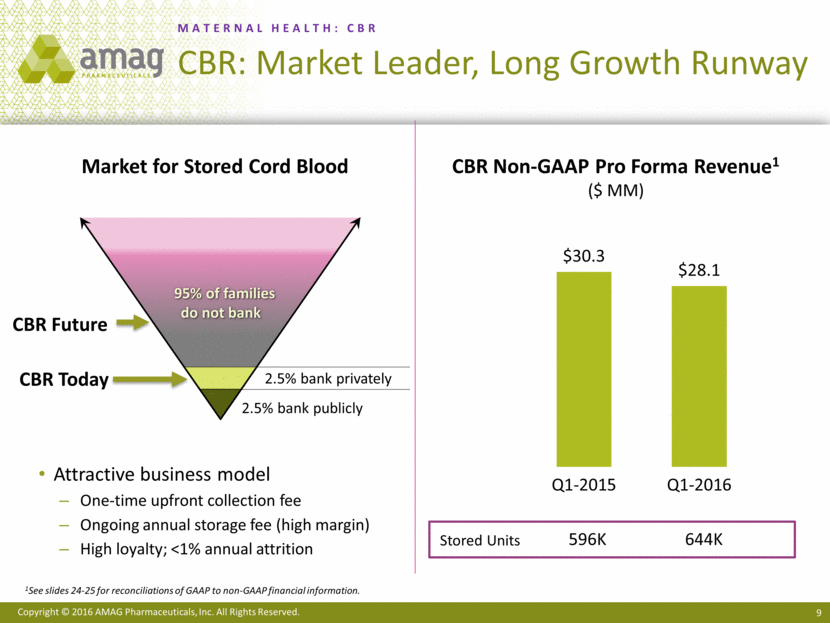
Growing birth rate in the U.S. Market expansion opportunities Only 5% of families store cord blood Expand market offerings Optimize revenue through strategic pricing Increase share Expanded sales force from 47 to 104 reps in Q3-2015 Portfolio of products allows for broader relationships with target physicians Increased potential clinical use of stem cells, e.g. regenerative medicine Growth Drivers MATERNAL HEALTH: CBR Growth Drivers in 2016 and Beyond
Commercial Update: Hematology/Oncology & Hospital

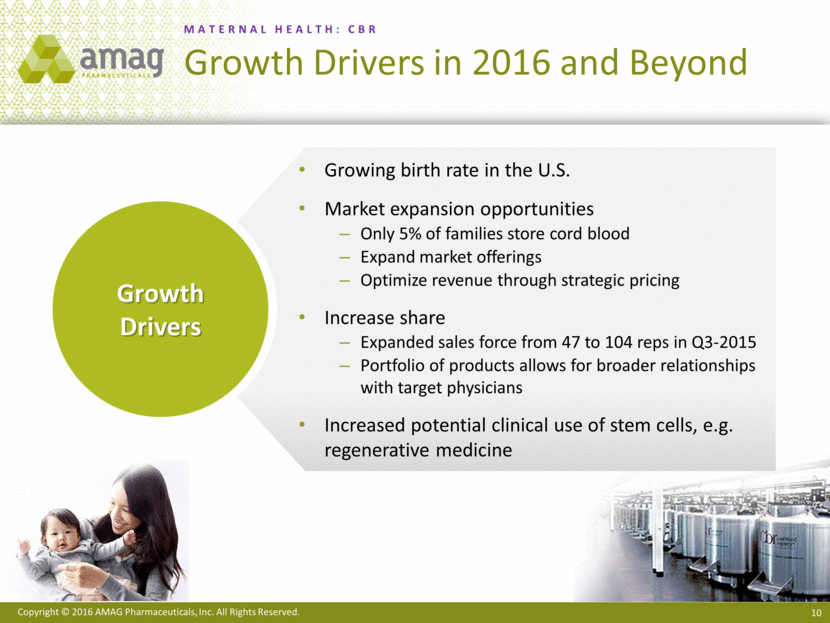
HEMATOLOGY / ONCOLOGY BUSINESS: FERAHEME Record Breaking Quarterly Sales Strong commercial team & Differentiated product +13% Growth from volume +7% and price +6% Patent protection through 20231 6 Orange Book listed patents 5 expire in 2020 1 expires in 2023 Growing IV iron market2 Growth opportunity today in current indication ~$300MM / year Feraheme market potential3 1 On February 5, 2016, AMAG received a Paragraph IV certification notice. On March 17, 2016, AMAG initiated a patent infringement suit against Sandoz. Please refer to Form 8-K filed with the SEC on February 8, 2016 for additional information. 2 Feraheme is indicated for the treatment of IDA in adult patients with CKD, which comprises a portion of the total IV iron market. 3 AMAG estimates market opportunity using ~$600/gram and 1.6 grams/patient/year. Feraheme Sales Growth (GAAP) $21.5 $24.2 1Q-2015 1Q-2016
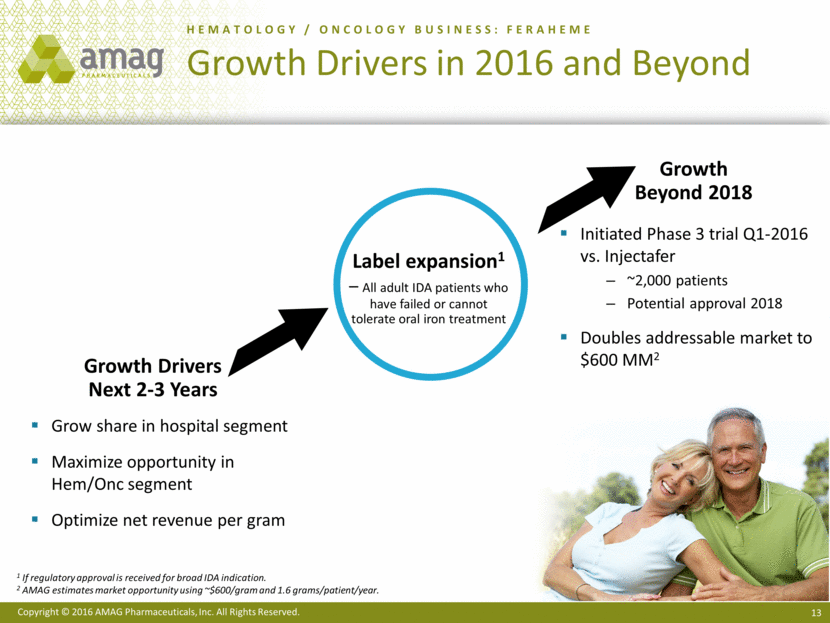
HEMATOLOGY / ONCOLOGY BUSINESS: FERAHEME Growth Drivers in 2016 and Beyond Grow share in hospital segment Maximize opportunity in Hem/Onc segment Optimize net revenue per gram Growth Drivers Next 2-3 Years Label expansion1 – All adult IDA patients who have failed or cannot tolerate oral iron treatment Initiated Phase 3 trial Q1-2016 vs. Injectafer ~2,000 patients Potential approval 2018 Doubles addressable market to $600 MM2 Growth Beyond 2018 1 If regulatory approval is received for broad IDA indication. 2 AMAG estimates market opportunity using ~$600/gram and 1.6 grams/patient/year.
14 Pipeline Update Copyright © 2016 AMAG Pharmaceuticals. All Rights Reserved.

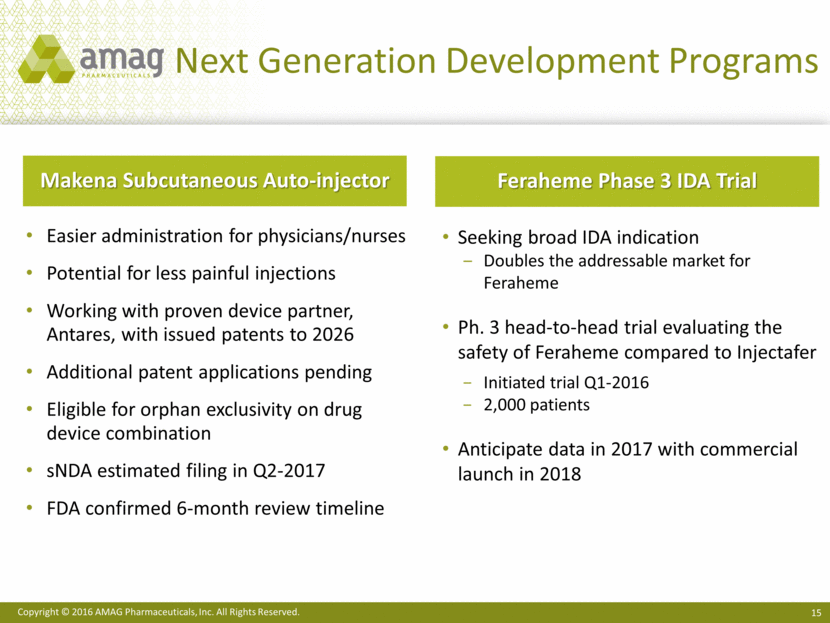
Next Generation Development Programs Easier administration for physicians/nurses Potential for less painful injections Working with proven device partner, Antares, with issued patents to 2026 Additional patent applications pending Eligible for orphan exclusivity on drug device combination sNDA estimated filing in Q2-2017 FDA confirmed 6-month review timeline Makena Subcutaneous Auto-injector Seeking broad IDA indication Doubles the addressable market for Feraheme Ph. 3 head-to-head trial evaluating the safety of Feraheme compared to Injectafer Initiated trial Q1-2016 2,000 patients Anticipate data in 2017 with commercial launch in 2018 Feraheme Phase 3 IDA Trial
Financial Update

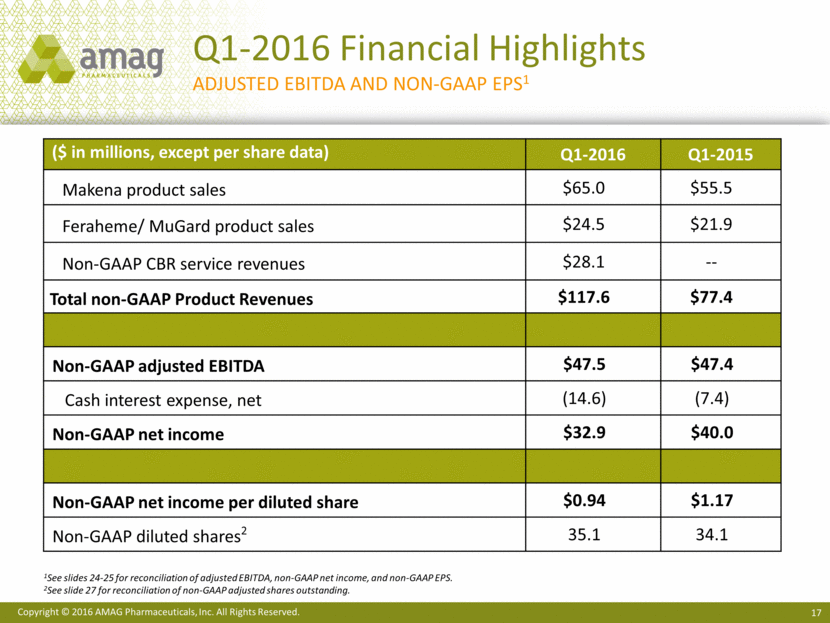
Q1-2016 Financial Highlights Adjusted EBITDA and non-gaap eps1 ($ in millions, except per share data) Q1-2016 Q1-2015 Makena product sales $65.0 $55.5 Feraheme/ MuGard product sales $24.5 $21.9 Non-GAAP CBR service revenues $28.1 -- Total non-GAAP Product Revenues $117.6 $77.4 Non-GAAP adjusted EBITDA $47.5 $47.4 Cash interest expense, net (14.6) (7.4) Non-GAAP net income $32.9 $40.0 Non-GAAP net income per diluted share $0.94 $1.17 Non-GAAP diluted shares2 35.1 34.1 1See slides 24-25 for reconciliation of adjusted EBITDA, non-GAAP net income, and non-GAAP EPS. 2See slide 27 for reconciliation of non-GAAP adjusted shares outstanding.
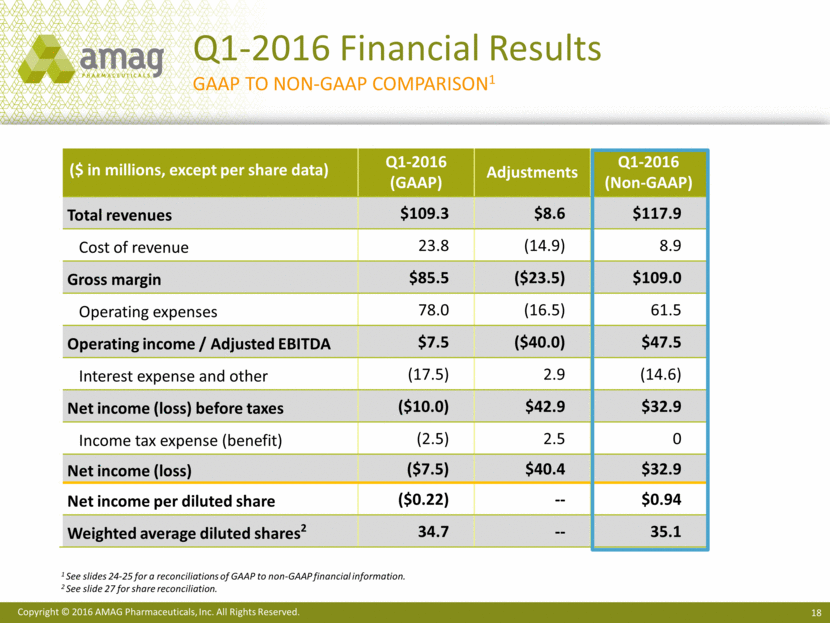
Q1-2016 Financial Results GAAP to NON-GAAP Comparison1 1 See slides 24-25 for a reconciliations of GAAP to non-GAAP financial information. 2 See slide 27 for share reconciliation. ($ in millions, except per share data) Q1-2016 (GAAP) Adjustments Q1-2016 (Non-GAAP) Total revenues $109.3 $8.6 $117.9 Cost of revenue 23.8 (14.9) 8.9 Gross margin $85.5 ($23.5) $109.0 Operating expenses 78.0 (16.5) 61.5 Operating income / Adjusted EBITDA $7.5 ($40.0) $47.5 Interest expense and other (17.5) 2.9 (14.6) Net income (loss) before taxes ($10.0) $42.9 $32.9 Income tax expense (benefit) (2.5) 2.5 0 Net income (loss) ($7.5) $40.4 $32.9 Net income per diluted share ($0.22) -- $0.94 Weighted average diluted shares2 34.7 -- 35.1
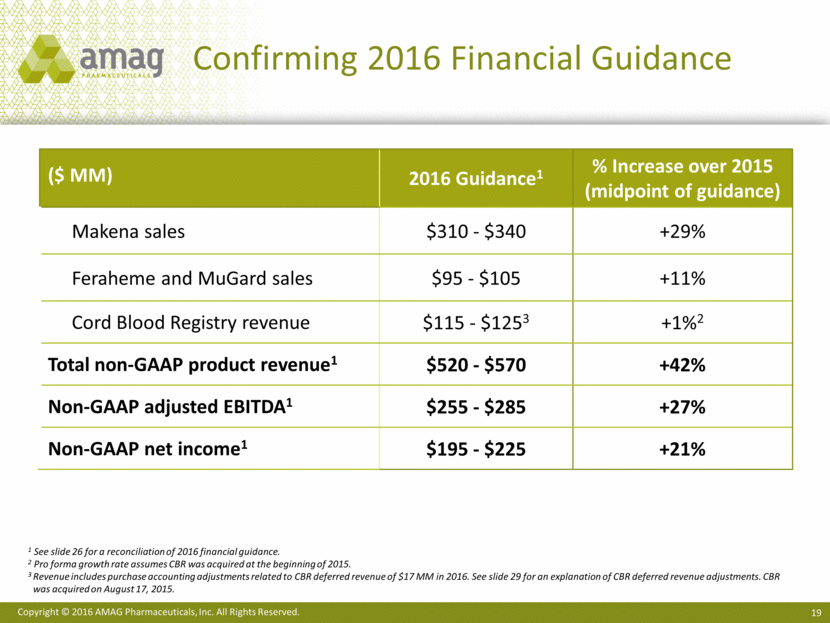
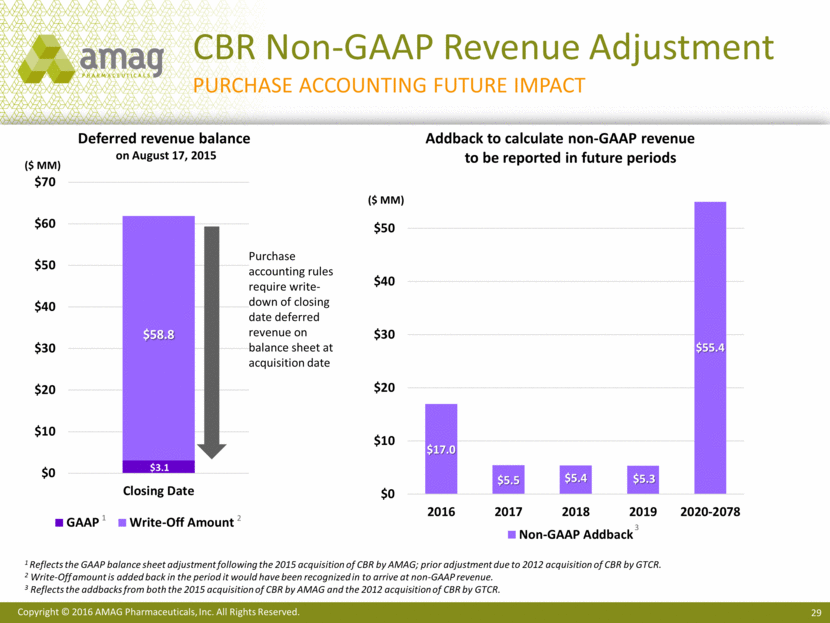
Confirming 2016 Financial Guidance ($ MM) 2016 Guidance1 % Increase over 2015 (midpoint of guidance) Makena sales $310 - $340 +29% Feraheme and MuGard sales $95 - $105 +11% Cord Blood Registry revenue $115 - $1253 +1%2 Total non-GAAP product revenue1 $520 - $570 +42% Non-GAAP adjusted EBITDA1 $255 - $285 +27% Non-GAAP net income1 $195 - $225 +21% 1 See slide 26 for a reconciliation of 2016 financial guidance. 2 Pro forma growth rate assumes CBR was acquired at the beginning of 2015. 3 Revenue includes purchase accounting adjustments related to CBR deferred revenue of $17 MM in 2016. See slide 29 for an explanation of CBR deferred revenue adjustments. CBR was acquired on August 17, 2015.
2016 Key Priorities

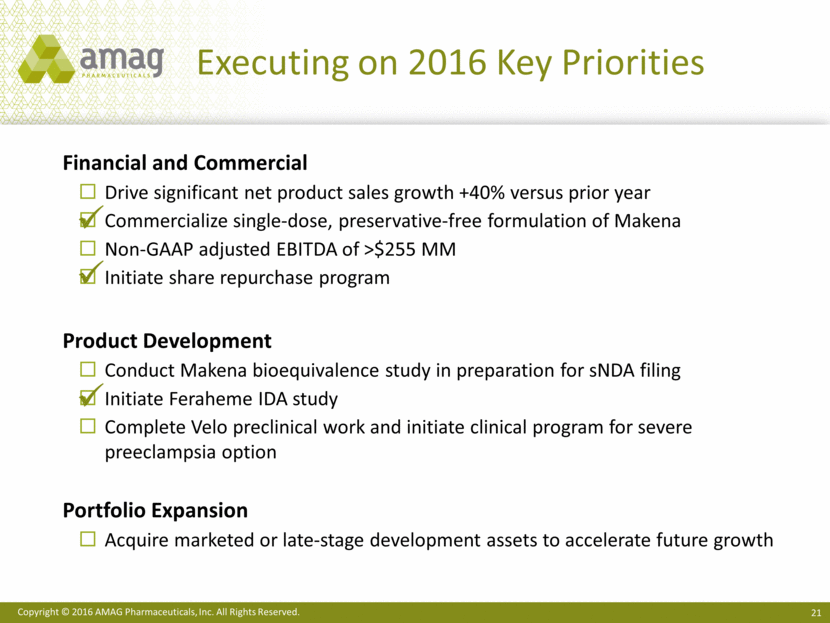
Executing on 2016 Key Priorities Financial and Commercial Drive significant net product sales growth +40% versus prior year Commercialize single-dose, preservative-free formulation of Makena Non-GAAP adjusted EBITDA of >$255 MM Initiate share repurchase program Product Development Conduct Makena bioequivalence study in preparation for sNDA filing Initiate Feraheme IDA study Complete Velo preclinical work and initiate clinical program for severe preeclampsia option Portfolio Expansion Acquire marketed or late-stage development assets to accelerate future growth
AMAG Pharmaceuticals Q1-2016 Financial Results May 3, 2016
AMAG Pharmaceuticals Appendix Q1-2016 Financial Results May 3, 2016
GAAP to Non-GAAP Financials for the Quarters Ended March 31, 2016 and 2015 Three Months Ended Three Months Ended March 31, 2016 March 31, 2015 GAAP Adjustments Non - GAAP GAAP Adjustments Non - GAAP Revenues: Makena $ 65,032 $ — $ 65,032 $ 55,529 $ — $ 55,529 Feraheme/MuGard 24,532 — 24,532 21,886 — 21,886 Cord Blood Registry 19,520 8,561 4 28,081 — — — License fee, collaboration and other 216 — 216 12,090 (6,402) 5 5,688 Total revenues 109,300 8,561 117,861 89,505 (6,402) 83,103 Operating costs and expenses: Cost of product sales 18,300 (14,609) 6 3,691 21,026 (17,740) 6 3,286 Cost of services 5,526 (360) 7 5,166 — — — Research and development 14,229 (774) 8 13,455 6,988 (493) 8 6,495 Selling, general and administrative 63,175 (15,120) 9 48,055 32,112 (6,186) 9 25,926 Restructuring 622 (622) 10 — 571 (571) 10 — Total costs and expenses 101, 852 (31,485) 70,367 60,697 (24,990) 35,707 Operating income (loss) / adjusted EBITDA 7,448 40,046 47,494 28,808 18,588 47,396 Other income (expense): Interest expense (18,443) 2,945 11 (15,498) (10,367) 2,885 11 (7,482) Interest and dividend income, net 708 — 708 71 — 71 Other income, net 220 — 220 — — — Total other income (expense) (17,515) 2,945 (14,570) (10,296) 2,885 (7,411) Net income (loss) before income taxes (10,067) 42,991 32,924 18,512 21,473 39,985 Income tax expense (benefit) (2,540) 2,540 12 — 5,608 (5,608) 12 — Net income (loss) $ (7,527) $ 40,451 $ 32,924 $ 12,904 $ 27,081 $ 39,985 Net income (loss) per share Basic $ (0.22) — $ 0.95 $ 0.47 — $ 1.47 Diluted $ (0.22) — $ 0.94 $ 0.39 — $ 1.17 Weighted average shares outstanding Basic 34,739 — 34,739 27,213 — 27,213 Diluted 34,739 — 35,123 38,245 — 34,058
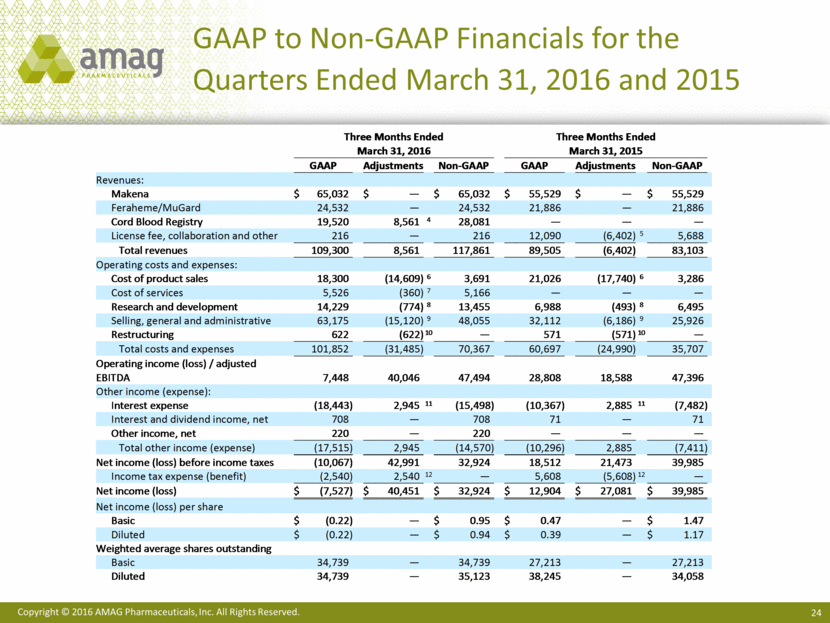
GAAP to non-GAAP Financials for the First Quarter Ended March 31, 2016 (cont.) Footnotes 4 Adding back period write-down of deferred revenue from purchase accounting. 5 Eliminate non-cash revenue related to recognition of previously deferred revenue on Takeda agreement. 6 Eliminate the following: (i) non-cash step-up of inventory from purchase accounting; (ii) amortization expense related to intangible assets; (iii) depreciation expense; and (iv) stock-based compensation expense. 7 Eliminate depreciation expense. 8 Eliminate the following: (i) non-cash step-up of inventory used in research and development from purchase accounting; (ii) depreciation expense; and (iii) stock-based compensation expense. 9 Eliminate the following: (i) non-cash adjustments related to contingent consideration; (ii) amortization expense related to intangible assets; (iii) depreciation expense; and (iv) stock-based compensation expense. 10 Eliminate non-recurring restructuring costs. 11 Eliminate non-cash interest expense. 12 Eliminate non-cash income tax.
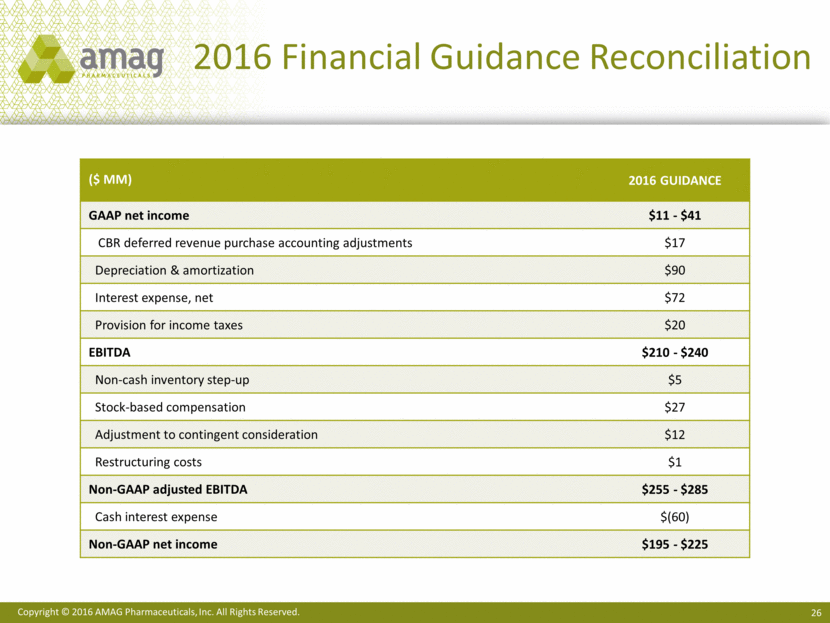
2016 Financial Guidance Reconciliation ($ MM) 2016 Guidance GAAP net income $11 - $41 CBR deferred revenue purchase accounting adjustments $17 Depreciation & amortization $90 Interest expense, net $72 Provision for income taxes $20 EBITDA $210 - $240 Non-cash inventory step-up $5 Stock-based compensation $27 Adjustment to contingent consideration $12 Restructuring costs $1 Non-GAAP adjusted EBITDA $255 - $285 Cash interest expense $(60) Non-GAAP net income $195 - $225
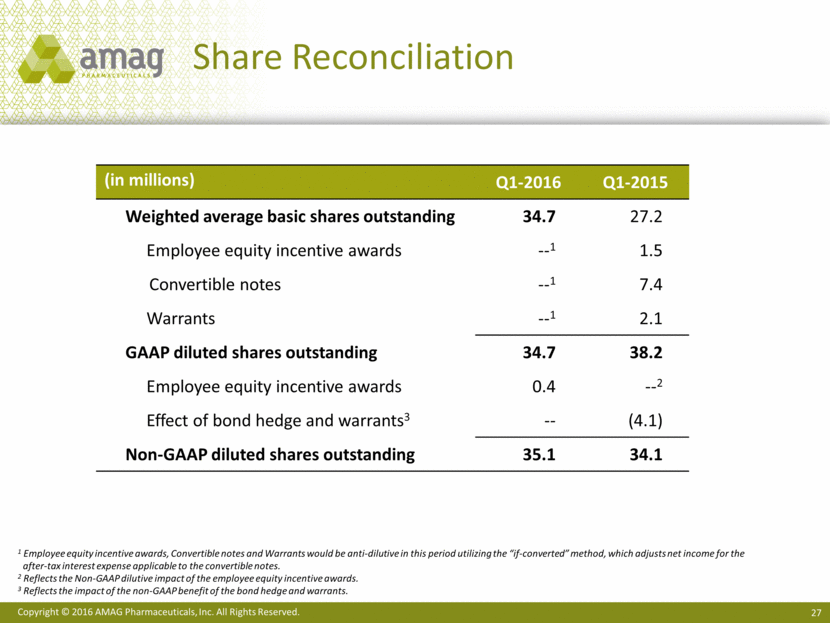
Share Reconciliation 1 Employee equity incentive awards, Convertible notes and Warrants would be anti-dilutive in this period utilizing the “if-converted” method, which adjusts net income for the after-tax interest expense applicable to the convertible notes. 2 Reflects the Non-GAAP dilutive impact of the employee equity incentive awards. 3 Reflects the impact of the non-GAAP benefit of the bond hedge and warrants. (in millions) Q1-2016 Q1-2015 Weighted average basic shares outstanding 34.7 27.2 Employee equity incentive awards --1 1.5 Convertible notes --1 7.4 Warrants --1 2.1 GAAP diluted shares outstanding 34.7 38.2 Employee equity incentive awards 0.4 --2 Effect of bond hedge and warrants3 -- (4.1) Non-GAAP diluted shares outstanding 35.1 34.1
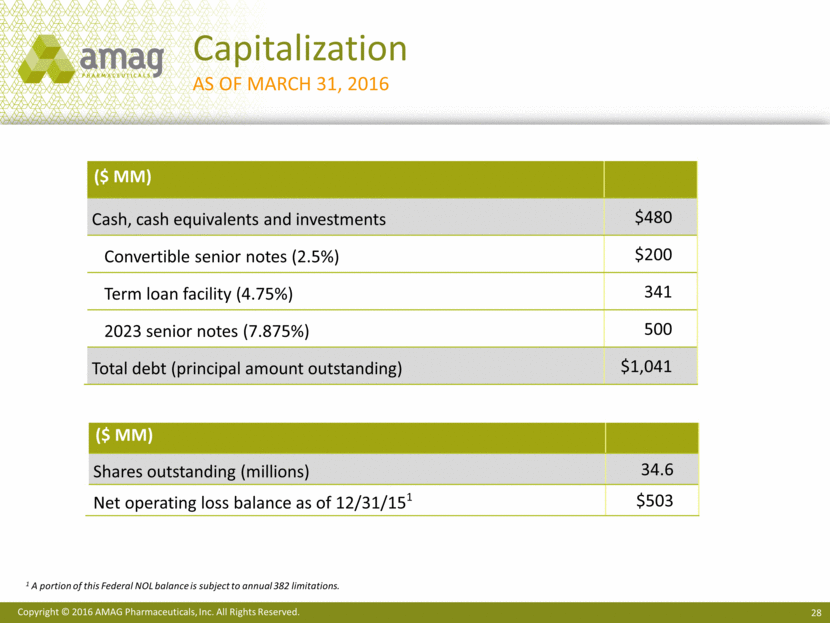
($ MM) Cash, cash equivalents and investments $480 Convertible senior notes (2.5%) $200 Term loan facility (4.75%) 341 2023 senior notes (7.875%) 500 Total debt (principal amount outstanding) $1,041 Capitalization As of March 31, 2016 ($ MM) Shares outstanding (millions) 34.6 Net operating loss balance as of 12/31/151 $503 1 A portion of this Federal NOL balance is subject to annual 382 limitations.
CBR Non-GAAP Revenue Adjustment Purchase accounting future impact Deferred revenue balance on August 17, 2015 Addback to calculate non-GAAP revenue to be reported in future periods ($ MM) Purchase accounting rules require write-down of closing date deferred revenue on balance sheet at acquisition date 1 Reflects the GAAP balance sheet adjustment following the 2015 acquisition of CBR by AMAG; prior adjustment due to 2012 acquisition of CBR by GTCR. 2 Write-Off amount is added back in the period it would have been recognized in to arrive at non-GAAP revenue. 3 Reflects the addbacks from both the 2015 acquisition of CBR by AMAG and the 2012 acquisition of CBR by GTCR. ($ MM) 1 2 3 $3.1 $58.8 $0 $10 $20 $30 $40 $50 $60 $70 Closing Date GAAP Write-Off Amount $17.0 $5.5 $5.4 $5.3 $55.4 $0 $10 $20 $30 $40 $50 2016 2017 2018 2019 2020-2078 Non-GAAP Addback
AMAG Pharmaceuticals Q1-2016 Financial Results May 3, 2016
