Attached files
| file | filename |
|---|---|
| EX-99.1 - EX-99.1 - O-I Glass, Inc. /DE/ | a16-10325_1ex99d1.htm |
| 8-K - 8-K - O-I Glass, Inc. /DE/ | a16-10325_18k.htm |
Exhibit 99.2
O-I First Quarter 2016 Earnings Presentation May 3, 2016

Safe harbor comments 2 Regulation G The information presented here regarding adjusted EPS relates to net earnings from continuing operations attributable to the Company (exclusive of items management considers not representative of ongoing operations) divided by weighted average shares outstanding (diluted) and does not conform to U.S. generally accepted accounting principles (GAAP). Management has included non-GAAP measures to assist in understanding the comparability of results of ongoing operations. Further, the information presented here regarding free cash flow does not conform to GAAP. Management defines free cash flow as cash provided by continuing operating activities less capital spending (both as determined in accordance with GAAP) and has included this non-GAAP information to assist in understanding the comparability of cash flows. Management uses non-GAAP information principally for internal reporting, forecasting, budgeting and calculating compensation payments. Management believes that the non-GAAP presentation allows the board of directors, management, investors and analysts to better understand the Company’s financial performance in relationship to core operating results and the business outlook. These non-GAAP financial measures are presented on a forward-looking basis and certain factors that could affect GAAP financial measures are not accessible or estimable on a forward-looking basis. These factors include items that may be material, such as future asbestos-related charges and restructuring and asset impairment and other related charges. Forward Looking Statements This document contains “forward-looking” statements within the meaning of Section 21E of the Securities Exchange Act of 1934 and Section 27A of the Securities Act of 1933. Forward-looking statements reflect the Company’s current expectations and projections about future events at the time, and thus involve uncertainty and risk. The words “believe,” “expect,” “anticipate,” “will,” “could,” “would,” “should,” “may,” “plan,” “estimate,” “intend,” “predict,” “potential,” “continue,” and the negatives of these words and other similar expressions generally identify forward looking statements. It is possible the Company’s future financial performance may differ from expectations due to a variety of factors including, but not limited to the following: (1) the Company’s ability to integrate the Vitro Business in a timely and cost effective manner, to maintain on existing terms the permits, licenses and other approvals required for the Vitro Business to operate as currently operated, and to realize the expected synergies from the Vitro Acquisition, (2) risks related to the impact of integration of the Vitro Acquisition on earnings and cash flow, (3) risks associated with the significant transaction costs and additional indebtedness that the Company incurred in financing the Vitro Acquisition, (4) the Company’s ability to realize expected growth opportunities and cost savings from the Vitro Acquisition, (5) foreign currency fluctuations relative to the U.S. dollar, specifically the Euro, Brazilian real, Mexican peso, Colombian peso and Australian dollar, (6) changes in capital availability or cost, including interest rate fluctuations and the ability of the Company to refinance debt at favorable terms, (7) the general political, economic and competitive conditions in markets and countries where the Company has operations, including uncertainties related to economic and social conditions, disruptions in capital markets, disruptions in the supply chain, competitive pricing pressures, inflation or deflation, and changes in tax rates and laws, (8) consumer preferences for alternative forms of packaging, (9) cost and availability of raw materials, labor, energy and transportation, (10) the Company’s ability to manage its cost structure, including its success in implementing restructuring plans and achieving cost savings, (11) consolidation among competitors and customers, (12) the ability of the Company to acquire businesses and expand plants, integrate operations of acquired businesses and achieve expected synergies, (13) unanticipated expenditures with respect to environmental, safety and health laws, (14) the Company’s ability to further develop its sales, marketing and product development capabilities, and (15) the timing and occurrence of events which are beyond the control of the Company, including any expropriation of the Company’s operations, floods and other natural disasters, events related to asbestos-related claims, and the other risk factors discussed in the Company’s Annual Report on Form 10-K for the year ended December 31, 2015, any subsequently filed Quarterly Report on Form 10-Q and the Company’s other filings with the Securities and Exchange Commission. It is not possible to foresee or identify all such factors. In addition, the Company’s management has not yet completed its assessment of the error in the previously filed financial reports discussed in this document. The actual amount of the Company’s assessment of its total asbestos-related liability at March 31, 2016 and the expected impact of the restatement, including on the financial results for the quarterly period ended March 31, 2016, could differ from the discussion in this document. Any forward-looking statements in this document are based on certain assumptions and analyses made by the Company in light of its experience and perception of historical trends, current conditions, expected future developments, and other factors it believes are appropriate in the circumstances. Forward-looking statements are not a guarantee of future performance and actual results or developments may differ materially from expectations. While the Company continually reviews trends and uncertainties affecting the Company’s results of operations and financial condition, the Company does not assume any obligation to update or supplement any particular forward-looking statements contained in this document. Presentation Note Unless otherwise noted, the information presented in this presentation reflects continuing operations only.
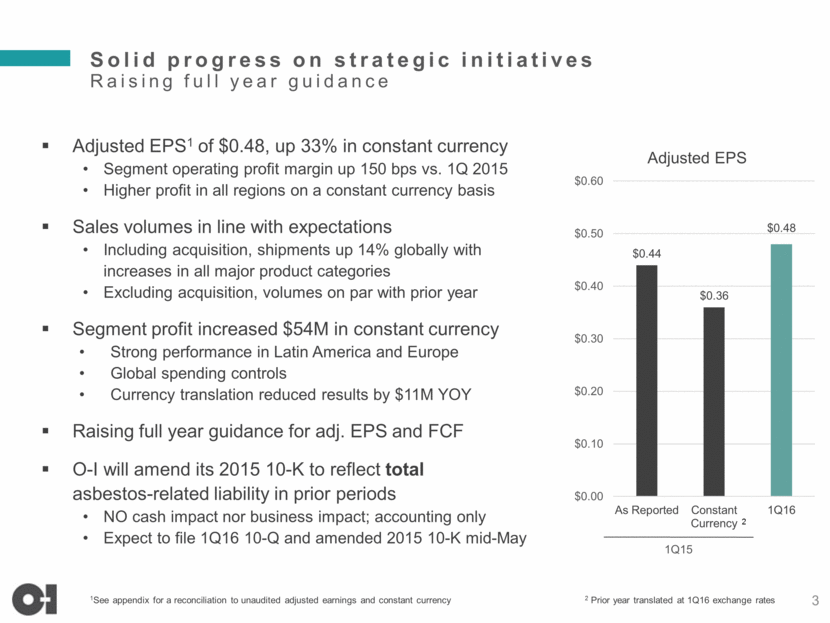
Solid progress on strategic initiatives Raising full year guidance 3 Adjusted EPS1 of $0.48, up 33% in constant currency Segment operating profit margin up 150 bps vs. 1Q 2015 Higher profit in all regions on a constant currency basis Sales volumes in line with expectations Including acquisition, shipments up 14% globally with increases in all major product categories Excluding acquisition, volumes on par with prior year Segment profit increased $54M in constant currency Strong performance in Latin America and Europe Global spending controls Currency translation reduced results by $11M YOY Raising full year guidance for adj. EPS and FCF O-I will amend its 2015 10-K to reflect total asbestos-related liability in prior periods NO cash impact nor business impact; accounting only Expect to file 1Q16 10-Q and amended 2015 10-K mid-May 1See appendix for a reconciliation to unaudited adjusted earnings and constant currency 1Q15 2 2 Prior year translated at 1Q16 exchange rates $0.44 $0.36 $0.48 $0.00 $0.10 $0.20 $0.30 $0.40 $0.50 $0.60 As Reported Constant Currency 1Q16 Adjusted EPS
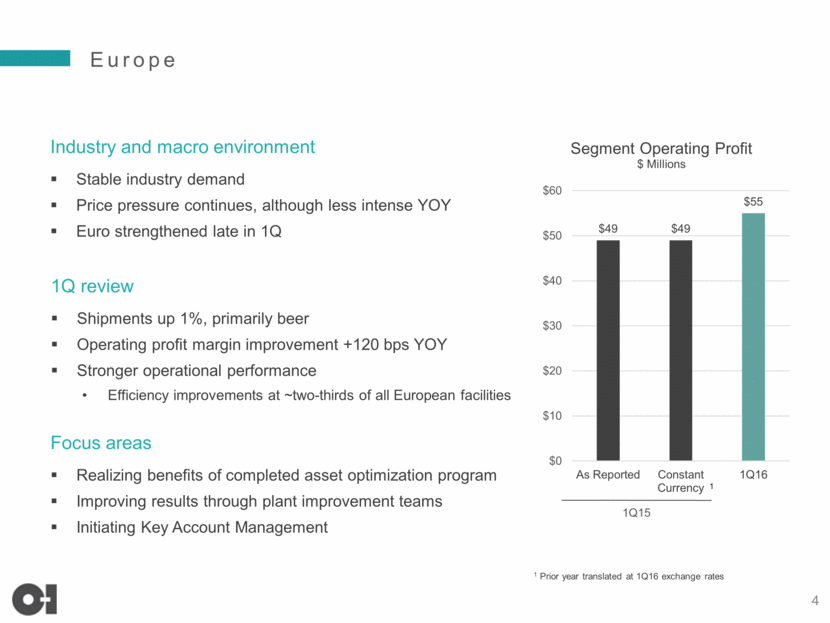
Europe 4 Industry and macro environment Stable industry demand Price pressure continues, although less intense YOY Euro strengthened late in 1Q 1Q review Shipments up 1%, primarily beer Operating profit margin improvement +120 bps YOY Stronger operational performance Efficiency improvements at ~two-thirds of all European facilities Focus areas Realizing benefits of completed asset optimization program Improving results through plant improvement teams Initiating Key Account Management 1 Prior year translated at 1Q16 exchange rates 1Q15 1 $49 $49 $55 $0 $10 $20 $30 $40 $50 $60 As Reported Constant Currency 1Q16 Segment Operating Profit $ Millions
North America 5 Industry and macro environment Well balanced supply and demand Growing segments (premium and craft) continue to offset declines in megabeer 1Q review 20 bps margin improvement for legacy business Shipments on par with prior year Acquired business: $5M segment operating profit Focus areas Leveraging Plant Improvement Team in selected plants Improving end to end supply chain Launching Key Account Management 1 Prior year translated at 1Q16 exchange rates 1Q15 1 $71 $71 $76 $0 $10 $20 $30 $40 $50 $60 $70 $80 As Reported Constant Currency 1Q16 Segment Operating Profit $ Millions
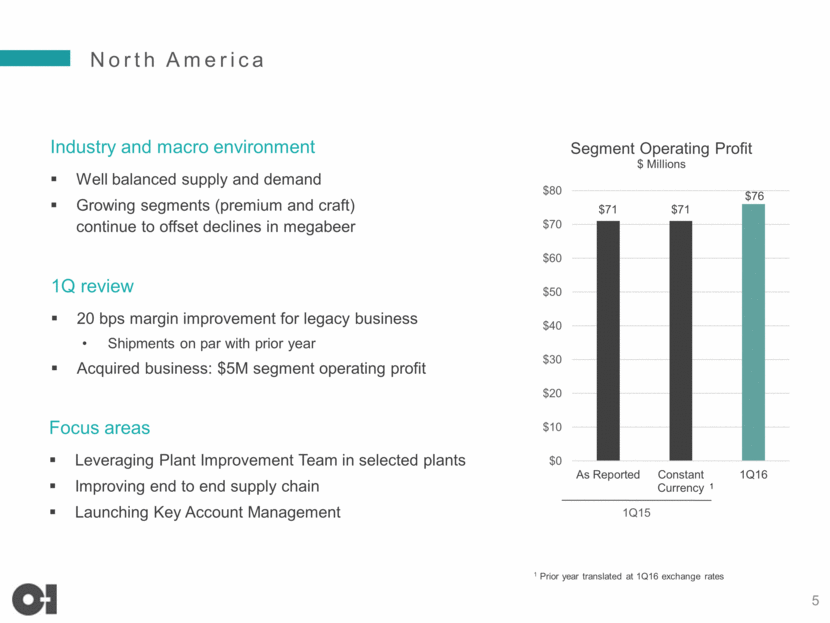
Latin America 6 Industry and macro environment Strong Mexican domestic and export demand FX begins to strengthen late in 1Q Continuing economic weakness in Brazil 1Q review Acquired business: $37M segment operating profit Legacy business shipments down 5%; Brazil weakness Price offset cost inflation Cost containment improves legacy business profit by ~$5M despite Brazil weakness Focus areas Managing the business very well in a volatile climate Integrating the acquired business Improving end to end supply chain 1 Prior year translated at 1Q16 exchange rates 1Q15 1 $30 $21 $63 $0 $10 $20 $30 $40 $50 $60 $70 As Reported Constant Currency 1Q16 Segment Operating Profit $ Millions
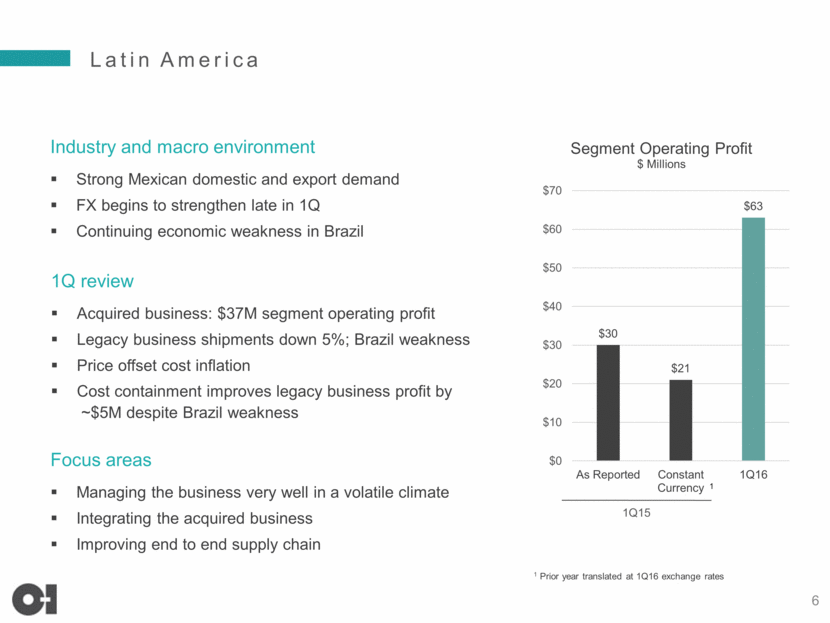
Asia Pacific 7 Industry and macro environment Australian wine exports improving Inflation headwinds, driven by FX 1Q review Shipments up 1%, mainly wine Modest price increase partially compensates for inflation Solid performance offsets higher engineering activity Focus areas Improving end to end supply chain Managing a higher level of engineering activity Optimizing performance in emerging markets 1 Prior year translated at 1Q16 exchange rates 1Q15 1 $18 $16 $17 $0 $2 $4 $6 $8 $10 $12 $14 $16 $18 $20 As Reported Constant Currency 1Q16 Segment Operating Profit $ Millions
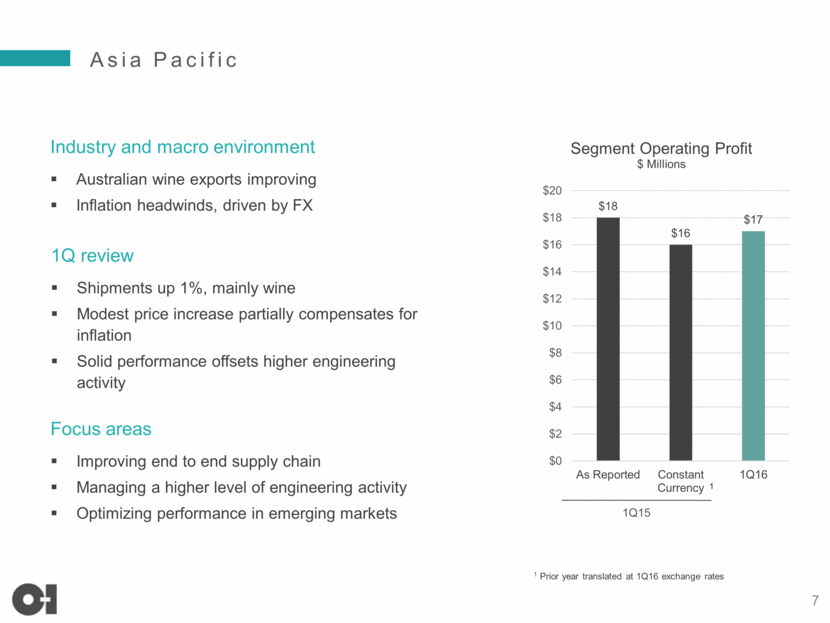
Improved segment operating profit 8 Note: Reportable segment data excludes the Company’s global equipment business 1 Prior year translated at 1Q16 exchange rates Segment Operating Profit $ millions 1Q15 Segment Operating Profit $168 Currency (11) Negative currency impact of 7% (mainly LA) 1Q15 at constant currency1 157 Price 19 Mainly in Latin America, to offset cost inflation Sales volume (excl. acquisition) - Legacy business on par with prior year Operating costs (7) Inflation masks operational performance (EU) Acquisition 42 Strong performance: $37M in LA, $5M in NA Total reconciling items 54 1Q16 Segment Operating Profit $211 34% increase in constant currency
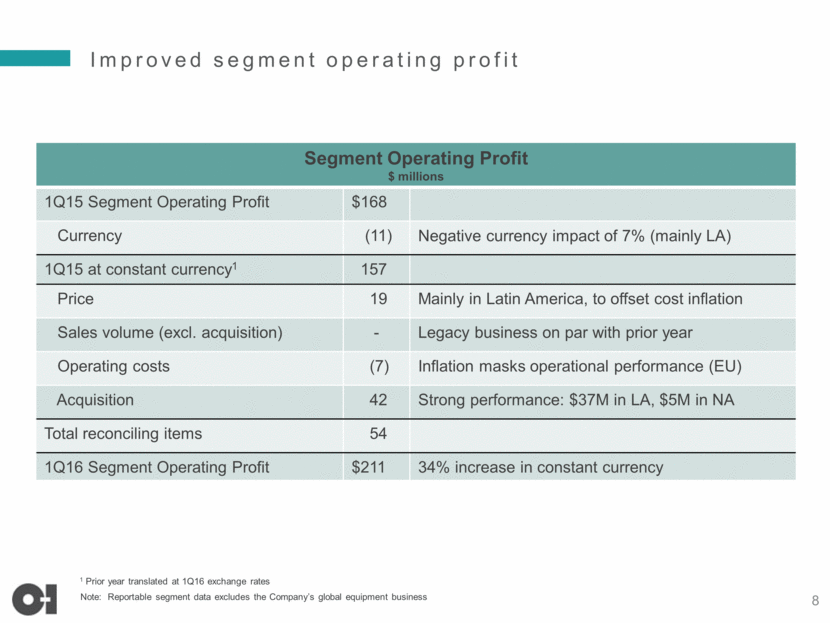
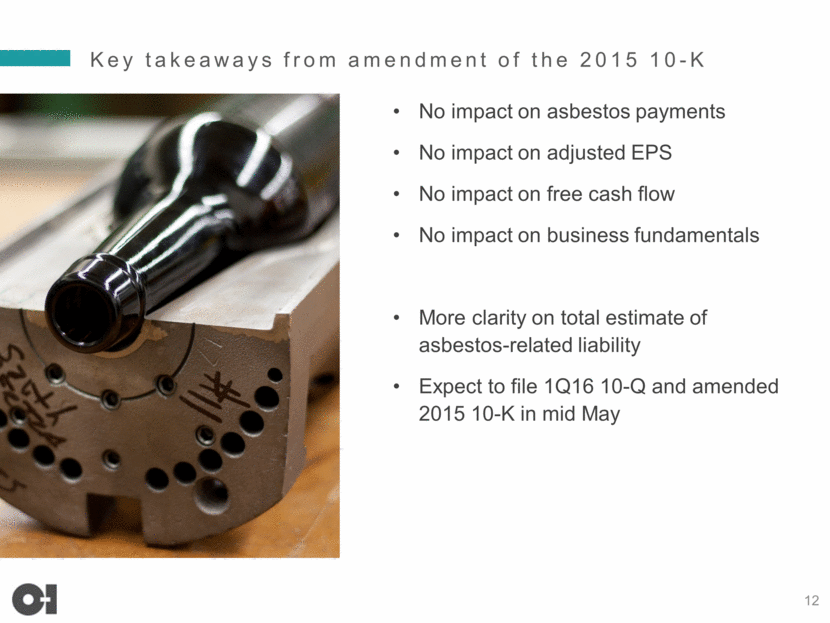
Strong 1Q16 Adjusted EPS; up 33% in constant currency 9 1 See appendix for a reconciliation to unaudited adjusted earnings and constant currency. Adjusted Earnings Per Share1 1Q15 Adjusted EPS $0.44 Currency (0.08) Headwind mainly in Latin America 1Q15 at constant currency 0.36 Segment operating profit 0.25 Gains in all regions Retained corporate costs (0.02) FX hedging impact Higher mgmt incentive accruals based on performance Net interest expense (0.09) Interest expense up due to acquisition-related debt Effective tax rate (0.02) Geographic mix of earnings (Mexico) Total reconciling items 0.12 1Q16 Adjusted EPS $0.48
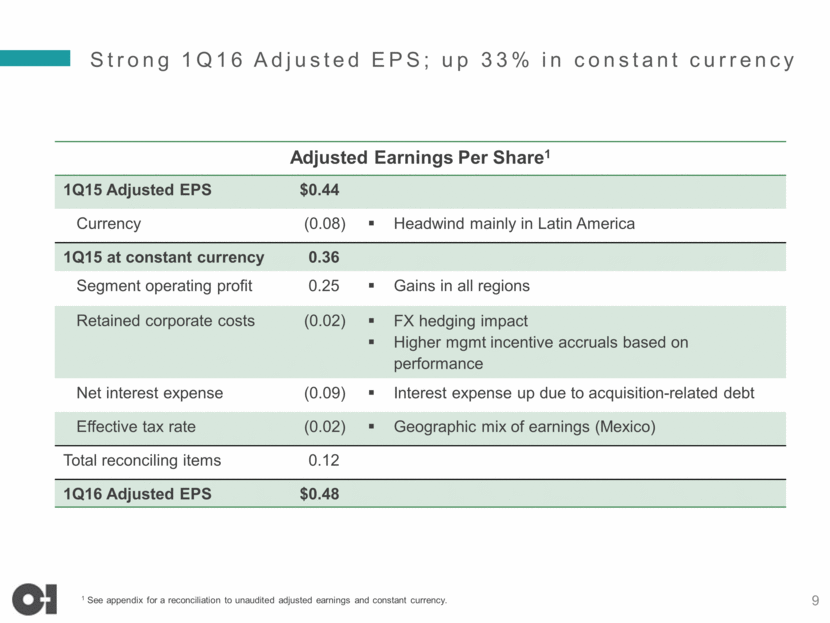
Asbestos: Positive trends continue on payments; accounting liability impacted by new estimation method 10 For over a decade, used 3 year horizon to estimate asbestos-related liability In 2015, SEC initiated dialogue, mainly regarding the timeframe used in our estimate Extended timeframe to 4 years for FY 2015 Following further dialogue with the SEC, we implemented an actuarial-based model to assess total liability Will amend our 2015 10-K to reflect total liability for asbestos-related costs Asbestos-related Payments * As previously reported Total asbestos-related liability Time Frame Used FY 2014* $435M 3 years FY 2015* $522M 4 years 1Q 2016 $806M Estimated total Asbestos-related Liability $75 $100 $125 $150 $175 $200 2008 2009 2010 2011 2012 2013 2014 2015 2016e $ Million
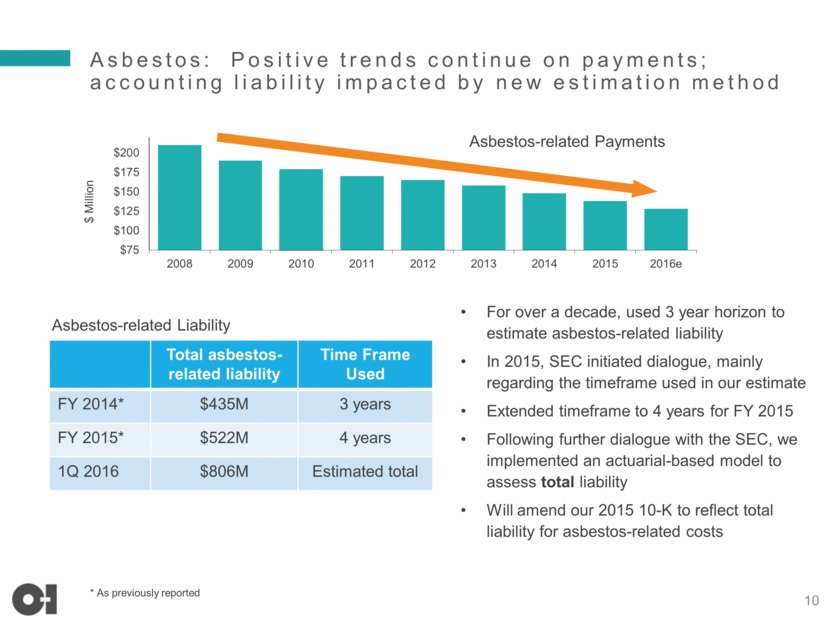
Early assessment of impact from restatement 11 Adjust December 31, 2012 balance sheet Increase asbestos-related liability Decrease retained earnings Reasonable estimate of total probable asbestos-related costs of $806M at March 31, 2016 Future comprehensive reviews may result in adjustments to the asbestos-related liability Amend 2015 10-K to recognize estimated total probable asbestos-related liability NO impact on cash or on business fundamentals $295 million higher than previous method, reflecting total time horizon $0 $200 $400 $600 $800 Previous method Current method $ million Total asbestos - related liability at March 31, 2016 Reflects 4 year time horizon Reflects total time horizon
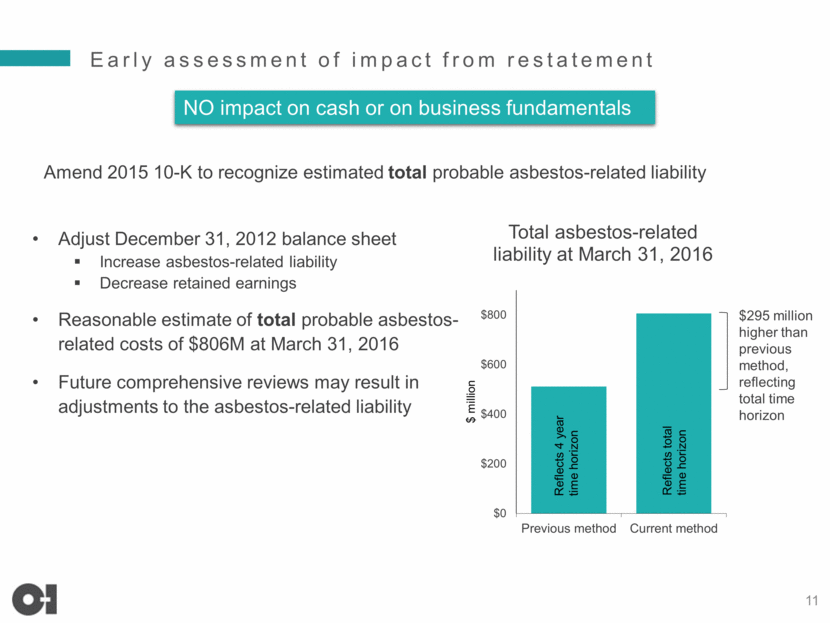
No impact on asbestos payments No impact on adjusted EPS No impact on free cash flow No impact on business fundamentals More clarity on total estimate of asbestos-related liability Expect to file 1Q16 10-Q and amended 2015 10-K in mid May 12 Key takeaways from amendment of the 2015 10-K
2Q16 Adjusted EPS outlook 13 2Q15 Adjusted EPS $0.60 Currency Impact ($0.04) Assumptions:1 EUR = 1.13; BRL = 3.60; COP = 3,010; AUD = 0.77; MXN = 17.2 2Q15 Adjusted EPS in Constant Currency1 $0.56 Europe Higher sales and production volume; lower costs North America Acquisition benefits; solid legacy business Latin America O-I Mexico; legacy biz nearly approaches PY despite macros Asia Pacific Engineering activity and cost inflation offset higher sales Segment Operating Profit Corporate and Other Costs Corporate ~$25M Tax rate on low end of 26-28% range 2Q16 Adjusted EPS $0.60-$0.65 Modestly above 2Q15 as reported 1 Prior year translated at March 31, 2016 exchange rates On a constant currency basis1
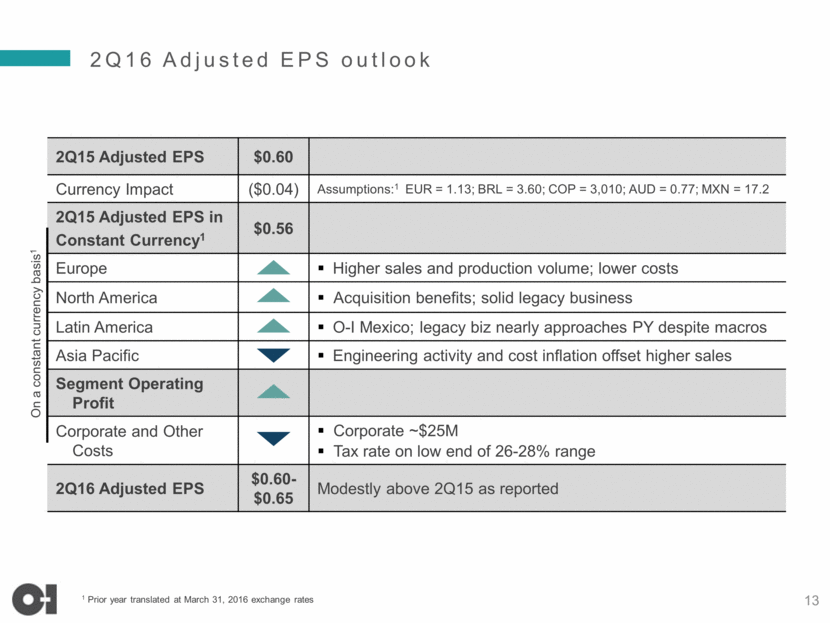
Full year 2016 outlook: Higher adjusted EPS and FCF 14 Key factors for 2016 guidance Strong business performance March 31 FX rates favorable to prior guidance Reflects some risk to business performance and macro conditions ~$280M ~$300M $2.25 - $2.35 2016 Adjusted EPS guidance: $2.25-$2.35 2016 Free Cash Flow guidance: ~$300M $100 $150 $200 $250 $300 $350 Feb. 2016 guidance Current guidance $ Millions FCF in 2016 $1.50 $1.80 $2.10 $2.40 Feb. 2016 guidance Current guidance Adj. EPS in 2016 $2.10 - $2.25
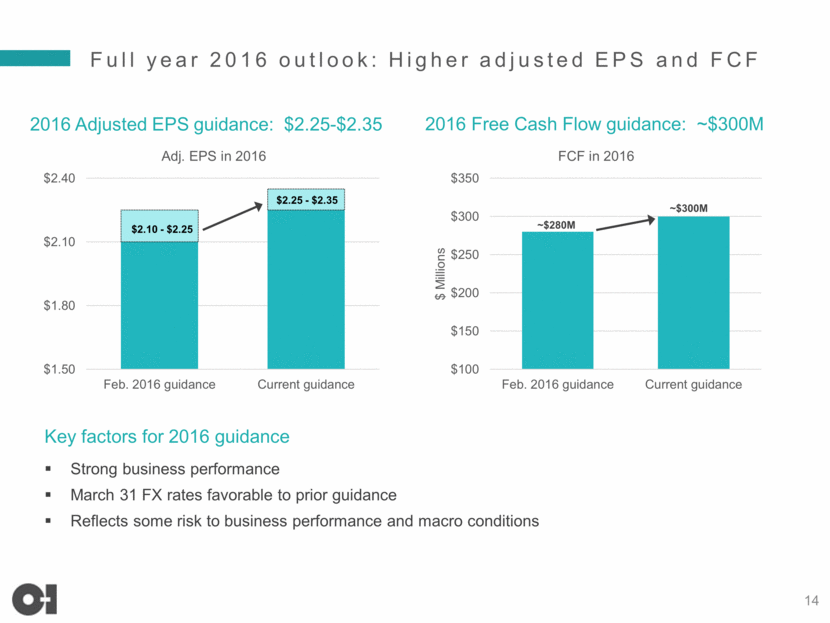
2016 management priorities 15 Establish and maintain revenue and operational stability Improve commercial and end-to-end supply chain performance Maximize the value of the Vitro F&B acquisition Leverage an enterprise approach and ensure accountability Strategic Improve margins and earnings Generate strong cash flows in local currencies ~$300M free cash flow at current exchange rates1 Deleverage the balance sheet Financial Exercise a balanced approach to volume and price Improve operational performance through asset stability, quality, higher productivity, improved flexibility and lower inventories Continue to reduce structural costs Operational 1 Assumes March 31, 2016 exchange rates continue for remainder of the year.
APPENDIX 16
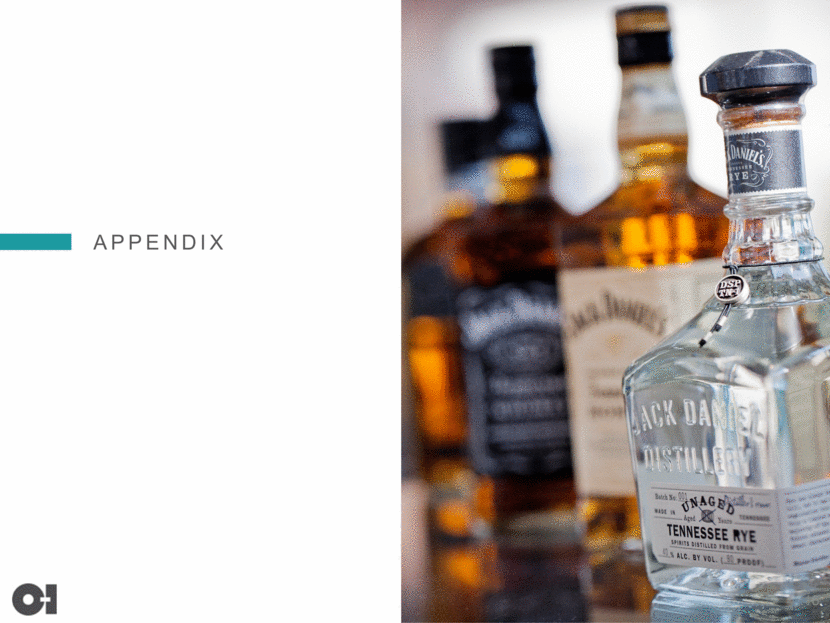
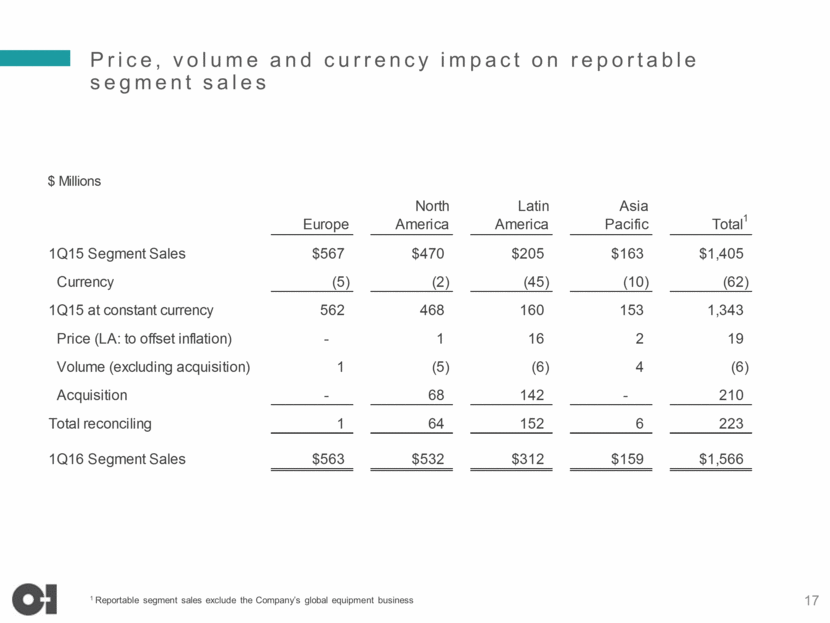
Price, volume and currency impact on reportable segment sales 17 1 Reportable segment sales exclude the Company’s global equipment business $ Millions Europe North America Latin America Asia Pacific Total1 1Q15 Segment Sales $567 $470 $205 $163 $1,405 Currency (5) (2) (45) (10) (62) 1Q15 at constant currency 562 468 160 153 1,343 Price (LA: to offset inflation) - 1 16 2 19 Volume (excluding acquisition) 1 (5) (6) 4 (6) Acquisition - 68 142 - 210 Total reconciling 1 64 152 6 223 1Q16 Segment Sales $563 $532 $312 $159 $1,566
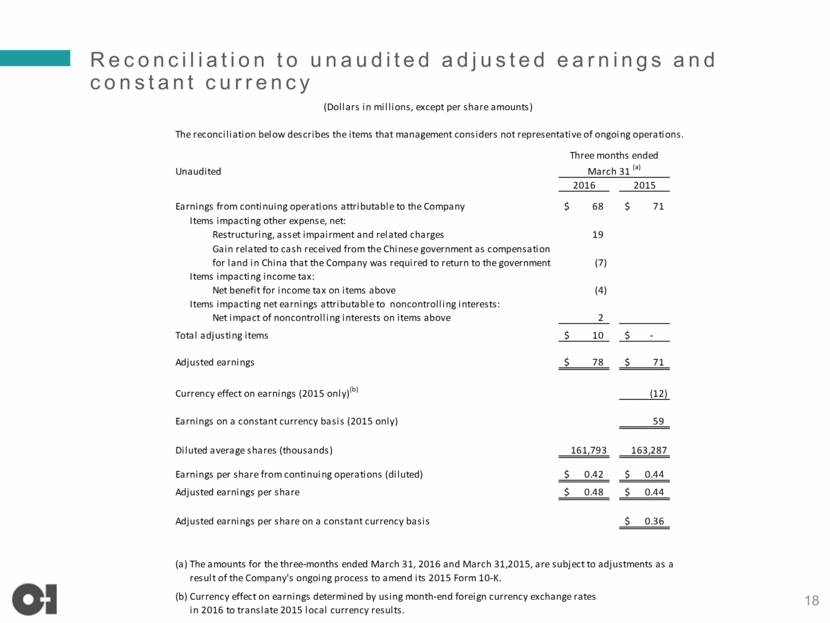
Reconciliation to unaudited adjusted earnings and constant currency 18 The reconciliation below describes the items that management considers not representative of ongoing operations. Unaudited 2016 2015 68 $ 71 $ Restructuring, asset impairment and related charges 19 - Gain related to cash received from the Chinese government as compensation for land in China that the Company was required to return to the government (7) Items impacting income tax: Net benefit for income tax on items above (4) - Net impact of noncontrolling interests on items above 2 Total adjusting items 10 $ - $ Adjusted earnings 78 $ 71 $ Currency effect on earnings (2015 only) (b) (12) Earnings on a constant currency basis (2015 only) 59 161,793 163,287 Earnings per share from continuing operations (diluted) 0.42 $ 0.44 $ Adjusted earnings per share 0.48 $ 0.44 $ Adjusted earnings per share on a constant currency basis 0.36 $ (a) (b) (Dollars in millions, except per share amounts) Earnings from continuing operations attributable to the Company Three months ended March 31 (a) Items impacting other expense, net: Diluted average shares (thousands) Items impacting net earnings attributable to noncontrolling interests: Currency effect on earnings determined by using month-end foreign currency exchange rates in 2016 to translate 2015 local currency results. The amounts for the three-months ended March 31, 2016 and March 31,2015, are subject to adjustments as a result of the Company's ongoing process to amend its 2015 Form 10-K.
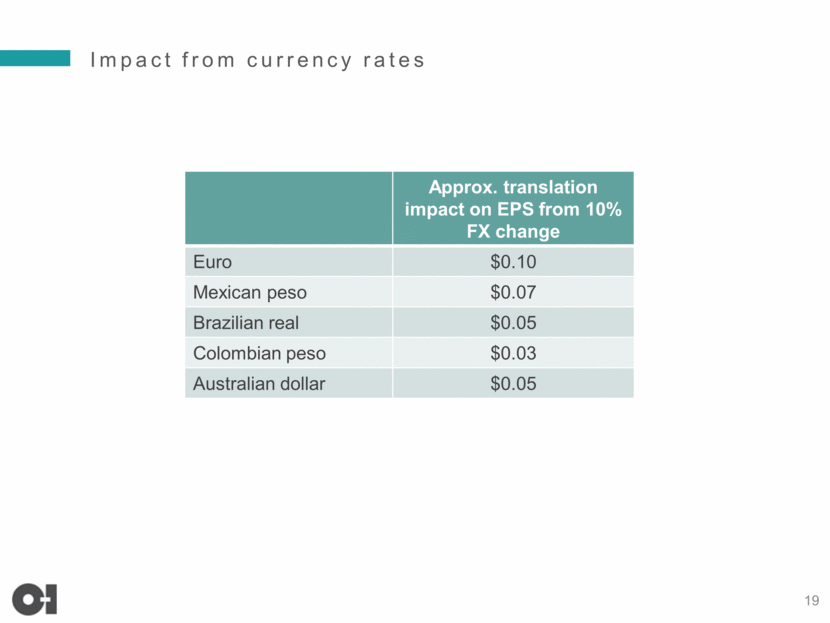
Impact from currency rates 19 Approx. translation impact on EPS from 10% FX change Euro $0.10 Mexican peso $0.07 Brazilian real $0.05 Colombian peso $0.03 Australian dollar $0.05
