Attached files
| file | filename |
|---|---|
| EX-99.1 - EXHIBIT 99.1 - CHIMERA INVESTMENT CORP | a51332475ex99_1.htm |
| 8-K - CHIMERA INVESTMENT CORPORATION 8-K - CHIMERA INVESTMENT CORP | a51332475.htm |
Exhibit 99.2
Q1 2016 Supplemental Financial Information May 3, 2016
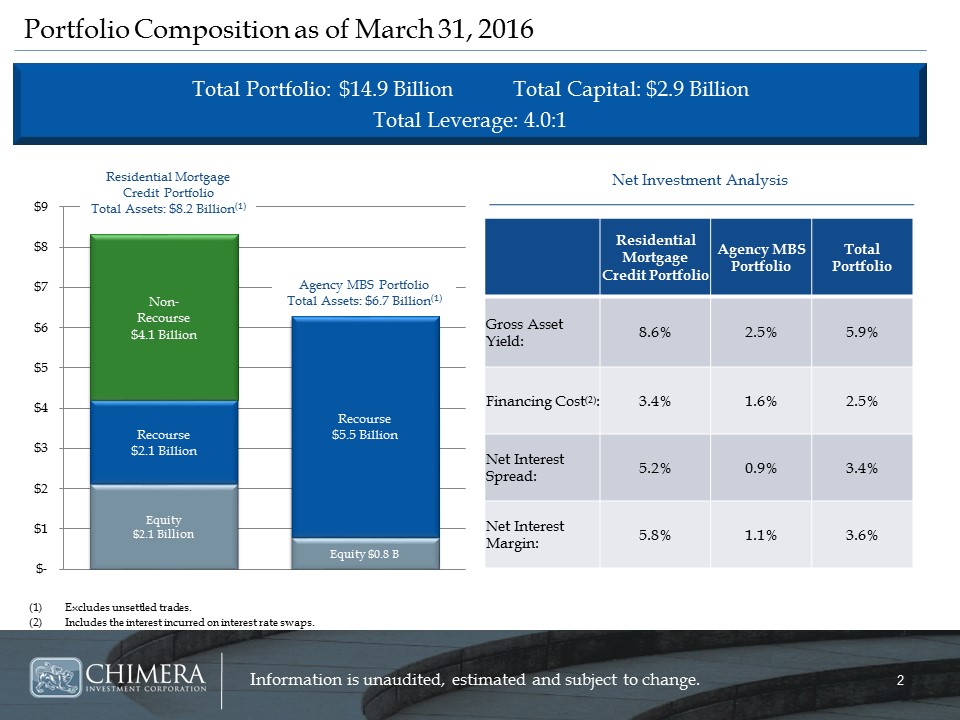
Portfolio Composition as of March 31, 2016 Residential Mortgage Credit Portfolio Agency MBS Portfolio Total Portfolio Gross Asset Yield: 8.6% 2.5% 5.9% Financing Cost(2): 3.4% 1.6% 2.5% Net Interest Spread: 5.2% 0.9% 3.4% Net Interest Margin: 5.8% 1.1% 3.6% Excludes unsettled trades.Includes the interest incurred on interest rate swaps. Total Portfolio: $14.9 Billion Total Capital: $2.9 BillionTotal Leverage: 4.0:1 Net Investment Analysis Residential Mortgage Credit PortfolioTotal Assets: $8.2 Billion(1) Agency MBS PortfolioTotal Assets: $6.7 Billion(1)
Portfolio Composition as of March 31, 2016 Residential Mortgage Credit Portfolio Agency MBS Portfolio Total Portfolio Gross Asset Yield: 8.6% 2.5% 5.9% Financing Cost(2): 3.4% 1.6% 2.5% Net Interest Spread: 5.2% 0.9% 3.4% Net Interest Margin: 5.8% 1.1% 3.6% Excludes unsettled trades.Includes the interest incurred on interest rate swaps. Total Portfolio: $14.9 Billion Total Capital: $2.9 BillionTotal Leverage: 4.0:1 Net Investment Analysis Residential Mortgage Credit PortfolioTotal Assets: $8.2 Billion(1) Agency MBS PortfolioTotal Assets: $6.7 Billion(1)
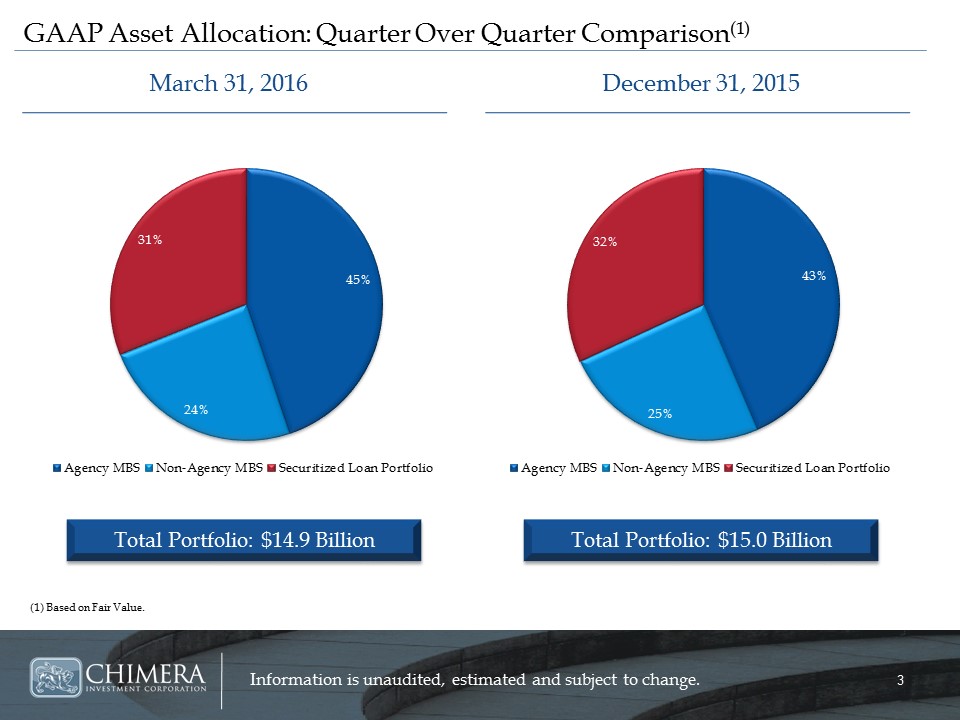
March 31, 2016 December 31, 2015 GAAP Asset Allocation: Quarter Over Quarter Comparison(1) (1) Based on Fair Value.
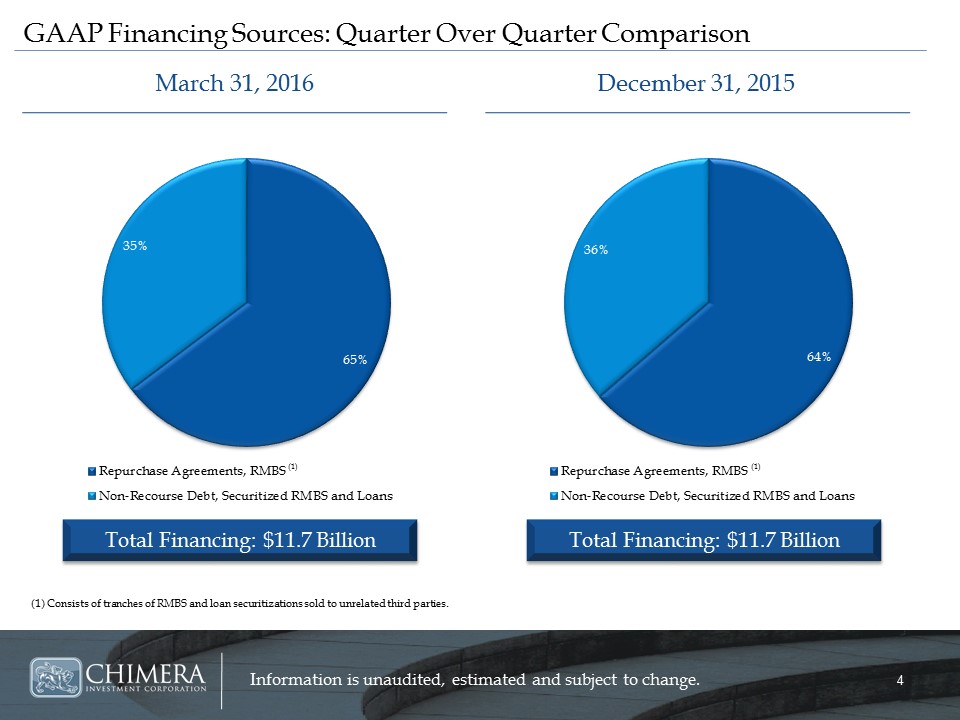
(1) Consists of tranches of RMBS and loan securitizations sold to unrelated third parties. March 31, 2016 December 31, 2015 GAAP Financing Sources: Quarter Over Quarter Comparison Total Financing: $11.7 Billion Total Financing: $11.7 Billion (1) (1) 3.5% 0.9%
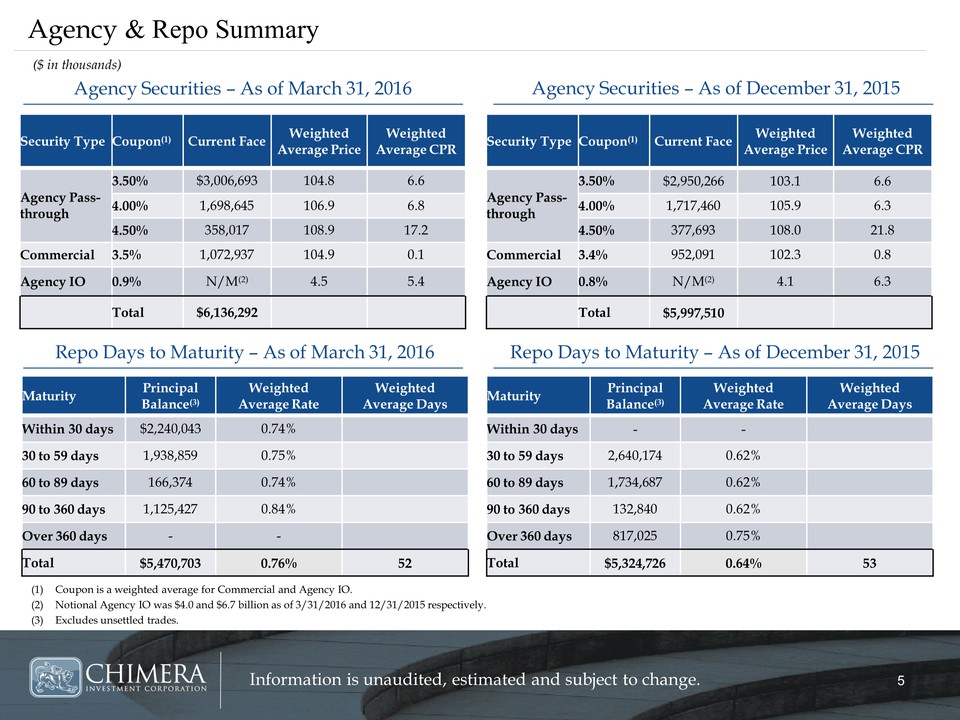
Agency & Repo Summary Agency Securities – As of March 31, 2016 Repo Days to Maturity – As of March 31, 2016 Agency Securities – As of December 31, 2015 Repo Days to Maturity – As of December 31, 2015 ($ in thousands) Maturity Principal Balance(3) Weighted Average Rate Weighted Average Days Within 30 days - - 30 to 59 days 2,640,174 0.62% 60 to 89 days 1,734,687 0.62% 90 to 360 days 132,840 0.62% Over 360 days 817,025 0.75% Total $5,324,726 0.64% 53 Coupon is a weighted average for Commercial and Agency IO.Notional Agency IO was $4.0 and $6.7 billion as of 3/31/2016 and 12/31/2015 respectively. Excludes unsettled trades. Security Type Coupon(1) Current Face Weighted Average Price Weighted Average CPR Agency Pass-through 3.50% $3,006,693 104.8 6.6 4.00% 1,698,645 106.9 6.8 4.50% 358,017 108.9 17.2 Commercial 3.4% 1,072,937 104.9 0.1 Agency IO 0.8% N/M(2) 4.5 5.4 Total $6,136,292 Maturity Principal Balance(3) Weighted Average Rate Weighted Average Days Within 30 days $2,240,043 0.74% 30 to 59 days 1,938,859 0.75% 60 to 89 days 166,374 0.74% 90 to 360 days 1,125,427 0.84% Over 360 days - - Total $5,470,703 0.76% 52 Security Type Coupon(1) Current Face Weighted Average Price Weighted Average CPR Agency Pass-through 3.50% $2,950,266 103.1 6.6 4.00% 1,717,460 105.9 6.3 4.50% 377,693 108.0 21.8 Commercial 3.4% 952,091 102.3 0.8 Agency IO 0.8% N/M(2) 4.1 6.3 Total $5,997,510
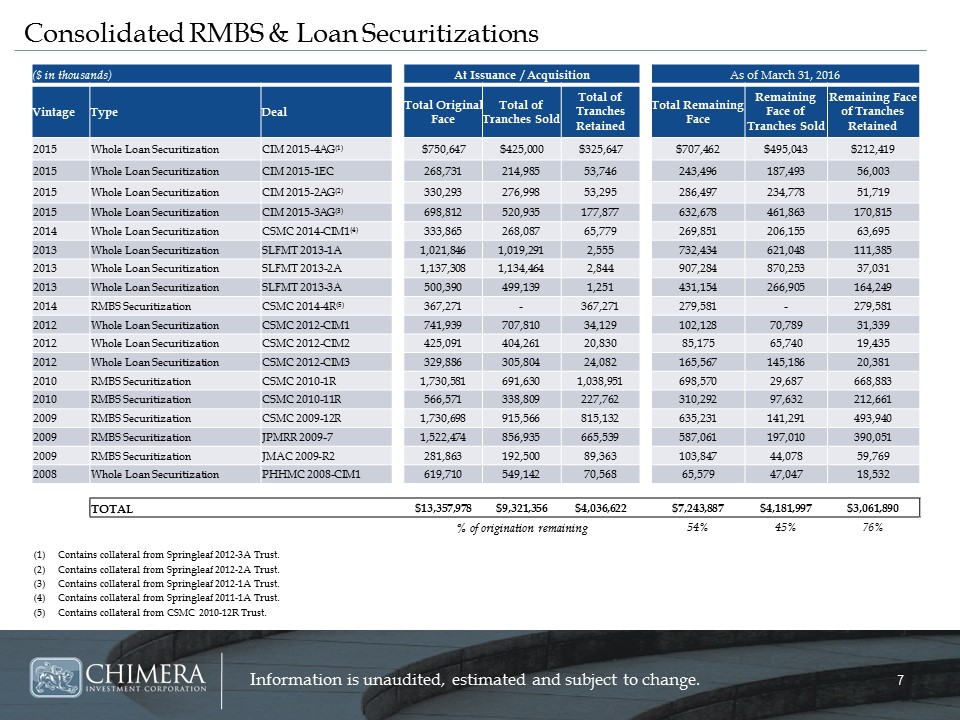
Consolidated RMBS & Loan Securitizations ($ in thousands) At Issuance / Acquisition As of March 31, 2016 Vintage Type Deal Total Original Face Total of Tranches Sold Total of Tranches Retained Total Remaining Face Remaining Face of Tranches Sold Remaining Face of Tranches Retained 2015 Whole Loan Securitization CIM 2015-4AG(1) $750,647 $425,000 $325,647 $707,462 $495,043 $212,419 2015 Whole Loan Securitization CIM 2015-1EC 268,731 214,985 53,746 243,496 187,493 56,003 2015 Whole Loan Securitization CIM 2015-2AG(2) 330,293 276,998 53,295 286,497 234,778 51,719 2015 Whole Loan Securitization CIM 2015-3AG(3) 698,812 520,935 177,877 632,678 461,863 170,815 2014 Whole Loan Securitization CSMC 2014-CIM1(4) 333,865 268,087 65,779 269,851 206,155 63,695 2013 Whole Loan Securitization SLFMT 2013-1A 1,021,846 1,019,291 2,555 732,434 621,048 111,385 2013 Whole Loan Securitization SLFMT 2013-2A 1,137,308 1,134,464 2,844 907,284 870,253 37,031 2013 Whole Loan Securitization SLFMT 2013-3A 500,390 499,139 1,251 431,154 266,905 164,249 2014 RMBS Securitization CSMC 2014-4R(5) 367,271 - 367,271 279,581 - 279,581 2012 Whole Loan Securitization CSMC 2012-CIM1 741,939 707,810 34,129 102,128 70,789 31,339 2012 Whole Loan Securitization CSMC 2012-CIM2 425,091 404,261 20,830 85,175 65,740 19,435 2012 Whole Loan Securitization CSMC 2012-CIM3 329,886 305,804 24,082 165,567 145,186 20,381 2010 RMBS Securitization CSMC 2010-1R 1,730,581 691,630 1,038,951 698,570 29,687 668,883 2010 RMBS Securitization CSMC 2010-11R 566,571 338,809 227,762 310,292 97,632 212,661 2009 RMBS Securitization CSMC 2009-12R 1,730,698 915,566 815,132 635,231 141,291 493,940 2009 RMBS Securitization JPMRR 2009-7 1,522,474 856,935 665,539 587,061 197,010 390,051 2009 RMBS Securitization JMAC 2009-R2 281,863 192,500 89,363 103,847 44,078 59,769 2008 Whole Loan Securitization PHHMC 2008-CIM1 619,710 549,142 70,568 65,579 47,047 18,532 TOTAL $13,357,978 $9,321,356 $4,036,622 $7,243,887 $4,181,997 $3,061,890 % of origination remaining 54% 45% 76% Contains collateral from Springleaf 2012-3A Trust.Contains collateral from Springleaf 2012-2A Trust.Contains collateral from Springleaf 2012-1A Trust. Contains collateral from Springleaf 2011-1A Trust.Contains collateral from CSMC 2010-12R Trust.