Attached files
| file | filename |
|---|---|
| EX-99.1 - EXHIBIT 99.1 - ALBANY INTERNATIONAL CORP /DE/ | a51332826ex99_1.htm |
| 8-K - ALBANY INTERNATIONAL CORP. 8-K - ALBANY INTERNATIONAL CORP /DE/ | a51332826.htm |
Exhibit 99.2

Q1 Financial Performance May 2, 2016
‘Non-GAAP’ Items and Forward-Looking Statements This presentation contains certain items, such as net income attributable to the Company, excluding adjustments (absolute as well as per-share), earnings before interest, taxes, depreciation and amortization (EBITDA), adjusted EBITDA and net debt, that could be considered ‘non-GAAP’ financial measures under SEC rules. We think such items provide useful information to investors regarding the Company’s operational performance. This presentation also may contain statements, estimates, or projections that constitute “forward-looking statements” as defined under U.S. federal securities laws. Forward-looking statements are subject to certain risks and uncertainties that could cause actual results to differ materially from the Company’s historical experience and our present expectations or projections. We disclaim any obligation to update any information in this presentation to reflect any changes or developments after the date on the cover page. Certain additional disclosures regarding our use of these ‘non-GAAP’ items and forward-looking statements are set forth in our fourth-quarter earnings press release dated May 2, 2016, and in our SEC filings, including our most recent quarterly reports and our annual reports for the years ended December 31, 2013, 2014, and 2015.Our use of such items in this presentation is subject to those additional disclosures, which we urge you to read. 2
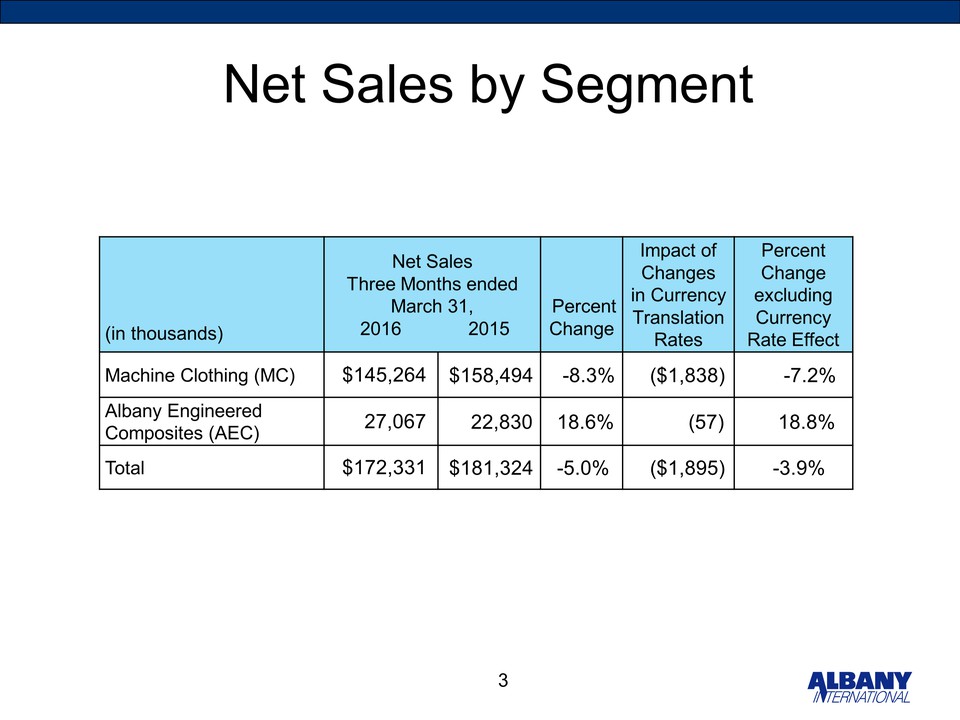
Net Sales by Segment (in thousands) Net Sales Three Months ended March 31, 2016 2015 Percent Change Impact of Changes in Currency Translation Rates Percent Change excluding Currency Rate Effect Machine Clothing (MC) $145,264 $158,494 -8.3% ($1,838) -7.2% Albany Engineered Composites (AEC) 27,067 22,830 18.6% (57) 18.8% Total $172,331 $181,324 -5.0% ($1,895) -3.9% 3
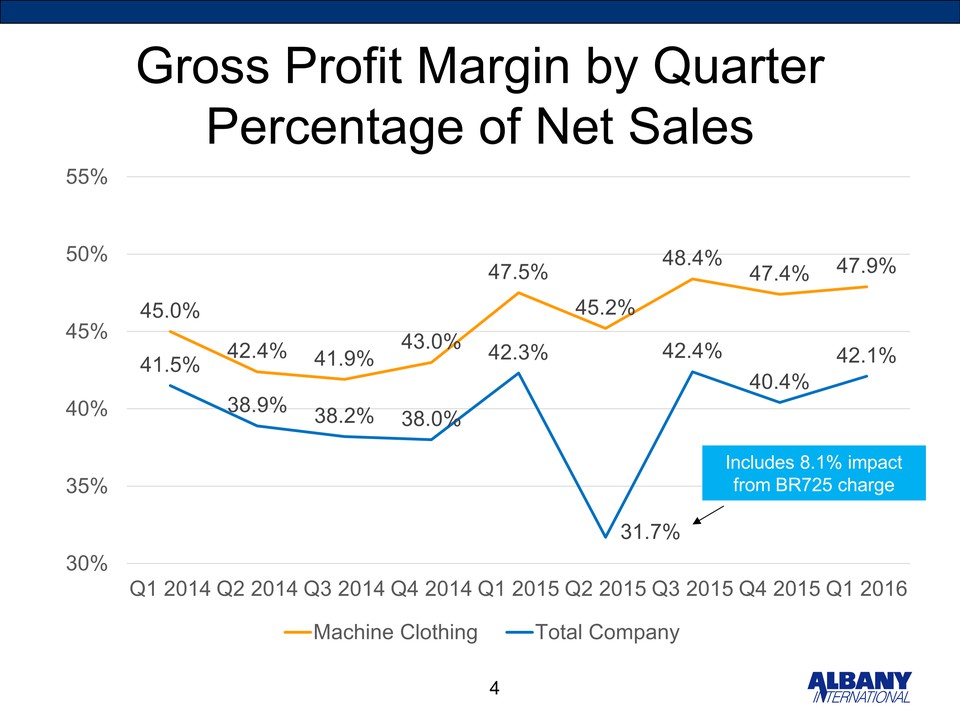
Gross Profit Margin by Quarter Percentage of Net Sales 45.0% 42.4% 41.9% 43.0% 47.5% 45.2% 48.4% 47.4% 47.9% 41.5% 38.9% 38.2% 38.0% 42.3% 31.7% 42.4% 40.4% 42.1% 30% 35% 40% 45% 50% 55% Q1 2014 Q2 2014 Q3 2014 Q4 2014 Q1 2015 Q2 2015 Q3 2015 Q4 2015 Q1 2016 Machine Clothing Total Company Includes 8.1% impact from BR725 charge 4
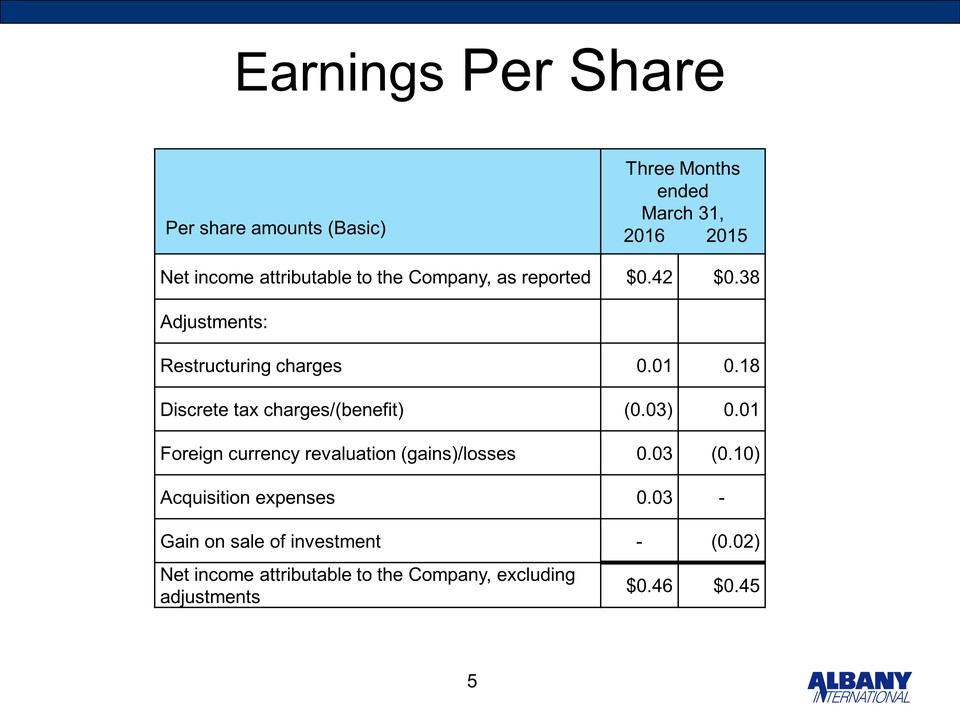
Earnings Per Share Per share amounts (Basic) Three Months ended March 31, 2016 2015 Netincome attributable to the Company, as reported $0.42 $0.38 Adjustments: Restructuring charges 0.01 0.18 Discrete tax charges/(benefit) (0.03) 0.01 Foreign currency revaluation (gains)/losses 0.03 (0.10) Acquisition expenses 0.03 - Gain on sale of investment - (0.02) Net income attributable to the Company, excluding adjustments $0.46 $0.45 5
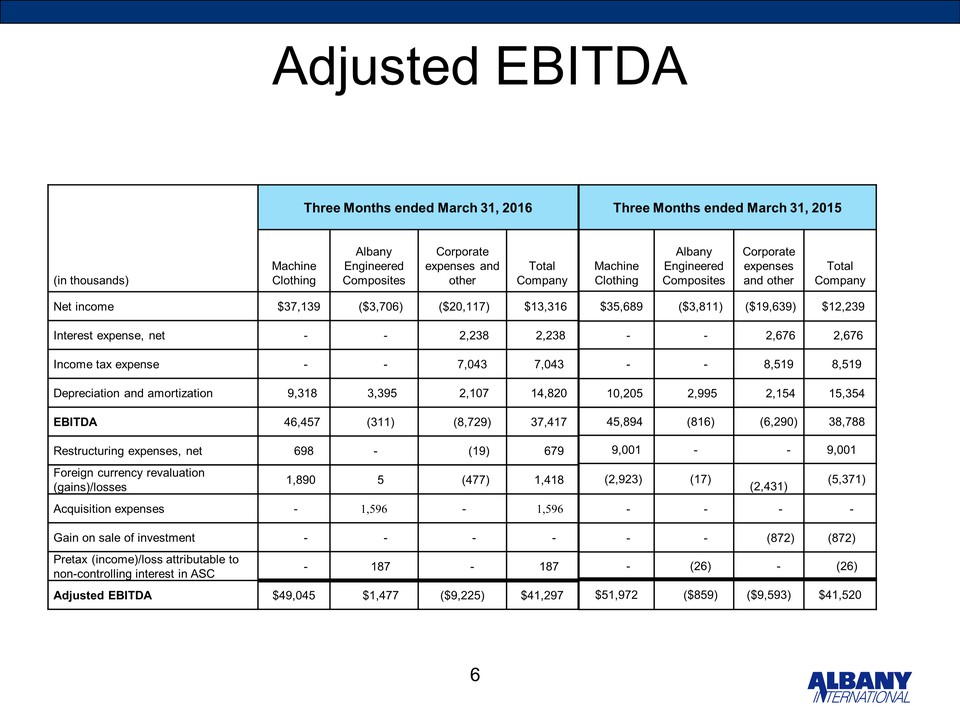
Adjusted EBITDA Three Months ended March 31, 2016 (in thousands) Machine Clothing Albany Engineered Composites Corporate expenses and other Total Company Net income $37,139 ($3,706) ($20,117) $13,316 Interest expense, net - - 2,238 2,238 Income tax expense - - 7,043 7,043 Depreciation and amortization 9,318 3,395 2,107 14,820 EBITDA 46,457 (311) (8,729) 37,417 Restructuring expenses, net 698 - (19) 679 Foreign currency revaluation (gains)/losses 1,890 5 (477) 1,418 Acquisition expenses - 1,596 - 1,596 Gain on sale of investment - - - - Pretax (income)/loss attributable to non-controlling interest in ASC - 187 - 187 Adjusted EBITDA $49,045 $1,477 ($9,225) $41,297 Three Months ended March31, 2015 Machine Clothing Albany Engineered Composites Corporate expenses and other Total Company $35,689 ($3,811) ($19,639) $12,239 - - 2,676 2,676 - - 8,519 8,519 10,205 2,995 2,154 15,354 45,894 (816) (6,290) 38,788 9,001 - - 9,001 (2,923) (17) (2,431) (5,371) - - - - - - (872) (872) - (26) - (26) $51,972 ($859) ($9,593) $41,520 6
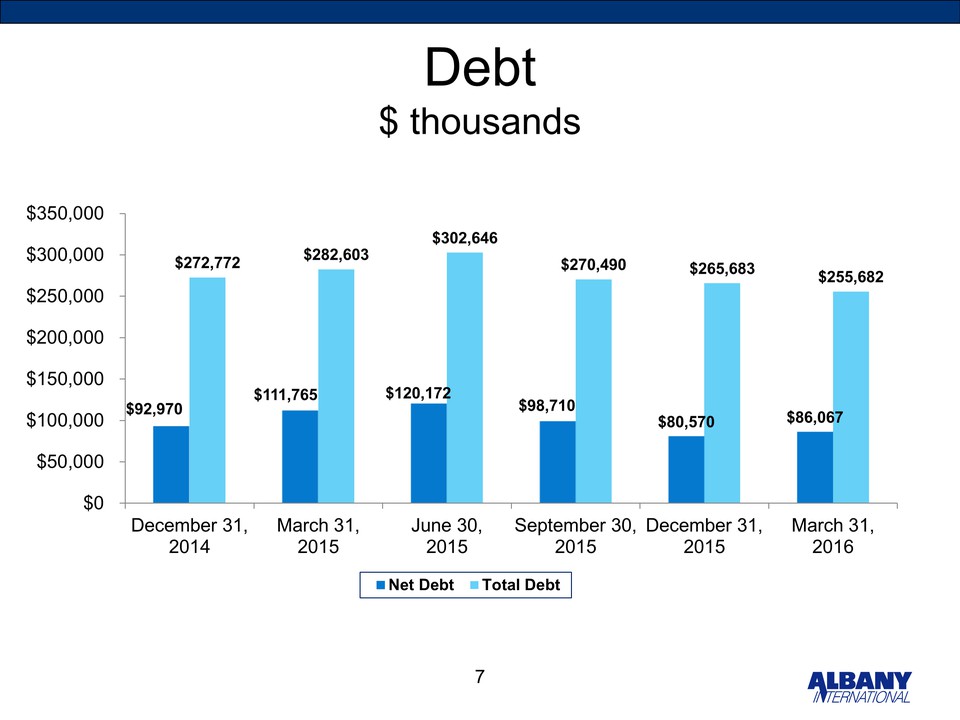
Debt $ thousands $92,970 $111,765 $120,172 $98,710 $80,570 $86,067 $272,772 $282,603 $302,646 $270,490 $265,683 $255,682 $0 $50,000 $100,000 $150,000 $200,000 $250,000 $300,000 $350,000 December 31, 2014 March 31, 2015 June 30, 2015 September 30, 2015 December 31, 2015 March 31, 2016 Net Debt Total Debt 7