Attached files
| file | filename |
|---|---|
| 8-K - 8-K - Triumph Bancorp, Inc. | tbk-8k_20160427.htm |
| EX-99.1 - EX-99.1 - Triumph Bancorp, Inc. | tbk-ex991_6.htm |

Q1 2016 EARNINGS RELEASE – APRIL 27, 2016 Exhibit 99.2
PAGE DISCLAIMER Forward-Looking Statements This presentation contains forward-looking statements. Any statements about our expectations, beliefs, plans, predictions, forecasts, objectives, assumptions or future events or performance are not historical facts and may be forward-looking. You can identify forward-looking statements by the use of forward-looking terminology such as “believes,” “expects,” “could,” “may,” “will,” “should,” “seeks,” “likely,” “intends,” “plans,” “pro forma,” “projects,” “estimates” or “anticipates” or the negative of these words and phrases or similar words or phrases that are predictions of or indicate future events or trends and that do not relate solely to historical matters. You can also identify forward-looking statements by discussions of strategy, plans or intentions. Forward-looking statements involve numerous risks and uncertainties and you should not rely on them as predictions of future events. Forward-looking statements depend on assumptions, data or methods that may be incorrect or imprecise and we may not be able to realize them. We do not guarantee that the transactions and events described will happen as described (or that they will happen at all). The following factors, among others, could cause actual results and future events to differ materially from those set forth or contemplated in the forward-looking statements: our limited operating history as an integrated company; business and economic conditions generally and in the bank and non-bank financial services industries, nationally and within our local market area; our ability to mitigate our risk exposures; our ability to maintain our historical earnings trends; risks related to the integration of acquired businesses (including our pending acquisition of ColoEast Bankshares, Inc.) and any future acquisitions; changes in management personnel; interest rate risk; concentration of our factoring services in the transportation industry; credit risk associated with our loan portfolio; lack of seasoning in our loan portfolio; deteriorating asset quality and higher loan charge-offs; time and effort necessary to resolve nonperforming assets; inaccuracy of the assumptions and estimates we make in establishing reserves for probable loan losses and other estimates; lack of liquidity; fluctuations in the fair value and liquidity of the securities we hold for sale; impairment of investment securities, goodwill, other intangible assets or deferred tax assets; risks related to our asset management business; our risk management strategies; environmental liability associated with our lending activities; increased competition in the bank and non-bank financial services industries, nationally, regionally or locally, which may adversely affect pricing and terms; the obligations associated with being a public company; the accuracy of our financial statements and related disclosures; material weaknesses in our internal control over financial reporting; system failures or failures to prevent breaches of our network security; the institution and outcome of litigation and other legal proceedings against us or to which we become subject; changes in carry-forwards of net operating losses; changes in federal tax law or policy; the impact of recent and future legislative and regulatory changes, including changes in banking, securities and tax laws and regulations, such as the Dodd-Frank Wall Street Reform and Consumer Protection Act (the “Dodd-Frank Act”) and their application by our regulators; governmental monetary and fiscal policies; changes in the scope and cost of the Federal Deposit Insurance Corporation insurance and other coverages; failure to receive regulatory approval for future acquisitions; increases in our capital requirements; and risk retention requirements under the Dodd-Frank Act. While forward-looking statements reflect our good-faith beliefs, they are not guarantees of future performance. All forward-looking statements are necessarily only estimates of future results. Accordingly, actual results may differ materially from those expressed in or contemplated by the particular forward-looking statement, and, therefore, you are cautioned not to place undue reliance on such statements. Further, any forward-looking statement speaks only as of the date on which it is made, and we undertake no obligation to update any forward-looking statement to reflect events or circumstances after the date on which the statement is made or to reflect the occurrence of unanticipated events or circumstances, except as required by applicable law. For a discussion of such risks and uncertainties, which could cause actual results to differ from those contained in the forward-looking statements, see “Risk Factors” and the forward-looking statement disclosure contained in Triumph’s Annual Report on Form 10-K, filed with the Securities and Exchange Commission on February 26, 2016. Non-GAAP Financial Measures This presentation includes certain non‐GAAP financial measures intended to supplement, not substitute for, comparable GAAP measures. Reconciliations of non‐GAAP financial measures to GAAP financial measures are provided at the end of the presentation. Numbers in this presentation may not sum due to rounding. Unless otherwise referenced, all data presented is as of 3/31/2016.
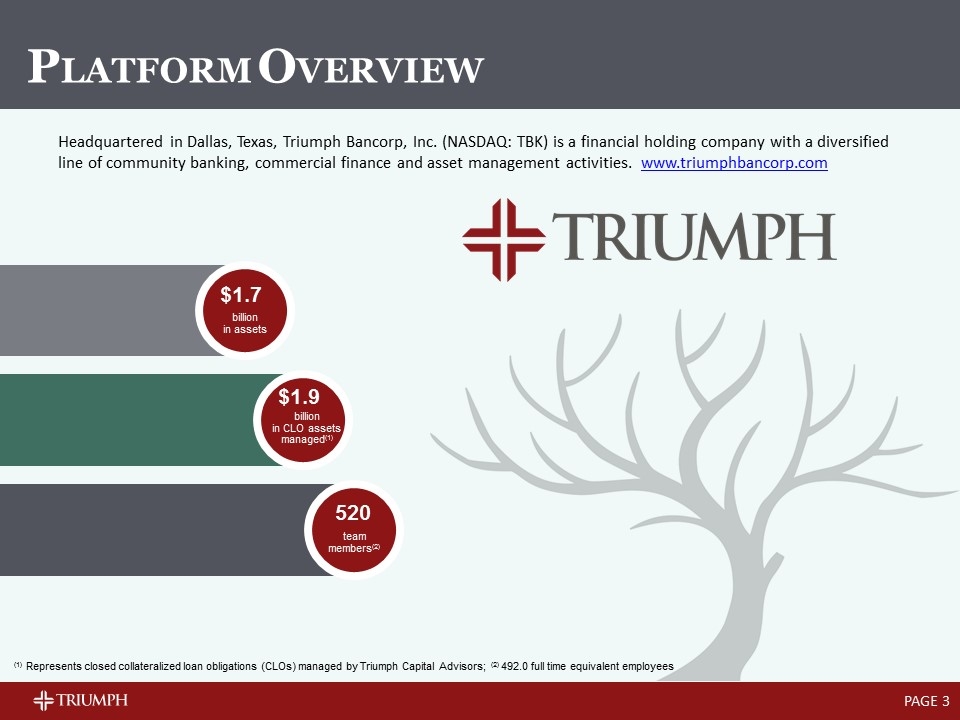
PAGE Headquartered in Dallas, Texas, Triumph Bancorp, Inc. (NASDAQ: TBK) is a financial holding company with a diversified line of community banking, commercial finance and asset management activities. www.triumphbancorp.com $1.7 billion in assets $1.9 billion in CLO assets managed(1) 520 team members(2) (1) Represents closed collateralized loan obligations (CLOs) managed by Triumph Capital Advisors; (2) 492.0 full time equivalent employees PLATFORM OVERVIEW
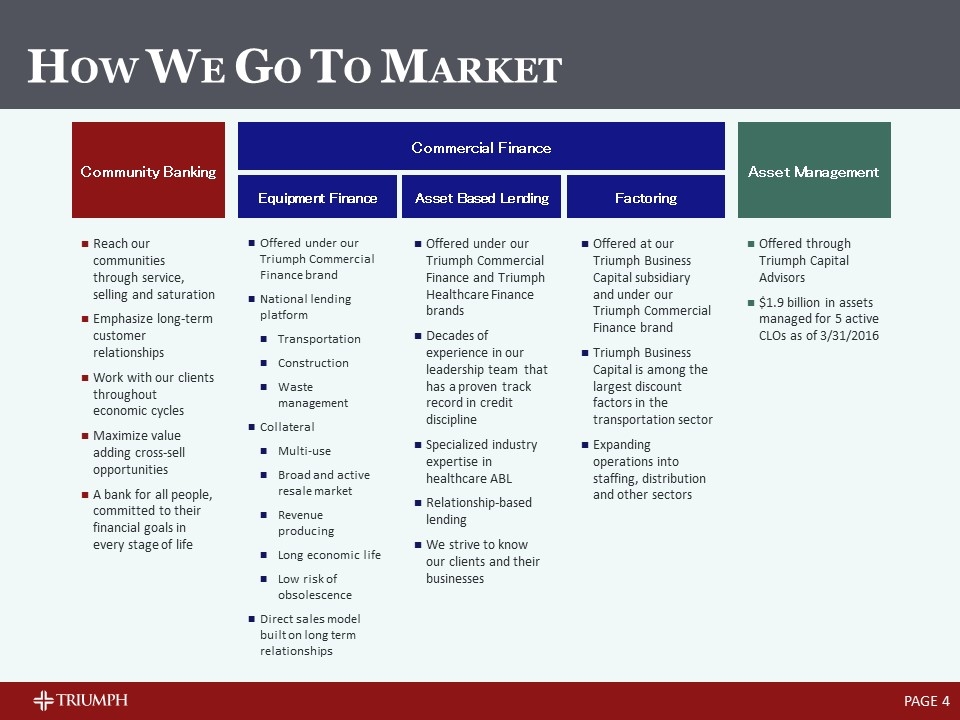
PAGE Community Banking Reach our communities through service, selling and saturation Emphasize long-term customer relationships Work with our clients throughout economic cycles Maximize value adding cross-sell opportunities A bank for all people, committed to their financial goals in every stage of life Factoring Offered at our Triumph Business Capital subsidiary and under our Triumph Commercial Finance brand Triumph Business Capital is among the largest discount factors in the transportation sector Expanding operations into staffing, distribution and other sectors Asset Based Lending Offered under our Triumph Commercial Finance and Triumph Healthcare Finance brands Decades of experience in our leadership team that has a proven track record in credit discipline Specialized industry expertise in healthcare ABL Relationship-based lending We strive to know our clients and their businesses Equipment Finance Offered under our Triumph Commercial Finance brand National lending platform Transportation Construction Waste management Collateral Multi-use Broad and active resale market Revenue producing Long economic life Low risk of obsolescence Direct sales model built on long term relationships Asset Management Offered through Triumph Capital Advisors $1.9 billion in assets managed for 5 active CLOs as of 3/31/2016 Commercial Finance HOW WE GO TO MARKET
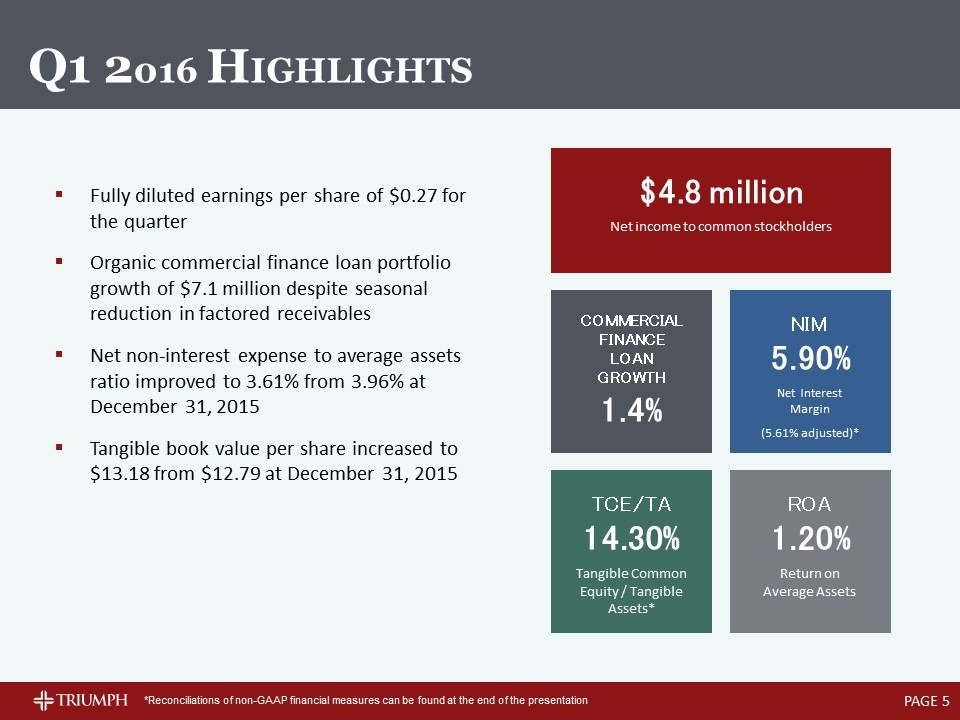
PAGE Fully diluted earnings per share of $0.27 for the quarter Organic commercial finance loan portfolio growth of $7.1 million despite seasonal reduction in factored receivables Net non-interest expense to average assets ratio improved to 3.61% from 3.96% at December 31, 2015 Tangible book value per share increased to $13.18 from $12.79 at December 31, 2015 $4.8 million Net income to common stockholders COMMERCIAL FINANCE LOAN GROWTH 1.4% NIM 5.90% Net Interest Margin (5.61% adjusted)* ROA 1.20% Return on Average Assets TCE/TA 14.30% Tangible Common Equity / Tangible Assets* Q1 2016 HIGHLIGHTS *Reconciliations of non-GAAP financial measures can be found at the end of the presentation
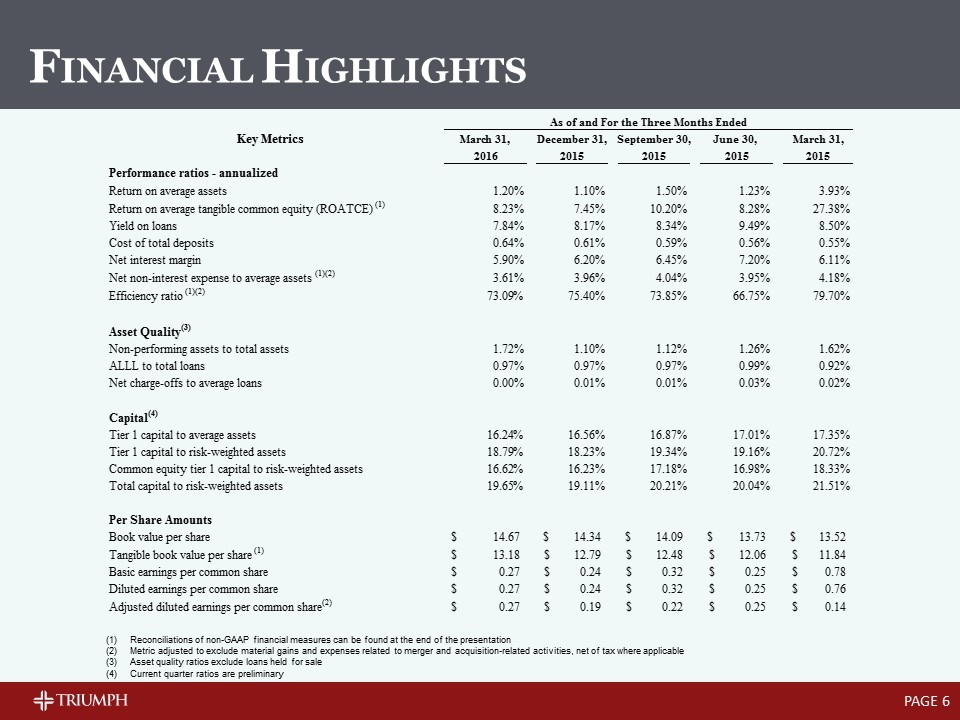
PAGE FINANCIAL HIGHLIGHTS Reconciliations of non-GAAP financial measures can be found at the end of the presentation Metric adjusted to exclude material gains and expenses related to merger and acquisition-related activities, net of tax where applicable Asset quality ratios exclude loans held for sale Current quarter ratios are preliminary 42460 42369 42277 42185 42094 As of and For the Three Months Ended Key Metrics March 31, December 31, September 30, June 30, March 31, 2016 2015 2015 2015 2015 Performance ratios - annualized Return on average assets Return on average assets 1.1966119434092952E-2 1.1010161353075008E-2 1.5020682981696912E-2 1.2347404317062754E-2 3.9287049592355704E-2 Return on average tangible common equity (ROATCE) Return on average tangible common equity (ROATCE) (1) 8.228918603421137E-2 7.4497863158859354E-2 0.10203104285871456 8.2822836753880177E-2 0.27376859452077651 Yield on loans Yield on loans 7.8399999999999997E-2 8.1699999999999995E-2 8.3393056676373922E-2 9.4944990035923063E-2 8.4957323547613289E-2 Cost of total deposits Cost of total deposits 6.4457419322120537E-3 6.1061876467827661E-3 5.8852630913512095E-3 5.6097701311609068E-3 5.4999999999999997E-3 Net interest margin Net interest margin 5.9042361671899191E-2 6.2014715303038224E-2 6.453943023929222E-2 7.1999999999999995E-2 6.1100000000000002E-2 Net noninterest expense to average assets * Net non-interest expense to average assets (1)(2) 3.6082516141338401E-2 3.9624798740137912E-2 4.0433937534310162E-2 3.9462048685496381E-2 4.1789719506004235E-2 Efficiency ratio * Efficiency ratio (1)(2) 0.73090644339279209 0.75401320298690522 0.73847093921857587 0.66753926701570676 0.79703075291622483 Asset Quality(3) Nonperforming assets to total assets Non-performing assets to total assets 1.7213583403197664E-2 1.0957032577648252E-2 1.1220598179390419E-2 1.2602609499110353E-2 1.6153745507532544E-2 ALLL to total loans ALLL to total loans 9.7067039106145253E-3 9.7276460366054248E-3 9.7392982879454248E-3 9.943791810209086E-3 9.1809152441158504E-3 Net charge-offs to average loans Net charge-offs to average loans -30182177994908184.03018217799% 13057887722384251.130578877223843% 71247937672647485.712479376726475% 33566027134224565.335660271342246% 20474771432625838.204747714326258% Capital(4) Tier 1 capital to average assets Tier 1 capital to average assets 0.16239999999999999 0.16560370302429414 0.16867377990679888 0.1701 0.17349999999999999 Tier 1 capital to risk-weighted assets Tier 1 capital to risk-weighted assets 0.18790000000000001 0.18229999999999999 0.19339328651541973 0.19159999999999999 0.2072 Common equity tier 1 capital to risk-weighted assets Common equity tier 1 capital to risk-weighted assets 0.16619999999999999 0.1623 0.17179944765737226 0.16980000000000001 0.18329999999999999 Total capital to risk-weighted assets Total capital to risk-weighted assets 0.19650000000000001 0.19109999999999999 0.20211485520698524 0.20039999999999999 0.21510000000000001 Per Share Amounts Book value per share Book value per share $14.67453038155141 $14.335077008802211 $14.089352740942495 $13.731660106450438 $13.523387113206448 Tangible book value per share Tangible book value per share (1) $13.18259962866262 $12.789177744724778 $12.482080266087628 $12.05914015918788 $11.84161792195515 Basic earnings per share Basic earnings per common share $0.27006809871285342 $0.24301653264314707 $0.32358998408211775 $0.25165614009452675 $0.78210059780543084 Diluted earnings per share Diluted earnings per common share $0.26759971928577253 $0.24072139059966988 $0.3189070282330756 $0.2502109749029191 $0.76209749052058484 Adjusted diluted earnings per share Adjusted diluted earnings per common share(2) $0.26761170897994113 $0.19 $0.22466051083467745 $0.25019893257062986 $0.13767220909800676 Net noninterest expense to average assets Unadjusted Net noninterest expense to average assets (1) 3.6082516141338401E-2 3.742732692185357E-2 3.6104231415205072E-2 3.9462048685496381E-2 1.1534553084965307E-2
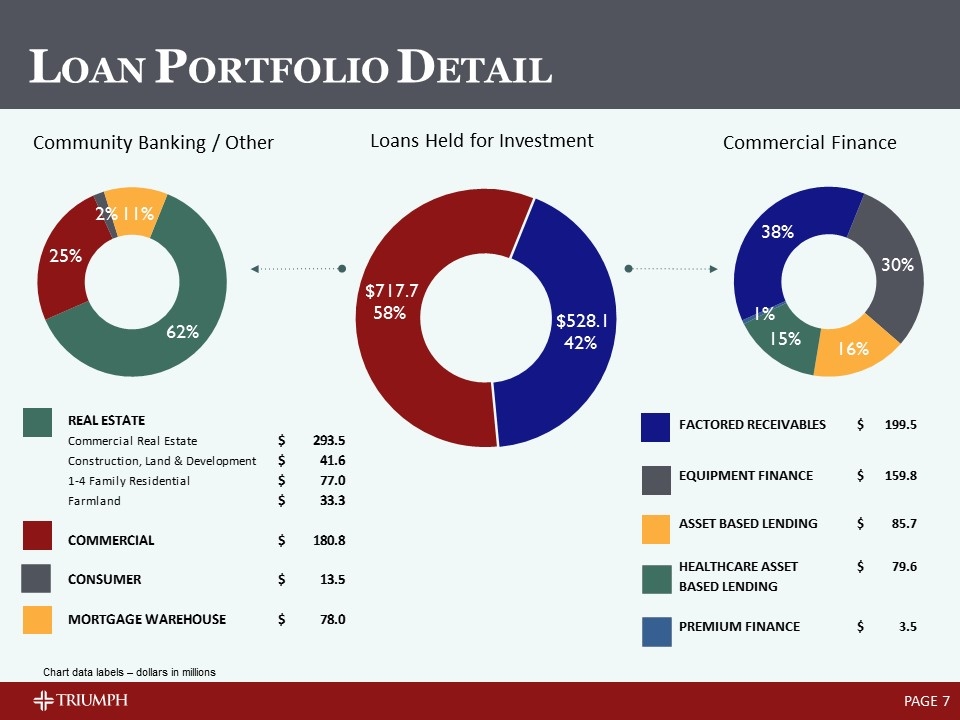
PAGE LOAN PORTFOLIO DETAIL Community Banking / Other Commercial Finance Loans Held for Investment Chart data labels – dollars in millions 42094 42185 42277 42369 42460 Q1 2015 Q2 2015 Q3 2015 Q4 2015 Q4 2015 Community Banking 625.63800000000003 685.02599999999995 687.54200000000003 770.9 717.72799999999995 Equipment 118.273 138.018 143.483 148.95099999999999 159.755 0.30250212076226257 Commercial Finance: Asset based lending (General) 36.511000000000003 64.835999999999999 85.641000000000005 75.134 85.739000000000004 0.16235003181143395 Asset based lending (Healthcare) 59.572000000000003 65.082999999999998 66.831999999999994 80.2 79.58 0.15068773290514134 Premium Finance 0 0 0 1.6120000000000001 3.5059999999999998 6.63874329687642E-3 Factored receivables 171.452 199.71600000000001 201.803 215.08799999999999 199.53200000000001 0.37782137122428583 Q4 2015 Commercial Finance Products $528.11199999999997 Community Banking $717.72799999999995 Real Estate & Farmland $445.33000000000004 Commercial Real Estate $293.48500000000001 Commercial $180.85300000000001 Construction, Land Development, Land $41.622 Consumer $13.53 1-4 Family Residential Properties $76.972999999999999 Mortgage Warehouse $78.015000000000001 Farmland $33.25 Commercial $180.85300000000001 Consumer $13.53 Community Banking Mortgage Warehouse $78.015000000000001 REAL ESTATE Commercial Real Estate $293.48500000000001 Construction, Land & Development $41.622 1-4 Family Residential $76.972999999999999 Farmland $33.25 0.62047182219448049 COMMERCIAL $180.85300000000001 0.25197985866512107 CONSUMER $13.53 *Rounded 1.8851152525747917E-2 MORTGAGE WAREHOUSE $78.015000000000001 0.10869716661465069 FACTORED RECEIVABLES $199.53200000000001 EQUIPMENT FINANCE $159.755 ASSET BASED LENDING $85.739000000000004 HEALTHCARE ASSET $79.58 BASED LENDING PREMIUM FINANCE $3.5059999999999998 42094 42185 42277 42369 42460 Q1 2015 Q2 2015 Q3 2015 Q4 2015 Q4 2015 Community Banking 625.63800000000003 685.02599999999995 687.54200000000003 770.9 717.72799999999995 Equipment 118.273 138.018 143.483 148.95099999999999 159.755 0.30250212076226257 Commercial Finance: Asset based lending (General) 36.511000000000003 64.835999999999999 85.641000000000005 75.134 85.739000000000004 0.16235003181143395 Asset based lending (Healthcare) 59.572000000000003 65.082999999999998 66.831999999999994 80.2 79.58 0.15068773290514134 Premium Finance 0 0 0 1.6120000000000001 3.5059999999999998 6.63874329687642E-3 Factored receivables 171.452 199.71600000000001 201.803 215.08799999999999 199.53200000000001 0.37782137122428583 Q4 2015 Commercial Finance Products $528.11199999999997 Community Banking $717.72799999999995 Real Estate & Farmland $445.33000000000004 Commercial Real Estate $293.48500000000001 Commercial $180.85300000000001 Construction, Land Development, Land $41.622 Consumer $13.53 1-4 Family Residential Properties $76.972999999999999 Mortgage Warehouse $78.015000000000001 Farmland $33.25 Commercial $180.85300000000001 Consumer $13.53 Community Banking Mortgage Warehouse $78.015000000000001 REAL ESTATE Commercial Real Estate $293.48500000000001 Construction, Land & Development $41.622 1-4 Family Residential $76.972999999999999 Farmland $33.25 0.62047182219448049 COMMERCIAL $180.75300000000001 *Rounded 0.25184053011725893 CONSUMER $13.53 1.8851152525747917E-2 MORTGAGE WAREHOUSE $78.015000000000001 0.10869716661465069 FACTORED RECEIVABLES $199.53200000000001 EQUIPMENT FINANCE $159.755 ASSET BASED LENDING $85.739000000000004 HEALTHCARE ASSET $79.58 BASED LENDING PREMIUM FINANCE $3.5059999999999998
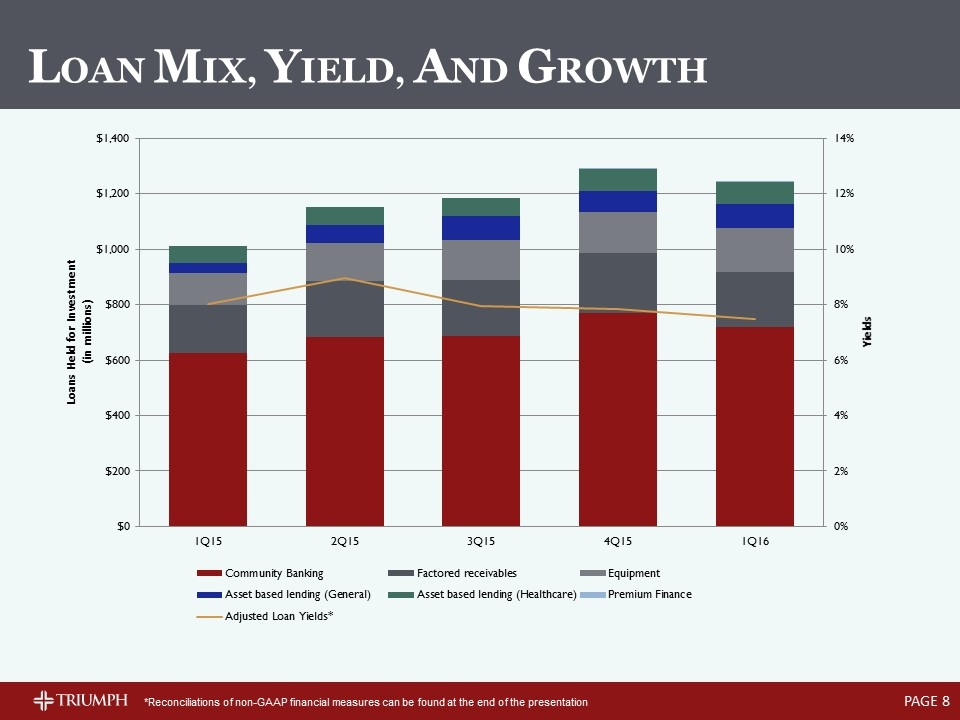
PAGE LOAN MIX, YIELD, AND GROWTH *Reconciliations of non-GAAP financial measures can be found at the end of the presentation
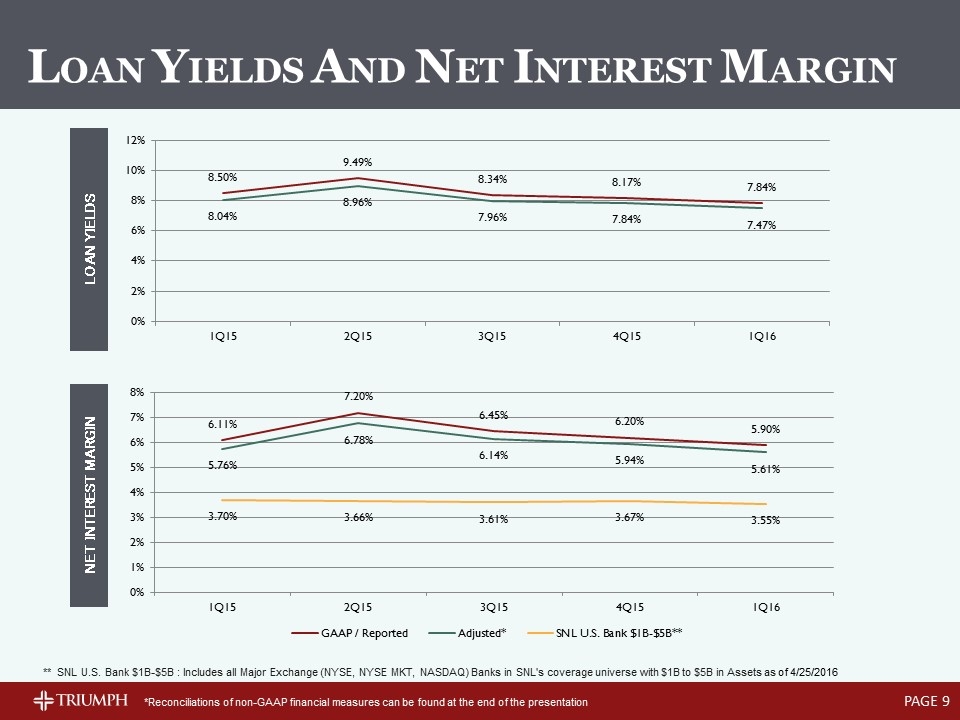
PAGE Loan Yields Net Interest Margin LOAN YIELDS AND NET INTEREST MARGIN *Reconciliations of non-GAAP financial measures can be found at the end of the presentation ** SNL U.S. Bank $1B-$5B : Includes all Major Exchange (NYSE, NYSE MKT, NASDAQ) Banks in SNL's coverage universe with $1B to $5B in Assets as of 4/25/2016
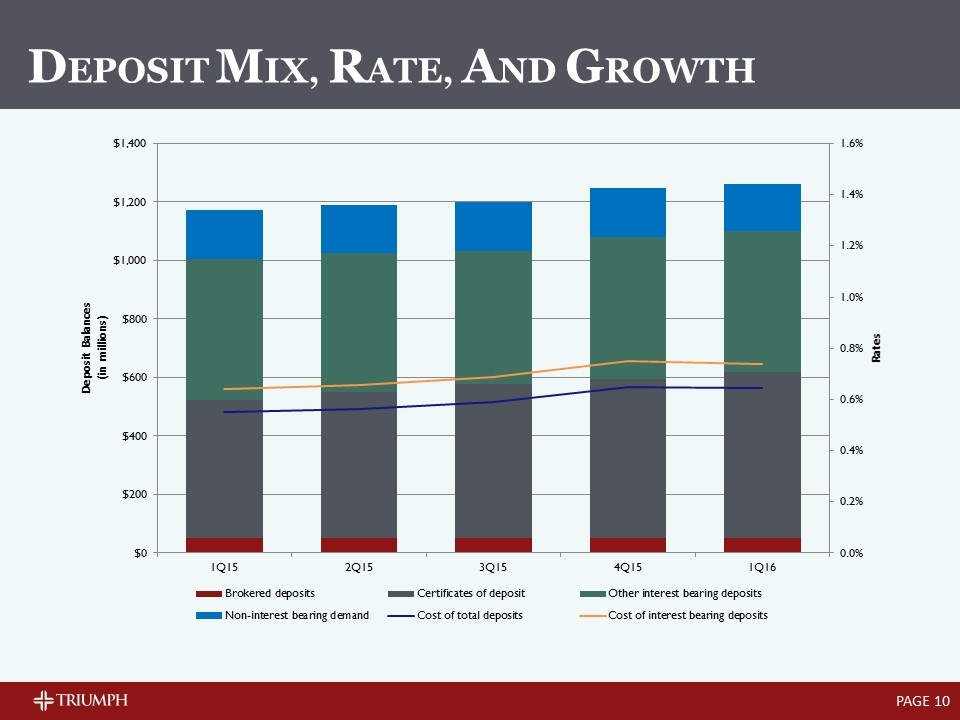
PAGE DEPOSIT MIX, RATE, AND GROWTH
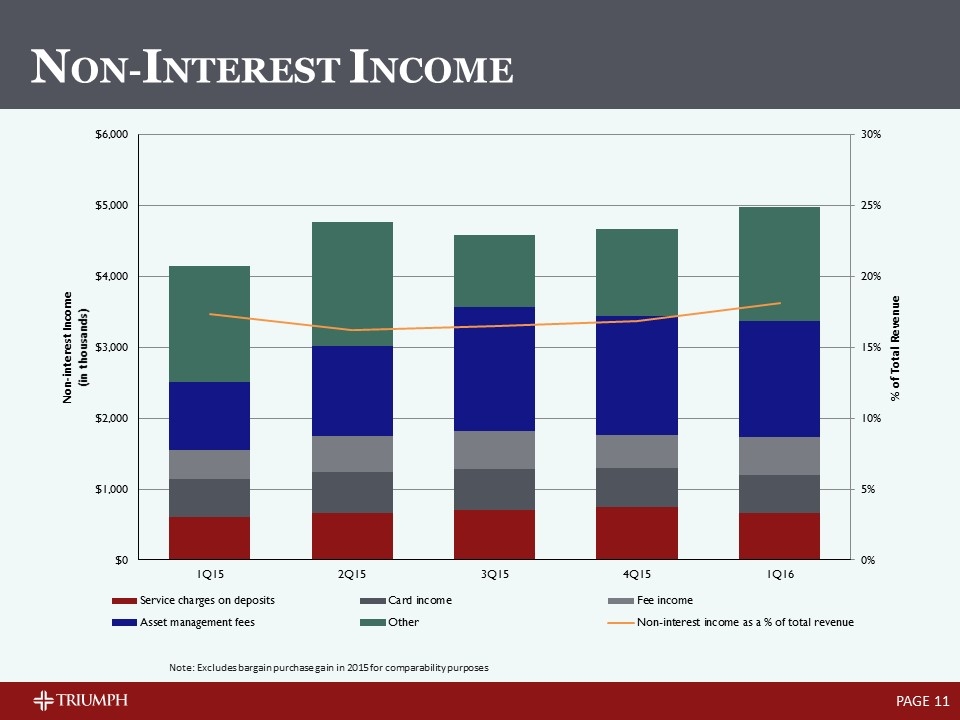
PAGE Note: Excludes bargain purchase gain in 2015 for comparability purposes NON-INTEREST INCOME
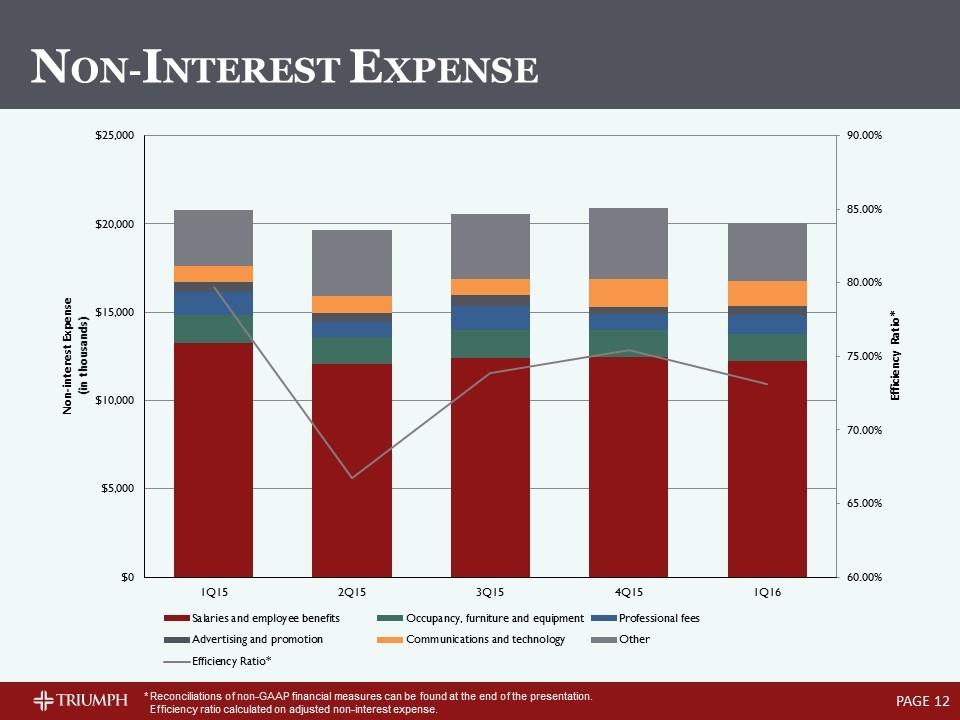
PAGE NON-INTEREST EXPENSE *Reconciliations of non-GAAP financial measures can be found at the end of the presentation. Efficiency ratio calculated on adjusted non-interest expense.
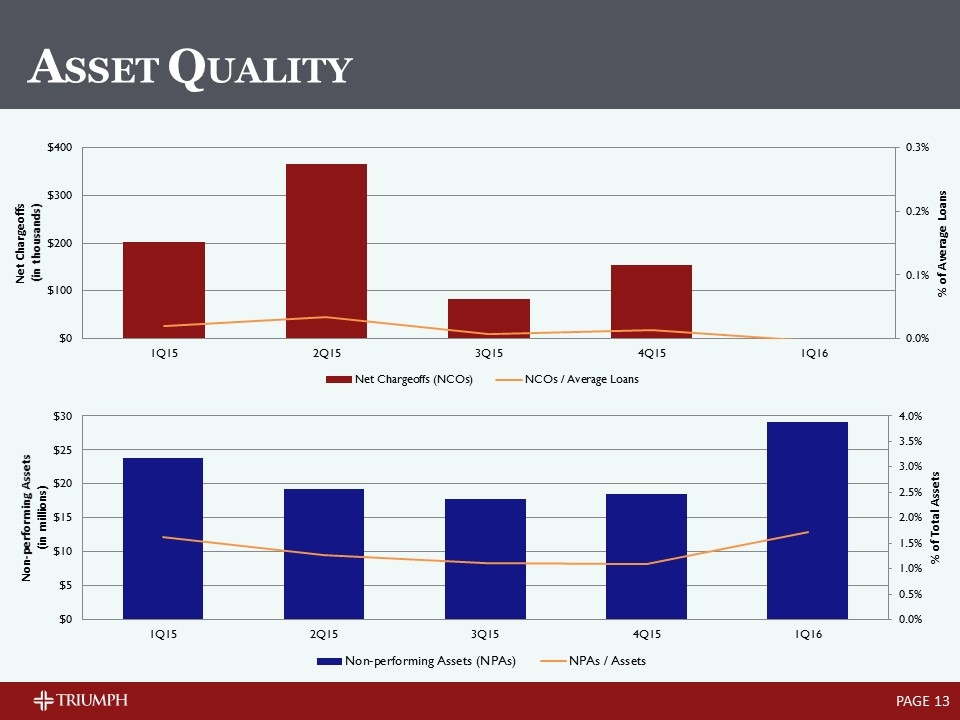
PAGE ASSET QUALITY
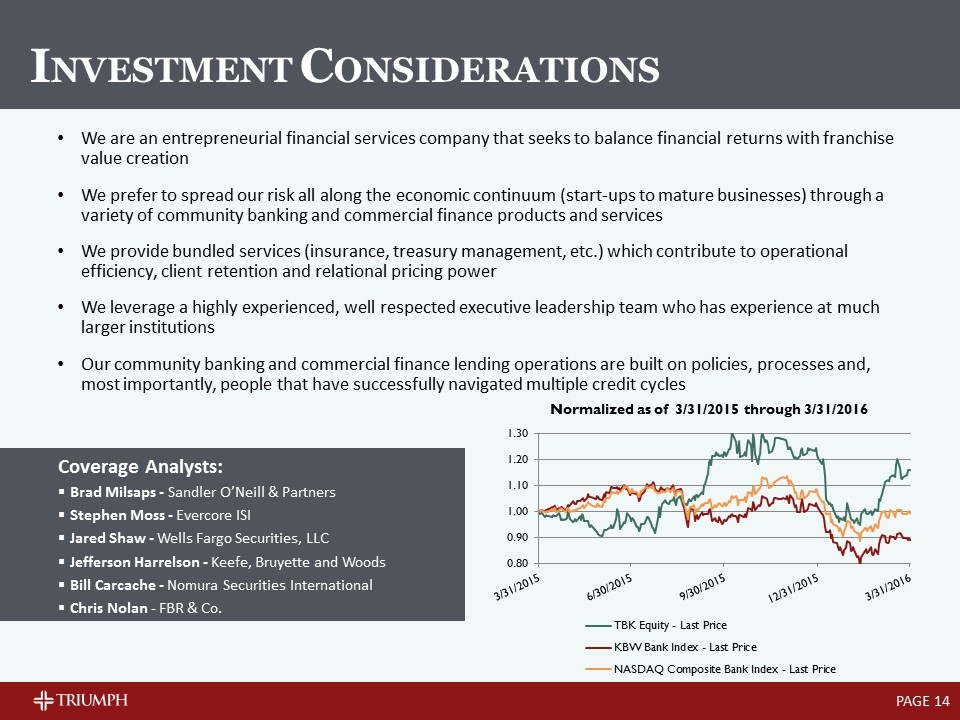
PAGE INVESTMENT CONSIDERATIONS We are an entrepreneurial financial services company that seeks to balance financial returns with franchise value creation We prefer to spread our risk all along the economic continuum (start-ups to mature businesses) through a variety of community banking and commercial finance products and services We provide bundled services (insurance, treasury management, etc.) which contribute to operational efficiency, client retention and relational pricing power We leverage a highly experienced, well respected executive leadership team who has experience at much larger institutions Our community banking and commercial finance lending operations are built on policies, processes and, most importantly, people that have successfully navigated multiple credit cycles Coverage Analysts: Brad Milsaps - Sandler O’Neill & Partners Stephen Moss - Evercore ISI Jared Shaw - Wells Fargo Securities, LLC Jefferson Harrelson - Keefe, Bruyette and Woods Bill Carcache - Nomura Securities International Chris Nolan - FBR & Co.

APPENDIX
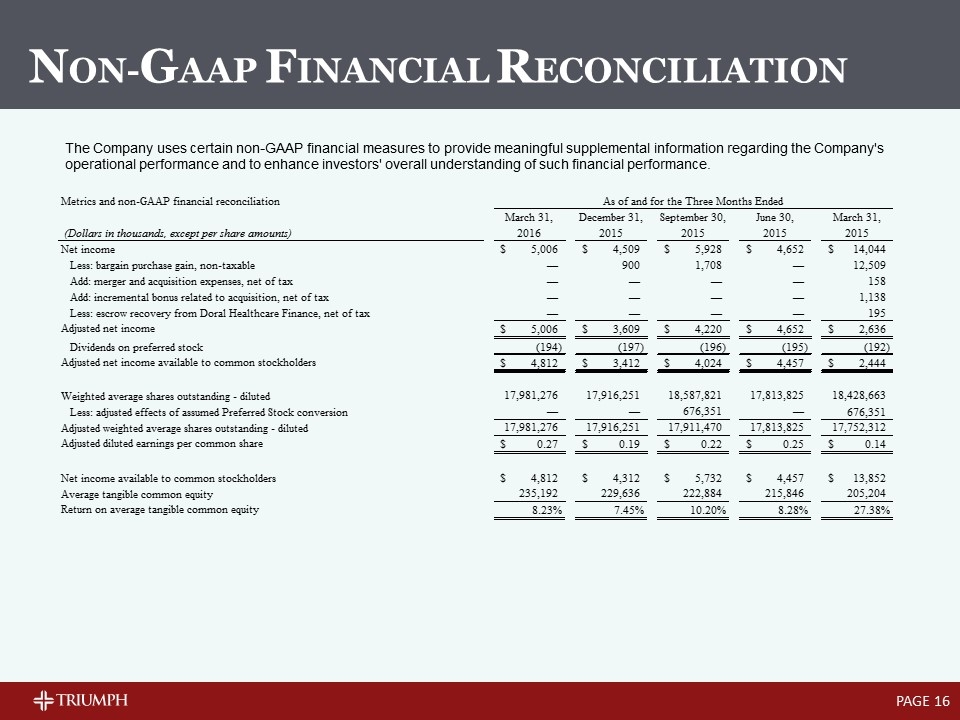
PAGE NON-GAAP FINANCIAL RECONCILIATION The Company uses certain non-GAAP financial measures to provide meaningful supplemental information regarding the Company's operational performance and to enhance investors' overall understanding of such financial performance. 42460QTD 42185QTD 42094QTD 42094QTD 42004QTD 42460 42277 42185 42094 42004 366 365 365 365 365 91 92 91 90 92 As of and for the Three Months Ended March 31, December 31, September 30, June 30, March 31, (Dollars in thousands, except per share amounts) 2016 2015 2015 2015 2015 Net income $5,006 $4,509 $5,928 $4,652 $14,044 6306999 Less: bargain purchase gain, non-taxable 0 900 1,708 0 12,509 Manual Adj Add: merger and acquisition expenses, net of tax 0 0 0 0 158 Manual Adj Add: incremental bonus related to acquisition, net of tax 0 0 0 0 1,138 Manual Adj Less: escrow recovery from Doral Healthcare Finance, net of tax 0 0 0 0 195 Adjusted net income $5,006 $3,609 $4,220 $4,652 $2,636 Dividends on preferred stock -,194 -,197 -,196 -,195 -,192 Adjusted net income available to common stockholders $4,812 $3,412 $4,024 $4,457 $2,444 Diluted_Shrs Weighted average shares outstanding - diluted 17,981,276 17,916,251.228260871 18,587,821 17,813,825 18,428,662.93 Manual Adj Less: adjusted effects of assumed Preferred Stock conversion 0 0 ,676,351 0 ,676,351 Adjusted weighted average shares outstanding - diluted 17,981,276 17,916,251.228260871 17,911,470 17,813,825 17,752,311.93 Adjusted diluted earnings per common share $0.26761170897994113 $0.19044162512177512 $0.22466051083467745 $0.25019893257062986 $0.13767220909800676 Net income available to common stockholders $4,812 $4,312 $5,732 $4,457 $13,852 AvgTangEq Average tangible common equity ,235,191.51529098698 ,229,635.61567069197 ,222,884.39175000001 ,215,845.60004000002 ,205,203.77705 Return on average tangible common equity 8.2289355624981242E-2 7.4497987842097685E-2 0.1020308635251115 8.2822990223868825E-2 0.27376472481725966 Efficiency ratio: Net interest income $22,489 $23,050 $23,231 $24,645 $19,725 Non-interest income 4,981 5,571 6,298 4,769 16,659 Operating revenue 27,470 28,621 29,529 29,414 36,384 6306999 Less: bargain purchase gain 0 900 1,708 0 12,509 Manual Adj Less: escrow recovery from Doral Healthcare Finance 0 0 0 0 300 Adjusted operating revenue $27,470 $27,721 $27,821 $29,414 $23,575 Total non-interest expenses $20,078 $20,902 $20,545 $19,635 $20,783 Acq Costs Less: merger and acquisition expenses 0 0 0 0 242.98099999999999 Less: incremental bonus related to acquisition 0 0 0 0 1,750 Manual Adj Adjusted non-interest expenses $20,078 $20,902 $20,545 $19,635 $18,790.19 Efficiency ratio 0.73090644339279209 0.75401320298690522 0.73847093921857587 0.66753926701570676 0.79703155885471899 Net non-interest expense to average assets ratio: Total non-interest expenses $20,078 $20,902 $20,545 $19,635 $20,783 Acq Costs Less: merger and acquisition expenses 0 0 0 0 243 Manual Adj Less: incremental bonus related to acquisition 0 0 0 0 1,750 Adjusted non-interest expense $20,078 $20,902 $20,545 $19,635 $18,790 Total non-interest income $4,981 $5,571 $6,298 $4,769 $16,659 Less: bargain purchase gain 0 900 1,708 0 12,509 Manual Adj Less: escrow recovery from Doral Healthcare Finance 0 0 0 0 300 Adjusted non-interest income $4,981 $4,671 $4,590 $4,769 $3,850 Adjusted net non-interest expenses $15,097 $16,231 $15,955 $14,866 $14,940 AvgAssets Average total assets $1,682,640.3261250083 $1,624,890.9971008352 $1,565,697.7617899999 $1,511,045.2271500002 $1,449,791 Net non-interest expense to average assets ratio 3.6086025786411083E-2 3.9630183425081428E-2 4.0429085233219919E-2 3.9461004585432884E-2 4.1792230742224219E-2 As of and for the Three Months Ended March 31, December 31, September 30, June 30, March 31, (Dollars in thousands, except per share amounts) 2016 2015 2015 2015 2015 Reported yield on loans 7.84% 8.17% 8.339305667637392% 9.494499003592306% 8.500000000000001% DisAcrLYLD Effect of accretion income on acquired loans -0.37% -0.326781499036891% -0.379776514834469% -0.5343431197411% -0.46% Adjusted yield on loans 7.4673496519255061E-2 7.8432185009631089E-2 7.959529152802923E-2 8.9601558838512063E-2 8.0399999999999999E-2 Reported net interest margin 5.904236167189919% 6.201471530303822% 6.453943023929222% 7.2% 6.11% DisAcrLNIM Effect of accretion income on acquired loans -0.29% -0.26% -0.31% -0.42% -0.35% Adjusted net interest margin 5.6056483316736079E-2 5.941208443951064E-2 6.1436271756382291E-2 6.7780562435600544E-2 5.7599999999999998E-2 Total stockholders' equity $,274,114 $,268,038 $,263,919 $,257,479 $,252,677 3100799 3100899 Less: Preferred stock liquidation preference 9,746 9,746 9,746 9,746 9,746 Total common stockholders' equity ,264,368 ,258,292 ,254,173 ,247,733 ,242,931 Less: Goodwill and other intangibles 26,877 27,854 28,995 30,174 30,211 Tangible common stockholders' equity $,237,491 $,230,438 $,225,178 $,217,559 $,212,720 Shares outstanding end of period Common shares outstanding 18,015,423 18,018,200 18,040,072 18,041,072 17,963,783 Tangible book value per share $13.182649111264276 $12.789179829283725 $12.482100958355376 $12.059094936265428 $11.841603742374309 Total assets at end of period $1,687,795 $1,691,313 $1,581,463 $1,529,259 $1,472,743 Less: Goodwill and other intangibles 26,877 27,854 28,995 30,174 30,211 Adjusted total assets at period end $1,660,918 $1,663,459 $1,552,468 $1,499,085 $1,442,532 Tangible common stockholders' equity ratio 0.14298779349733098 0.13852941370962554 0.14504517967520103 0.14512786132874386 0.14746293323129053 Slide Deck Presentation: Metrics and non-GAAP financial reconciliation As of and for the Three Months Ended March 31, December 31, September 30, June 30, March 31, (Dollars in thousands, except per share amounts) 2016 2015 2015 2015 2015 Net income $5,006 $4,509 $5,928 $4,652 $14,044 Less: bargain purchase gain, non-taxable 0 900 1,708 0 12,509 Add: merger and acquisition expenses, net of tax 0 0 0 0 158 Add: incremental bonus related to acquisition, net of tax 0 0 0 0 1,138 Less: escrow recovery from Doral Healthcare Finance, net of tax 0 0 0 0 195 Adjusted net income $5,006 $3,609 $4,220 $4,652 $2,636 Dividends on preferred stock -,194 -,197 -,196 -,195 -,192 Adjusted net income available to common stockholders $4,812 $3,412 $4,024 $4,457 $2,444 Weighted average shares outstanding - diluted 17,981,276 17,916,251.228260871 18,587,821 17,813,825 18,428,662.93 Less: adjusted effects of assumed Preferred Stock conversion 0 0 ,676,351 0 ,676,351 Adjusted weighted average shares outstanding - diluted 17,981,276 17,916,251.228260871 17,911,470 17,813,825 17,752,311.93 Adjusted diluted earnings per common share $0.26761170897994113 $0.19044162512177512 $0.22466051083467745 $0.25019893257062986 $0.13767220909800676 Net income available to common stockholders $4,812 $4,312 $5,732 $4,457 $13,852 Average tangible common equity ,235,191.51529098698 ,229,635.61567069197 ,222,884.39175000001 ,215,845.60004000002 ,205,203.77705 Return on average tangible common equity 8.2289355624981242E-2 7.4497987842097685E-2 0.1020308635251115 8.2822990223868825E-2 0.27376472481725966 Metrics and non-GAAP financial reconciliation (cont'd) As of and for the Three Months Ended March 31, December 31, September 30, June 30, March 31, (Dollars in thousands, except per share amounts) 2016 2015 2015 2015 2015 Efficiency ratio: Net interest income $22,489 $23,050 $23,231 $24,645 $19,725 Non-interest income 4,981 5,571 6,298 4,769 16,659 Operating revenue 27,470 28,621 29,529 29,414 36,384 Less: bargain purchase gain 0 900 1,708 0 12,509 Less: escrow recovery from Doral Healthcare Finance 0 0 0 0 300 Adjusted operating revenue $27,470 $27,721 $27,821 $29,414 $23,575 Total non-interest expenses $20,078 $20,902 $20,545 $19,635 $20,783 Less: merger and acquisition expenses 0 0 0 0 242.98099999999999 Less: incremental bonus related to acquisition 0 0 0 0 1,750 Adjusted non-interest expenses $20,078 $20,902 $20,545 $19,635 $18,790.19 Efficiency ratio 0.73090644339279209 0.75401320298690522 0.73847093921857587 0.66753926701570676 0.79703155885471899 Net non-interest expense to average assets ratio: Total non-interest expenses $20,078 $20,902 $20,545 $19,635 $20,783 Less: merger and acquisition expenses 0 0 0 0 243 Less: incremental bonus related to acquisition 0 0 0 0 1,750 Adjusted non-interest expense $20,078 $20,902 $20,545 $19,635 $18,790 Total non-interest income $4,981 $5,571 $6,298 $4,769 $16,659 Less: bargain purchase gain 0 900 1,708 0 12,509 Less: escrow recovery from Doral Healthcare Finance 0 0 0 0 300 Adjusted non-interest income $4,981 $4,671 $4,590 $4,769 $3,850 Adjusted net non-interest expenses $15,097 $16,231 $15,955 $14,866 $14,940 Average total assets 1,682,640.3261250083 1,624,890.9971008352 1,565,697.7617899999 1,511,045.2271500002 1,449,791 Net non-interest expense to average assets ratio 3.6086025786411083E-2 3.9630183425081428E-2 4.0429085233219919E-2 3.9461004585432884E-2 4.1792230742224219E-2 Metrics and non-GAAP financial reconciliation (cont'd) As of and for the Three Months Ended March 31, December 31, September 30, June 30, March 31, (Dollars in thousands, except per share amounts) 2016 2015 2015 2015 2015 Reported yield on loans 7.84% 8.17% 8.339305667637392% 9.494499003592306% 8.500000000000001% Effect of accretion income on acquired loans -0.37% -0.326781499036891% -0.379776514834469% -0.5343431197411% -0.46% Adjusted yield on loans 7.4673496519255061E-2 7.8432185009631089E-2 7.959529152802923E-2 8.9601558838512063E-2 8.0399999999999999E-2 Reported net interest margin 5.904236167189919% 6.201471530303822% 6.453943023929222% 7.2% 6.11% Effect of accretion income on acquired loans -0.29% -0.26% -0.31% -0.42% -0.35% Adjusted net interest margin 5.6056483316736079E-2 5.941208443951064E-2 6.1436271756382291E-2 6.7780562435600544E-2 5.7599999999999998E-2 Total stockholders' equity $,274,114 $,268,038 $,263,919 $,257,479 $,252,677 Less: Preferred stock liquidation preference 9,746 9,746 9,746 9,746 9,746 Total common stockholders' equity ,264,368 ,258,292 ,254,173 ,247,733 ,242,931 Less: Goodwill and other intangibles 26,877 27,854 28,995 30,174 30,211 Tangible common stockholders' equity $,237,491 $,230,438 $,225,178 $,217,559 $,212,720 Common shares outstanding at end of period 18,015,423 18,018,200 18,040,072 18,041,072 17,963,783 Tangible book value per share $13.182649111264276 $12.789179829283725 $12.482100958355376 $12.059094936265428 $11.841603742374309 Total assets at end of period $1,687,795 $1,691,313 $1,581,463 $1,529,259 $1,472,743 Less: Goodwill and other intangibles 26,877 27,854 28,995 30,174 30,211 Adjusted total assets at period end $1,660,918 $1,663,459 $1,552,468 $1,499,085 $1,442,532 Tangible common stockholders' equity ratio 0.14298779349733098 0.13852941370962554 0.14504517967520103 0.14512786132874386 0.14746293323129053
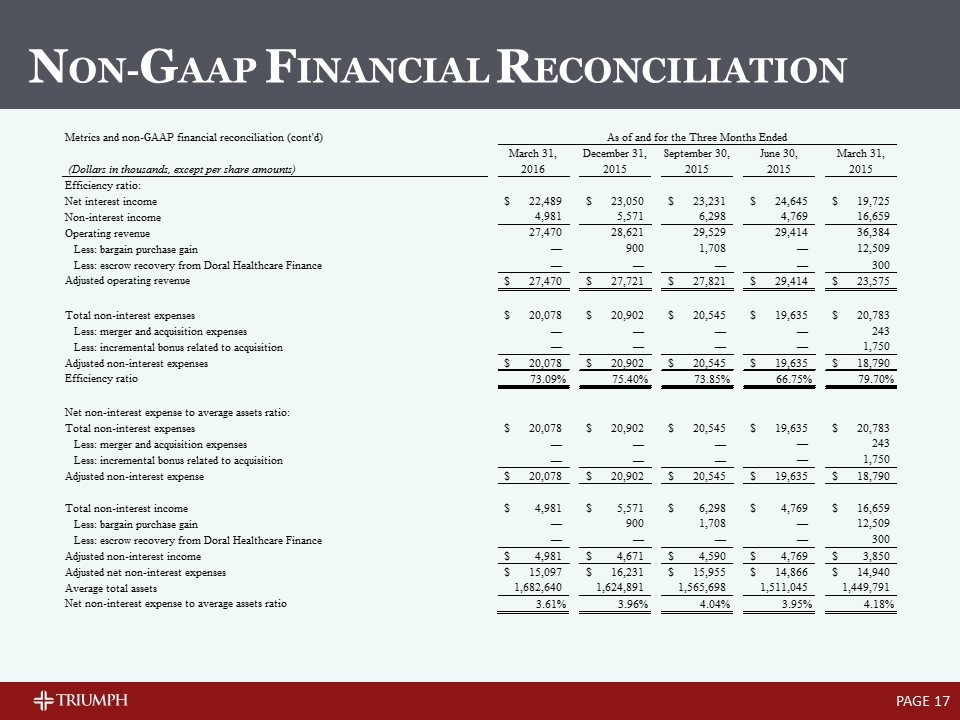
PAGE NON-GAAP FINANCIAL RECONCILIATION 42460QTD 42185QTD 42094QTD 42094QTD 42004QTD 42460 42277 42185 42094 42004 366 365 365 365 365 91 92 91 90 92 As of and for the Three Months Ended March 31, December 31, September 30, June 30, March 31, (Dollars in thousands, except per share amounts) 2016 2015 2015 2015 2015 Net income $5,006 $4,509 $5,928 $4,652 $14,044 6306999 Less: bargain purchase gain, non-taxable 0 900 1,708 0 12,509 Manual Adj Add: merger and acquisition expenses, net of tax 0 0 0 0 158 Manual Adj Add: incremental bonus related to acquisition, net of tax 0 0 0 0 1,138 Manual Adj Less: escrow recovery from Doral Healthcare Finance, net of tax 0 0 0 0 195 Adjusted net income $5,006 $3,609 $4,220 $4,652 $2,636 Dividends on preferred stock -,194 -,197 -,196 -,195 -,192 Adjusted net income available to common stockholders $4,812 $3,412 $4,024 $4,457 $2,444 Diluted_Shrs Weighted average shares outstanding - diluted 17,981,276 17,916,251.228260871 18,587,821 17,813,825 18,428,662.93 Manual Adj Less: adjusted effects of assumed Preferred Stock conversion 0 0 ,676,351 0 ,676,351 Adjusted weighted average shares outstanding - diluted 17,981,276 17,916,251.228260871 17,911,470 17,813,825 17,752,311.93 Adjusted diluted earnings per common share $0.26761170897994113 $0.19044162512177512 $0.22466051083467745 $0.25019893257062986 $0.13767220909800676 Net income available to common stockholders $4,812 $4,312 $5,732 $4,457 $13,852 AvgTangEq Average tangible common equity ,235,191.51529098698 ,229,635.61567069197 ,222,884.39175000001 ,215,845.60004000002 ,205,203.77705 Return on average tangible common equity 8.2064521319994962E-2 7.4497987842097685E-2 0.1020308635251115 8.2822990223868825E-2 0.27376472481725966 Efficiency ratio: Net interest income $22,489 $23,050 $23,231 $24,645 $19,725 Non-interest income 4,981 5,571 6,298 4,769 16,659 Operating revenue 27,470 28,621 29,529 29,414 36,384 6306999 Less: bargain purchase gain 0 900 1,708 0 12,509 Manual Adj Less: escrow recovery from Doral Healthcare Finance 0 0 0 0 300 Adjusted operating revenue $27,470 $27,721 $27,821 $29,414 $23,575 Total non-interest expenses $20,078 $20,902 $20,545 $19,635 $20,783 Acq Costs Less: merger and acquisition expenses 0 0 0 0 242.98099999999999 Less: incremental bonus related to acquisition 0 0 0 0 1,750 Manual Adj Adjusted non-interest expenses $20,078 $20,902 $20,545 $19,635 $18,790.19 Efficiency ratio 0.73090644339279209 0.75401320298690522 0.73847093921857587 0.66753926701570676 0.79703155885471899 Net non-interest expense to average assets ratio: Total non-interest expenses $20,078 $20,902 $20,545 $19,635 $20,783 Acq Costs Less: merger and acquisition expenses 0 0 0 0 243 Manual Adj Less: incremental bonus related to acquisition 0 0 0 0 1,750 Adjusted non-interest expense $20,078 $20,902 $20,545 $19,635 $18,790 Total non-interest income $4,981 $5,571 $6,298 $4,769 $16,659 Less: bargain purchase gain 0 900 1,708 0 12,509 Manual Adj Less: escrow recovery from Doral Healthcare Finance 0 0 0 0 300 Adjusted non-interest income $4,981 $4,671 $4,590 $4,769 $3,850 Adjusted net non-interest expenses $15,097 $16,231 $15,955 $14,866 $14,940 AvgAssets Average total assets $1,682,640.3261250083 $1,624,890.9971008352 $1,565,697.7617899999 $1,511,045.2271500002 $1,449,791 Net non-interest expense to average assets ratio 3.6086025786411083E-2 3.9630183425081428E-2 4.0429085233219919E-2 3.9461004585432884E-2 4.1792230742224219E-2 As of and for the Three Months Ended March 31, December 31, September 30, June 30, March 31, (Dollars in thousands, except per share amounts) 2016 2015 2015 2015 2015 Reported yield on loans 7.84% 8.17% 8.339305667637392% 9.494499003592306% 8.500000000000001% DisAcrLYLD Effect of accretion income on acquired loans -0.37% -0.326781499036891% -0.379776514834469% -0.5343431197411% -0.46% Adjusted yield on loans 7.4673496519255061E-2 7.8432185009631089E-2 7.959529152802923E-2 8.9601558838512063E-2 8.0399999999999999E-2 Reported net interest margin 5.904236167189919% 6.201471530303822% 6.453943023929222% 7.2% 6.11% DisAcrLNIM Effect of accretion income on acquired loans -0.29% -0.26% -0.31% -0.42% -0.35% Adjusted net interest margin 5.6056483316736079E-2 5.941208443951064E-2 6.1436271756382291E-2 6.7780562435600544E-2 5.7599999999999998E-2 Total stockholders' equity $,274,114 $,268,038 $,263,919 $,257,479 $,252,677 3100799 3100899 Less: Preferred stock liquidation preference 9,746 9,746 9,746 9,746 9,746 Total common stockholders' equity ,264,368 ,258,292 ,254,173 ,247,733 ,242,931 Less: Goodwill and other intangibles 26,877 27,854 28,995 30,174 30,211 Tangible common stockholders' equity $,237,491 $,230,438 $,225,178 $,217,559 $,212,720 Shares outstanding end of period Common shares outstanding 18,015,423 18,018,200 18,040,072 18,041,072 17,963,783 Tangible book value per share $13.182649111264276 $12.789179829283725 $12.482100958355376 $12.059094936265428 $11.841603742374309 Total assets at end of period $1,687,795 $1,691,313 $1,581,463 $1,529,259 $1,472,743 Less: Goodwill and other intangibles 26,877 27,854 28,995 30,174 30,211 Adjusted total assets at period end $1,660,918 $1,663,459 $1,552,468 $1,499,085 $1,442,532 Tangible common stockholders' equity ratio 0.14298779349733098 0.13852941370962554 0.14504517967520103 0.14512786132874386 0.14746293323129053 Slide Deck Presentation: Metrics and non-GAAP financial reconciliation As of and for the Three Months Ended March 31, December 31, September 30, June 30, March 31, (Dollars in thousands, except per share amounts) 2016 2015 2015 2015 2015 Net income $5,006 $4,509 $5,928 $4,652 $14,044 Less: bargain purchase gain, non-taxable 0 900 1,708 0 12,509 Add: merger and acquisition expenses, net of tax 0 0 0 0 158 Add: incremental bonus related to acquisition, net of tax 0 0 0 0 1,138 Less: escrow recovery from Doral Healthcare Finance, net of tax 0 0 0 0 195 Adjusted net income $5,006 $3,609 $4,220 $4,652 $2,636 Dividends on preferred stock -,194 -,197 -,196 -,195 -,192 Adjusted net income available to common stockholders $4,812 $3,412 $4,024 $4,457 $2,444 Weighted average shares outstanding - diluted 17,981,276 17,916,251.228260871 18,587,821 17,813,825 18,428,662.93 Less: adjusted effects of assumed Preferred Stock conversion 0 0 ,676,351 0 ,676,351 Adjusted weighted average shares outstanding - diluted 17,981,276 17,916,251.228260871 17,911,470 17,813,825 17,752,311.93 Adjusted diluted earnings per common share $0.26761170897994113 $0.19044162512177512 $0.22466051083467745 $0.25019893257062986 $0.13767220909800676 Net income available to common stockholders $4,812 $4,312 $5,732 $4,457 $13,852 Average tangible common equity ,235,191.51529098698 ,229,635.61567069197 ,222,884.39175000001 ,215,845.60004000002 ,205,203.77705 Return on average tangible common equity 8.2064521319994962E-2 7.4497987842097685E-2 0.1020308635251115 8.2822990223868825E-2 0.27376472481725966 Metrics and non-GAAP financial reconciliation (cont'd) As of and for the Three Months Ended March 31, December 31, September 30, June 30, March 31, (Dollars in thousands, except per share amounts) 2016 2015 2015 2015 2015 Efficiency ratio: Net interest income $22,489 $23,050 $23,231 $24,645 $19,725 Non-interest income 4,981 5,571 6,298 4,769 16,659 Operating revenue 27,470 28,621 29,529 29,414 36,384 Less: bargain purchase gain 0 900 1,708 0 12,509 Less: escrow recovery from Doral Healthcare Finance 0 0 0 0 300 Adjusted operating revenue $27,470 $27,721 $27,821 $29,414 $23,575 Total non-interest expenses $20,078 $20,902 $20,545 $19,635 $20,783 Less: merger and acquisition expenses 0 0 0 0 242.98099999999999 Less: incremental bonus related to acquisition 0 0 0 0 1,750 Adjusted non-interest expenses $20,078 $20,902 $20,545 $19,635 $18,790.19 Efficiency ratio 0.73090644339279209 0.75401320298690522 0.73847093921857587 0.66753926701570676 0.79703155885471899 Net non-interest expense to average assets ratio: Total non-interest expenses $20,078 $20,902 $20,545 $19,635 $20,783 Less: merger and acquisition expenses 0 0 0 0 243 Less: incremental bonus related to acquisition 0 0 0 0 1,750 Adjusted non-interest expense $20,078 $20,902 $20,545 $19,635 $18,790 Total non-interest income $4,981 $5,571 $6,298 $4,769 $16,659 Less: bargain purchase gain 0 900 1,708 0 12,509 Less: escrow recovery from Doral Healthcare Finance 0 0 0 0 300 Adjusted non-interest income $4,981 $4,671 $4,590 $4,769 $3,850 Adjusted net non-interest expenses $15,097 $16,231 $15,955 $14,866 $14,940 Average total assets 1,682,640.3261250083 1,624,890.9971008352 1,565,697.7617899999 1,511,045.2271500002 1,449,791 Net non-interest expense to average assets ratio 3.6086025786411083E-2 3.9630183425081428E-2 4.0429085233219919E-2 3.9461004585432884E-2 4.1792230742224219E-2 Metrics and non-GAAP financial reconciliation (cont'd) As of and for the Three Months Ended March 31, December 31, September 30, June 30, March 31, (Dollars in thousands, except per share amounts) 2016 2015 2015 2015 2015 Reported yield on loans 7.84% 8.17% 8.339305667637392% 9.494499003592306% 8.500000000000001% Effect of accretion income on acquired loans -0.37% -0.326781499036891% -0.379776514834469% -0.5343431197411% -0.46% Adjusted yield on loans 7.4673496519255061E-2 7.8432185009631089E-2 7.959529152802923E-2 8.9601558838512063E-2 8.0399999999999999E-2 Reported net interest margin 5.904236167189919% 6.201471530303822% 6.453943023929222% 7.2% 6.11% Effect of accretion income on acquired loans -0.29% -0.26% -0.31% -0.42% -0.35% Adjusted net interest margin 5.6056483316736079E-2 5.941208443951064E-2 6.1436271756382291E-2 6.7780562435600544E-2 5.7599999999999998E-2 Total stockholders' equity $,274,114 $,268,038 $,263,919 $,257,479 $,252,677 Less: Preferred stock liquidation preference 9,746 9,746 9,746 9,746 9,746 Total common stockholders' equity ,264,368 ,258,292 ,254,173 ,247,733 ,242,931 Less: Goodwill and other intangibles 26,877 27,854 28,995 30,174 30,211 Tangible common stockholders' equity $,237,491 $,230,438 $,225,178 $,217,559 $,212,720 Common shares outstanding at end of period 18,015,423 18,018,200 18,040,072 18,041,072 17,963,783 Tangible book value per share $13.182649111264276 $12.789179829283725 $12.482100958355376 $12.059094936265428 $11.841603742374309 Total assets at end of period $1,687,795 $1,691,313 $1,581,463 $1,529,259 $1,472,743 Less: Goodwill and other intangibles 26,877 27,854 28,995 30,174 30,211 Adjusted total assets at period end $1,660,918 $1,663,459 $1,552,468 $1,499,085 $1,442,532 Tangible common stockholders' equity ratio 0.14298779349733098 0.13852941370962554 0.14504517967520103 0.14512786132874386 0.14746293323129053
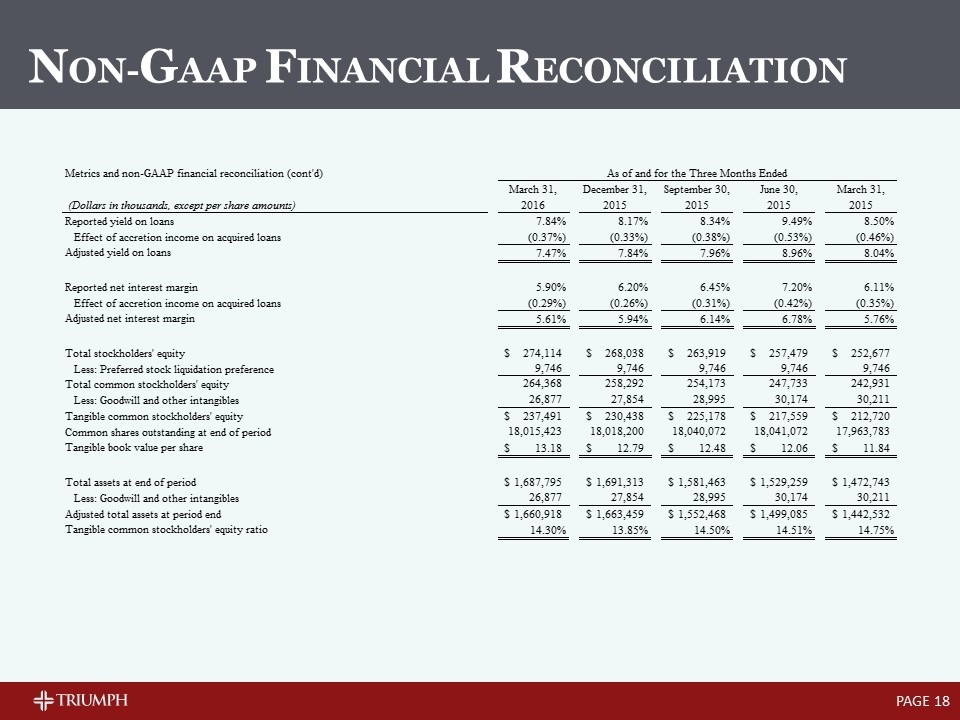
PAGE NON-GAAP FINANCIAL RECONCILIATION 42460QTD 42185QTD 42094QTD 42094QTD 42004QTD 42460 42277 42185 42094 42004 366 365 365 365 365 91 92 91 90 92 As of and for the Three Months Ended March 31, December 31, September 30, June 30, March 31, (Dollars in thousands, except per share amounts) 2016 2015 2015 2015 2015 Net income $5,006 $4,509 $5,928 $4,652 $14,044 6306999 Less: bargain purchase gain, non-taxable 0 900 1,708 0 12,509 Manual Adj Add: merger and acquisition expenses, net of tax 0 0 0 0 158 Manual Adj Add: incremental bonus related to acquisition, net of tax 0 0 0 0 1,138 Manual Adj Less: escrow recovery from Doral Healthcare Finance, net of tax 0 0 0 0 195 Adjusted net income $5,006 $3,609 $4,220 $4,652 $2,636 Dividends on preferred stock -,194 -,197 -,196 -,195 -,192 Adjusted net income available to common stockholders $4,812 $3,412 $4,024 $4,457 $2,444 Diluted_Shrs Weighted average shares outstanding - diluted 17,981,276 17,916,251.228260871 18,587,821 17,813,825 18,428,662.93 Manual Adj Less: adjusted effects of assumed Preferred Stock conversion 0 0 ,676,351 0 ,676,351 Adjusted weighted average shares outstanding - diluted 17,981,276 17,916,251.228260871 17,911,470 17,813,825 17,752,311.93 Adjusted diluted earnings per common share $0.26761170897994113 $0.19044162512177512 $0.22466051083467745 $0.25019893257062986 $0.13767220909800676 Net income available to common stockholders $4,812 $4,312 $5,732 $4,457 $13,852 AvgTangEq Average tangible common equity ,235,191.51529098698 ,229,635.61567069197 ,222,884.39175000001 ,215,845.60004000002 ,205,203.77705 Return on average tangible common equity 8.2064521319994962E-2 7.4497987842097685E-2 0.1020308635251115 8.2822990223868825E-2 0.27376472481725966 Efficiency ratio: Net interest income $22,489 $23,050 $23,231 $24,645 $19,725 Non-interest income 4,981 5,571 6,298 4,769 16,659 Operating revenue 27,470 28,621 29,529 29,414 36,384 6306999 Less: bargain purchase gain 0 900 1,708 0 12,509 Manual Adj Less: escrow recovery from Doral Healthcare Finance 0 0 0 0 300 Adjusted operating revenue $27,470 $27,721 $27,821 $29,414 $23,575 Total non-interest expenses $20,078 $20,902 $20,545 $19,635 $20,783 Acq Costs Less: merger and acquisition expenses 0 0 0 0 242.98099999999999 Less: incremental bonus related to acquisition 0 0 0 0 1,750 Manual Adj Adjusted non-interest expenses $20,078 $20,902 $20,545 $19,635 $18,790.19 Efficiency ratio 0.73090644339279209 0.75401320298690522 0.73847093921857587 0.66753926701570676 0.79703155885471899 Net non-interest expense to average assets ratio: Total non-interest expenses $20,078 $20,902 $20,545 $19,635 $20,783 Acq Costs Less: merger and acquisition expenses 0 0 0 0 243 Manual Adj Less: incremental bonus related to acquisition 0 0 0 0 1,750 Adjusted non-interest expense $20,078 $20,902 $20,545 $19,635 $18,790 Total non-interest income $4,981 $5,571 $6,298 $4,769 $16,659 Less: bargain purchase gain 0 900 1,708 0 12,509 Manual Adj Less: escrow recovery from Doral Healthcare Finance 0 0 0 0 300 Adjusted non-interest income $4,981 $4,671 $4,590 $4,769 $3,850 Adjusted net non-interest expenses $15,097 $16,231 $15,955 $14,866 $14,940 AvgAssets Average total assets $1,682,640.3261250083 $1,624,890.9971008352 $1,565,697.7617899999 $1,511,045.2271500002 $1,449,791 Net non-interest expense to average assets ratio 3.6086025786411083E-2 3.9630183425081428E-2 4.0429085233219919E-2 3.9461004585432884E-2 4.1792230742224219E-2 As of and for the Three Months Ended March 31, December 31, September 30, June 30, March 31, (Dollars in thousands, except per share amounts) 2016 2015 2015 2015 2015 Reported yield on loans 7.84% 8.17% 8.339305667637392% 9.494499003592306% 8.500000000000001% DisAcrLYLD Effect of accretion income on acquired loans -0.37% -0.326781499036891% -0.379776514834469% -0.5343431197411% -0.46% Adjusted yield on loans 7.4673496519255061E-2 7.8432185009631089E-2 7.959529152802923E-2 8.9601558838512063E-2 8.0399999999999999E-2 Reported net interest margin 5.904236167189919% 6.201471530303822% 6.453943023929222% 7.2% 6.11% DisAcrLNIM Effect of accretion income on acquired loans -0.29% -0.26% -0.31% -0.42% -0.35% Adjusted net interest margin 5.6056483316736079E-2 5.941208443951064E-2 6.1436271756382291E-2 6.7780562435600544E-2 5.7599999999999998E-2 Total stockholders' equity $,274,114 $,268,038 $,263,919 $,257,479 $,252,677 3100799 3100899 Less: Preferred stock liquidation preference 9,746 9,746 9,746 9,746 9,746 Total common stockholders' equity ,264,368 ,258,292 ,254,173 ,247,733 ,242,931 Less: Goodwill and other intangibles 26,877 27,854 28,995 30,174 30,211 Tangible common stockholders' equity $,237,491 $,230,438 $,225,178 $,217,559 $,212,720 Shares outstanding end of period Common shares outstanding 18,015,423 18,018,200 18,040,072 18,041,072 17,963,783 Tangible book value per share $13.182649111264276 $12.789179829283725 $12.482100958355376 $12.059094936265428 $11.841603742374309 Total assets at end of period $1,687,795 $1,691,313 $1,581,463 $1,529,259 $1,472,743 Less: Goodwill and other intangibles 26,877 27,854 28,995 30,174 30,211 Adjusted total assets at period end $1,660,918 $1,663,459 $1,552,468 $1,499,085 $1,442,532 Tangible common stockholders' equity ratio 0.14298779349733098 0.13852941370962554 0.14504517967520103 0.14512786132874386 0.14746293323129053 Slide Deck Presentation: Metrics and non-GAAP financial reconciliation As of and for the Three Months Ended March 31, December 31, September 30, June 30, March 31, (Dollars in thousands, except per share amounts) 2016 2015 2015 2015 2015 Net income $5,006 $4,509 $5,928 $4,652 $14,044 Less: bargain purchase gain, non-taxable 0 900 1,708 0 12,509 Add: merger and acquisition expenses, net of tax 0 0 0 0 158 Add: incremental bonus related to acquisition, net of tax 0 0 0 0 1,138 Less: escrow recovery from Doral Healthcare Finance, net of tax 0 0 0 0 195 Adjusted net income $5,006 $3,609 $4,220 $4,652 $2,636 Dividends on preferred stock -,194 -,197 -,196 -,195 -,192 Adjusted net income available to common stockholders $4,812 $3,412 $4,024 $4,457 $2,444 Weighted average shares outstanding - diluted 17,981,276 17,916,251.228260871 18,587,821 17,813,825 18,428,662.93 Less: adjusted effects of assumed Preferred Stock conversion 0 0 ,676,351 0 ,676,351 Adjusted weighted average shares outstanding - diluted 17,981,276 17,916,251.228260871 17,911,470 17,813,825 17,752,311.93 Adjusted diluted earnings per common share $0.26761170897994113 $0.19044162512177512 $0.22466051083467745 $0.25019893257062986 $0.13767220909800676 Net income available to common stockholders $4,812 $4,312 $5,732 $4,457 $13,852 Average tangible common equity ,235,191.51529098698 ,229,635.61567069197 ,222,884.39175000001 ,215,845.60004000002 ,205,203.77705 Return on average tangible common equity 8.2064521319994962E-2 7.4497987842097685E-2 0.1020308635251115 8.2822990223868825E-2 0.27376472481725966 Metrics and non-GAAP financial reconciliation (cont'd) As of and for the Three Months Ended March 31, December 31, September 30, June 30, March 31, (Dollars in thousands, except per share amounts) 2016 2015 2015 2015 2015 Efficiency ratio: Net interest income $22,489 $23,050 $23,231 $24,645 $19,725 Non-interest income 4,981 5,571 6,298 4,769 16,659 Operating revenue 27,470 28,621 29,529 29,414 36,384 Less: bargain purchase gain 0 900 1,708 0 12,509 Less: escrow recovery from Doral Healthcare Finance 0 0 0 0 300 Adjusted operating revenue $27,470 $27,721 $27,821 $29,414 $23,575 Total non-interest expenses $20,078 $20,902 $20,545 $19,635 $20,783 Less: merger and acquisition expenses 0 0 0 0 242.98099999999999 Less: incremental bonus related to acquisition 0 0 0 0 1,750 Adjusted non-interest expenses $20,078 $20,902 $20,545 $19,635 $18,790.19 Efficiency ratio 0.73090644339279209 0.75401320298690522 0.73847093921857587 0.66753926701570676 0.79703155885471899 Net non-interest expense to average assets ratio: Total non-interest expenses $20,078 $20,902 $20,545 $19,635 $20,783 Less: merger and acquisition expenses 0 0 0 0 243 Less: incremental bonus related to acquisition 0 0 0 0 1,750 Adjusted non-interest expense $20,078 $20,902 $20,545 $19,635 $18,790 Total non-interest income $4,981 $5,571 $6,298 $4,769 $16,659 Less: bargain purchase gain 0 900 1,708 0 12,509 Less: escrow recovery from Doral Healthcare Finance 0 0 0 0 300 Adjusted non-interest income $4,981 $4,671 $4,590 $4,769 $3,850 Adjusted net non-interest expenses $15,097 $16,231 $15,955 $14,866 $14,940 Average total assets 1,682,640.3261250083 1,624,890.9971008352 1,565,697.7617899999 1,511,045.2271500002 1,449,791 Net non-interest expense to average assets ratio 3.6086025786411083E-2 3.9630183425081428E-2 4.0429085233219919E-2 3.9461004585432884E-2 4.1792230742224219E-2 Metrics and non-GAAP financial reconciliation (cont'd) As of and for the Three Months Ended March 31, December 31, September 30, June 30, March 31, (Dollars in thousands, except per share amounts) 2016 2015 2015 2015 2015 Reported yield on loans 7.84% 8.17% 8.339305667637392% 9.494499003592306% 8.500000000000001% Effect of accretion income on acquired loans -0.37% -0.326781499036891% -0.379776514834469% -0.5343431197411% -0.46% Adjusted yield on loans 7.4673496519255061E-2 7.8432185009631089E-2 7.959529152802923E-2 8.9601558838512063E-2 8.0399999999999999E-2 Reported net interest margin 5.904236167189919% 6.201471530303822% 6.453943023929222% 7.2% 6.11% Effect of accretion income on acquired loans -0.29% -0.26% -0.31% -0.42% -0.35% Adjusted net interest margin 5.6056483316736079E-2 5.941208443951064E-2 6.1436271756382291E-2 6.7780562435600544E-2 5.7599999999999998E-2 Total stockholders' equity $,274,114 $,268,038 $,263,919 $,257,479 $,252,677 Less: Preferred stock liquidation preference 9,746 9,746 9,746 9,746 9,746 Total common stockholders' equity ,264,368 ,258,292 ,254,173 ,247,733 ,242,931 Less: Goodwill and other intangibles 26,877 27,854 28,995 30,174 30,211 Tangible common stockholders' equity $,237,491 $,230,438 $,225,178 $,217,559 $,212,720 Common shares outstanding at end of period 18,015,423 18,018,200 18,040,072 18,041,072 17,963,783 Tangible book value per share $13.182649111264276 $12.789179829283725 $12.482100958355376 $12.059094936265428 $11.841603742374309 Total assets at end of period $1,687,795 $1,691,313 $1,581,463 $1,529,259 $1,472,743 Less: Goodwill and other intangibles 26,877 27,854 28,995 30,174 30,211 Adjusted total assets at period end $1,660,918 $1,663,459 $1,552,468 $1,499,085 $1,442,532 Tangible common stockholders' equity ratio 0.14298779349733098 0.13852941370962554 0.14504517967520103 0.14512786132874386 0.14746293323129053
