Attached files
| file | filename |
|---|---|
| EX-31.1 - EXHIBIT 31.1 - TIMKEN CO | tkr33116exhibit311.htm |
| EX-31.2 - EXHIBIT 31.2 - TIMKEN CO | tkr33116exhibit312.htm |
| EX-12 - EXHIBIT 12 - TIMKEN CO | tkr33116exhibit12.htm |
| EX-32 - EXHIBIT 32 - TIMKEN CO | tkr33116exhibit32.htm |
UNITED STATES
SECURITIES AND EXCHANGE COMMISSION
WASHINGTON, D.C. 20549
FORM 10-Q
ý | QUARTERLY REPORT PURSUANT TO SECTION 13 OR 15(d) OF THE SECURITIES EXCHANGE ACT OF 1934 |
For the quarterly period ended March 31, 2016
OR
o | TRANSITION REPORT PURSUANT TO SECTION 13 OR 15(d) OF THE SECURITIES EXCHANGE ACT OF 1934 |
For the transition period from to
Commission file number: 1-1169
THE TIMKEN COMPANY
(Exact name of registrant as specified in its charter)
OHIO | 34-0577130 | |
(State or other jurisdiction of incorporation or organization) | (I.R.S. Employer Identification No.) | |
4500 Mount Pleasant Street NW North Canton, Ohio | 44720-5450 | |
(Address of principal executive offices) | (Zip Code) | |
234.262.3000
(Registrant’s telephone number, including area code)
Indicate by check mark whether the registrant (1) has filed all reports required to be filed by Section 13 or 15(d) of the Securities Exchange Act of 1934 during the preceding 12 months (or for such shorter period that the registrant was required to file such reports), and (2) has been subject to such filing requirements for the past 90 days. Yes ý No o
Indicate by check mark whether the registrant has submitted electronically and posted on its corporate Web site, if any, every Interactive Data File required to be submitted and posted pursuant to Rule 405 of Regulation S-T during the preceding 12 months (or for such shorter period that the registrant was required to submit and post such files). Yes ý No o
Indicate by check mark whether the registrant is a large accelerated filer, an accelerated filer, a non-accelerated filer, or a smaller reporting company. See the definitions of “large accelerated filer,” “accelerated filer” and “smaller reporting company” in Rule 12b-2 of the Exchange Act.
Large accelerated filer | ý | Accelerated filer | o | ||
Non-accelerated filer | o | Smaller reporting company | o | ||
Indicate by check mark whether the registrant is a shell company (as defined in Rule 12b-2 of the Exchange Act).
Yes o No ý
Indicate the number of shares outstanding of each of the issuer's classes of common stock, as of the latest practicable date.
Class | Outstanding at March 31, 2016 | |||
Common Shares, without par value | 79,222,802 shares | |||
PART I. FINANCIAL INFORMATION
ITEM 1. FINANCIAL STATEMENTS
THE TIMKEN COMPANY AND SUBSIDIARIES
Consolidated Statements of Income
(Unaudited)
Three Months Ended March 31, | |||||||
2016 | 2015 | ||||||
(Dollars in millions, except per share data) | |||||||
Net sales | $ | 684.0 | $ | 722.5 | |||
Cost of products sold | 503.1 | 520.0 | |||||
Gross Profit | 180.9 | 202.5 | |||||
Selling, general and administrative expenses | 118.3 | 128.5 | |||||
Impairment and restructuring charges | 10.5 | 6.2 | |||||
Pension settlement charges | 1.2 | 215.2 | |||||
Operating Income (Loss) | 50.9 | (147.4 | ) | ||||
Interest expense | (8.4 | ) | (8.0 | ) | |||
Interest income | 0.3 | 0.7 | |||||
Continued Dumping & Subsidy Offset Act income, net of related expenses | 47.7 | — | |||||
Other (expense) income, net | — | (1.4 | ) | ||||
Income (Loss) Before Income Taxes | 90.5 | (156.1 | ) | ||||
Provision (benefit) for income taxes | 27.6 | (21.3 | ) | ||||
Net Income (Loss) | 62.9 | (134.8 | ) | ||||
Less: Net (loss) income attributable to noncontrolling interest | (0.1 | ) | 0.4 | ||||
Net Income (Loss) attributable to The Timken Company | $ | 63.0 | $ | (135.2 | ) | ||
Net Income (Loss) per Common Share attributable to The Timken Company's Common Shareholders | |||||||
Basic earnings (loss) per share | $ | 0.79 | $ | (1.54 | ) | ||
Diluted earnings (loss) per share | $ | 0.78 | $ | (1.54 | ) | ||
Dividends per share | $ | 0.26 | $ | 0.25 | |||
See accompanying Notes to the Consolidated Financial Statements.
2
Consolidated Statements of Comprehensive Income
(Unaudited)
Three Months Ended March 31, | |||||||
2016 | 2015 | ||||||
(Dollars in millions) | |||||||
Net Income (Loss) | $ | 62.9 | $ | (134.8 | ) | ||
Other comprehensive income (loss), net of tax: | |||||||
Foreign currency translation adjustments | 14.8 | (27.8 | ) | ||||
Pension and postretirement liability adjustment | 3.7 | 105.1 | |||||
Change in fair value of derivative financial instruments | (2.3 | ) | — | ||||
Other comprehensive income (loss), net of tax | 16.2 | 77.3 | |||||
Comprehensive Income (Loss), net of tax | 79.1 | (57.5 | ) | ||||
Less: comprehensive income attributable to noncontrolling interest | 1.0 | 0.4 | |||||
Comprehensive Income (Loss) attributable to The Timken Company | $ | 78.1 | $ | (57.9 | ) | ||
See accompanying Notes to the Consolidated Financial Statements.
3
Consolidated Balance Sheets
(Unaudited) | |||||||
March 31, 2016 | December 31, 2015 | ||||||
(Dollars in millions) | |||||||
ASSETS | |||||||
Current Assets | |||||||
Cash and cash equivalents | $ | 137.3 | $ | 129.6 | |||
Restricted cash | 0.2 | 0.2 | |||||
Accounts receivable, less allowances (2016 – $16.9 million; 2015 – $16.9 million) | 465.0 | 454.6 | |||||
Inventories, net | 551.3 | 543.2 | |||||
Deferred charges and prepaid expenses | 25.9 | 22.7 | |||||
Other current assets | 95.2 | 56.1 | |||||
Total Current Assets | 1,274.9 | 1,206.4 | |||||
Property, Plant and Equipment, net | 780.1 | 777.8 | |||||
Other Assets | |||||||
Goodwill | 328.7 | 327.3 | |||||
Non-current pension assets | 88.1 | 86.3 | |||||
Other intangible assets | 265.1 | 271.3 | |||||
Deferred income taxes | 64.9 | 65.9 | |||||
Other non-current assets | 48.3 | 49.1 | |||||
Total Other Assets | 795.1 | 799.9 | |||||
Total Assets | $ | 2,850.1 | $ | 2,784.1 | |||
LIABILITIES AND SHAREHOLDERS' EQUITY | |||||||
Current Liabilities | |||||||
Short-term debt | $ | 0.2 | $ | 62.0 | |||
Current portion of long-term debt | 15.1 | 15.1 | |||||
Accounts payable, trade | 177.9 | 159.7 | |||||
Salaries, wages and benefits | 84.6 | 102.3 | |||||
Income taxes payable | 30.2 | 13.1 | |||||
Other current liabilities | 134.6 | 153.1 | |||||
Total Current Liabilities | 442.6 | 505.3 | |||||
Non-Current Liabilities | |||||||
Long-term debt | 673.4 | 579.4 | |||||
Accrued pension cost | 149.2 | 146.9 | |||||
Accrued postretirement benefits cost | 133.1 | 136.1 | |||||
Deferred income taxes | 3.6 | 3.6 | |||||
Other non-current liabilities | 72.6 | 68.2 | |||||
Total Non-Current Liabilities | 1,031.9 | 934.2 | |||||
Shareholders’ Equity | |||||||
Class I and II Serial Preferred Stock, without par value: | |||||||
Authorized – 10,000,000 shares each class, none issued | — | — | |||||
Common stock, without par value: | |||||||
Authorized – 200,000,000 shares | |||||||
Issued (including shares in treasury) (2016 – 98,375,135 shares; 2015 – 98,375,135 shares) | |||||||
Stated capital | 53.1 | 53.1 | |||||
Other paid-in capital | 901.6 | 905.1 | |||||
Earnings invested in the business | 1,499.9 | 1,457.6 | |||||
Accumulated other comprehensive loss | (271.9 | ) | (287.0 | ) | |||
Treasury shares at cost (2016 – 19,152,333 shares; 2015 – 18,112,047 shares) | (833.0 | ) | (804.3 | ) | |||
Total Shareholders’ Equity | 1,349.7 | 1,324.5 | |||||
Noncontrolling Interest | 25.9 | 20.1 | |||||
Total Equity | 1,375.6 | 1,344.6 | |||||
Total Liabilities and Shareholders’ Equity | $ | 2,850.1 | $ | 2,784.1 | |||
See accompanying Notes to the Consolidated Financial Statements.
4
Consolidated Statements of Cash Flows
(Unaudited)
Three Months Ended March 31, | |||||||
2016 | 2015 | ||||||
(Dollars in millions) | |||||||
CASH PROVIDED (USED) | |||||||
Operating Activities | |||||||
Net income (loss) attributable to The Timken Company | $ | 63.0 | $ | (135.2 | ) | ||
Net (loss) income attributable to noncontrolling interest | (0.1 | ) | 0.4 | ||||
Adjustments to reconcile net income to net cash provided by operating activities: | |||||||
Depreciation and amortization | 32.6 | 33.5 | |||||
Impairment charges | 2.6 | 2.7 | |||||
Loss on sale of assets | 0.6 | 0.3 | |||||
Continued Dumping and Subsidy Offset Act receivable | (48.1 | ) | — | ||||
Deferred income tax provision | 0.7 | (84.4 | ) | ||||
Stock-based compensation expense | 4.6 | 4.1 | |||||
Excess tax benefits related to stock-based compensation | — | (1.0 | ) | ||||
Pension and other postretirement expense | 9.3 | 225.1 | |||||
Pension contributions and other postretirement benefit payments | (10.2 | ) | (6.9 | ) | |||
Changes in operating assets and liabilities: | |||||||
Accounts receivable | (4.9 | ) | (29.6 | ) | |||
Inventories | (0.1 | ) | (12.8 | ) | |||
Accounts payable, trade | 16.5 | 27.9 | |||||
Other accrued expenses | (28.4 | ) | (63.5 | ) | |||
Income taxes | 21.7 | 54.7 | |||||
Other, net | (12.7 | ) | 1.7 | ||||
Net Cash Provided by Operating Activities | 47.1 | 17.0 | |||||
Investing Activities | |||||||
Capital expenditures | (24.2 | ) | (19.7 | ) | |||
Proceeds from disposal of property, plant and equipment | — | 2.8 | |||||
Investments in short-term marketable securities, net | (0.5 | ) | 2.9 | ||||
Other | 0.1 | — | |||||
Net Cash Used by Investing Activities | (24.6 | ) | (14.0 | ) | |||
Financing Activities | |||||||
Cash dividends paid to shareholders | (20.7 | ) | (21.9 | ) | |||
Purchase of treasury shares | (35.0 | ) | (96.8 | ) | |||
Proceeds from exercise of stock options | 0.3 | 1.1 | |||||
Excess tax benefits related to stock-based compensation | — | 1.0 | |||||
Proceeds from long-term debt | 90.0 | — | |||||
Accounts receivable facility borrowings | 10.0 | — | |||||
Accounts receivable facility payments | (11.0 | ) | — | ||||
Payments on long-term debt | (45.0 | ) | (1.1 | ) | |||
Short-term debt activity, net | (12.8 | ) | (3.6 | ) | |||
Decrease in restricted cash | — | 0.5 | |||||
Other | 4.8 | — | |||||
Net Cash Used by Financing Activities | (19.4 | ) | (120.8 | ) | |||
Effect of exchange rate changes on cash | 4.6 | (6.6 | ) | ||||
Increase (Decrease) In Cash and Cash Equivalents | 7.7 | (124.4 | ) | ||||
Cash and cash equivalents at beginning of year | 129.6 | 278.8 | |||||
Cash and Cash Equivalents at End of Period | $ | 137.3 | $ | 154.4 | |||
See accompanying Notes to the Consolidated Financial Statements.
5
NOTES TO THE CONSOLIDATED FINANCIAL STATEMENTS (Unaudited)
(Dollars in millions, except per share data)
Note 1 - Basis of Presentation
The accompanying Consolidated Financial Statements (unaudited) for The Timken Company (the Company) have been prepared in accordance with the instructions to Form 10-Q and do not include all of the information and notes required by the accounting principles generally accepted in the United States (U.S. GAAP) for complete financial statements. In the opinion of management, all adjustments (consisting of normal recurring accruals) and disclosures considered necessary for a fair presentation have been included. For further information, refer to the Consolidated Financial Statements and notes included in the Company’s Annual Report on Form 10-K for the year ended December 31, 2015.
Note 2 - Recent Accounting Pronouncements
In March 2016, the Financial Accounting Standards Board (FASB) issued Accounting Standards Update (ASU) 2016-09, "Compensation - Stock Compensation (Topic 718): Improvements to Employee Share-Based Payment Accounting." ASU 2016-09 simplifies various aspects of the accounting for shared-based payments. The simplifications include: (a) recording all tax effects associated with stock-based compensation through the income statement, as opposed to recording certain amounts in other paid-in capital, which eliminates the complications of tracking a “windfall pool,” but will increase the volatility of income tax expense; (b) allowing entities to withhold shares to satisfy the employer’s statutory tax withholding requirement up to the highest marginal tax rate applicable to employees rather than the employer’s minimum statutory rate, without requiring liability classification for the award; (c) modifying the requirement to estimate the number of awards that will ultimately vest by providing an accounting policy election to either estimate the number of forfeitures or recognize forfeitures as they occur; and (d) changing certain presentation requirements in the statement of cash flows, including removing the requirement to present excess tax benefits as an inflow from financing activities and an outflow from operating activities, and requiring the cash paid to taxing authorities arising from withheld shares to be classified as a financing activity.
ASU 2016-09 is effective for annual periods beginning after December 15, 2016, and interim periods within those annual periods. Early adoption is permitted for any entity in any interim or annual period. If an entity early adopts the amendments in an interim period, any adjustments should be reflected as of the beginning of the fiscal year that includes that interim period. An entity that elects early adoption must adopt all of the amendments in the same period. Amendments related to the timing of when excess tax benefits are recognized, minimum statutory withholding requirements, forfeitures, and intrinsic value should be applied using a modified retrospective transition method by means of a cumulative-effect adjustment to equity as of the beginning of the period in which the guidance is adopted. Amendments related to the presentation of employee taxes paid on the statement of cash flows when an employer withholds shares to meet the minimum statutory withholding requirement should be applied retrospectively. Amendments requiring recognition of excess tax benefits and tax deficiencies in the income statement and the practical expedient for estimating expected term should be applied prospectively. An entity may elect to apply the amendments related to the presentation of excess tax benefits on the statement of cash flows using either a prospective transition method or a retrospective transition method. The Company is currently evaluating the effect that the provisions of ASU 2016-09 will have on the Company's results of operations and financial condition.
In February 2016, the FASB issued ASU 2016-02, "Leases (Topic 842)." ASU 2016-02 was issued to increase transparency and comparability among entities by recognizing lease assets and lease liabilities on the balance sheet and disclosing key information about lease arrangements. ASU 2016-02 is effective for public companies for fiscal years, and interim periods within those fiscal years, beginning after December 15, 2018. The Company is currently evaluating the impact of adopting ASU 2016-02 on the Company's results of operations and financial condition.
In September 2015, the FASB issued ASU 2015-16, "Business Combinations (Topic 805): Simplifying the Accounting for Measurement-Period Adjustments." ASU 2015-16 eliminates the requirement for an acquirer in a business combination to account for measurement-period adjustments retrospectively. Instead, acquirers must recognize measurement-period adjustments during the period in which they determine the amounts, including the effect on earnings of any amounts they would have recorded in previous periods if the accounting had been completed at the acquisition date. This new accounting guidance does not eliminate the requirement for the measurement period to be completed within one year. This new accounting guidance is effective for annual periods beginning after December 15, 2015. On January 1, 2016, the Company adopted the provisions of ASU 2015-16. The adoption of ASU 2015-16 had no effect on the Company's results of operations or financial condition as there were no measurement-period adjustments during the first three months of 2016.
6
In May 2015, the FASB issued ASU 2015-07, "Fair Value Measurement (Topic 820): Disclosures for Investments in Certain Entities That Calculate Net Asset Value per Share (or Its Equivalent)." ASU 2015-07 eliminates the requirement to categorize within the fair value hierarchy investments for which fair values are estimated using the net asset value (NAV) practical expedient provided in ASC 820, "Fair Value Measurement." Instead, entities will be required to disclose the fair values of such investments so that financial statement users can reconcile amounts reported in the fair value hierarchy table and the amounts reported on the balance sheet. ASU 2015-07 is effective for fiscal years beginning after December 15, 2015, with retrospective application to all periods presented. On January 1, 2016, the Company adopted the provisions of ASU 2015-07. The adoption of ASU 2015-07 did not have any impact on the Company's results of operations or financial condition as the new guidance addresses disclosure only. See Note 15 - Fair Value for the new disclosures.
In April 2015, the FASB issued ASU 2015-03, "Interest - Imputation of Interest (Subtopic 835-30) - Simplifying the Presentation of Debt Issuance Costs." ASU 2015-03 requires that all costs incurred to issue debt be presented in the balance sheet as a direct deduction in the carrying value of debt. Prior to the issuance of this new accounting guidance, debt issuance costs were required to be presented in the balance sheet as a deferred charge (i.e., an asset), and only a debt discount was recorded as a direct deduction to the carrying value of debt. This new accounting guidance is effective for annual periods beginning after December 15, 2015. ASU 2015-03 requires that the new accounting guidance be applied on a retrospective basis, wherein the balance sheet of each individual period presented should be adjusted to reflect the period-specific effects of applying the new guidance.
On January 1, 2016, the Company adopted the provisions of ASU 2015-03. The following financial statement line items at December 31, 2015 were affected by the adoption of ASU 2015-03.
As Originally Reported | New Presentation | Effect of Change | |||||||
Assets: | |||||||||
Other non-current assets | $ | 50.3 | $ | 49.1 | $ | 1.2 | |||
Liabilities: | |||||||||
Long-term debt | $ | 580.6 | $ | 579.4 | $ | 1.2 | |||
In May 2014, the FASB issued ASU 2014-09, "Revenue from Contracts with Customers (Topic 606)." ASU 2014-09 introduces a new five-step revenue recognition model in which an entity should recognize revenue to depict the transfer of goods or services to customers in an amount that reflects the consideration to which the entity expects to be entitled in exchange for those goods or services. ASU 2014-09 also requires disclosures sufficient to enable users to understand the nature, amount, timing, and uncertainty of revenue and cash flows arising from contracts with customers, including qualitative and quantitative disclosures about contracts with customers, significant judgments and changes in judgments and assets recognized from the costs to obtain or fulfill a contract. On July 9, 2015, the FASB decided to delay the effective date of this new accounting guidance by one year, which will result in it being effective for annual periods beginning after December 15, 2017. The Company is currently evaluating the impact of adopting ASU 2014-09 on the Company's results of operations and financial condition.
7
Note 3 - Inventories
The components of inventories were as follows:
March 31, 2016 | December 31, 2015 | |||||
Manufacturing supplies | $ | 29.6 | $ | 24.7 | ||
Raw materials | 57.8 | 58.8 | ||||
Work in process | 182.5 | 181.9 | ||||
Finished products | 301.6 | 296.2 | ||||
Subtotal | 571.5 | 561.6 | ||||
Allowance for obsolete and surplus inventory | (20.2 | ) | (18.4 | ) | ||
Total Inventories, net | $ | 551.3 | $ | 543.2 | ||
Inventories are valued at the lower of cost or market, with approximately 54% valued by the first-in, first-out (FIFO) method and the remaining 46% valued by the last-in, first-out (LIFO) method. The majority of the Company's domestic inventories are valued by the LIFO method and all of the Company's international (outside the United States) inventories are valued by the FIFO method.
An actual valuation of the inventory under the LIFO method can be made only at the end of each year based on the inventory levels and costs at that time. Accordingly, interim LIFO calculations must be based on management’s estimates of expected year-end inventory levels and costs. Because these calculations are subject to many factors beyond management’s control, annual results may differ from interim results as they are subject to the final year-end LIFO inventory valuation.
The LIFO reserves at March 31, 2016 and December 31, 2015 were $183.6 million and $188.1 million, respectively. The Company recognized a decrease in its LIFO reserve of $4.5 million during the first three months of 2016, compared to an increase in its LIFO reserve of $1.9 million during the first three months of 2015.
Note 4 - Property, Plant and Equipment
The components of property, plant and equipment were as follows:
March 31, 2016 | December 31, 2015 | |||||
Land and buildings | $ | 429.4 | $ | 430.3 | ||
Machinery and equipment | 1,766.0 | 1,741.4 | ||||
Subtotal | 2,195.4 | 2,171.7 | ||||
Accumulated depreciation | (1,415.3 | ) | (1,393.9 | ) | ||
Property, Plant and Equipment, net | $ | 780.1 | $ | 777.8 | ||
Total depreciation expense for the three months ended March 31, 2016 and 2015 was $23.5 million and $24.0 million, respectively.
8
Note 5 - Goodwill and Other Intangible Assets
The changes in the carrying amount of goodwill for the three months ended March 31, 2016 were as follows:
Mobile Industries | Process Industries | Total | |||||||
Beginning balance | $ | 97.0 | $ | 230.3 | $ | 327.3 | |||
Foreign currency translation adjustments | 0.1 | 1.3 | 1.4 | ||||||
Ending balance | $ | 97.1 | $ | 231.6 | $ | 328.7 | |||
The following table displays intangible assets as of March 31, 2016 and December 31, 2015:
As of March 31, 2016 | As of December 31, 2015 | |||||||||||||||||
Gross Carrying Amount | Accumulated Amortization | Net Carrying Amount | Gross Carrying Amount | Accumulated Amortization | Net Carrying Amount | |||||||||||||
Intangible assets subject to amortization: | ||||||||||||||||||
Customer relationships | $ | 199.0 | $ | 73.8 | $ | 125.2 | $ | 198.9 | $ | 70.0 | $ | 128.9 | ||||||
Know-how | 32.0 | 7.1 | 24.9 | 31.9 | 6.7 | 25.2 | ||||||||||||
Industrial license agreements | 0.1 | 0.1 | — | 0.1 | 0.1 | — | ||||||||||||
Land-use rights | 8.4 | 4.8 | 3.6 | 8.3 | 4.7 | 3.6 | ||||||||||||
Patents | 2.1 | 2.1 | — | 2.1 | 2.1 | — | ||||||||||||
Technology use | 53.7 | 14.8 | 38.9 | 53.6 | 14.0 | 39.6 | ||||||||||||
Trademarks | 6.4 | 3.3 | 3.1 | 6.5 | 3.3 | 3.2 | ||||||||||||
Non-compete agreements | 2.7 | 2.6 | 0.1 | 2.7 | 2.5 | 0.2 | ||||||||||||
Software | 246.7 | 201.9 | 44.8 | 243.8 | 197.6 | 46.2 | ||||||||||||
$ | 551.1 | $ | 310.5 | $ | 240.6 | $ | 547.9 | $ | 301.0 | $ | 246.9 | |||||||
Intangible assets not subject to amortization: | ||||||||||||||||||
Tradenames | $ | 15.8 | $ | 15.8 | $ | 15.7 | $ | 15.7 | ||||||||||
FAA air agency certificates | 8.7 | 8.7 | 8.7 | 8.7 | ||||||||||||||
$ | 24.5 | $ | 24.5 | $ | 24.4 | $ | 24.4 | |||||||||||
Total intangible assets | $ | 575.6 | $ | 310.5 | $ | 265.1 | $ | 572.3 | $ | 301.0 | $ | 271.3 | ||||||
Amortization expense for intangible assets was $9.1 million and $9.5 million for the three months ended March 31, 2016 and 2015, respectively. Amortization expense for intangible assets is estimated to be $37.0 million in 2016; $33.0 million in 2017; $28.4 million in 2018; $24.1 million in 2019; and $19.9 million in 2020.
9
Note 6 - Financing Arrangements
Short-term debt at March 31, 2016 and December 31, 2015 was as follows:
March 31, 2016 | December 31, 2015 | |||||
Variable-rate Accounts Receivable Facility with interest rate of 1.05% at December 31, 2015 | $ | — | $ | 49.0 | ||
Borrowings under variable-rate lines of credit for certain of the Company’s foreign subsidiaries with various banks with interest rates ranging from 0.44% to 10.5% at March 31, 2016 and 0.31% to 0.44% at December 31, 2015, respectively. | 0.2 | 13.0 | ||||
Short-term debt | $ | 0.2 | $ | 62.0 | ||
The lines of credit for certain of the Company’s foreign subsidiaries provide for short-term borrowings up to $225.0 million. Most of these lines of credit are uncommitted. At March 31, 2016, the Company’s foreign subsidiaries had borrowings outstanding of $0.2 million and bank guarantees of $1.1 million, which reduced the availability under these facilities to $223.7 million.
Long-term debt at March 31, 2016 and December 31, 2015 was as follows:
March 31, 2016 | December 31, 2015 | |||||
Fixed-rate Medium-Term Notes, Series A, mature at various dates through May 2028, with interest rates ranging from 6.74% to 7.76% | $ | 174.4 | $ | 174.4 | ||
Fixed-rate Senior Unsecured Notes, maturing on September 1, 2024, with an interest rate of 3.875% | 345.1 | 344.8 | ||||
Variable-rate Senior Credit Facility with an interest rate of 1.66% at March 31, 2016 and 1.45% at December 31, 2015, respectively. | 120.9 | 75.2 | ||||
Variable-rate Accounts Receivable Facility with interest rate of 1.28% at March 31, 2016 | 48.0 | — | ||||
Other | 0.1 | 0.1 | ||||
$ | 688.5 | $ | 594.5 | |||
Less current maturities | 15.1 | 15.1 | ||||
Long-term debt | $ | 673.4 | $ | 579.4 | ||
The Company has a $500 million Amended and Restated Credit Agreement (Senior Credit Facility), which matures on June 19, 2020. At March 31, 2016, the Company had $120.9 million of outstanding borrowings under the Senior Credit Facility, which reduced the availability under this facility to $379.1 million. Under the Senior Credit Facility, the Company has two financial covenants: a consolidated leverage ratio and a consolidated interest coverage ratio. At March 31, 2016, the Company was in full compliance with both of these covenants under the Senior Credit Facility.
The Company has a $100 million Amended and Restated Asset Securitization Agreement (Accounts Receivable Facility) that matures on November 30, 2018. Under the terms of the Accounts Receivable Facility, the Company sells, on an ongoing basis, certain domestic trade receivables to Timken Receivables Corporation, a wholly-owned consolidated subsidiary, which in turn uses the trade receivables to secure borrowings, which are funded through a vehicle that issues commercial paper in the short-term market. Borrowings under the Accounts Receivable Facility are limited by certain borrowing base limitations. These limitations reduced the availability of the Accounts Receivable Facility to $71.0 million at March 31, 2016. As of March 31, 2016, there were outstanding borrowings of $48.0 million under the Accounts Receivable Facility, which reduced the availability under this facility to $23.0 million. The cost of this facility, which is the prevailing commercial paper rate plus program fees, is considered a financing cost and is included in interest expense in the Consolidated Statements of Income. The outstanding balance under the Accounts Receivable Facility was classified as long-term debt as of March 31, 2016, to align with the term of the agreement and reflect the Company's expectations relative to the minimum borrowing base. The outstanding balance under the Accounts Receivable Facility was classified as short-term debt as of December 31, 2015, based on the same criteria.
10
Note 7 - Equity
The changes in the equity components for the three months ended March 31, 2016 were as follows:
The Timken Company Shareholders | |||||||||||||||||||||
Total | Stated Capital | Other Paid-In Capital | Earnings Invested in the Business | Accumulated Other Comprehensive (Loss) | Treasury Stock | Non- controlling Interest | |||||||||||||||
Balance at December 31, 2015 | $ | 1,344.6 | $ | 53.1 | $ | 905.1 | $ | 1,457.6 | $ | (287.0 | ) | $ | (804.3 | ) | $ | 20.1 | |||||
Net income (loss) | 62.9 | 63.0 | (0.1 | ) | |||||||||||||||||
Foreign currency translation adjustment | 14.8 | 13.7 | 1.1 | ||||||||||||||||||
Pension and postretirement liability adjustment (net of the income tax benefit of $1.5 million) | 3.7 | 3.7 | |||||||||||||||||||
Change in fair value of derivative financial instruments, net of reclassifications | (2.3 | ) | (2.3 | ) | |||||||||||||||||
Investment in joint venture by noncontrolling interest party | 4.8 | 4.8 | |||||||||||||||||||
Dividends – $0.26 per share | (20.7 | ) | (20.7 | ) | |||||||||||||||||
Excess tax shortfall from stock compensation | (0.8 | ) | (0.8 | ) | |||||||||||||||||
Stock-based compensation expense | 4.6 | 4.6 | |||||||||||||||||||
Stock purchased at fair market value | (35.0 | ) | (35.0 | ) | |||||||||||||||||
Stock option exercise activity | 0.4 | (0.4 | ) | 0.8 | |||||||||||||||||
Restricted shares (issued) surrendered | 0.1 | (6.9 | ) | 7.0 | |||||||||||||||||
Shares surrendered for taxes | (1.5 | ) | (1.5 | ) | |||||||||||||||||
Balance at March 31, 2016 | $ | 1,375.6 | $ | 53.1 | $ | 901.6 | $ | 1,499.9 | $ | (271.9 | ) | $ | (833.0 | ) | $ | 25.9 | |||||
On March 6, 2014, Timken Lux Holdings II S.A.R.L, a subsidiary of the Company, entered into a joint venture agreement with Holme Service Limited (joint venture partner). During 2015, the Company and its joint venture partner established TUBC Limited, a Cyprus entity, for the purpose of producing bearings to serve the rail market sector in Russia. During 2015, the Company and its joint venture partner amended and restated the joint venture agreement and contributed $6.9 million and $6.6 million, respectively, to TUBC Limited. During the first three months of 2016, the Company and its joint venture partner contributed $5.0 million and $4.8 million, respectively, to TUBC Limited. The Company and its joint venture partner have a 51% controlling interest and 49% controlling interest, respectively, in TUBC Limited. The Company expects to contribute another $4 million in 2016.
11
Note 8 - Accumulated Other Comprehensive Income (Loss)
The following tables present details about components of accumulated other comprehensive income (loss) for the three months ended March 31, 2016 and the three months ended March 31, 2015, respectively:
Foreign currency translation adjustments | Pension and postretirement liability adjustments | Change in fair value of derivative financial instruments | Total | |||||||||
Balance at December 31, 2015 | $ | (72.2 | ) | $ | (215.1 | ) | $ | 0.3 | $ | (287.0 | ) | |
Other comprehensive income (loss) before reclassifications and income tax | 14.8 | 0.1 | (2.9 | ) | 12.0 | |||||||
Amounts reclassified from accumulated other comprehensive income, before income tax | — | 5.1 | (0.8 | ) | 4.3 | |||||||
Income tax (benefit) expense | — | (1.5 | ) | 1.4 | (0.1 | ) | ||||||
Net current period other comprehensive income (loss), net of income taxes | 14.8 | 3.7 | (2.3 | ) | 16.2 | |||||||
Noncontrolling interest | (1.1 | ) | — | — | (1.1 | ) | ||||||
Net current period comprehensive income (loss), net of income taxes and noncontrolling interest | 13.7 | 3.7 | (2.3 | ) | 15.1 | |||||||
Balance at March 31, 2016 | $ | (58.5 | ) | $ | (211.4 | ) | $ | (2.0 | ) | $ | (271.9 | ) |
Foreign currency translation adjustments | Pension and postretirement liability adjustments | Change in fair value of derivative financial instruments | Total | |||||||||
Balance at December 31, 2014 | $ | (0.7 | ) | $ | (481.0 | ) | $ | (0.8 | ) | $ | (482.5 | ) |
Other comprehensive (loss) income before reclassifications and income tax | (27.8 | ) | (60.1 | ) | 0.6 | (87.3 | ) | |||||
Amounts reclassified from accumulated other comprehensive income, before income tax | — | 225.5 | (0.6 | ) | 224.9 | |||||||
Income tax (benefit) expense | — | (60.3 | ) | — | (60.3 | ) | ||||||
Net current period other comprehensive income (loss), net of income taxes | (27.8 | ) | 105.1 | — | 77.3 | |||||||
Net current period comprehensive income (loss), net of income taxes and noncontrolling interest | (27.8 | ) | 105.1 | — | 77.3 | |||||||
Balance at March 31, 2015 | $ | (28.5 | ) | $ | (375.9 | ) | $ | (0.8 | ) | $ | (405.2 | ) |
Other comprehensive income (loss) before reclassifications and income taxes includes the effect of foreign currency.
The before-tax reclassification of pension and postretirement liability adjustments of $5.1 million were due to the amortization of actuarial losses and prior service costs and were included in cost of products sold and selling, general and administrative expenses in the Consolidated Statements of Income for the three months ended March 31, 2016. $213.6 million of the $225.5 million before-tax reclassification of pension and postretirement liability adjustments was included in pension settlement charges in the Consolidated Statement of Income for the three months ended March 31, 2015. The remaining before-tax reclassification of pension and postretirement liability adjustments of $11.9 million were due to the amortization of actuarial losses and prior service costs and were included in costs of products sold and selling, general and administrative expenses in the Consolidated Statements of Income. The reclassification of the remaining components of accumulated other comprehensive income (loss) was included in other income (expense), net in the Consolidated Statements of Income.
12
Note 9 - Earnings Per Share
The following table sets forth the reconciliation of the numerator and the denominator of basic earnings per share and diluted earnings per share for the three months ended March 31, 2016 and 2015:
Three Months Ended March 31, | ||||||
2016 | 2015 | |||||
Numerator: | ||||||
Net income (loss) attributable to The Timken Company | $ | 63.0 | $ | (135.2 | ) | |
Less: undistributed earnings allocated to nonvested stock | — | — | ||||
Net income (loss) available to common shareholders for basic earnings per share and diluted earnings per share | $ | 63.0 | $ | (135.2 | ) | |
Denominator: | ||||||
Weighted average number of shares outstanding, basic | 79,769,761 | 87,670,640 | ||||
Effect of dilutive securities: | ||||||
Stock options and awards based on the treasury stock method | 667,772 | — | ||||
Weighted average number of shares outstanding, assuming dilution of stock options and awards | 80,437,533 | 87,670,640 | ||||
Basic earnings (loss) per share | $ | 0.79 | $ | (1.54 | ) | |
Diluted earnings (loss) per share | $ | 0.78 | $ | (1.54 | ) | |
The exercise prices for certain stock options that the Company has awarded exceed the average market price of the Company’s common shares. Such stock options are antidilutive and were not included in the computation of diluted earnings per share. The antidilutive stock options outstanding during the three months ended March 31, 2016 were 3,092,912. During the three months ended March 31, 2015, the Company incurred a net loss and therefore treated all stock options and restricted stock units as antidilutive.
13
Note 10 - Segment Information
The primary measurement used by management to measure the financial performance of each segment is EBIT (earnings before interest and taxes).
Three Months Ended March 31, | ||||||
2016 | 2015 | |||||
Net sales: | ||||||
Mobile Industries | $ | 383.2 | $ | 393.0 | ||
Process Industries | 300.8 | 329.5 | ||||
$ | 684.0 | $ | 722.5 | |||
Segment EBIT: | ||||||
Mobile Industries | $ | 30.2 | $ | 35.4 | ||
Process Industries | 32.6 | 45.2 | ||||
Total EBIT, for reportable segments | $ | 62.8 | $ | 80.6 | ||
Unallocated corporate expenses | (10.7 | ) | (14.2 | ) | ||
Unallocated pension settlement charges | (1.2 | ) | (215.2 | ) | ||
Continued Dumping & Subsidy Offset Act income, net of expenses | 47.7 | — | ||||
Interest expense | (8.4 | ) | (8.0 | ) | ||
Interest income | 0.3 | 0.7 | ||||
Income (loss) before income taxes | $ | 90.5 | $ | (156.1 | ) | |
Note 11 - Impairment and Restructuring Charges
Impairment and restructuring charges by segment are comprised of the following:
For the three months ended March 31, 2016:
Mobile Industries | Process Industries | Total | |||||||
Impairment charges | $ | 2.6 | $ | — | $ | 2.6 | |||
Severance and related benefit costs | 4.1 | 3.6 | 7.7 | ||||||
Exit costs | 0.2 | — | 0.2 | ||||||
Total | $ | 6.9 | $ | 3.6 | $ | 10.5 | |||
For the three months ended March 31, 2015:
Mobile Industries | Process Industries | Total | |||||||
Impairment charges | $ | 0.1 | $ | 2.6 | $ | 2.7 | |||
Severance and related benefit costs | 0.4 | — | 0.4 | ||||||
Exit costs | 0.1 | 3.0 | 3.1 | ||||||
Total | $ | 0.6 | $ | 5.6 | $ | 6.2 | |||
14
The following discussion explains the impairment and restructuring charges recorded for the periods presented; however, it is not intended to reflect a comprehensive discussion of all amounts in the tables above.
Mobile Industries
On March 17, 2016, the Company announced the closure of its bearing plant in Altavista, Virginia (Altavista). The plant is expected to close in approximately one year, with production transferring to its bearing plant near Lincolnton, North Carolina. During the first three months of 2016, the Company recorded impairment charges of $2.4 million and severance and related benefit costs of $1.3 million related to the closure.
In addition, the Company incurred $0.4 million of severance and related benefit costs related to the rationalization of one of its facilities in Europe during the first three months of 2015.
Process Industries
During the first three months of 2015, the Company recorded $3.0 million of exit costs related to the Company's termination of its relationship with one of its third-party sales representatives in Colombia.
In addition, the Company recorded impairment charges of $2.5 million related to the shutdown of the Company's repair businesses in Niles, Ohio. See Note 15 - Fair Value for additional information on the impairment charges for the repair business.
Workforce Reductions:
During the first three months of 2016, the Company recognized $6.3 million of severance and related benefit costs to eliminate approximately 100 positions. Of the $6.3 million charge for the first three months of 2016, $2.7 million related to the Mobile Industries segment and $3.6 million related to the Process Industries segment.
The following is a rollforward of the consolidated restructuring accrual for the three months ended March 31, 2016 and the twelve months ended December 31, 2015:
March 31, 2016 | December 31, 2015 | |||||
Beginning balance, January 1 | $ | 11.3 | $ | 9.5 | ||
Expense | 7.9 | 11.4 | ||||
Payments | (6.1 | ) | (9.6 | ) | ||
Ending balance | $ | 13.1 | $ | 11.3 | ||
The restructuring accrual at March 31, 2016 and December 31, 2015 was included in other current liabilities on the Consolidated Balance Sheets.
15
Note 12 - Retirement Benefit Plans
The following table sets forth the net periodic benefit cost for the Company’s defined benefit pension plans. The amounts for the three months ended March 31, 2016 are based on calculations prepared by the Company's actuaries during the fourth quarter of 2015 and represent the Company’s best estimate of the period’s proportionate share of the amounts to be recorded for the year ending December 31, 2016.
U.S. Plans | International Plans | Total | ||||||||||||||||
Three Months Ended March 31, | Three Months Ended March 31, | Three Months Ended March 31, | ||||||||||||||||
2016 | 2015 | 2016 | 2015 | 2016 | 2015 | |||||||||||||
Components of net periodic benefit cost: | ||||||||||||||||||
Service cost | $ | 3.3 | $ | 3.9 | $ | 0.4 | $ | 0.7 | $ | 3.7 | $ | 4.6 | ||||||
Interest cost | 6.7 | 13.0 | 2.8 | 3.1 | 9.5 | 16.1 | ||||||||||||
Expected return on plan assets | (7.5 | ) | (17.9 | ) | (2.7 | ) | (4.2 | ) | (10.2 | ) | (22.1 | ) | ||||||
Amortization of prior service cost | 0.4 | 0.8 | — | — | 0.4 | 0.8 | ||||||||||||
Amortization of net actuarial loss | 3.7 | 9.6 | 0.8 | 1.3 | 4.5 | 10.9 | ||||||||||||
Pension settlements | — | 213.6 | — | — | — | 213.6 | ||||||||||||
Net periodic benefit cost | $ | 6.6 | $ | 223.0 | $ | 1.3 | $ | 0.9 | $ | 7.9 | $ | 223.9 | ||||||
On November 30, 2015, The Timken Company Pension Plan (the Plan) purchased a group annuity contract from Prudential Insurance Company of America (Prudential) to pay and administer future pension benefits for approximately 3,400 U.S. Timken retirees. Pension settlement charges of $1.2 million incurred for the three months ended March 31, 2016 were due to professional fees associated with the implementation of this group annuity contract.
On January 23, 2015, the Timken-Latrobe-MPB-Torrington Retirement Plan purchased a group annuity contract from Prudential to pay and administer future pension benefits for approximately 5,000 U.S. Timken retirees. The Company transferred approximately $575 million of the Company's pension obligations and $635 million of pension assets to Prudential in this transaction. In addition to the purchase of the group annuity contract, the Company made lump sum distributions to new retirees of $11 million in 2015. As a result of the purchase of the group annuity contract and the lump sum distributions, the Company incurred pension settlement charges of $215.2 million, including professional fees of $1.6 million, for the three months ended March 31, 2015.
16
Note 13 - Other Postretirement Benefit Plans
The following table sets forth the net periodic benefit cost for the Company’s other postretirement benefit plans. The amounts for the three months ended March 31, 2016 are based on calculations prepared by the Company's actuaries during the fourth quarter of 2015 and represent the Company’s best estimate of the period's proportionate share of the amounts to be recorded for the year ending December 31, 2016.
Three Months Ended March 31, | ||||||
2016 | 2015 | |||||
Components of net periodic benefit cost: | ||||||
Service cost | $ | 0.1 | $ | 0.1 | ||
Interest cost | 2.7 | 2.7 | ||||
Expected return on plan assets | (1.6 | ) | (1.8 | ) | ||
Amortization of prior service cost | 0.2 | 0.2 | ||||
Net periodic benefit cost | $ | 1.4 | $ | 1.2 | ||
Note 14 - Income Taxes
The Company's provision for income taxes in interim periods is computed by applying the estimated annual effective tax rates to income or loss before income taxes for the period. In addition, non-recurring or discrete items, including interest on prior year tax liabilities, are recorded during the period(s) in which they occur.
Three Months Ended March 31, | ||||||
2016 | 2015 | |||||
Provision (benefit) for income taxes | $ | 27.6 | $ | (21.3 | ) | |
Effective tax rate | 30.5 | % | 13.6 | % | ||
In accordance with ASC Topic 740, "Income Taxes," the effective tax rate in the first quarter of 2016 was computed based on an expected annual effective tax rate, excluding discrete items. Discrete tax items are recorded in the period in which they occur. The effective tax rate of 30.5% in the first quarter of 2016 was lower than the U.S. federal statutory rate of 35% primarily due to tax benefits related to foreign tax credits, earnings in certain foreign jurisdictions where the effective tax rate is less than 35% and other U.S. tax benefits, such as the Research and Experimentation credit and the U.S. manufacturing deduction. These factors were partially offset by U.S. taxation of foreign earnings, losses at certain foreign subsidiaries where no tax benefit could be recorded, U.S. state and local taxes and the impact of certain discrete tax items during the period.
The effective tax rate in the first quarter of 2015 was computed based on the expected annual effective tax rate, excluding discrete items. At that time, the Company expected pretax income for the year with an estimated effective tax rate of 15.3% (i.e., tax expense) excluding discrete items. The expected effective tax rate of 15.3% was lower than the U.S. federal statutory rate of 35% primarily due to lower U.S. earnings due to pension settlement charges, earnings in certain foreign jurisdictions where the effective tax rate is less than 35%, tax benefits related to foreign tax credits, U.S. state and local taxes and the U.S. manufacturing deduction. These factors were partially offset by U.S. taxation of foreign earnings, and losses at certain foreign subsidiaries where no tax benefit could be recorded. As the first quarter of 2015 resulted in a pretax loss, a tax benefit was recorded at the expected annual effective tax rate plus the impact of discrete tax items during the period, which resulted in an effective tax rate for the first quarter of 2015 of 13.6%.
17
Note 15 - Fair Value
Fair value is defined as the price that would be received to sell an asset or paid to transfer a liability in an orderly transaction between market participants at the measurement date (exit price). The FASB provides accounting rules that classify the inputs used to measure fair value into the following hierarchy:
Level 1 – Unadjusted quoted prices in active markets for identical assets or liabilities.
Level 2 – Unadjusted quoted prices in active markets for similar assets or liabilities, or unadjusted quoted prices for identical or similar assets or liabilities in markets that are not active, or inputs other than quoted prices that are observable for the asset or liability.
Level 3 – Unobservable inputs for the asset or liability.
The following tables present the fair value hierarchy for those financial assets and liabilities measured at fair value on a recurring basis as of March 31, 2016 and December 31, 2015:
March 31, 2016 | ||||||||||||
Total | Level 1 | Level 2 | Level 3 | |||||||||
Assets: | ||||||||||||
Cash and cash equivalents | $ | 123.9 | $ | 123.9 | $ | — | $ | — | ||||
Cash and cash equivalents measured at net asset value | 13.4 | |||||||||||
Restricted cash | 0.2 | 0.2 | — | — | ||||||||
Short-term investments | 9.8 | — | 9.8 | — | ||||||||
Short-term investments measured at net asset value | 0.5 | |||||||||||
Foreign currency hedges | 3.1 | — | 3.1 | — | ||||||||
Total Assets | $ | 150.9 | $ | 124.1 | $ | 12.9 | $ | — | ||||
Liabilities: | ||||||||||||
Foreign currency hedges | $ | 3.9 | $ | — | $ | 3.9 | $ | — | ||||
Total Liabilities | $ | 3.9 | $ | — | $ | 3.9 | $ | — | ||||
December 31, 2015 | ||||||||||||
Total | Level 1 | Level 2 | Level 3 | |||||||||
Assets: | ||||||||||||
Cash and cash equivalents | $ | 110.2 | $ | 110.2 | $ | — | $ | — | ||||
Cash and cash equivalents measured net asset value | 19.4 | |||||||||||
Restricted cash | 0.2 | 0.2 | — | — | ||||||||
Short-term investments | 8.9 | — | 8.9 | — | ||||||||
Short-term investments measured at net asset value | 0.8 | |||||||||||
Foreign currency hedges | 8.2 | — | 8.2 | — | ||||||||
Total Assets | $ | 147.7 | $ | 110.4 | $ | 17.1 | $ | — | ||||
Liabilities: | ||||||||||||
Foreign currency hedges | $ | 0.4 | $ | — | $ | 0.4 | $ | — | ||||
Total Liabilities | $ | 0.4 | $ | — | $ | 0.4 | $ | — | ||||
Cash and cash equivalents are highly liquid investments with maturities of three months or less when purchased and are generally valued at the redemption value. Short-term investments are investments with maturities between four months and one year and are generally valued at amortized cost. A portion of the cash and cash equivalents and short-term investment are valued based on net asset value. The Company uses publicly available foreign currency forward and spot rates to measure the fair value of its foreign currency forward contracts.
The Company does not believe it has significant concentrations of risk associated with the counterparts to its financial instruments.
18
The following table presents those assets measured at fair value on a nonrecurring basis for the three months ended March 31, 2016 using Level 3 inputs:
Carrying Value | Fair Value Adjustment | Fair Value | |||||||
Long-lived assets held for sale: | |||||||||
Land | $ | 0.2 | $ | (0.2 | ) | $ | — | ||
Total long-lived assets held for sale | $ | 0.2 | $ | (0.2 | ) | $ | — | ||
Long-lived assets held and used: | |||||||||
Altavista bearing plant | $ | 5.7 | $ | (2.4 | ) | $ | 3.3 | ||
Total long-lived assets held and used | $ | 5.7 | $ | (2.4 | ) | $ | 3.3 | ||
Assets held for sale of $0.2 million were written down to their fair value of zero during the first quarter of 2016, resulting in an impairment charge of $0.2 million. The fair value of these assets was based on the price that the Company expects to receive when it disposes of these assets.
On March 17, 2016, the Company announced the closure of its Altavista bearing plant. The plant is expected to close in approximately one year, with production transferring to its bearing plant near Lincolnton, North Carolina. The Altavista bearing plant, with a carrying value of $5.7 million, was written down to its fair value of $3.3 million during the first quarter of 2016, resulting in an impairment of $2.4 million. The fair value for the plant was based on the price that the Company expects to receive from the sale of this facility.
The following table presents those assets measured at fair value on a nonrecurring basis for the three months ended March 31, 2015 using Level 3 inputs:
Carrying Value | Fair Value Adjustment | Fair Value | |||||||
Long-lived assets held for sale: | |||||||||
Repair business | $ | 5.2 | $ | (2.5 | ) | $ | 2.7 | ||
Total long-lived assets held for sale | $ | 5.2 | $ | (2.5 | ) | $ | 2.7 | ||
Long-lived assets held and used: | |||||||||
Fixed assets | $ | 0.7 | $ | (0.2 | ) | $ | 0.5 | ||
Total long-lived assets held and used | $ | 0.7 | $ | (0.2 | ) | $ | 0.5 | ||
Assets held for sale of $5.2 million associated with the Company's repair business in Niles, Ohio were written down to their fair value of $2.7 million during the first quarter of 2015, resulting in an impairment charge of $2.5 million. The fair value of these assets was based on the price that the Company expected to receive from the sale of these assets. This business was subsequently sold during the second quarter of 2015 for an immaterial loss.
Various items of property, plant and equipment, with a carrying value of $0.7 million, were written down to their fair value of $0.5 million during the first quarter of 2015, resulting in an impairment charge of $0.2 million. The fair value for these assets was based on the price that would be received in a current transaction to sell the assets on a standalone basis, considering the age and physical attributes of these items, as these assets had been idled.
Financial Instruments:
The Company’s financial instruments consist primarily of cash and cash equivalents, restricted cash, short-term investments, accounts receivable, net, accounts payable, trade, short-term borrowings and long-term debt. Due to their short-term nature, the carrying value of cash and cash equivalents, restricted cash, short-term investments, accounts receivable, net, accounts payable, trade and short-term borrowings are a reasonable estimate of their fair value. The fair value of the Company’s long-term fixed-rate debt, based on quoted market prices, was $549.6 million and $521.5 million at March 31, 2016 and December 31, 2015, respectively. The carrying value of this debt was $519.6 million and $520.4 million at March 31, 2016 and December 31, 2015, respectively. The fair value of long-term fixed-debt was measured using Level 2 inputs.
19
Note 16 - Derivative Instruments and Hedging Activities
The Company is exposed to certain risks relating to its ongoing business operations. The primary risks managed by using derivative instruments are foreign currency exchange rate risk, commodity price risk and interest rate risk. Forward exchange contracts on various foreign currencies are entered into in order to manage the foreign currency exchange rate risk associated with certain of the Company’s commitments denominated in foreign currencies. Forward contracts on various commodities are entered into in order to manage the price risk associated with forecasted purchases of natural gas used in the Company’s manufacturing process. Interest rate swaps are used to manage interest rate risk associated with the Company’s fixed and floating-rate borrowings.
The Company designates certain foreign currency forward contracts as cash flow hedges of forecasted revenues and certain interest rate hedges as fair value hedges of fixed-rate borrowings. The majority of the Company’s natural gas forward contracts are not subject to any hedge designation as they are considered within the normal purchases exemption.
The Company does not purchase or hold any derivative financial instruments for trading purposes. As of March 31, 2016 and December 31, 2015, the Company had $224.5 million and $235.7 million, respectively, of outstanding foreign currency forward contracts at notional value. Refer to Note 15 - Fair Value for the fair value disclosure of derivative financial instruments.
Cash Flow Hedging Strategy:
For certain derivative instruments that are designated as and qualify as cash flow hedges (i.e., hedging the exposure to variability in expected future cash flows that is attributable to a particular risk), the effective portion of the gain or loss on the derivative instrument is reported as a component of other comprehensive income and reclassified into earnings in the same line item associated with the forecasted transaction and in the same period or periods during which the hedged transaction affects earnings. The remaining gain or loss on the derivative instrument in excess of the cumulative change in the present value of future cash flows of the hedged item, if any (i.e., the ineffective portion), or hedge components excluded from the assessment of effectiveness, are recognized in the Consolidated Statement of Income during the current period.
To protect against a reduction in the value of forecasted foreign currency cash flows resulting from export sales over the next year, the Company has instituted a foreign currency cash flow hedging program. The Company hedges portions of its forecasted intra-group revenue or expense denominated in foreign currencies with forward contracts. When the dollar strengthens significantly against foreign currencies, the decline in the present value of future foreign currency revenue is offset by gains in the fair value of the forward contracts designated as hedges. Conversely, when the dollar weakens, the increase in the present value of future foreign currency cash flows is offset by losses in the fair value of the forward contracts.
The maximum length of time over which the Company hedges its exposure to the variability in future cash flows for forecasted transactions is generally eighteen months or less.
Fair Value Hedging Strategy:
For derivative instruments that are designated and qualify as fair value hedges (i.e., hedging the exposure to changes in the fair value of an asset or a liability or an identified portion thereof that is attributable to a particular risk), the gain or loss on the derivative instrument as well as the offsetting loss or gain on the hedged item attributable to the hedged risk are recognized in the same line item associated with the hedged item (i.e., in “interest expense” when the hedged item is fixed-rate debt).
Purpose for Derivative Instruments not Designated as Hedging Instruments:
For derivative instruments that are not designated as hedging instruments, the instruments are typically forward contracts. In general, the practice is to reduce volatility by selectively hedging transaction exposures including intercompany loans, accounts payable and accounts receivable. Intercompany loans between entities with different functional currencies are typically hedged with a forward contract at the inception of the loan with a maturity date at the maturity of the loan. The revaluation of these contracts, as well as the revaluation of the underlying balance sheet items, is recorded directly to the income statement so the adjustment generally offsets the revaluation of the underlying balance sheet items to protect cash payments and reduce income statement volatility.
20
The following table presents the fair value and location of all assets and liabilities associated with the Company's hedging instruments within the Consolidated Balance Sheets.
Asset Derivatives | Liability Derivatives | ||||||||||||
Derivatives designated as hedging instruments | Balance Sheet Location | Fair Value at 3/31/16 | Fair Value at 12/31/15 | Fair Value at 3/31/16 | Fair Value at 12/31/15 | ||||||||
Foreign currency forward contracts | Other non-current assets/liabilities | $ | 0.2 | $ | 2.2 | $ | 2.2 | $ | 0.2 | ||||
Total derivatives designated as hedging instruments | 0.2 | 2.2 | 2.2 | 0.2 | |||||||||
Derivatives not designated as hedging instruments | |||||||||||||
Foreign currency forward contracts | Other non-current assets/liabilities | 2.9 | 6.0 | 1.7 | 0.2 | ||||||||
Total Derivatives | $ | 3.1 | $ | 8.2 | $ | 3.9 | $ | 0.4 | |||||
The following tables present the impact of derivative instruments and their location within the Consolidated Statements of Income:
Amount of gain or (loss) recognized in Other Comprehensive Income (OCI) on derivative instruments | ||||||
Three Months Ended March 31, | ||||||
Derivatives in cash flow hedging relationships | 2016 | 2015 | ||||
Foreign currency forward contracts | $ | (2.9 | ) | $ | 0.6 | |
Total | $ | (2.9 | ) | $ | 0.6 | |
Amount of gain or (loss) reclassified from Accumulated Other Comprehensive Income (AOCI) into income (effective portion) | ||||||
Three Months Ended March 31, | ||||||
Derivatives in cash flow hedging relationships | 2016 | 2015 | ||||
Foreign currency forward contracts | $ | 0.9 | $ | 0.7 | ||
Interest rate swaps | (0.1 | ) | (0.1 | ) | ||
Total | $ | 0.8 | $ | 0.6 | ||
Amount of gain or (loss) recognized in income on derivative instruments | |||||||
Three Months Ended March 31, | |||||||
Derivatives not designated as hedging instruments | Location of gain or (loss) recognized in income on derivative | 2016 | 2015 | ||||
Foreign currency forward contracts | Other (expense) income, net | $ | (4.6 | ) | $ | 13.4 | |
Total | $ | (4.6 | ) | $ | 13.4 | ||
21
Note 17 - Continued Dumping and Subsidy Offset Act (CDSOA)
CDSOA provides for distribution of monies collected by U.S. Customs and Border Protection (U.S. Customs) on entries of merchandise subject to antidumping orders that entered the U.S. prior to October 1, 2007 to qualifying domestic producers where the domestic producers have continued to invest in their technology, equipment and people. During the first three months of 2016, the Company recognized pretax CDSOA income, net of related expenses, of $47.7 million.
In September 2002, the World Trade Organization (WTO) ruled that CDSOA payments are not consistent with international trade rules. In February 2006, U.S. legislation was enacted that ended CDSOA distributions for dumped imports covered by antidumping duty orders entering the United States after September 30, 2007. Instead, any such antidumping duties collected would remain with the U.S. Treasury.
CDSOA has been the subject of significant litigation since 2002, and U.S. customs has withheld CDSOA distributions in recent years while litigation was ongoing. In recent months, much of the CDSOA litigation that involves antidumping orders where Timken is a qualifying domestic producer has concluded.
As a result, the Company was notified by letters dated March 25, 2016 that funds were being distributed to the Company. On April 1, 2016, the Company received CDSOA distributions of $48.1 million in the aggregate, representing funds that would have been distributed to Timken at the end of calendar years 2011 through 2015.
At March 31, 2016, the Company recorded a sundry receivable of $48.1 million, which was included in other current assets on the Consolidated Balance Sheet.
While some of the challenges to CDSOA have been resolved, others are still in litigation. Since there continue to be legal challenges to CDSOA, U.S. Customs has advised all affected domestic producers that it is possible that CDSOA distributions could be subject to clawback. Management of the Company believes that the likelihood of any clawback is remote.
22
ITEM 2. MANAGEMENT'S DISCUSSION AND ANALYSIS OF FINANCIAL CONDITION AND RESULTS OF OPERATIONS
(Dollars in millions, except per share data)
Overview
Introduction:
The Timken Company engineers, manufactures and markets bearings, transmissions, gearboxes, belts, chain and related products and offers a spectrum of power system rebuild and repair services. The Company’s growing product and services portfolio features many strong industrial brands, such as Timken, Fafnir, Philadelphia Gear, Carlisle, Drives and Interlube. Timken today applies its deep knowledge of metallurgy, friction management and mechanical power transmission across the broad spectrum of bearings and related systems to improve the reliability and efficiency of machinery and equipment all around the world. Known for its quality products and collaborative technical sales model, Timken focuses on providing value to diverse markets worldwide through both original equipment manufacturers (OEMs) and aftermarket channels. With more than 14,000 people operating in 28 countries, Timken makes the world more productive and keeps industry in motion. The Company operates under two reportable segments: (1) Mobile Industries and (2) Process Industries. The following further describes these business segments:
• | Mobile Industries serves OEM customers that manufacture off-highway equipment for the agricultural, mining and construction markets; on-highway vehicles including passenger cars, light trucks, and medium- and heavy-duty trucks; rail cars and locomotives; and rotorcraft and fixed-wing aircraft. Beyond service parts sold to OEMs, aftermarket sales to individual end users, equipment owners, operators and maintenance shops are handled through the Company's extensive network of authorized automotive and heavy-truck distributors. |
• | Process Industries serves OEM and end-user customers in industries that place heavy demands on the fixed operating equipment they make or use in heavy and other general industrial sectors. This includes metals, cement and aggregate production; coal and wind power generation; oil and gas extraction and refining; pulp and paper and food processing; and health and critical motion control equipment. Other applications include marine equipment, gear drives, cranes, hoists and conveyors. This segment also supports aftermarket sales and service needs through its global network of authorized industrial distributors. |
Timken creates value by understanding customer needs and applying its know-how in attractive market sectors. Timken’s business strengths include its channel mix and end-market diversity, serving a broad range of customers and industries across the globe. The Company collaborates with OEMs to improve equipment efficiency with its engineered products and captures subsequent equipment replacement cycles by selling through independent channels in the aftermarket. Timken focuses its international efforts and footprint in regions of the world where strong macroeconomic factors such as urbanization, infrastructure development and sustainability create demand for its products and services.
23
The Timken Business Model is the specific framework for how the Company evaluates opportunities and differentiates itself in the market.
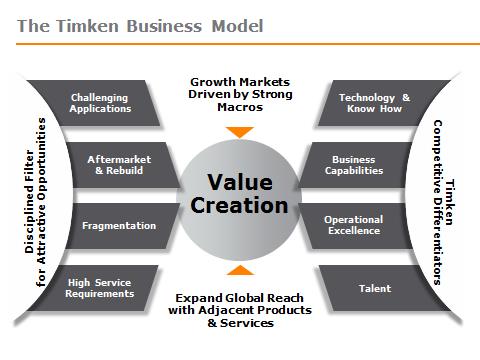
The Company’s Strategy is to apply the Timken Business Model and leverage the Company’s competitive differentiators and strengths to create customer value and drive increased growth and profitability by:
Capturing Opportunities and Expanding Reach. The Company intends to expand into new and existing markets by leveraging its collective knowledge of metallurgy, friction management and mechanical power transmission to create value for Timken customers. Using a highly collaborative technical selling approach, the Company places particular emphasis on creating unique solutions for challenging and/or demanding applications. The Company intends to grow in attractive market sectors around the world, emphasizing those spaces that are highly fragmented, demand high service and value the reliability and efficiency offered by Timken products. The Company also targets those applications that offer significant aftermarket demand, thereby providing product and services revenue throughout the equipment’s lifetime.
Performing With Excellence. Timken operates with a relentless drive for exceptional results and a passion for superior execution. The Company embraces a continuous improvement culture that is charged with increasing efficiency, lowering costs, eliminating waste, encouraging organizational agility and building greater brand equity to fuel future growth. This requires the Company’s ongoing commitment to attract, retain and develop the best talent across the world.
Driving Effective Capital Deployment. The Company is intently focused on providing the highest returns for shareholders through its capital allocation framework, which includes (1) investing in the core business through capital expenditures, research and development and organic growth initiatives like DeltaX; (2) pursuing strategic acquisitions to broaden our portfolio and capabilities, with an focus on bearings, adjacent power transmission products and related services; and (3) returning capital to shareholders through share repurchases and dividends. As part of this framework, the Company may also restructure, reposition or divest underperforming product lines or assets.
24
The following items highlight the Company's most recent accomplishments:
• | On February 3, 2016, the Company announced that its Board of Directors approved a new share repurchase plan pursuant to which the Company may purchase up to five million of its common shares, in the aggregate. This share purchase plan expires on January 31, 2017. |
• | On February 15, 2016, the Company received a multi-year contract from the U.S. Department of Defense to provide engineering and supply Philadelphia Gear main reduction gears for the Navy's next generation of Arleigh Burke DDG 51 class ships. The fixed price contract includes options which, if exercised, could bring the cumulative value of the contract to more than $1 billion over its estimated 10-year life. |
• | On March 17, 2016, the Company announced that its Altavista bearing plant will close in approximately one year, with production transferring to its bearing plant near Lincolnton, North Carolina. |
• | During the first quarter of 2016, the Company completed the installation of aerospace transmission overhaul and repair equipment at its plant in Manchester, Connecticut. This equipment adds new capabilities and will support a contract secured in 2015 to overhaul and repair up to roughly 220 Apache AH64D main transmissions for the U.S. Department of Defense (DoD) over a three-year period. |
25
Overview:
Three Months Ended March 31, | |||||||||||
2016 | 2015 | $ Change | % Change | ||||||||
Net sales | $ | 684.0 | $ | 722.5 | $ | (38.5 | ) | (5.3 | )% | ||
Income (loss) | 62.9 | (134.8 | ) | 197.7 | (146.7 | )% | |||||
Net (loss) income attributable to noncontrolling interest | (0.1 | ) | 0.4 | (0.5 | ) | (125.0 | )% | ||||
Net income (loss) attributable to The Timken Company | $ | 63.0 | $ | (135.2 | ) | $ | 198.2 | (146.6 | )% | ||
Diluted earnings (loss) per share | $ | 0.78 | $ | (1.54 | ) | $ | 2.32 | (150.6 | )% | ||
Average number of shares – diluted | 80,437,533 | 87,670,640 | — | (8.3 | )% | ||||||
The decrease in sales in the first quarter of 2016 compared to the first quarter of 2015 was primarily due to lower end market demand and the impact of foreign currency exchange rate changes, partially offset by the net benefit of acquisitions and divestitures. The Company's net income for the first quarter of 2016 was higher than the first quarter of 2015 primarily due to non-cash pretax pension settlement charges of $215.2 million recorded during the prior-year period and pretax CDSOA income, net of related expenses, of $47.7 million recorded during the first quarter of 2016. In addition to pension settlement charges and CDSOA income, the Company's net income for the first quarter of 2016 was lower than the first quarter of 2015 due to the impact of lower volume across most market sectors, unfavorable price/mix, the impact of foreign currency exchange rate changes and higher restructuring charges recorded during the first quarter of 2016, partially offset by lower raw material and operating costs and lower selling, general and administrative expenses.
Outlook:
The Company expects 2016 full-year sales to decline approximately 5% compared to 2015, driven by lower volume across most market sectors and the estimated impact of foreign currency exchange rate changes, partially offset by the net benefit of acquisitions and divestitures. The Company's earnings are expected to be higher in 2016 compared to 2015, primarily due to significantly lower pension settlement charges and the addition of CDSOA income, net of related expenses. Excluding pension settlement charges and CDSOA income, earnings are expected to decline in 2016 compared to 2015, driven by lower volume, unfavorable price/mix, the impact of foreign currency exchange rate changes and higher restructuring charges. These factors are expected to be partially offset by lower raw material and operating costs and lower selling, general and administrative expenses.
The Company expects to generate operating cash of approximately $340 million in 2016, a decrease of approximately $35 million, or 9%, compared to 2015, as the Company anticipates lower net income excluding non-cash pension settlement and impairment charges and less cash generated from working capital, offset partially by CDSOA income. Pension contributions are expected to be approximately $15 million in 2016, compared to $10.8 million in 2015. The Company expects capital expenditures of approximately 4.5% of sales in 2016, compared to 3.7% of sales in 2015.
26
The Statement of Income
Sales:
Three Months Ended March 31, | |||||||||||
2016 | 2015 | $ Change | % Change | ||||||||
Net Sales | $ | 684.0 | $ | 722.5 | $ | (38.5 | ) | (5.3 | )% | ||
Net sales decreased for the first quarter of 2016 compared to the first quarter of 2015, primarily due to lower organic sales of $44 million, the effect of foreign currency exchange rate changes of $20 million and divestitures of $5 million, partially offset by the benefit of acquisitions of $30 million. The decrease in organic sales volume was driven by lower demand across most of the Company's market sectors, partially offset by growth in the automotive and wind energy market sectors.
Gross Profit:
Three Months Ended March 31, | |||||||||||
2016 | 2015 | $ Change | Change | ||||||||
Gross profit | $ | 180.9 | $ | 202.5 | $ | (21.6 | ) | (10.7)% | |||
Gross profit % to net sales | 26.4 | % | 28.0 | % | (160) bps | ||||||
Gross profit decreased in the first quarter of 2016 compared to the first quarter of 2015 primarily due to the impact of lower volume of $18 million, unfavorable price/mix of $16 million and the impact of foreign currency exchange rate changes of $5 million. These factors were partially offset by $17 million of lower raw material and operating costs (net of unfavorable manufacturing utilization).
Selling, General and Administrative Expenses:
Three Months Ended March 31, | |||||||||||
2016 | 2015 | $ Change | Change | ||||||||
Selling, general and administrative expenses | $ | 118.3 | $ | 128.5 | $ | (10.2 | ) | (7.9)% | |||
Selling, general and administrative expenses % to net sales | 17.3 | % | 17.8 | % | — | (50) bps | |||||
The decrease in selling, general and administrative expenses in the first quarter of 2016 compared to the first quarter of 2015 was primarily due to the benefit of cost reduction initiatives and lower discretionary spending of $9 million and the impact of foreign currency exchange rate changes of $3 million, partially offset by $3 million of additional expenses from the belts business acquired in September 2015.
27
Impairment and Restructuring:
Three Months Ended March 31, | |||||||||||
2016 | 2015 | $ Change | % Change | ||||||||
Impairment charges | $ | 2.6 | $ | 2.7 | $ | (0.1 | ) | (3.7 | )% | ||
Severance and related benefit costs | 7.7 | 0.4 | 7.3 | NM | |||||||
Exit costs | 0.2 | 3.1 | (2.9 | ) | (93.5 | )% | |||||
Total | $ | 10.5 | $ | 6.2 | $ | 4.3 | 69.4 | % | |||
Impairment and restructuring charges of $10.5 million in the first quarter of 2016 were primarily comprised of severance and related benefit costs of $7.7 million related to initiatives to reduce headcount and right-size the Company's manufacturing footprint, including the planned closure of the Altavista bearing plant. In addition, the Company also recognized impairment charges of $2.4 million associated with the planned closure of the Altavista bearing plant. Impairment and restructuring charges of $6.2 million in the first quarter of 2015 were primarily comprised of exit costs of $3.0 million related to the Company's termination of its relationship with one of its third-party sales representatives in Colombia and impairment charges of $2.5 million related to the shutdown of the Company's service center in Niles, Ohio.
Pension Settlement Charges:
Three Months Ended March 31, | |||||||||||
2016 | 2015 | $ Change | % Change | ||||||||
Pension settlement charges | $ | 1.2 | $ | 215.2 | $ | (214.0 | ) | (99.4 | )% | ||
Pension settlement charges recorded in the first quarter of 2016 were primarily due to implementation costs associated with a group annuity contract purchased from Prudential on November 30, 2015 for one of the Company's U.S. defined benefit pension plans. Pension settlement charges recorded in the first quarter of 2015 were primarily due to the purchase of a group annuity contact from Prudential for another of the Company's U.S. defined benefit pension plans, which was executed in January 2015. In addition to the purchase of the group annuity contract, the Company made lump sum distributions to new retirees of approximately $11 million in 2015. As a result of the purchase of the group annuity contract and the lump sum distributions, the Company incurred pension settlement charges of $215.2 million during the first quarter of 2015.
Interest Income and (Expense):
Three Months Ended March 31, | |||||||||||
2016 | 2015 | $ Change | % Change | ||||||||
Interest (expense) | $ | (8.4 | ) | $ | (8.0 | ) | $ | (0.4 | ) | 5.0 | % |
Interest income | $ | 0.3 | $ | 0.7 | $ | (0.4 | ) | (57.1 | )% | ||
Other Income (Expense):
Three Months Ended March 31, | |||||||||||
2016 | 2015 | $ Change | % Change | ||||||||
CDSOA income, net of related expenses | $ | 47.7 | $ | — | $ | 47.7 | NM | ||||
Other (expense) income, net | — | (1.4 | ) | 1.4 | (100.0 | )% | |||||
Total other income (expense) | $ | 47.7 | $ | (1.4 | ) | $ | 49.1 | NM | |||
CDSOA income, net of related expenses, in the first quarter of 2016 represents income recorded in connection with funds awarded to the Company from monies collected by U.S. Customs from antidumping cases. Refer to Note 17 - Continued Dumping and Subsidy Offset Act (CDSOA) for further discussion.
28
Income Tax Expense:
Three Months Ended March 31, | |||||||||||
2016 | 2015 | $ Change | Change | ||||||||
Income tax expense (benefit) | $ | 27.6 | $ | (21.3 | ) | $ | 48.9 | (229.6 | )% | ||
Effective tax rate | 30.5 | % | 13.6 | % | — | 1,690 | bps | ||||
The effective tax rate in the first quarter of 2016 (30.5%, or $27.6 million tax expense on income of $90.5 million) increased compared to the first quarter of 2015 (13.6%, or $21.3 million tax benefit on a loss of $156.1 million).
In accordance with ASC Topic 740, "Income Taxes," the effective tax rate in the first quarter of 2016 was computed based on an expected annual effective tax rate, excluding discrete items. Discrete tax items are recorded in the period in which they occur. The effective tax rate of 30.5% in the first quarter of 2016 was lower than the U.S. federal statutory rate of 35% primarily due to tax benefits related to foreign tax credits, earnings in certain foreign jurisdictions where the effective tax rate is less than 35% and other U.S. tax benefits, such as the Research and Experimentation credit and the U.S. manufacturing deduction. These factors were partially offset by U.S. taxation of foreign earnings, losses at certain foreign subsidiaries where no tax benefit could be recorded, U.S. state and local taxes and the impact of certain discrete tax items during the period.
The effective tax rate in the first quarter of 2015 was computed based on the expected annual effective tax rate, excluding discrete items. At that time, the Company expected pretax income for the year with an estimated effective tax rate of 15.3% (i.e., tax expense) excluding discrete items. The expected effective tax rate of 15.3% was lower than the U.S. federal statutory rate of 35% primarily due to lower U.S. earnings due to pension settlement charges, earnings in certain foreign jurisdictions where the effective tax rate is less than 35%, tax benefits related to foreign tax credits, U.S. state and local taxes and the U.S. manufacturing deduction. These factors were partially offset by U.S. taxation of foreign earnings, and losses at certain foreign subsidiaries where no tax benefit could be recorded. As the first quarter of 2015 resulted in a pretax loss, a tax benefit was recorded at the expected annual effective tax rate plus the impact of discrete tax items during the period, which resulted in an effective tax rate for the first quarter of 2015 of 13.6%.
This increase in the effective tax rate from 2015 to 2016 was primarily due to higher earnings in the United States, lower tax benefits related to foreign tax credits and higher U.S. state and local taxes, partially offset by higher earnings in certain foreign jurisdictions where the effective tax rate is less than 35%, lower U.S. taxation for foreign earnings and the net effect of discrete tax items.
29
Business Segments
The Company's reportable segments are business units that serve different industry sectors. While the segments often operate using shared infrastructure, each reportable segment is managed to address specific customer needs in these diverse market segments. The primary measurement used by management to measure the financial performance of each segment is EBIT. Refer to Note 10 - Segment Information in the Notes to the Consolidated Financial Statements for the reconciliation of EBIT by segment to consolidated income before income taxes.
The presentation of segment results below includes a reconciliation of the changes in net sales for each segment reported in accordance with U.S. GAAP to net sales adjusted to remove the effects of acquisitions and divestitures completed in 2015 and foreign currency exchange rate changes. The effects of acquisitions, divestitures and foreign currency exchange rate changes on net sales are removed to allow investors and the Company to meaningfully evaluate the percentage change in net sales on a comparable basis from period to period.
The following items highlight the Company's acquisitions and divestitures completed in 2015.
• | During the fourth quarter of 2015, the Company sold all of the outstanding stock of Timken Alcor Aerospace Technologies, Inc. (Alcor). Results for Alcor prior to the sale were reported in the Mobile Industries segment. |
• | During the third quarter of 2015, the Company acquired the membership interests of Carlstar Belt LLC (the Belts business). Results for the Belts business are reported in the Mobile Industries and Process Industries segments based on the customers and underlying markets served. |
Mobile Industries Segment:
Three Months Ended March 31, | ||||||||||
2016 | 2015 | $ Change | % Change | |||||||
Net sales | $ | 383.2 | $ | 393.0 | $ | (9.8 | ) | (2.5)% | ||
EBIT | $ | 30.2 | $ | 35.4 | $ | (5.2 | ) | (14.7)% | ||
EBIT margin | 7.9 | % | 9.0 | % | — | (110) bps | ||||
Three Months Ended March 31, | ||||||||||
2016 | 2015 | $ Change | % Change | |||||||
Net sales | $ | 383.2 | $ | 393.0 | $ | (9.8 | ) | (2.5)% | ||
Less: Acquisitions | 18.3 | — | 18.3 | NM | ||||||
Divestitures | (4.6 | ) | — | (4.6 | ) | NM | ||||
Currency | (10.9 | ) | — | (10.9 | ) | NM | ||||
Net sales, excluding the impact of acquisitions, divestitures and currency | $ | 380.4 | $ | 393.0 | $ | (12.6 | ) | (3.2)% | ||
The Mobile Industries segment's net sales, excluding the effects of acquisitions, divestitures and foreign currency exchange rate changes, decreased $12.6 million or 3.2% in the first quarter of 2016 compared to the first quarter of 2015. The decline in net sales was primarily driven by a decrease in the off-highway (mainly mining and agriculture), rail and aerospace market sectors, partially offset by organic growth in the automotive market sector. EBIT decreased in the first quarter of 2016 compared to the first quarter of 2015 primarily due to unfavorable price/mix of $13 million, higher restructuring charges of $5 million and the impact of lower volume of $4 million, partially offset by lower raw material and operating costs (net of unfavorable manufacturing utilization) of $15 million and lower selling, general and administrative expenses of $4 million.
Full-year sales for the Mobile Industries segment are expected to be down approximately 6% in 2016 compared to 2015. This reflects lower expected volume in the rail, off-highway, aerospace and heavy truck market sectors and the estimated impact of foreign currency exchange rate changes, partially offset by growth in the automotive market sector and the net benefit of acquisitions and divestitures. EBIT for the Mobile Industries segment is expected to decrease in 2016 compared to 2015 due to the impact of lower volume and unfavorable price/mix, partially offset by lower raw material and operating costs and lower selling, general and administrative expenses. In addition, 2015 benefited from the gain on the sale of Alcor.
30
Process Industries Segment:
Three Months Ended March 31, | ||||||||||
2015 | 2014 | $ Change | Change | |||||||
Net sales | $ | 300.8 | $ | 329.5 | $ | (28.7 | ) | (8.7)% | ||
EBIT | $ | 32.6 | $ | 45.2 | $ | (12.6 | ) | (27.9)% | ||
EBIT margin | 10.8 | % | 13.7 | % | — | (290) bps | ||||
Three Months Ended March 31, | ||||||||||
2016 | 2015 | $ Change | % Change | |||||||
Net sales | $ | 300.8 | $ | 329.5 | $ | (28.7 | ) | (8.7)% | ||
Less: Acquisitions | 11.7 | — | 11.7 | NM | ||||||
Currency | (9.2 | ) | — | (9.2 | ) | NM | ||||
Net sales, excluding the impact of acquisitions and currency | $ | 298.3 | $ | 329.5 | $ | (31.2 | ) | (9.5)% | ||
The Process Industries segment's net sales, excluding the effects of acquisitions and foreign currency exchange rate changes, decreased $31.2 million or 9.5% in the first quarter of 2016 compared to the same period in 2015. The decline was primarily due to lower demand in the heavy industries market sector (driven largely by oil and gas and power generation) and across the industrial aftermarket. EBIT was lower in the first quarter of 2016 compared to the first quarter of 2015 primarily due to the impact of lower volume of $14 million, the impact of foreign currency exchange rate changes of $5 million and unfavorable price/mix of $3 million, partially offset by lower selling, general and administrative expenses of $5 million and lower raw material costs of $3 million.
Full-year sales for the Process Industries segment are expected to be down approximately 4% in 2016 compared to 2015. This reflects weaker demand in the heavy industries market sector and the industrial aftermarket and the negative impact of foreign currency exchange rate changes, partially offset by organic growth in the wind energy and power systems market sectors and the benefit of acquisitions. EBIT for the Process Industries segment is expected to decrease in 2016 compared to 2015 primarily due to the impact of lower volume, unfavorable price/mix and foreign currency exchange rate changes, partially offset by lower raw material and operating costs, lower selling, general and administrative expenses and the impact of acquisitions.
Unallocated Corporate:
Three Months Ended March 31, | ||||||||||
2016 | 2015 | $ Change | % Change | |||||||
Corporate expenses | $ | 10.7 | $ | 14.2 | $ | (3.5 | ) | (24.6)% | ||
Corporate expenses % to net sales | 1.6 | % | 2.0 | % | — | (40) bps | ||||
Corporate expenses decreased in the first quarter of 2016 compared to the first quarter of 2015 primarily due to cost reduction initiatives and lower incentive compensation expense.
31
The Balance Sheet
The following discussion is a comparison of the Consolidated Balance Sheets at March 31, 2016 and December 31, 2015.
Current Assets:
March 31, 2016 | December 31, 2015 | $ Change | % Change | ||||||||
Cash and cash equivalents | $ | 137.3 | $ | 129.6 | $ | 7.7 | 5.9 | % | |||
Restricted cash | 0.2 | 0.2 | — | — | % | ||||||
Accounts receivable, net | 465.0 | 454.6 | 10.4 | 2.3 | % | ||||||
Inventories, net | 551.3 | 543.2 | 8.1 | 1.5 | % | ||||||
Deferred charges and prepaid expenses | 25.9 | 22.7 | 3.2 | 14.1 | % | ||||||
Other current assets | 95.2 | 56.1 | 39.1 | 69.7 | % | ||||||
Total current assets | $ | 1,274.9 | $ | 1,206.4 | $ | 68.5 | 5.7 | % | |||
Accounts receivable, net, increased as a result of higher sales in March 2016 compared to December 2015. Other current assets increased due to a $48.1 million CDSOA receivable recorded in the first quarter of 2016, but the related funds were not received until April 1, 2016, partially offset by a decrease in income tax receivables of $11.0 million that were collected during the first quarter of 2016.
Property, Plant and Equipment, Net:
March 31, 2016 | December 31, 2015 | $ Change | % Change | ||||||||
Property, plant and equipment | $ | 2,195.4 | $ | 2,171.7 | $ | 23.7 | 1.1 | % | |||
Accumulated depreciation | (1,415.3 | ) | (1,393.9 | ) | (21.4 | ) | 1.5 | % | |||
Property, plant and equipment, net | $ | 780.1 | $ | 777.8 | $ | 2.3 | 0.3 | % | |||
The increase in property, plant and equipment, net in the first three months of 2016 was primarily due to capital expenditures and the impact of foreign currency exchange rate changes, partially offset by current-year depreciation and impairment losses.
Other Assets:
March 31, 2016 | December 31, 2015 | $ Change | % Change | ||||||||
Goodwill | $ | 328.7 | $ | 327.3 | $ | 1.4 | 0.4 | % | |||
Non-current pension assets | 88.1 | 86.3 | 1.8 | 2.1 | % | ||||||
Other intangible assets | 265.1 | 271.3 | (6.2 | ) | (2.3 | )% | |||||
Deferred income taxes | 64.9 | 65.9 | (1.0 | ) | (1.5 | )% | |||||
Other non-current assets | 48.3 | 49.1 | (0.8 | ) | (1.6 | )% | |||||
Total other assets | $ | 795.1 | $ | 799.9 | $ | (4.8 | ) | (0.6 | )% | ||
The decrease in other intangible assets was primarily due to amortization expense of $9.1 million, partially offset by current-year expenditures for software of $2.9 million.
32
Current Liabilities:
March 31, 2016 | December 31, 2015 | $ Change | % Change | ||||||||
Short-term debt | $ | 0.2 | $ | 62.0 | $ | (61.8 | ) | (99.7 | )% | ||
Current portion of long-term debt | 15.1 | 15.1 | — | — | % | ||||||
Accounts payable | 177.9 | 159.7 | 18.2 | 11.4 | % | ||||||
Salaries, wages and benefits | 84.6 | 102.3 | (17.7 | ) | (17.3 | )% | |||||
Income taxes payable | 30.2 | 13.1 | 17.1 | 130.5 | % | ||||||
Other current liabilities | 134.6 | 153.1 | (18.5 | ) | (12.1 | )% | |||||
Total current liabilities | $ | 442.6 | $ | 505.3 | $ | (62.7 | ) | (12.4 | )% | ||
The decrease in short-term debt was primarily due to the classification of $48 million of outstanding borrowings under the Accounts Receivable Facility as long-term and a reduction in the borrowings under various short-term lines of credit outside of the United States. The outstanding balance under the Accounts Receivable Facility was classified as long-term to align with the term of the agreement and reflect the Company's expectations relative to the minimum borrowing base. The increase in accounts payable was primarily due to higher days outstanding driven by the Company's initiative to extend payment terms with its suppliers. The decrease in accrued salaries, wages and benefits was primarily due to cost reduction initiatives, the payout of 2015 performance-based compensation and the payout of stock-based compensation that settled in cash, partially offset by accruals for 2016 performance-based compensation. The increase in income taxes payable in the first three months of 2016 was primarily due to current tax expense, offset by tax payments. The decrease in other current liabilities was primarily due to a decrease in accrued interest and rebate accruals, as well as a payment to TimkenSteel Corporation for its portion of an income tax refund collected in the first quarter of 2016. The decrease in accrued interest was due to the payment of interest for the Company's fixed-rate Senior Unsecured Notes and its fixed-rate Medium-Term Notes. The decrease in accrued rebates was due to the payment of 2015 annual incentive commissions to distributors and OEM customers.
Non-Current Liabilities:
March 31, 2016 | December 31, 2015 | $ Change | % Change | ||||||||
Long-term debt | $ | 673.4 | $ | 579.4 | $ | 94.0 | 16.2 | % | |||
Accrued pension cost | 149.2 | 146.9 | 2.3 | 1.6 | % | ||||||
Accrued postretirement benefits cost | 133.1 | 136.1 | (3.0 | ) | (2.2 | )% | |||||
Deferred income taxes | 3.6 | 3.6 | — | — | % | ||||||
Other non-current liabilities | 72.6 | 68.2 | 4.4 | 6.5 | % | ||||||
Total non-current liabilities | $ | 1,031.9 | $ | 934.2 | $ | 97.7 | 10.5 | % | |||
The increase in long-term debt was primarily due to the classification of $48 million of outstanding borrowings under the Accounts Receivable Facility as long-term and an increase in the borrowings under the Company's Senior Credit Facility.
33
Shareholders’ Equity:
March 31, 2016 | December 31, 2015 | $ Change | % Change | ||||||||
Common stock | $ | 954.7 | $ | 958.2 | $ | (3.5 | ) | (0.4 | )% | ||
Earnings invested in the business | 1,499.9 | 1,457.6 | 42.3 | 2.9 | % | ||||||
Accumulated other comprehensive loss | (271.9 | ) | (287.0 | ) | 15.1 | (5.3 | )% | ||||
Treasury shares | (833.0 | ) | (804.3 | ) | (28.7 | ) | 3.6 | % | |||
Noncontrolling interest | 25.9 | 20.1 | 5.8 | 28.9 | % | ||||||
Total shareholders’ equity | $ | 1,375.6 | $ | 1,344.6 | $ | 31.0 | 2.3 | % | |||
Earnings invested in the business in the first three months of 2016 increased by net income attributable to the Company of $63.0 million, partially offset by dividends declared of $20.7 million. The decrease in accumulated other comprehensive loss was due to foreign currency adjustments of $13.7 million and pension and postretirement liability adjustments of $3.7 million, partially offset by a change in fair value of derivative financial instruments of $2.3 million. The foreign currency translation adjustments were due to the weakening of the U.S. dollar relative to other foreign currencies, including the Romanian Leu, Canadian Dollar, Brazilian Real and Chinese Renminbi. See "Other Matters - Foreign Currency" for further discussion regarding the impact of foreign currency translation. The pension and postretirement liability adjustments were primarily due to amortization of actuarial losses. The increase in treasury shares was primarily due to the Company's purchase of 1.2 million of its common shares for $35.2 million, partially offset by net shares issued for stock compensation plans during the first three months of 2016.
34
Cash Flows
Three Months Ended March 31, | |||||||||
2016 | 2015 | $ Change | |||||||
Net cash provided by operating activities | $ | 47.1 | $ | 17.0 | $ | 30.1 | |||
Net cash used by investing activities | (24.6 | ) | (14.0 | ) | (10.6 | ) | |||
Net cash used by financing activities | (19.4 | ) | (120.8 | ) | 101.4 | ||||
Effect of exchange rate changes on cash | 4.6 | (6.6 | ) | 11.2 | |||||
Increase in cash and cash equivalents | $ | 27.1 | $ | (124.4 | ) | $ | 151.5 | ||
Operating activities provided net cash of $47.1 million in the first three months of 2016, after providing net cash of $17 million in the first three months of 2015. The increase was due to a net favorable change in working capital items of $61.1 million and the favorable impact of income taxes of $52.1 million, partially offset by lower net income excluding pension settlement charges and CDSOA of $64.0 million.
The following table displays the impact of working capital items on cash during the first three months of 2016 and 2015, respectively:
Three Months Ended March 31, | |||||||||
2016 | 2015 | $ Change | |||||||
Cash Provided (Used): | |||||||||
Accounts receivable | $ | (4.9 | ) | $ | (29.6 | ) | $ | 24.7 | |
Inventories | (0.1 | ) | (12.8 | ) | 12.7 | ||||
Trade accounts payable | 16.5 | 27.9 | (11.4 | ) | |||||
Other accrued expenses | (28.4 | ) | (63.5 | ) | 35.1 | ||||
Cash used for working capital items | $ | (16.9 | ) | $ | (78.0 | ) | $ | 61.1 | |
The following table displays the impact of income taxes on cash during the first three months of 2016 and 2015, respectively:
Three Months Ended March 31, | |||||||||
2016 | 2015 | $ Change | |||||||
Accrued income tax expense | $ | 27.5 | $ | (21.3 | ) | $ | 48.8 | ||
Income tax payments | (5.3 | ) | (8.3 | ) | 3.0 | ||||
Other miscellaneous | 0.2 | (0.1 | ) | 0.3 | |||||
Change in income taxes | $ | 22.4 | $ | (29.7 | ) | $ | 52.1 | ||
The following table displays the effect on cash for major components of net income during the first three months of 2016 and 2015, respectively:
Three Months Ended March 31, | |||||||||
2016 | 2015 | $ Change | |||||||
Net income attributable to The Timken Company | $ | 62.9 | $ | (134.8 | ) | $ | 197.7 | ||
Non-cash pension settlement charges included in net income | — | 213.6 | (213.6 | ) | |||||
CDSOA receivable (non-cash Q1 2016) | (48.1 | ) | — | (48.1 | ) | ||||
Net income (excluding pension settlement and CDSOA) | $ | 14.8 | $ | 78.8 | $ | (64.0 | ) | ||
35
Net cash used by investing activities of $24.6 million in the first three months of 2016 increased from the same period in 2015 primarily due to a $4.5 million increase in cash used for capital expenditures, a $3.4 million increase in cash used for investments in short-term marketable securities and a $2.8 million reduction in proceeds from the sale of property, plant and equipment.
The following table displays the factors impacting cash from financing activities during the first three months of 2016 and 2015, respectively:
Three Months Ended March 31, | |||||||||
2016 | 2015 | $ Change | |||||||
Net borrowings | $ | 31.2 | $ | (4.7 | ) | $ | 35.9 | ||
Purchase of treasury shares | (35.0 | ) | (96.8 | ) | 61.8 | ||||
Proceeds from exercise of stock options | 0.3 | 1.1 | (0.8 | ) | |||||
Cash dividends paid to shareholders | (20.7 | ) | (21.9 | ) | 1.2 | ||||
Decrease in restricted cash | — | 0.5 | (0.5 | ) | |||||
Other | 4.8 | 1.0 | 3.8 | ||||||
Decrease in cash used for financing activities | $ | (19.4 | ) | $ | (120.8 | ) | $ | 101.4 | |
Net cash used by financing activities was $19.4 million in the first three months of 2016, compared to $121 million in the first three months of 2015. The decrease in cash used by financing activities was primarily due to an increase in net borrowings and lower cash used for share repurchases during the first three months of 2016 compared to the first three months of 2015.
36
Liquidity and Capital Resources:
Reconciliation of total debt to net debt and the ratio of net debt to capital:
Net Debt:
March 31, 2016 | December 31, 2015 | |||||
Short-term debt | $ | 0.2 | $ | 62.0 | ||
Current portion of long-term debt | 15.1 | 15.1 | ||||
Long-term debt | 673.4 | 579.4 | ||||
Total debt | $ | 688.7 | $ | 656.5 | ||
Less: Cash and cash equivalents | 137.3 | 129.6 | ||||
Restricted cash | 0.2 | 0.2 | ||||
Net debt | $ | 551.2 | $ | 526.7 | ||
Ratio of Net Debt to Capital:
March 31, 2016 | December 31, 2015 | |||||
Net debt | $ | 551.2 | $ | 526.7 | ||
Shareholders’ equity | 1,375.6 | 1,344.6 | ||||
Net debt plus shareholders’ equity (capital) | $ | 1,926.8 | $ | 1,871.3 | ||
Ratio of net debt to capital | 28.6 | % | 28.1% | |||
The Company presents net debt because it believes net debt is more representative of the Company's financial position than total debt due to the amount of cash and cash equivalents held by the Company.
At March 31, 2016, approximately $132 million of the Company's $137 million of cash and cash equivalents resided in jurisdictions outside the United States. It is the Company's practice to use available cash in the United States to pay down its Senior Credit Facility or Accounts Receivable Facility, in order to minimize total interest expense. As a result, the majority of the Company's cash on hand was outside the United States. Repatriation of these funds to the United States could be subject to domestic and foreign taxes and some portion may be subject to governmental restrictions. Part of the Company's strategy is to grow in attractive market sectors, many of which are outside the United States. This strategy includes making investments in facilities and equipment and potential new acquisitions. The Company plans to fund these investments, as well as meet working capital requirements, with cash and cash equivalents and unused lines of credit within the geographic location of these investments where possible.
The Company has a $100 million Accounts Receivable Facility, which matures on November 30, 2018. The Accounts Receivable Facility is subject to certain borrowing base limitations and is secured by certain domestic accounts receivable of the Company. Certain borrowing base limitations reduced the availability of the Accounts Receivable Facility to $71.0 million at March 31, 2016. As of March 31, 2016, the Company had $48.0 million in outstanding borrowings, which reduced the availability under the facility to $23.0 million. The interest rate on the Accounts Receivable Facility is variable and was 1.28% as of March 31, 2016. The cost of this facility is the prevailing commercial paper rate plus program fees.
The Company has a $500 million Senior Credit Facility, which matures on June 19, 2020. At December 31, 2015, the Senior Credit Facility had outstanding borrowings of $75.2 million, which reduced the availability to $424.8 million. Under the Senior Credit Facility, the Company has two financial covenants: a consolidated leverage ratio and a consolidated interest coverage ratio. At March 31, 2016, the Company was in full compliance with the covenants under the Senior Credit Facility and its other debt agreements. The maximum consolidated leverage ratio permitted under the Senior Credit Facility is 3.5 to 1.0 (3.75 to 1.0 for a limited period up to four quarters following an acquisition with a purchase price of $200 million or greater). As of March 31, 2016, the Company's consolidated leverage ratio was 1.56 to 1.0. The minimum consolidated interest coverage ratio permitted under the Senior Credit Facility is 3.5 to 1.0. As of March 31, 2016, the Company's consolidated interest coverage ratio was 13.99 to 1.0.
37
The interest rate under the Senior Credit Facility is variable with a spread based on the Company's debt rating. This rate was 1.66% as of March 31, 2016. In addition, the Company pays a facility fee based on the consolidated leverage ratio multiplied by the aggregate commitments of all of the lenders under the Senior Credit Facility.
Other sources of liquidity include short-term lines of credit for certain of the Company's foreign subsidiaries, which provide for borrowings of up to approximately $225 million. Most of these credit lines are uncommitted. At March 31, 2016, the Company had borrowings outstanding of $0.2 million and bank guarantees of $1.1 million, which reduced the availability under these facilities to $223.7 million.
The Company expects that any cash requirements in excess of cash on hand and cash generated from operating activities will be met by the committed funds available under its Accounts Receivable Facility and the Senior Credit Facility. Management believes it has sufficient liquidity to meet its obligations through at least the term of the Senior Credit Facility.
The Company expects to remain in compliance with its debt covenants. However, the Company may need to limit its borrowings under the Senior Credit Facility or other facilities in order to remain in compliance. As of March 31, 2016, the Company could have borrowed the full amounts available under the Senior Credit Facility and Accounts Receivable Facility, and would have still been in compliance with its debt covenants.
The Company expects cash from operations of approximately $340 million in 2016, a decrease of approximately $35 million from 2015, driven by lower net income, excluding non-cash pension settlement and impairment charges, and less cash generated from working capital, offset partially by CDSOA receipts. The Company expects to make approximately $15 million in pension contributions in 2016, compared to $10.8 million in 2015. The Company expects capital expenditures of approximately 4.5% of sales in 2016, compared to 3.7% of sales in 2015.
Financing Obligations and Other Commitments:
During the first three months of 2016, the Company made contributions of $5.9 million to its global defined benefit pension plans. The Company currently expects to make contributions to its global defined benefit pension plans in 2016 totaling approximately $15 million. Returns for the Company's global defined benefit pension plan assets in 2015 were 0.61%, below the expected rate of return of 6.0% predominantly due to decreases in long duration fixed-income markets. The lower returns were largely offset by the impact of a 49 basis point increase in discount rates used to measure the Company's defined benefit pension obligations. Since 2014, the Company has been increasing the percentage of U.S. plan assets allocated to long duration fixed income and decreasing the exposure to equities in an effort to preserve its over-funded status in the U.S. Returns for the Company's U.S. defined benefit plan pension assets for the first three months of 2016 were approximately 5.7%. The Company expects to record pension expense of approximately $59 million for 2016, compared to pension expense of $488.7 million in 2015. The majority of the decrease in pension expenses for 2016 is due to lower pension settlement charges in 2016 compared to 2015.
The Company does not have any off-balance sheet arrangements with unconsolidated entities or other persons.
Critical Accounting Policies and Estimates:
The Company's financial statements are prepared in accordance with accounting principles generally accepted in the United States. The preparation of these financial statements requires management to make estimates and assumptions that affect the reported amounts of assets and liabilities at the date of the financial statements and the reported amounts of revenues and expenses during the periods presented. The Company reviews its critical accounting policies throughout the year. The Company has concluded that there have been no changes to its critical accounting policies or estimates, as described in its Annual Report on Form 10-K for the year ended December 31, 2015, during the three months ended March 31, 2016.
38
Other Matters
Foreign Currency:
Assets and liabilities of subsidiaries are translated at the rate of exchange in effect on the balance sheet date; income and expenses are translated at the average rates of exchange prevailing each month during the quarter. Related translation adjustments are reflected as a separate component of accumulated other comprehensive income (loss). Foreign currency gains and losses resulting from transactions are included in the Consolidated Statement of Income.
Foreign currency exchange losses resulting from transactions included in the Company's operating results for the first quarter of 2016 were $1.2 million, compared to a loss of $1.7 million during the first quarter of 2015. For the three months ended March 31, 2016, the Company recorded a positive foreign currency translation adjustment of $13.7 million that increased shareholders' equity, compared to a negative foreign currency translation adjustment of $27.8 million that decreased shareholders' equity for the three months ended March 31, 2015. The foreign currency translation adjustments for the three months ended March 31, 2016 were positively impacted by the weakening of the U.S. dollar relative to the Romanian Leu, Canadian Dollar, Brazilian Real and Chinese Renminbi.
39
Forward-Looking Statements
Certain statements set forth in this Form 10-Q and in the Company's Annual Report on Form 10-K for the year ended December 31, 2015 (including the Company's forecasts, beliefs and expectations) that are not historical in nature are “forward-looking” statements within the meaning of the Private Securities Litigation Reform Act of 1995. In particular, Management's Discussion and Analysis contains numerous forward-looking statements. Forward-looking statements generally will be accompanied by words such as “anticipate,” “believe,” “could,” “estimate,” “expect,” “forecast,” “outlook,” “intend,” “may,” “possible,” “potential,” “predict,” “project” or other similar words, phrases or expressions. You are cautioned not to place undue reliance on forward-looking statements, which speak only as of the date of this Form 10-Q. The Company cautions readers that actual results may differ materially from those expressed or implied in forward-looking statements made by or on behalf of the Company due to a variety of factors, such as:
• | deterioration in world economic conditions, or in economic conditions in any of the geographic regions in which the Company conducts business, including additional adverse effects from the global economic slowdown, terrorism or hostilities. This includes: political risks associated with the potential instability of governments and legal systems in countries in which the Company or its customers conduct business, and changes in currency valuations; |
• | the effects of fluctuations in customer demand on sales, product mix and prices in the industries in which the Company operates. This includes: the ability of the Company to respond to rapid changes in customer demand, the effects of customer bankruptcies or liquidations, the impact of changes in industrial business cycles, and whether conditions of fair trade continue in the U.S. markets; |
• | competitive factors, including changes in market penetration, increasing price competition by existing or new foreign and domestic competitors, the introduction of new products by existing and new competitors, and new technology that may impact the way the Company’s products are sold or distributed; |
• | changes in operating costs. This includes: the effect of changes in the Company’s manufacturing processes; changes in costs associated with varying levels of operations and manufacturing capacity; availability and cost of raw materials and energy; changes in the expected costs associated with product warranty claims; changes resulting from inventory management and cost reduction initiatives and different levels of customer demands; the effects of unplanned plant shutdowns; and changes in the cost of labor and benefits; |
• | the success of the Company’s operating plans, announced programs, initiatives and capital investments; the ability to complete previously announced transactions; the ability to integrate acquired companies; and the ability of acquired companies to achieve satisfactory operating results, including results being accretive to earnings; |
• | The Company’s ability to maintain appropriate relations with unions that represent Company associates in certain locations in order to avoid disruptions of business; |
• | unanticipated litigation, claims or assessments. This includes: claims or problems related to intellectual property, product liability or warranty, environmental issues, and taxes; |
• | changes in worldwide financial markets, including availability of financing and interest rates, which affect: the Company’s cost of funds and/or ability to raise capital; and customer demand and the ability of customers to obtain financing to purchase the Company’s products or equipment that contain the Company’s products; |
• | the impact on the Company's pension obligations due to changes in interest rates, investment performance and other tactics designed to reduce risk; |
• | retention of CDSOA distributions; and |
• | those items identified under Item 1A. Risk Factors in the Company's Annual Report on Form 10-K for the year ended December 31, 2015. |
Additional risks relating to the Company's business, the industries in which the Company operates or the Company's common shares may be described from time to time in the Company's filings with the Securities and Exchange Commission. All of these risk factors are difficult to predict, are subject to material uncertainties that may affect actual results and may be beyond the Company's control.
Readers are cautioned that it is not possible to predict or identify all of the risks, uncertainties and other factors that may affect future results and that the above list should not be considered to be a complete list. Except as required by the federal securities laws, the Company undertakes no obligation to publicly update or revise any forward-looking statement, whether as a result of new information, future events or otherwise.
40
ITEM 3. QUANTITATIVE AND QUALITATIVE DISCLOSURES ABOUT MARKET RISK
Refer to information appearing under the caption “Management’s Discussion and Analysis of Financial Condition and Results of Operations” of this Form 10-Q. Furthermore, a discussion of market risk exposures is included in Part II, Item 7A. Quantitative and Qualitative Disclosure about Market Risk, of the Company’s Annual Report on Form 10-K for the year ended December 31, 2015. There have been no material changes in reported market risk since the inclusion of this discussion in the Company’s Annual Report on Form 10-K referenced above.
ITEM 4. CONTROLS AND PROCEDURES
(a) | Disclosure Controls and Procedures |
As of the end of the period covered by this report, the Company carried out an evaluation, under the supervision and with the participation of the Company’s management, including the Company’s principal executive officer and principal financial officer, of the effectiveness of the design and operation of the Company’s disclosure controls and procedures (as defined in Exchange Act Rule 13a-15(e)). Based upon that evaluation, the principal executive officer and principal financial officer concluded that the Company’s disclosure controls and procedures were effective as of the end of the period covered by this report.
(b) | Changes in Internal Control Over Financial Reporting |
During the Company’s most recent fiscal quarter, there have been no changes in the Company’s internal control over financial reporting that have materially affected, or are reasonably likely to materially affect, the Company’s internal control over financial reporting.
41
PART II. OTHER INFORMATION
Item 1. Legal Proceedings
The Company is involved in various claims and legal actions arising in the ordinary course of business. In the opinion of management, the ultimate disposition of these matters will not have a material adverse effect on the Company’s consolidated financial position or results of operations.
Item 1A. Risk Factors
Our Annual Report on Form 10-K for the fiscal year ended December 31, 2015 included a detailed discussion of our risk factors. There have been no material changes to the risk factors included in the Company’s Annual Report on Form 10-K for the year ended December 31, 2015.
Item 2. Unregistered Sales of Equity Securities and Use of Proceeds.
Issuer Purchases of Common Shares
The following table provides information about purchases by the Company of its common shares during the quarter ended March 31, 2016.
Period | Total number of shares purchased (1) | Average price paid per share (2) | Total number of shares purchased as part of publicly announced plans or programs | Maximum number of shares that may yet be purchased under the plans or programs (3) | |||||
1/1/16 - 1/31/16 | 242,969 | $ | 28.72 | 240,000 | 5,000,000 | ||||
2/1/16 - 2/29/16 | 466,521 | 29.43 | 420,000 | 4,580,000 | |||||
3/1/16 - 3/31/16 | 505,232 | 31.22 | 504,191 | 4,075,809 | |||||
Total | 1,214,722 | $ | 30.04 | 1,164,191 | 4,075,809 | ||||
(1) | Of the shares purchased in January, February and March, 2,969, 46,521 and 1,041, respectively, represent common shares of the Company that were owned and tendered by employees to exercise stock options, and to satisfy withholding obligations in connection with the exercise of stock options and vesting of restricted shares. |
(2) | For shares tendered in connection with the vesting of restricted shares, the average price paid per share is an average calculated using the daily high and low of the Company's common shares as quoted on the New York Stock Exchange at the time of vesting. For shares tendered in connection with the exercise of stock options, the price paid is the real-time trading stock price at the time the options are exercised. |
(3) | On January 29, 2016, the Board of Directors of the Company approved a share purchase plan pursuant to which the Company may purchase up to five million of its common shares in the aggregate. This share repurchase plan expires on January 31, 2017. The Company may purchase shares from time to time in open market purchases or privately negotiated transactions. The Company may make all or part of the purchases pursuant to accelerated share repurchases or Rule 10b5-1 plans. |
42
Item 6. Exhibits
12 | Computation of Ratio of Earnings to Fixed Charges. |
31.1 | Certification of Richard G. Kyle, President and Chief Executive Officer (principal executive officer) of The Timken Company, pursuant to Section 302 of the Sarbanes-Oxley Act of 2002. |
31.2 | Certification of Philip D. Fracassa, Executive Vice President and Chief Financial Officer (principal financial officer) of The Timken Company, pursuant to Section 302 of the Sarbanes-Oxley Act of 2002. |
32 | Certifications of Richard G. Kyle, President and Chief Executive Officer (principal executive officer) and Philip D. Fracassa, Executive Vice President and Chief Financial Officer (principal financial officer) of The Timken Company, pursuant to Section 906 of the Sarbanes-Oxley Act of 2002. |
101 | Financial statements from the quarterly report on Form 10-Q of The Timken Company for the quarter ended March 31, 2016, filed on April 27, 2016, formatted in XBRL: (i) the Consolidated Statements of Income, (ii) the Consolidated Statements of Comprehensive Income, (iii) the Consolidated Balance Sheets, (iv) the Consolidated Statements of Cash Flows and (v) the Notes to the Consolidated Financial Statements. |
43
SIGNATURES
Pursuant to the requirements of Section 13 or 15(d) of the Securities Exchange Act of 1934, the registrant has duly caused this report to be signed on its behalf by the undersigned, thereunto duly authorized.
THE TIMKEN COMPANY | ||
Date: April 27, 2016 | By: /s/ Richard G. Kyle | |
Richard G. Kyle President and Chief Executive Officer (Principal Executive Officer) | ||
Date: April 27, 2016 | By: /s/ Philip D. Fracassa | |
Philip D. Fracassa Executive Vice President and Chief Financial Officer (Principal Financial Officer) | ||
44