Attached files
| file | filename |
|---|---|
| 8-K - FORM 8-K - SB ONE BANCORP | v437959_8-k.htm |
| EX-99.1 - EXHIBIT 99.1 - SB ONE BANCORP | v437959_ex99-1.htm |
Exhibit 99.2
Annual Meeting April 27 th , 2016
2 FORWARD - LOOKING STATEMENT This confidential presentation, and the oral presentation that supplements it, have been developed by Sussex Bancorp (“Sussex” or the “Company”), were prepared exclusively for the benefit and internal use of the recipient and are not an offer or the solicitation of an offer to buy securities. Neither this presentation, nor the oral presentation that supplements it, nor any of their contents, may be used, reproduced, disseminated, quoted or referred to for any other purpose, in whole or in part, without the prior written consent of the Company. Some of the statements contained in this presentation are “forward - looking statements” within the meaning of Section 27A of the Securities Act of 1933, as amended, and Section 21E of the Securities Exchange Act of 1934, as amended. When used in this presentation, words such as “may,” “plan,” “contemplate,” “anticipate,” “believe,” “intend,” “continue,” “expect,” “project,” “predict,” “estimate,” “target,” “could,” “is likely,” “should,” “would,” “will,” or similar expressions are intended to identify “forward - looking statements” within the meaning of the Private Securities Litigation Reform Act of 1995. You are cautioned not to place undue reliance on any forward - looking statements, which speak only as of the date made. These statements may relate to the Company’s future financial performance, strategic plans or objectives, revenue, expense or earnings projections, or other financial items. By their nature, these statements are subject to numerous uncertainties that could cause actual results to differ materially from those anticipated in the statements. Factors that could cause actual results to differ materially from the results anticipated or projected include, but are not limited to, the following: ( i ) competition in the industry and markets in which the Company operates; (ii) levels of non - performing assets; (iii) changes in general interest rates; (iv) loan demand; (v) rapid changes in technology affecting the financial services industry; (vi) real estate values; (vii) changes in government regulation; and (viii) general economic and business conditions .
Welcome Edward J. Leppert − Chairman of the Board Anthony Labozzetta − President and Chief Executive Officer Steven Fusco − SEVP and Chief Financial Officer 3
Agenda 1 2 3 4 Building Franchise Value Financial Performance Growing Shareholder Value Company and Market Overview 4

1. Company and Market Overview
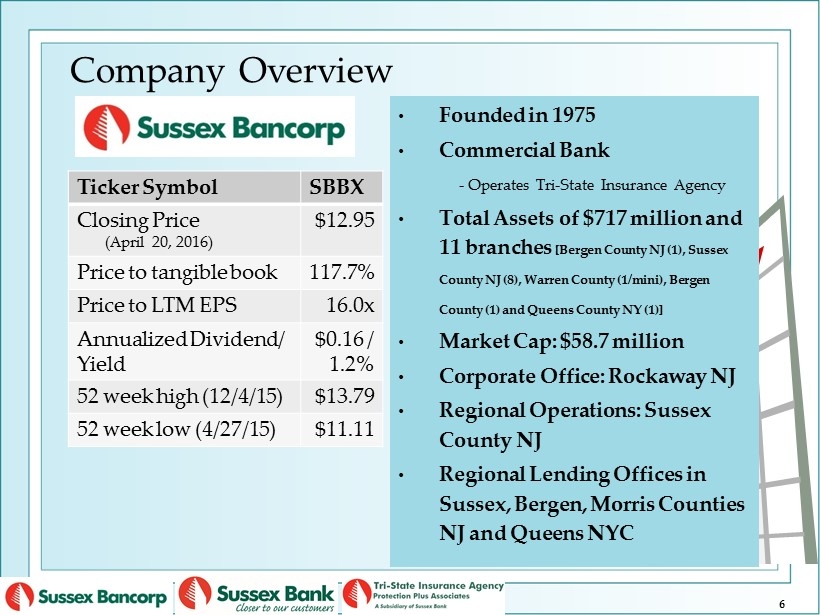
Ticker Symbol SBBX Closing Price (April 20, 2016) $12.95 Price to tangible book 117.7% Price to LTM EPS 16.0x Annualized Dividend/ Yield $0.16 / 1.2% 52 week high (12/4/15) $13.79 52 week low (4/27/15) $11.11 • Founded in 1975 • Commercial Bank - Operates Tri - State Insurance Agency • Total Assets of $717 million and 11 branches [Bergen County NJ (1), Sussex County NJ (8), Warren County (1/mini), Bergen County (1) and Queens County NY (1)] • Market Cap: $58.7 million • Corporate Office: Rockaway NJ • Regional Operations: Sussex County NJ • Regional Lending Offices in Sussex, Bergen, Morris Counties NJ and Queens NYC Company Overview 6
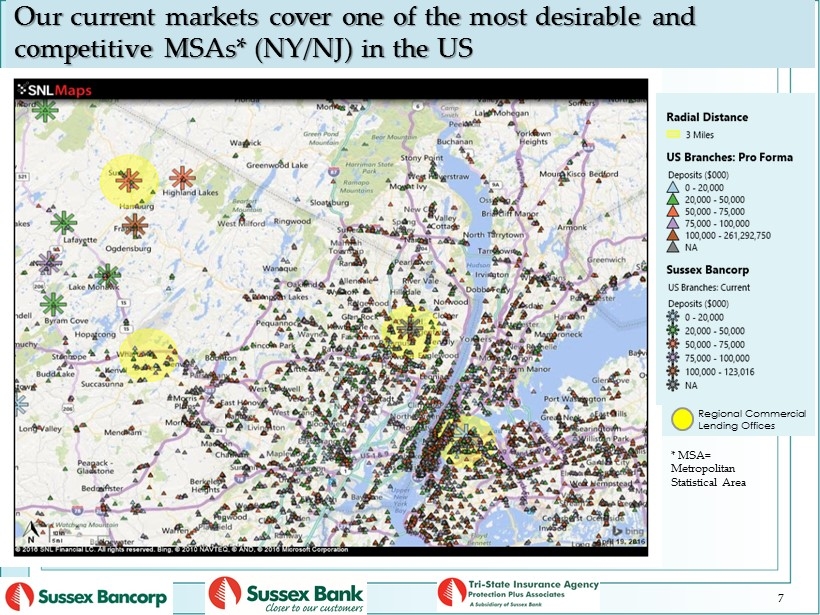
Our current markets cover one of the most desirable and competitive MSAs* (NY/NJ) in the US 7 Regional Commercial Lending Offices * MSA= Metropolitan Statistical Area
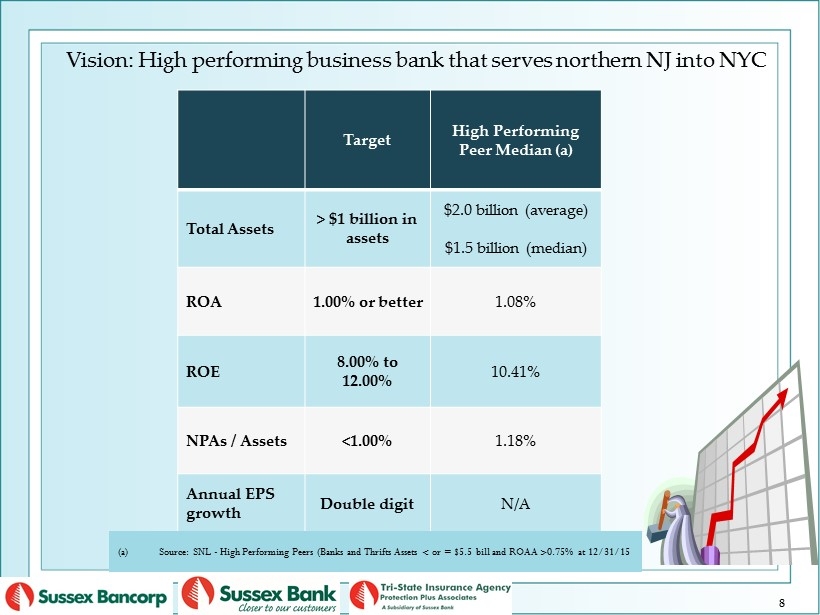
Vision: High performing business bank that serves northern NJ into NYC Target High Performing Peer Median (a) Total Assets > $1 billion in assets $2.0 billion (average) $1.5 billion (median) ROA 1.00% or better 1.08% ROE 8.00% to 12.00% 10.41% NPAs / Assets <1.00% 1.18% Annual EPS growth Double digit N/A (a) Source: SNL - High Performing Peers (Banks and Thrifts Assets < or = $5.5 bill and ROAA >0.75% at 12/31/15 8
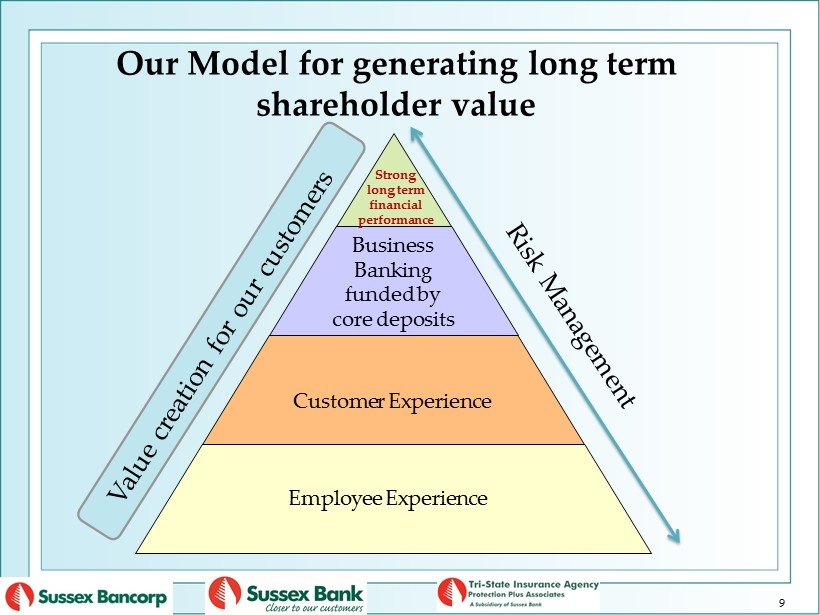
Employee Experience Customer Experience Business Banking funded by core deposits Strong long term financial performance 9 Our Model for generating long term shareholder value 9
2. Financial Performance
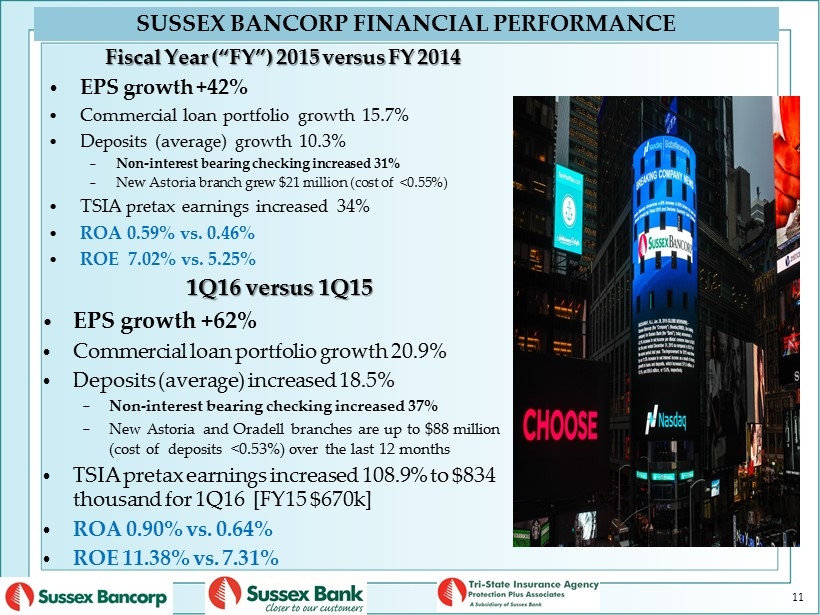
SUSSEX BANCORP FINANCIAL PERFORMANCE 11 Fiscal Year (“FY”) 2015 versus FY 2014 • EPS growth +42% • Commercial loan portfolio growth 15.7% • Deposits (average) growth 10.3% − Non - interest bearing checking increased 31% − New Astoria branch grew $21 million (cost of <0.55%) • TSIA pretax earnings increased 34% • ROA 0.59% vs. 0.46% • ROE 7.02% vs. 5.25% 1Q16 versus 1Q15 • EPS growth +62% • Commercial loan portfolio growth 20.9% • Deposits (average) increased 18.5% − Non - interest bearing checking increased 37% − New Astoria and Oradell branches are up to $88 million (cost of deposits <0.53%) over the last 12 months • TSIA pretax earnings increased 108.9% to $834 thousand for 1Q16 [FY15 $670k] • ROA 0.90% vs. 0.64% • ROE 11.38% vs. 7.31%
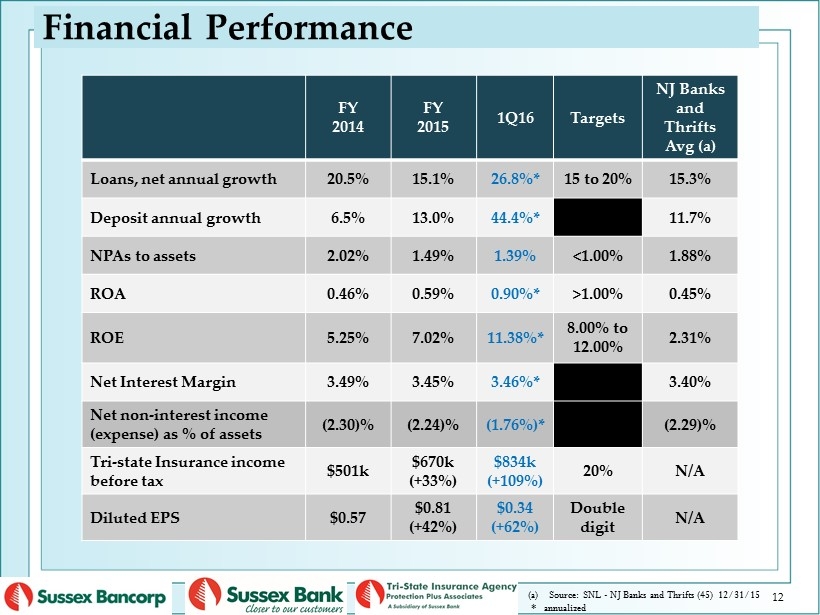
FY 2014 FY 2015 1Q16 Targets NJ Banks and Thrifts Avg (a) Loans, net annual growth 20.5% 15.1% 26.8%* 15 to 20% 15.3% Deposit annual growth 6.5% 13.0% 44.4%* 11.7% NPAs to assets 2.02% 1.49% 1.39% <1.00% 1.88% ROA 0.46% 0.59% 0.90%* >1.00% 0.45% ROE 5.25% 7.02% 11.38%* 8.00% to 12.00% 2.31% Net Interest Margin 3.49% 3.45% 3.46%* 3.40% Net non - interest income (expense) as % of assets (2.30)% (2.24)% (1.76%)* (2.29)% Tri - state Insurance income before tax $501k $670k (+33%) $834k (+109%) 20% N/A Diluted EPS $0.57 $0.81 (+42%) $0.34 (+62%) Double digit N/A Financial Performance (a) Source : SNL - NJ Banks and Thrifts (45) 12/31/15 * annualized 12
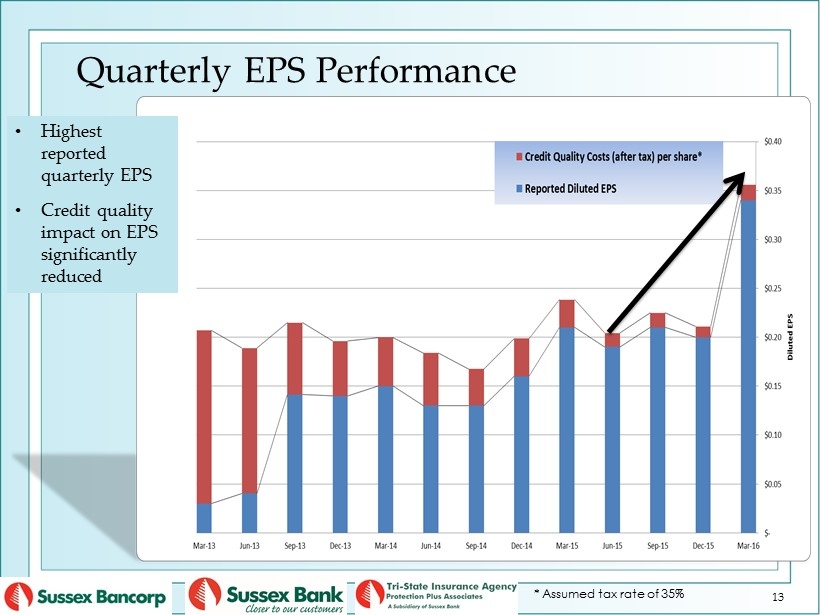
Quarterly EPS Performance • Highest reported quarterly EPS • Credit quality impact on EPS significantly reduced * Assumed tax rate of 35% 13
3 . Building Franchise Value
1. Strong Leadership − CEO and Executive Team with strong banking and leadership experience − Executive and Senior Management Teams are from much larger and successful financial institutions − Leadership that is innovative and adaptable − Talent Management • A great employee experience culture is critical • Ability to attract and retain talent • Growth and development • Reward and recognition 15 Building Franchise Value
Building Franchise Value 2. Grow our business − Relationship banking driven by great customer experience − Solve for the right equation • Integrated Banking Experience − Expand into markets that support long - term growth objectives • Hub and spoke model − Hub: De - novo banking centers and a regional commercial lending team − Spoke: smaller banking centers within the Hub region • Next de - novo banking centers (“spokes”) around Oradell (Bergen County, NJ) and Astoria NY locations (Oradell branch / regional lending location opened in March 2016) • Establish Hubs in Morris and Hudson counties (NJ) and NY markets adjacent to our current Hubs − Continue to target existing markets within Sussex County 16
2. Grow our business − Continue growing commercial loans • Target Commercial Loan annual growth of 15 - 20% • Regional lending office model • Attract and retain talent • Relationships, not transactions • Commercial lending relationships include deposits • Explore new commercial lending specialty lines • Continue building and enhancing credit administration capabilities 17 Building Franchise Value
Lending 18 Building Franchise Value
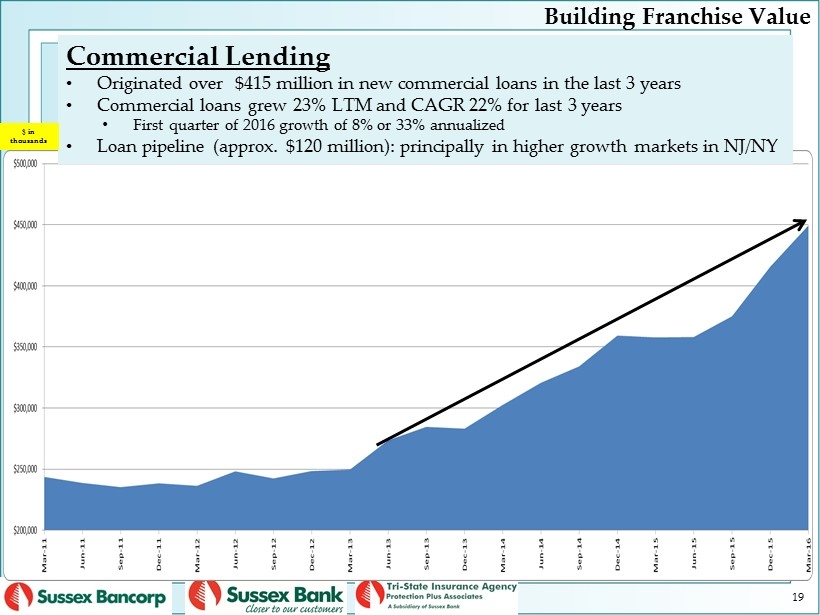
Commercial Lending • Originated over $415 million in new commercial loans in the last 3 years • Commercial loans grew 23% LTM and CAGR 22% for last 3 years • First quarter of 2016 growth of 8% or 33% annualized • Loan pipeline (approx. $120 million): principally in higher growth markets in NJ/NY $ in thousands 19 Building Franchise Value
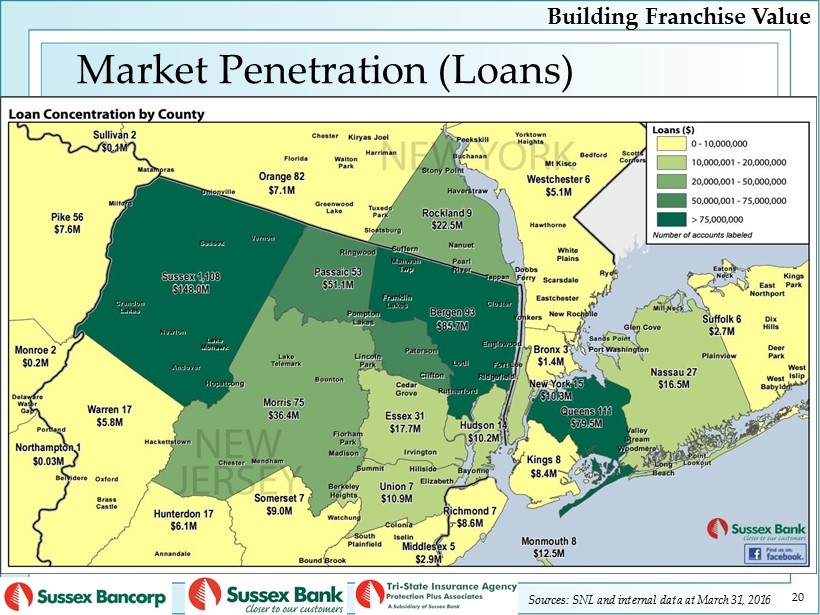
Market Penetration (Loans) Sources: SNL and internal data at March 31, 2016 Building Franchise Value 20
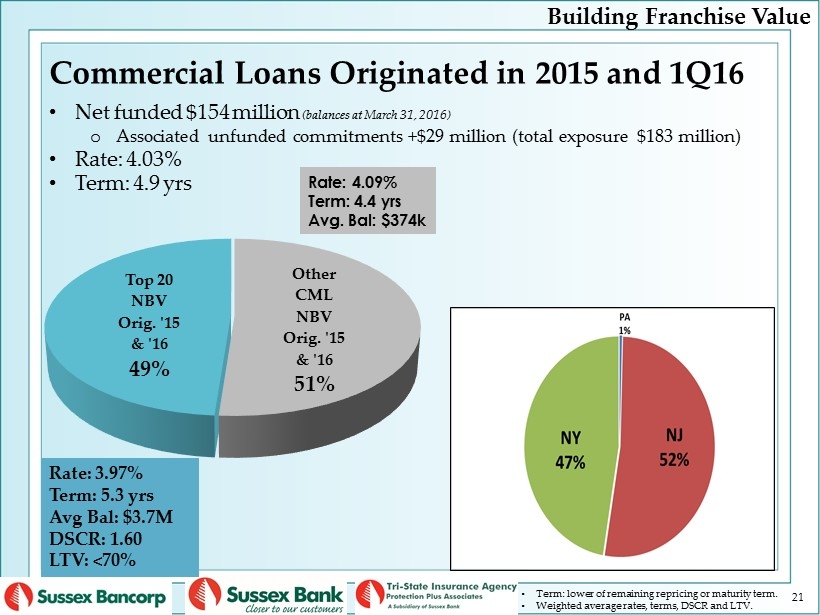
Other CML NBV Orig. '15 & '16 51% Top 20 NBV Orig. '15 & '16 49% 21 Commercial Loans Originated in 2015 and 1Q16 Rate: 4.09% Term: 4.4 yrs Avg. Bal: $374k Rate: 3.97% Term: 5.3 yrs Avg Bal: $3.7M DSCR: 1.60 LTV: <70% • Net funded $154 million (balances at March 31, 2016) o Associated unfunded commitments +$29 million (total exposure $183 million) • Rate: 4.03% • Term: 4.9 yrs • Term: lower of remaining repricing or maturity term. • Weighted average rates, terms, DSCR and LTV. Building Franchise Value
Retail Banking 22 Building Franchise Value
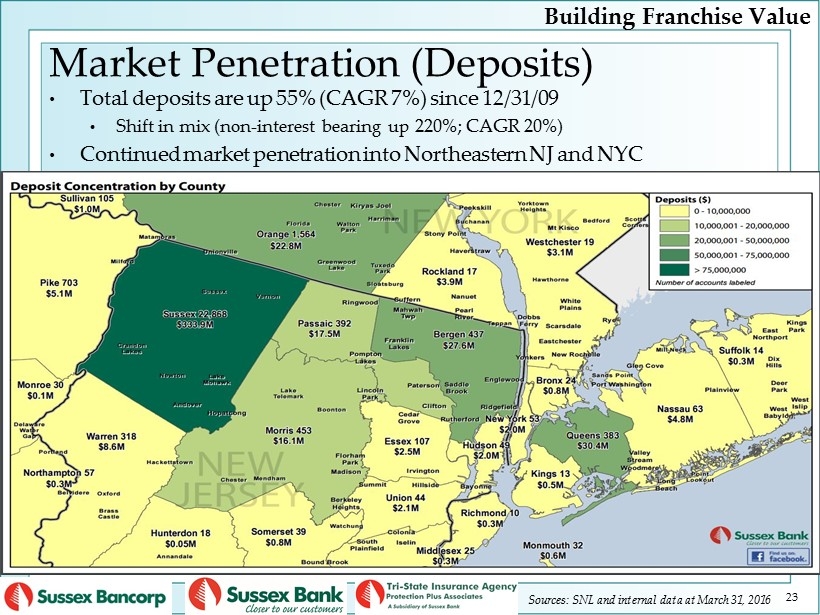
• Total deposits are up 55% (CAGR 7%) since 12/31/09 • Shift in mix (non - interest bearing up 220%; CAGR 20%) • Continued market penetration into Northeastern NJ and NYC 23 Market Penetration (Deposits) Building Franchise Value Sources: SNL and internal data at March 31, 2016
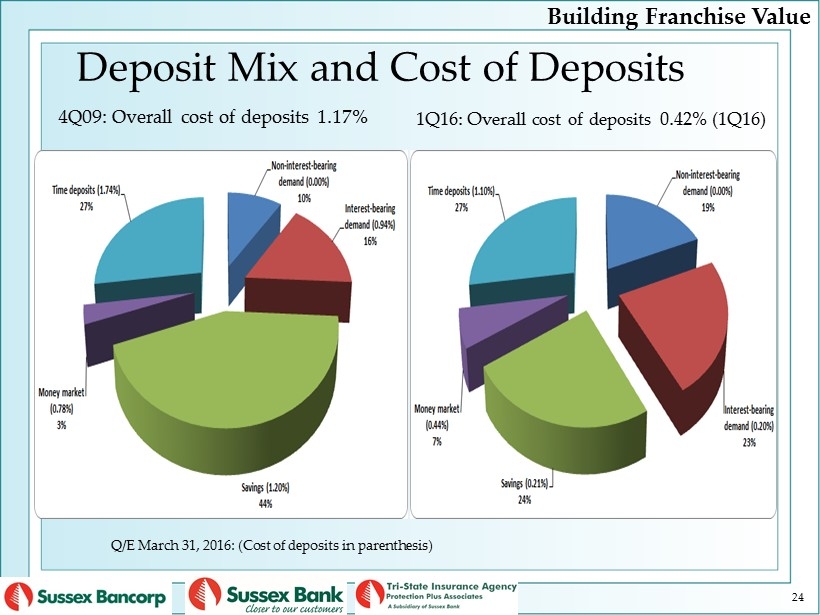
24 Deposit Mix and Cost of Deposits 1Q16: Overall cost of deposits 0.42% (1Q16) Q/E March 31, 2016: (Cost of deposits in parenthesis) Building Franchise Value 4Q09: Overall cost of deposits 1.17%
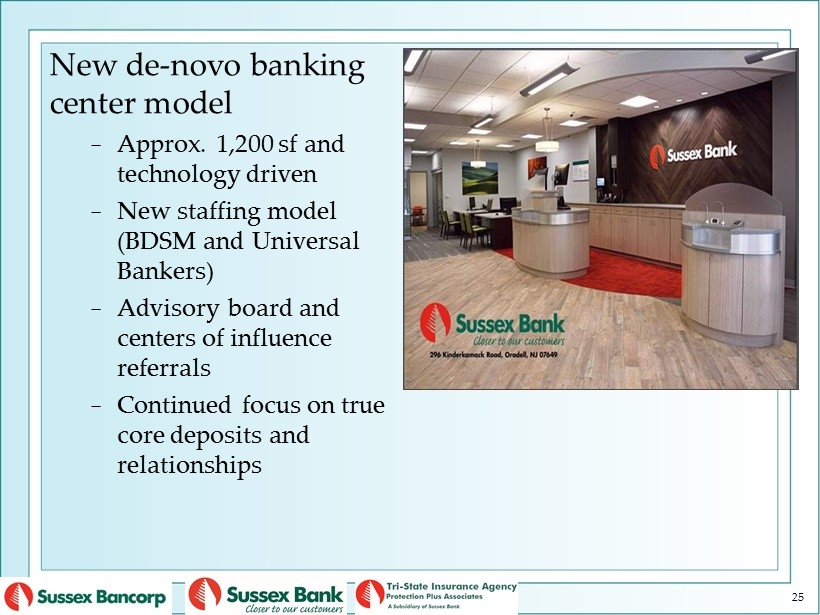
25 New de - novo banking center model − Approx. 1,200 sf and technology driven − New staffing model (BDSM and Universal Bankers) − Advisory board and centers of influence referrals − Continued focus on true core deposits and relationships
26 Our Newest Hubs − Astoria Banking Center (opened in March 2015) • To date total deposits of approximately $52 million with a cost of deposits of under 0.50% • Achieved profitability in less than one year − Oradell Banking Center (opened in March 2016) • New BDSM hired in early 2015 • To date total deposits of approximately $36 million with a cost of deposits of 0.56% • Achieved profitability in less than one quarter Building Franchise Value
27 • Existing Branches − Initial phase of New Banking Center Model in Sussex County • Initial phase (1): a 3 branch cluster with a BDSM generated year over year deposit growth of 16% vs. - 2% for all other branches in Sussex County − Phase 2: Physical and new staffing model to be implemented − Evaluating existing branch network profitability and applying New Branch Model • Announced the closure of one of our largest physical branches [Port Jervis NY] ($20M in deposits, which will be consolidated into an existing branch in Sussex County) − Operating cost savings of approx. $300k per year [beginning in July 2016]
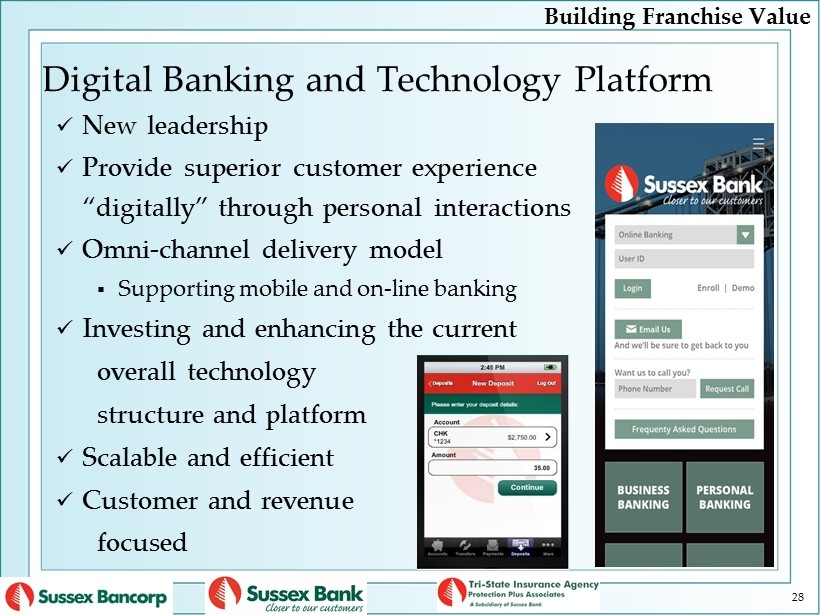
Digital Banking and Technology Platform 28 Building Franchise Value x New leadership x Provide superior customer experience “digitally” through personal interactions x Omni - channel delivery model ▪ Supporting mobile and on - line banking x Investing and enhancing the current overall technology structure and platform x Scalable and efficient x Customer and revenue focused
3. Continue to strengthen profitability − Positive operating leverage • Loan and deposit growth − Operational efficiencies excellence • Evaluate and restructure business processes to be operationally flexible and scalable to improve profitability • Evaluate existing branch network profitability and strategies − Growing fee income • Our insurance subsidiary (TSIA) – generating record pre - tax income • Expanding wealth management services • Strategies to improve bank fee income 29
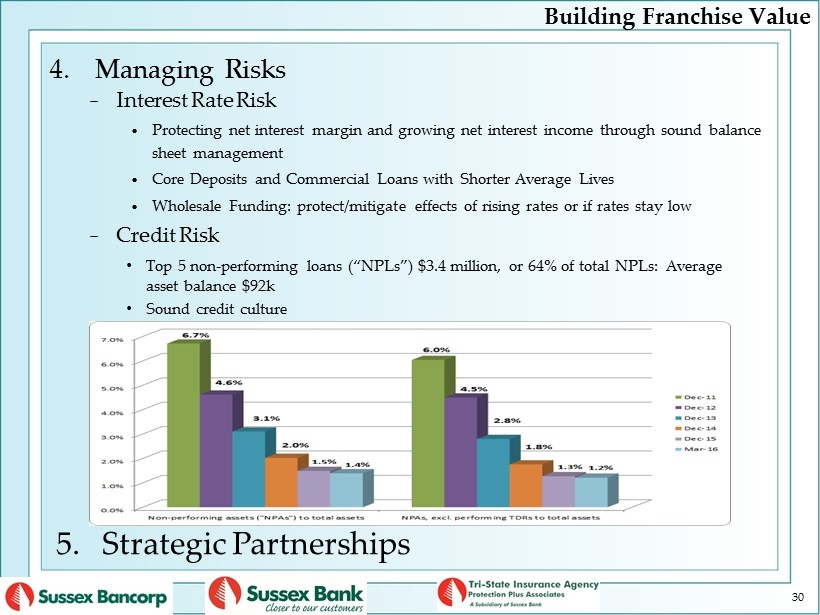
4. Managing Risks − Interest Rate Risk • Protecting net interest margin and growing net interest income through sound balance sheet management • Core Deposits and Commercial Loans with Shorter Average Lives • Wholesale Funding: protect/mitigate effects of rising rates or if rates stay low − Credit Risk • Top 5 non - performing loans (“NPLs”) $3.4 million, or 64% of total NPLs: Average asset balance $92k • Sound credit culture 30 Building Franchise Value 5. Strategic Partnerships
4. Growing Shareholder Value
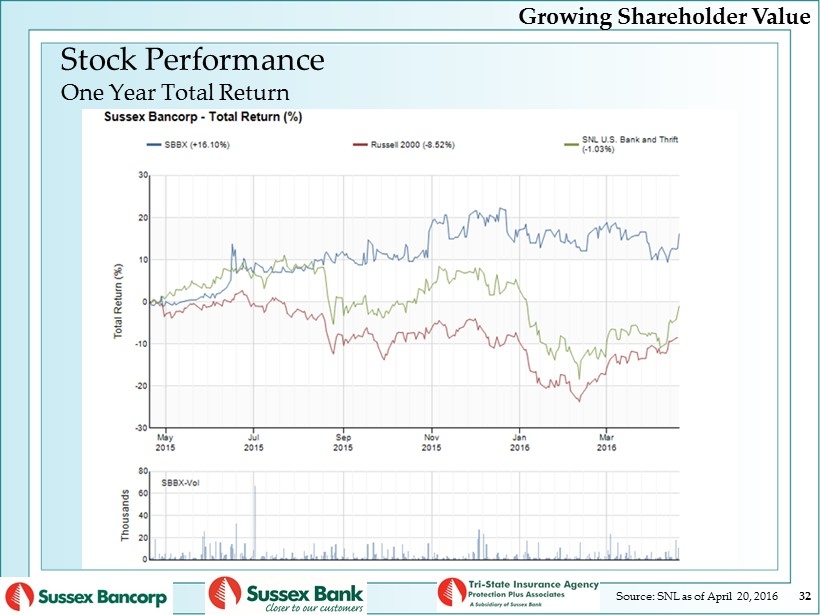
Stock Performance One Year Total Return 32 Source: SNL as of April 20, 2016 Growing Shareholder Value
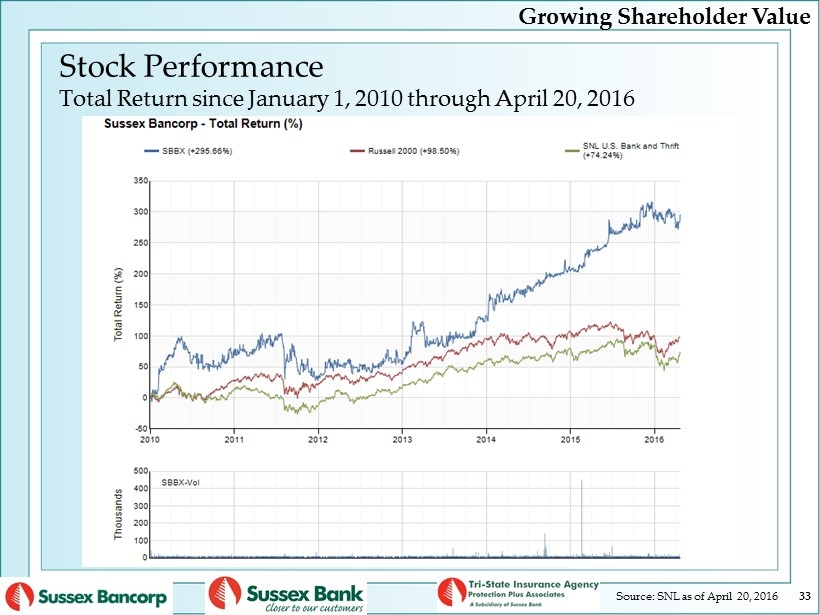
33 Stock Performance Total Return since January 1, 2010 through April 20, 2016 Growing Shareholder Value Source: SNL as of April 20, 2016
Growing Shareholder Value 1. Strategic talent management 2. Grow our business 3. Continue to strengthen profitability Resulting in: − Higher EPS and tangible book value growth − Outperforming the total returns of the broader market and bank indices over the long run 34
Annual Meeting April 27 th , 2016