Attached files
| file | filename |
|---|---|
| 8-K - 8-K - GENERAL CABLE CORP /DE/ | bgc2016q1earnings8-k.htm |
| EX-99.1 - EXHIBIT 99.1 - GENERAL CABLE CORP /DE/ | q12016earningsrelease.htm |

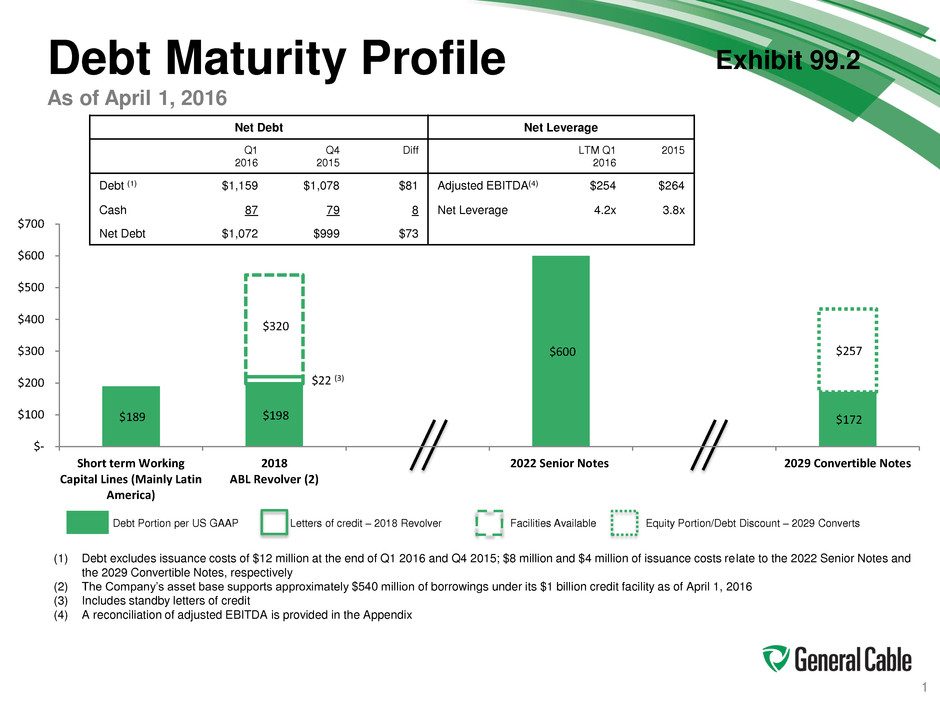
1 Debt Maturity Profile As of April 1, 2016 Debt Portion per US GAAP Letters of credit – 2018 Revolver Facilities Available Equity Portion/Debt Discount – 2029 Converts (1) Debt excludes issuance costs of $12 million at the end of Q1 2016 and Q4 2015; $8 million and $4 million of issuance costs relate to the 2022 Senior Notes and the 2029 Convertible Notes, respectively (2) The Company’s asset base supports approximately $540 million of borrowings under its $1 billion credit facility as of April 1, 2016 (3) Includes standby letters of credit (4) A reconciliation of adjusted EBITDA is provided in the Appendix Net Debt Net Leverage Q1 2016 Q4 2015 Diff LTM Q1 2016 2015 Debt (1) $1,159 $1,078 $81 Adjusted EBITDA(4) $254 $264 Cash 87 79 8 Net Leverage 4.2x 3.8x Net Debt $1,072 $999 $73 $189 $198 $600 $172 $22 (3) $257 $320 $- $100 $200 $300 $400 $500 $600 $700 Short term Working Capital Lines (Mainly Latin America) 2018 ABL Revolver (2) 2022 Senior Notes 2029 Convertible Notes Exhibit 99.2

2 Segment Adjusted Operating Income North America, Europe and Latin America North America Operating Income Q1 Q2 Q3 Q4 Q1 In millions 2015 2015 2015 2015 2016 As reported $ 29.6 $ 30.9 $ 17.9 $ 6.1 $ 17.7 Adjustments to Reconcile Operating Income Restructuring and divestiture costs 5.3 5.4 11.1 5.4 8.0 Legal and investigative costs 4.9 2.9 4.0 6.0 5.8 Customer incentive - 4.6 - - - Foreign Corrupt Practices Act (FCPA) accrual - - - 4.0 - (Gain) loss on sale of assets (0.9) - - - - Total Adjustments 9.3 12.9 15.1 15.4 13.8 Adjusted $ 38.9 $ 43.8 $ 33.0 $ 21.5 $ 31.5 Europe Operating Income Q1 Q2 Q3 Q4 Q1 In millions 2015 2015 2015 2015 2016 As reported $ 5.9 $ (1.2) $ 3.2 $ (1.3) $ 7.7 Adjustments to Reconcile Operating Income Restructuring and divestiture costs 9.1 0.8 - 7.2 3.6 (Gain) loss on sale of assets - 11.6 - - - (Gain) loss on deconsolidation of Venezuela - - 12.5 - - Total Adjustments 9.1 12.4 12.5 7.2 3.6 Adjusted $ 15.0 $ 11.2 $ 15.7 $ 5.9 $ 11.3 Latin America Operating Income Q1 Q2 Q3 Q4 Q1 In millions 2015 2015 2015 2015 2016 As reported $ (15.9) $ (2.5) $ (1.2) $ (3.2) $ (3.7) Adjustments to Reconcile Operating Income Restructuring and divestiture costs 2.8 3.1 3.1 2.7 2.5 Brazil legal accrual 2.5 - (1.9) 1.3 - (Gain) loss on deconsolidation of Venezuela - - (0.5) - - Venezuela (income)/loss 5.1 (0.6) (0.8) - - Total Adjustments 10.4 2.5 (0.1) 4.0 2.5 Adjusted $ (5.5) $ - $ (1.3) $ 0.8 $ (1.2) Core Operations - Total Adjusted Operating Income $ 48.4 $ 55.0 $ 47.4 $ 28.2 $ 41.6

3 Adjusted EBITDA (1) 12 months ended 2015 operating income and last twelve months (LTM) operating income Q1 2016 reflects the impact of a non-cash asset impairment charge of $30.6 million for the Company's business in Algeria in Q4 2015 (2) Excludes depreciation and amortization from continuing operations in Asia Pacific and Africa for the twelve months ended 2015 and the last twelve months as of Q1 2016 of $5.6 million and $4.9 million, respectively LTM Q1 12 Months Ended In millions, except per share amounts 2016 2015 Operating income from continuing operations $ 19.7 $ 20.6 Adjustments to Reconcile Operating Income Restructuring and divestiture costs 52.9 56.0 Legal and investigative costs 18.1 19.7 Foreign Corrupt Practices Act (FCPA) accrual 4.0 4.0 Customer incentive 4.6 4.6 (Gain) loss on sale of assets 11.6 10.7 Loss on deconsolidation of Venezuela 12.0 12.0 Venezuela (income)/loss (1.4) 3.7 Continuing operations (income) loss - Asia-Pacific and Africa (1) 50.7 47.7 Total Adjustments 152.5 158.4 Adjusted operating income 172.2 179.0 Depreciation and amortization(2) 82.0 84.9 Adjusted EBITDA $ 254.2 $ 263.9
