Attached files
| file | filename |
|---|---|
| 8-K - FORM 8-K - AMERISERV FINANCIAL INC /PA/ | v438098_8k.htm |
Exhibit 99.1


2 This meeting is being transmitted in its entirety beyond this room via webcast to all interested shareholders and prospective investors. This is the first year we are employing this technology and it is a notable step forward for our company.

3 2016 Annual Shareholders ' Meeting

Kerri Mueller Senior Vice President – Retail Banking 4

Craig G. Ford Chairman AmeriServ Financial, Inc . 5

Welcome to our Annual Shareholder Meeting We appreciate your ongoing loyalty and support. Welcome ! 6

Agenda • Proxy items • Comments by Chairman of the Board • Chief Financial Officer presentation • President & CEO comments • Final report on Proxy items • Question & Answer period 7

Election of Class III Directors Daniel R. DeVos Bruce E. Duke, III, M.D. Craig G. Ford Kim W. Kunkle 8

Honored Guest • Elected Officials • Labor Officials • Distinguished Guests • Past Directors • Present Directors • AmeriServ ® Employees • Our Shareholders 9

• Banking – An industry subject to continuing change • AmeriServ – Committed to carefully planned, positive change • Record Growth • Lower level of troubled loans • Deposit Increase – Year end record • Positive Customer Response 10

• Trust Company – Technology Update • Conversion Error - Expense Incurred • 2015 – Stronger year result than previous four years 11

• Bank Process – Discipline • Credit Source for Western Pennsylvania and Northern Maryland regions. • Oil Reservoirs – Natural Gas – Marcellus Shale • World Markets – Adjustment will take time • Loss for AmeriServ 12

13 Why is AmeriServ Here ? For You!

• Excellent Loan Portfolio – 99+% paying on time • Energy Industry Loan – Necessary to charge off • Protecting the AmeriServ Franchise – AmeriServ will never risk the safety and soundness of this Company . 14
• Wall Street Valuing and a Unionized Bank • AmeriServ Rust Belt Location • Community Banking – Loyalty to our C ommunities 15

16 AmeriServ Financial Focused on the long term interest of our Shareholders.

Tangible Book Value Per Share 17 $0.00 $1.00 $2.00 $3.00 $4.00 $5.00 2011 2012 2013 2014 2015 $3.76 $4.01 $4.24 $4.33 $4.56 5% Compound Annual Growth Rate

18 AmeriServ Financial The opportunity for personal involvement is the charm of community banking.

Michael D. Lynch Senior Vice President Chief Financial Officer Chief Investment Officer 19

• 2015 Financial Performance Review • 2016 First Quarter Financial Results 20

21 Annual Financial Results Through 2015
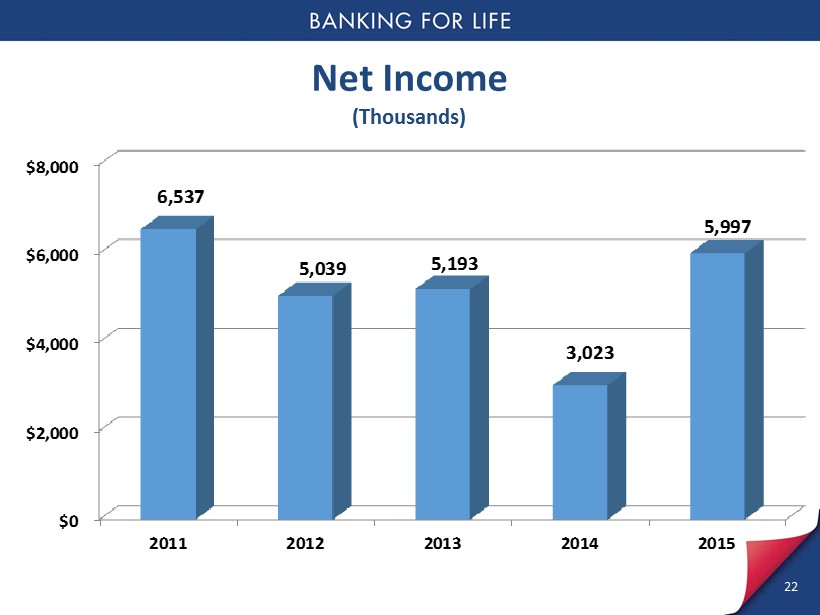
Net Income (Thousands) $0 $2,000 $4,000 $6,000 $8,000 2011 2012 2013 2014 2015 6,537 5,039 5,193 3,023 5,997 22
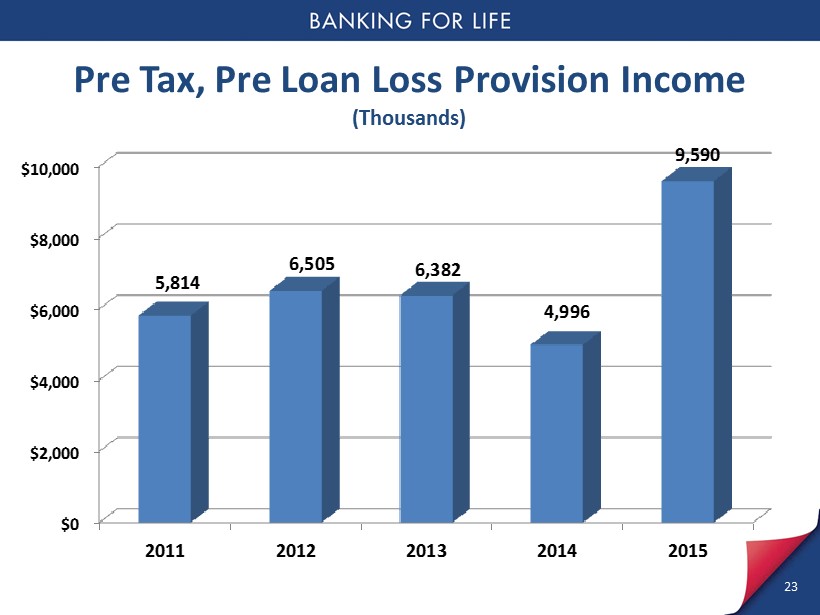
Pre Tax, Pre Loan Loss Provision Income (Thousands) $0 $2,000 $4,000 $6,000 $8,000 $10,000 2011 2012 2013 2014 2015 5,814 6,505 6,382 4,996 9,590 23

Net Interest Income (Thousands) $16,000 $21,000 $26,000 $31,000 $36,000 2011 2012 2013 2014 2015 32,283 32,203 32,861 34,044 35,360 24

Net Interest Margin 1.50% 2.00% 2.50% 3.00% 3.50% 4.00% 2011 2012 2013 2014 2015 3.72% 3.65% 3.56% 3.52% 3.49% 25

Total Average Loans (Millions) 475 575 675 775 875 2011 2012 2013 2014 2015 663 689 746 805 857 26

Total Average Deposits (Millions) 500 600 700 800 900 2011 2012 2013 2014 2015 817 833 847 872 893 27

Non - Interest Revenue (Thousands) 8,000 10,000 12,000 14,000 16,000 18,000 2011 2012 2013 2014 2015 13,569 14,944 15,744 14,323 15,267 28

Non - Interest Expense (Thousands) 20,000 25,000 30,000 35,000 40,000 45,000 2011 2012 2013 2014 2015 40,038 40,641 42,223 43,372 41,038 29

Loan Loss Provision (Thousands) (4,000) (2,000) 0 2,000 2011 2012 2013 2014 2015 Ϳ 3,575 ; Ϳ 775 ; Ϳ 1,100 ; 375 1,250 30

Non - Performing Assets (Thousands) 0 2,500 5,000 7,500 2011 2012 2013 2014 2015 5,199 7,224 4,109 2,917 6,297 31

Tangible Book Value Per Share $0.00 $1.00 $2.00 $3.00 $4.00 $5.00 2011 2012 2013 2014 2015 $3.76 $4.01 $4.24 $4.33 $4.56 32

Earnings Per Share $0.00 $0.05 $0.10 $0.15 $0.20 $0.25 $0.30 $0.35 2011 2012 2013 2014 2015 $0.24 $0.21 $0.26 $0.15 $0.31 33

2015 Financial Results Summary • We experienced significant improvement in our earnings power through a combination of revenue growth and non - interest expense reduction. • Solid loan and deposit growth to record levels was achieved through successful business development efforts while maintaining strong asset quality and tight control of our cost of funds through disciplined deposit pricing. • Non - interest expenses decreased meaningfully reflecting our continued focus on reducing and controlling costs. 34
35 Financial Results Through 1 st Quarter 2016

($1,500) ($1,000) ($500) $0 $500 $1,000 $1,500 $2,000 1Q '14 2Q 3Q 4Q 1Q '15 2Q 3Q 4Q 1Q '16 930 979 365 749 1,369 1,422 1,832 1,375 Ϳ 1,267 ; Net Income (Thousands) 36

-$0.10 -$0.05 $0.00 $0.05 $0.10 1Q '14 2Q 3Q 4Q 1Q '15 2Q 3Q 4Q 1Q '16 $0.05 $0.05 $0.02 $0.04 $0.07 $0.07 $0.09 $0.07 $0.07 Ͳ Earnings per Share 37

Net Interest Income (Thousands) $5,000 $6,000 $7,000 $8,000 $9,000 $10,000 1Q '14 2Q 3Q 4Q 1Q '15 2Q 3Q 4Q 1Q '16 8,525 8,384 8,403 8,732 8,934 8,800 9,035 8,591 8,558 38

Net Interest Margin % 2.00% 2.50% 3.00% 3.50% 4.00% 1Q '14 2Q 3Q 4Q 1Q '15 2Q 3Q 4Q 1Q '16 3.56% 3.47% 3.42% 3.49% 3.57% 3.45% 3.52% 3.30% 3.30% 39

Average Loans (Millions) $500 $600 $700 $800 $900 1Q '14 2Q 3Q 4Q 1Q '15 2Q 3Q 4Q 1Q '16 787 795 809 828 842 857 859 870 881 40

Average Deposits (Millions) $600 $700 $800 $900 $1,000 1Q '14 2Q 3Q 4Q 1Q '15 2Q 3Q 4Q 1Q '16 856 877 877 877 897 891 875 910 910 41
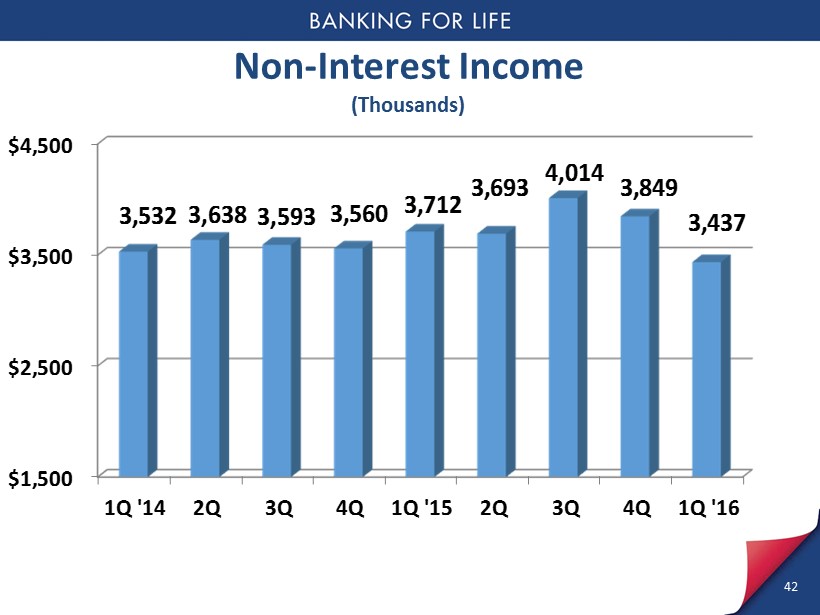
Non - Interest Income (Thousands) $1,500 $2,500 $3,500 $4,500 1Q '14 2Q 3Q 4Q 1Q '15 2Q 3Q 4Q 1Q '16 3,532 3,638 3,593 3,560 3,712 3,693 4,014 3,849 3,437 42

Non - Interest Expense (Thousands) 43 $6,000 $7,000 $8,000 $9,000 $10,000 $11,000 $12,000 1Q '14 2Q 3Q 4Q 1Q '15 2Q 3Q 4Q 1Q '16 10,737 10,621 11,244 10,770 10,410 10,239 10,219 9,865 10,345 366 10,711 305 10,170

$0 $500 $1,000 $1,500 $2,000 $2,500 $3,000 $3,500 1Q '14 2Q 3Q 4Q 1Q '15 2Q 3Q 4Q 1Q '16 0 0 0 375 250 200 300 500 3,100 Loan Loss Provision (Thousands) 44

($500) $0 $500 $1,000 $1,500 $2,000 $2,500 $3,000 $3,500 $4,000 1Q '14 2Q 3Q 4Q 1Q '15 2Q 3Q 4Q 1Q '16 0 0 0 375 250 200 300 500 3,100 ( 5 ) ( 40 ) 567 334 184 172 245 351 3,501 Loan Loss Provision Net Charge Offs Loan Loss Provision vs. Net Charge Offs (Thousands) 45

Non - Performing Assets (Thousands) $0 $2,500 $5,000 $7,500 1Q '14 2Q 3Q 4Q 1Q '15 2Q 3Q 4Q 1Q '16 3,274 4,469 3,897 2,917 3,046 2,565 2,294 6,297 3,007 46

$0 $5,000 $10,000 $15,000 1Q '14 2Q 3Q 4Q 1Q '15 2Q 3Q 4Q 1Q '16 Loan Loss Reserve Non Performing Assets 309% 227% 246% 330% 318% 379% 426% 158% 317% Allowance for Loan Loss vs. Non - Performing Assets ( Thousands) 47

Regulatory Capital Ratios As of March 31, 2016 48

2016 First Quarter Summary • The asset quality issue that caused AmeriServ to recognize a loss in the first quarter is now resolved and our asset quality has returned to a strong level. • We expect to quickly return to profitability through solid loan and deposit growth along with the expense savings from profitability improvement initiatives currently in process. • Our focus remains on successfully executing our business plan to further improve profitability in 2016 while continuing to maintain excellent asset quality. 49

Jeffrey A. Stopko President & Chief Executive Officer AmeriServ Financial, Inc . 50

Key Goal • Build on Banking for Life Theme • Be a Leading Community Bank in the Markets we Serve 51
• Lifetime Financial Partner – To meet the customer’s financial needs wherever they are in life’s journey. • Maintain a safe and sound balance sheet • Leader in economic development and growth 52
Key Goal • Continue to Invest Prudently in Technology 53

Invest in Technology • Improve customer service and competitiveness • Increase efficiency • Helps address cyber security 54

Key Goal • Increase Profitability • Improve Shareholder Value by Increasing Capital Returns 55

Increase Profitability • Return to typical profitability levels in second quarter 2016 • Further increase Earnings per Share and Tangible Book Value per Share • Increase revenue through earning asset growth and growth of Trust and Wealth Management fees 56

• Reduce Non - Interest Expense – Consolidated State College Market Branch Offices – Eliminated One Executive Office Position • Should Result in Total Annual Expense Savings of $750,000 57 Increase Profitability

• 2016 First Quarter Payoff $21 million of SBLF Preferred Stock • Accomplished by using funds from a $7.65 million subordinated debt issuance and internal funds 58 Improve Shareholder Value by Increasing Capital Returns

Improve Shareholder Value by Increasing Capital Returns • Consider more active return of capital to shareholders in second half 2016 – Increased common dividend payments – Common stock buyback program • Preserve capital to support balance sheet growth 59

Thank You! • Customers • Shareholders • AmeriServ’s Commitment to You and the Communities We Serve ! 60

James Huerth President AmeriServ Trust & Financial Services Company 61

Mike Baylor Executive Vice President Chief Commercial Banking Officer 62

Carolyn Concannon Executive Vice President Chief Risk Officer Chief Credit Officer 63

Report On Election 64

Question & Answer Period 65
