Attached files
| file | filename |
|---|---|
| EX-10.25 - EXHIBIT 10.25 - SquareTwo Financial Corp | ex-1025amendmentno7toloana.htm |
| EX-31.1 - EXHIBIT 31.1 - SquareTwo Financial Corp | ye2015ex311ceocertification.htm |
| EX-31.2 - EXHIBIT 31.2 - SquareTwo Financial Corp | ye2015ex312cfocertification.htm |
| EX-32.1 - EXHIBIT 32.1 - SquareTwo Financial Corp | ye2015ex321soxcertification.htm |
UNITED STATES
SECURITIES AND EXCHANGE COMMISSION
Washington, DC 20549
________________________________________________________________
FORM 10-K
________________________________________________________________
x ANNUAL REPORT PURSUANT TO SECTION 13 OR 15(d) OF THE SECURITIES EXCHANGE ACT OF 1934
For the fiscal year ended December 31, 2015
or
o TRANSITION REPORT PURSUANT TO SECTION 13 OR 15(d) OF THE SECURITIES EXCHANGE ACT OF 1934
For the transition period from to
Commission File Number: 333-170734
_____________________________________________
SquareTwo Financial Corporation
(Exact name of Registrant as Specified in Its Charter)
_____________________________________________
Delaware | 84-1261849 | |
(State or Other Jurisdiction of Incorporation or Organization) | (I.R.S. Employer Identification No.) | |
4340 South Monaco Street, Second Floor | ||
Denver, Colorado | 80237 | |
(Address of Principal Executive Offices) | (Zip Code) | |
303-296-3345
(Registrant’s telephone number, including area code)
Securities registered pursuant to Section 12(b) of the Act: | None | |
Securities registered pursuant to Section 12(g) of the Act: | None | |
Indicate by check mark if the registrant is a well-known seasoned issuer, as defined by Rule 405 of the Securities Act. Yes o No x
Indicate by check mark if the registrant is not required to file reports pursuant to Section 13 or Section 15(d) of the Act. Yes x No o
Indicate by check mark whether the registrant: (1) has filed all reports required to be filed by Section 13 or 15(d) of the Securities Exchange Act of 1934 during the preceding 12 months (or for such shorter period that the registrant was required to file such reports), and (2) has been subject to such filing requirements for the past 90 days. Yes o No o
(Note: The registrant is a voluntary filer of reports under Section 13 or 15(d) of the Securities Exchange Act of 1934; the registrant has filed during the preceding 12 months all reports that it would have been required to file by Section 13 or 15(d) of the Securities Exchange Act of 1934 if the registrant had been subject to one of such Sections.)
Indicate by check mark whether the registrant has submitted electronically and posted on its corporate Web site, if any, every Interactive Data File required to be submitted and posted pursuant to Rule 405 of Regulation S-T (§232.405 of this chapter) during the preceding 12 months (or for such shorter period that the registrant was required to submit and post such files). Yes x No o
Indicate by check mark if disclosure of delinquent filers pursuant to Item 405 of Regulation S-K (§229.405 of this chapter) is not contained herein, and will not be contained, to the best of registrant's knowledge, in definitive proxy or information statements incorporated by reference in Part III of this Form 10-K or any amendment to this Form 10-K x
Indicate by check mark whether the registrant is a large accelerated filer, an accelerated filer, a non-accelerated filer, or a smaller reporting company. See the definitions of “large accelerated filer,” “accelerated filer” and “smaller reporting company” in Rule 12b-2 of the Exchange Act. (Check one):
Large accelerated filer o | Accelerated filer o | |
Non-accelerated filer x (Do not check if a smaller reporting company) | Smaller reporting company o | |
Indicate by check mark whether the registrant is a shell company (as defined in Rule 12b-2 of the Act): Yes o No x
As of April 25, 2016, 1,000 shares of the registrant’s common stock, par value $0.001 per share, were outstanding.
The aggregate market value of the voting and non-voting common equity held by non-affiliates of the registrant as of June 30, 2015, the last business day of the registrant’s most recently completed second fiscal quarter, was zero.
DOCUMENTS INCORPORATED BY REFERENCE
None
TABLE OF CONTENTS
Page | ||
i
Cautionary Statement Regarding Forward-Looking Statements
Certain statements in this Annual Report on Form 10-K, particularly statements found in "Risk Factors," "Business," and "Management's Discussion and Analysis of Financial Condition and Results of Operations," may constitute "forward-looking statements" within the meaning of the U.S. federal securities laws. Forward-looking statements generally can be identified by the use of terminology such as "may," "will," "should," "expect," "intend," "estimate," "anticipate," "plan," "foresee," "predict," "believe," "potential" or "continue" or, in each case, their negative or other variations or similar expressions. These statements are intended to take advantage of the "safe harbor" provisions of the U.S. federal securities laws, including the Private Securities Litigation Reform Act of 1995 ("PSLRA"). These forward-looking statements include all statements that do not relate solely to historical facts.
We caution you that these forward-looking statements are not guarantees of future performance and involve risks, uncertainties and assumptions that are difficult to predict. We believe these statements to be reasonable when made, based on information currently available to us. However, actual outcomes and results may differ materially from what is expressed or forecasted in these forward-looking statements. As a result, these statements speak only as of the date they were made. We undertake no obligation to publicly update or revise any forward-looking statements, whether as a result of new information, future events or otherwise. In view of such uncertainties, investors should not place undue reliance on our forward-looking statements.
Such forward-looking statements involve known and unknown risks, including, but not limited to, those identified in "Risk Factors" along with changes in general economic, business and labor conditions. More information regarding such risks and other risks can be found under the headings "Risk Factors," "Business," "Management's Discussion and Analysis of Financial Condition and Results of Operations" and other sections of this Annual Report on Form 10-K. Such risk factors should not be construed as exhaustive and should be read with the other cautionary statements in this Annual Report on Form 10-K. New risks and uncertainties may emerge in the future. It is not possible for us to predict all of such risks or uncertainties, nor can we assess the extent to which any factor, or combination of factors, may cause actual results to differ from those contained in forward-looking statements. Risks related to our business, among others, could cause actual results to differ materially from those described in the forward-looking statements. Such risks include those related to:
• our ability to continue as a going concern;
• our ability to extend or refinance our debt obligations as they come due, including without limitation our senior revolving credit facility maturing in April 2016 and our Senior Second Lien Notes maturing in April 2017;
• global political and financial instability, the availability of credit, the supply of money and interest rates;
• our concentration of suppliers, customers and branch offices;
• increased competition, growth and cyclicality of our industry;
• heavy reliance on intellectual property and information technology assets;
• the restrictive elements of our financing arrangements and our ability to comply with such arrangements more generally;
• our reliance on management and its ability to control, among other things, growth;
• our reliance on the legal system and practicing attorneys;
• our exposure to current or future governmental or regulatory actions;
• negative perceptions of the debt collection industry;
• unique current or future accounting methods;
• the interests of our controlling equity holder; and
• the difficulty of realizing the value of the collateral.
1
PART I
Item 1. Business.
Our Company
SquareTwo Financial Corporation is a Delaware corporation that was organized in February 1994 and is headquartered in Denver, Colorado. On August 5, 2005, CA Holding, Inc. acquired 100% of the outstanding stock of SquareTwo Financial Corporation and its subsidiaries (the “Acquisition”). We are a leading purchaser of charged-off consumer and commercial receivables in the accounts receivable management industry. Unless otherwise indicated, the terms (i) “SquareTwo,” “we,” “our,” “us” and the “Company” refer to SquareTwo Financial Corporation and all of its restricted subsidiaries on a consolidated basis, (ii) “SquareTwo Financial Corporation” refers to SquareTwo Financial Corporation and not to its parent company or any of its subsidiaries, and (iii) “Parent” refers to CA Holding, Inc. and not to any of its subsidiaries.
Our primary business is the acquisition, management and collection of charged-off consumer and commercial accounts receivable that we purchase from financial institutions, finance and leasing companies, and other issuers in the United States (U.S.) and Canada. Charged-off accounts receivable, which we refer to as "charged-off receivables" or "accounts," are defaulted accounts receivable that credit issuers have charged-off as bad debt, but that remain subject to collection. We refer to a group of accounts as a "portfolio," and, once purchased, we refer to our owned charged-off receivables as our "purchases" or "purchased debt." We believe that we are one of the largest purchasers of "fresh" charged-off credit card and consumer loan receivables in the U.S. Fresh charged-off credit card and consumer loan receivables are generally 180-210 days past due at the time of sale and typically have not been subject to previous collection attempts by a third-party collection agency. The act of charging off an account is an action required by banking regulations and is an accounting action that does not release the obligor on the account from his/her responsibility to pay amounts due on the account. Because the credit issuer was unable to collect the charged-off receivables that we purchase, we are able to acquire these portfolios at a substantial discount to their face value.
Our business model leverages our analytic expertise, technology platform, and in the U.S., a unique combination of SquareTwo-owned call centers operating under the d/b/a name Fresh View Solutions (“Fresh View”), one independently owned collections agency exclusively dedicated to SquareTwo, and a network of regional law offices, also referred to as “branch offices,” exclusively dedicated to SquareTwo. We refer to our U.S. operating business model as the “Closed Loop Network” as all newly acquired customer accounts are managed within our centralized, proprietary technology platform called eAGLE, regardless of where an account is in its lifecycle. This integrated account management system and the Closed Loop Network allow us to achieve the highest level of information security and data accuracy, as well as to strive to provide a uniform customer experience during every stage of collections regardless of location. We utilize non-exclusive law firms to liquidate legacy customer commitments, for collections on accounts where legal judgments and payment plans had been established prior to the formation of our Closed Loop Network. Lastly, in Canada, where we exclusively service our Canadian customers, we utilize a company-owned call center as well as third-party non-legal and legal collection firms.
Our focus throughout the recovery process is on the customer, and helping the customer resolve their outstanding financial commitments, while ensuring that those customers who demonstrate a significant ability to pay their contractual obligations actually satisfy their obligations. In accordance with our commitment to customer service, respect, and operational excellence, we are dedicated to treating customers fairly and ethically and maintaining stringent compliance standards, which we believe allows us to liquidate more effectively.
From 1999, our first full year of purchasing debt, to December 31, 2015, we have invested approximately $2.7 billion in the acquisition of charged-off receivables, representing over $39.0 billion in face value of accounts. From 1999 to December 31, 2015, we have grown our business from $8.7 million to $353.1 million of annual cash proceeds on owned charged-off receivables, representing a compound annual growth rate of approximately 26%.
The combination of our historical and future recovery efforts is expected to result in cumulative gross cash proceeds of approximately 2.2x our invested dollars since our first purchase in 1998. Based on our proprietary analytical models, which utilize historical and current account level data as well as economic, pricing and collection trends, we expect that our U.S. owned charged-off receivables as of December 31, 2015 of $7.1 billion (active face value) will generate approximately $482.6 million in gross cash proceeds. We refer to this as estimated remaining proceeds ("ERP"). We expect to receive approximately 78% of these proceeds within the next 36 months starting January 1, 2016. In addition, we expect our Canadian owned charged-off receivables of $1.9 billion (active face value) to generate approximately $74.0 million in additional ERP. Therefore, the total ERP for both our U.S. and Canadian owned charged-off receivables was $556.6 million as of December 31, 2015. This compares to total ERP of $654.9 million as of December 31, 2014 and $840.9 million as of December 31, 2013.
2
These expectations are based on historical data as well as assumptions about future collection rates and consumer behavior. We cannot guarantee that we will achieve such proceeds.
Our U.S. Closed Loop Network
Recovery efforts on all newly acquired U.S. purchased debt are managed by the Closed Loop Network discussed in the preceding section. Historically, our branch offices were the primary channel for recovery work on our behalf, but during 2014, we expanded our asset recovery options in the U.S. by opening a company-owned call center dedicated to consumer collections. Newly acquired accounts are placed for collection with our Fresh View call centers, where our call center employees are compensated based on their ability to meet our stringent compliance and operating standards. Legal recovery operations, if necessary, continue to progress through our dedicated branch office legal channel.
Fresh View enables us to satisfy a wide array of our bank clients’ needs while helping SquareTwo remain a leader in compliance. Regardless of where in our Closed Loop Network we place an account, either with Fresh View or with one of our branch offices, all customer account information and collection activity is managed within eAGLE, our proprietary integrated account management system, and in accordance with a standardized set of comprehensive policies and operational procedures, which we refer to as our “Compliance Management System.” This ensures that regardless of the chosen recovery option, we strive to provide a uniform customer experience. In addition, our Closed Loop Network business model creates valuable operating efficiencies and synergies, which we believe will translate to improved financial performance in the future.
Once accounts are designated for legal recovery efforts, they are placed into the network of legal branch offices. The branch offices perform recovery work exclusively on our behalf and utilize our account management system in accordance with specified contractual arrangements. Effective June 1, 2015, the Company entered into new business agreements with its branch offices replacing the previous contractual arrangements that were subject to franchise law. The new legal framework removed the legal requirements of franchise law in multiple jurisdictions and enables the Company more control and flexibility in how we manage the branch offices. These contractual agreements have a term of three years and provide the branch offices with a license to use our proprietary collection and account management software; however, SquareTwo no longer charges royalty fees as a percentage of each dollar collected.
We are under no obligation to provide accounts to any branch office. We pay these offices a service fee, which varies based upon the amount collected as well as their performance against certain of our operational incentives. We have historically allocated accounts to our branch offices based on capacity, geographic coverage, and their performance against our return expectations and adherence to operational and compliance requirements. In addition, branches are required to meet our stringent compliance standards to continue to be a part of our Closed Loop Network.
Subsidiary Entities
We operate our domestic charged-off receivables management business through a series of subsidiary entities, including CACH, LLC, CACV of Colorado, LLC, CACH of NJ, LLC, CACV of New Jersey, LLC, SquareTwo Financial Services Corporation (d/b/a Fresh View Solutions), Orsa, LLC, Candeo, LLC and Autus, LLC. Charged-off consumer receivables acquired by certain of the aforementioned subsidiaries are placed for collections within our Closed Loop Network.
We operate our Canadian business through a Canadian subsidiary, SquareTwo Financial Canada Corporation ("SquareTwo Canada"). Acting through its subsidiaries, SquareTwo Canada exclusively purchases Canadian consumer credit charged-off receivables. SquareTwo Canada utilizes a company-owned call center and third-party non-legal and legal collection firms to pursue recovery on the accounts it owns and manages. Our Canadian business accounted for 18.8% of our total Adjusted EBITDA and 14.0% of our total revenues for the year ended December 31, 2015 and represented 13.4% of our total assets as of December 31, 2015.
We have two operating segments: Domestic and Canada, which we consider to be our reporting segments in accordance with U.S. generally accepted accounting principles ("GAAP"). Included in the domestic operating segment are our consumer, commercial and other business lines. Consistent with how our board of directors (the "Board of Directors") and the leadership team review the Company's strategy and performance, the following description of our business operations focuses on the Company as a whole. Additional information on our operating segments is contained in the "Management's Discussion and Analysis of Financial Condition and Results of Operations" section under the heading “Segment Performance Summary” as well as in Note 13 to the consolidated financial statements.
3
Operations
Our operations can generally be categorized around two primary business processes: (i) underwriting and purchasing and (ii) management of collections and other cash proceeds on purchased debt.
Underwriting and Purchasing
The success of our business depends heavily on our ability to find charged-off receivables for purchase, evaluate these assets accurately and acquire them at the appropriate pricing. We have a dedicated Business Development team that generates acquisition opportunities. Historically, we have purchased charged-off receivables from seven of the ten largest U.S. credit card issuers identified in The Nilson Report, which is a leading source of news and proprietary research on the payment system industry. In addition to our relationships with the largest U.S. credit card issuers, we have extensive relationships with marketplace lenders or financial technology companies, also known as "FinTechs", super-regional and regional banks and other credit issuers. Potential purchasing opportunities are reviewed in detail by our Decision Science department, which is responsible for creating forecasted cash flows for each purchase using our proprietary statistical models and our experience with similar purchases. These models and related assumptions are reviewed by our investment committee, which includes members of our senior leadership team and representatives from each key business function, to determine the appropriate purchase price for the available portfolios. We target purchases that meet return thresholds determined by our investment committee. In times of increased pricing in the market, we may accept a lower return, while still maintaining our yield-based purchasing strategy. In addition to the relationships described above, we are actively engaged in the development of business opportunities in purchasing other forms of charged-off domestic and Canadian receivables.
The majority of our purchasing opportunities are sourced through limited auctions where the original credit issuer is generally interested in dealing with a small group of parties that have proven long-term operational and financial history. We also evaluate one-off negotiated deals and broader auction sales depending on the type of charged-off receivable and process desired by the seller. Our Business Development team spends substantial time seeking to develop new business relationships among financial institutions which have not historically sold their charged-off consumer and commercial accounts.
The following table summarizes our investment activity in purchased debt for the years ended December 31, 2015, 2014, and 2013 by type of charged-off receivable:
December 31, | |||||||||||||||||||
Purchased Debt, Cost ($ in thousands) | 2015 | 2014 | 2013 | Totals | % of Total | ||||||||||||||
Credit Card/Consumer Loan - Fresh | $ | 52,093 | $ | 101,102 | $ | 197,420 | $ | 350,615 | 72.6 | % | |||||||||
Credit Card/Consumer Loan - Non-Fresh | 19,989 | 14,346 | 40,912 | 75,247 | 15.6 | % | |||||||||||||
Other(1) | 26,165 | 11,299 | 19,778 | 57,242 | 11.8 | % | |||||||||||||
Purchased Debt - Total | $ | 98,247 | $ | 126,747 | $ | 258,110 | $ | 483,104 | 100.0 | % | |||||||||
(1) Other includes commercial, student loan and other purchased debt assets.
In any period, we acquire charged-off receivables that can vary dramatically in age, type, quality, and ultimately collectability. Because of this variation, we may pay significantly different prices for our charged-off receivables within any period and from period to period. In addition, market forces can drive prices up or down. Regardless of the price paid for charged-off receivables, we target a required rate of return for each of our purchases based on the unique qualities of each portfolio. Our purchasing strategy in a given period is based predominantly on expected returns at pricing which we believe will be successful in the market compared to the risks we perceive on potential impacts to collectability.
4
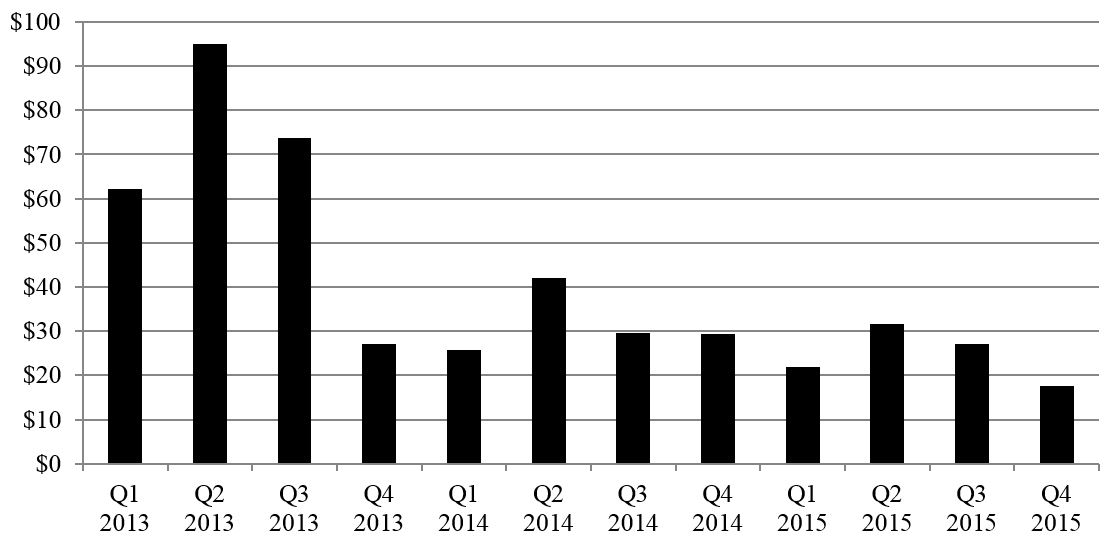
The following chart outlines our quarterly investment pace in the years ended December 31, 2015, 2014, and 2013:
Quarterly Purchased Debt, Cost ($ in millions)
Cash Proceeds on Purchased Debt
A key driver to our performance, and one of the primary metrics monitored by our management team, is cash proceeds received from our purchased debt. This measurement, and our focus on cash proceeds, is important because proceeds drive our business operations. Included in cash proceeds are non-legal collections, legal collections, the recovery of certain legal costs previously paid by us (which we refer to as “court cost recoveries”), bankruptcy proceeds, and returns of non-conforming accounts (which we refer to as “recourse”). These incoming cash flow streams and their respective relationships to the collection life cycle are described further below.
Non-Legal Collections. Once we acquire a portfolio, we pursue collections on a non-legal basis, which means collection activities other than initiating lawsuits or other legal action. Non-legal collections offer the most cost-effective means for the company to realize cash proceeds. In the year ended December 31, 2015, approximately $118.1 million, or 38.1%, of our total domestic cash proceeds on owned accounts was generated through telephone and letter campaigns initiated through the non-legal collection channel. This compares with approximately $162.8 million, or 43.2%, in the year ended December 31, 2014 and approximately $281.6 million, or 54.6%, in the year ended December 31, 2013. In the U.S., we pursue non-legal collections either through Fresh View or through one of our exclusive regional branch offices. Historically, our branch offices were the primary channel for recovery work on our behalf. During 2014, we expanded our asset recovery options in the U.S by opening a company-owned call center dedicated to consumer collections. Since the opening of our Fresh View consumer call center, newly acquired accounts are placed for collection exclusively within Fresh View. However, certain of the accounts that had previously been placed into our branch office network for non-legal collections are still being pursued by the respective branch office. Our call center employees are compensated based on their ability to meet our stringent compliance and operating standards. In Canada, we also utilize a combination of a company-owned call center and third-party non-legal and legal collection firms to pursue recovery on our Canadian accounts.
If an account remains uncollected after its initial placement into the non-legal channel, we will evaluate moving that account to a legal collection effort. Our strong preference is to assist customers in resolving their financial commitments without filing a lawsuit, however in some cases, court processes must commence in order to collect monies owed under the contracts we have purchased. Our Operations team and our Law and Regulatory Affairs team work closely with Fresh View call center management and our branch offices to ensure that the correct customers receive appropriate oral and written communications and our work standards and policies are followed, to optimize recovery efforts and to help respond to changes in the collections environment or regulatory landscape.
5
Legal Collections. While our preference is not to file suit, in the instance that a customer's apparent financial resources indicate they have the ability but not the willingness to pay, legal action may be pursued. In addition to determining legal eligibility based on applicable statutes or jurisdictional requirements, we systematically exclude a number of otherwise legally eligible accounts such as customers that have made or committed themselves to at least a partial payment. In the year ended December 31, 2015, approximately $186.0 million or 59.9%, of our total domestic cash proceeds on owned accounts was generated through legal collection efforts, which includes collections in the legal channel received prior to the initiation of legal action. This compares with approximately $207.9 million, or 55.2%, in the year ended December 31, 2014 and approximately $212.8 million, or 41.3%, in the year ended December 31, 2013. While overall legal collections have decreased over the past three years, they have increased as a percentage of our total domestic cash proceeds which is a direct result of our domestic portfolio aging as we have purchased less during the years 2014 and 2015 than in years prior. As our portfolio becomes weighted more heavily towards older portfolios, legal collections increase as a percentage of total domestic cash proceeds and this aging is reflected in ERP.
Once an account is designated for suit in the U.S., we place it with a branch office within the Closed Loop Network, which has the capability of bringing suit in the location of the customer. We pay our branch offices for their collection efforts based on their performance subject to compliance with our numerous operating and regulatory standards. In addition to these collection fees, we typically pay court costs and related fees on accounts placed for legal collection. If such fees are ultimately recovered, they are referred to as court cost recoveries and are included in legal collections. Our legal collection efforts over time have led to the development of a significant number of awarded judgments on our owned accounts, which we believe will help generate future cash flows. In Canada, when appropriate, we utilize third party law firms to assist with our legal collection efforts.
Recourse and Bankruptcy Proceeds. Under the terms of our purchase contracts, we typically have recourse, or the right to return, certain accounts to the seller within a designated time period from the purchase date should the account not meet certain agreed upon requirements, including the accounts of customers who were deceased or bankrupt at the time of purchase. If a customer enters into bankruptcy after our contractual recourse period, we utilize Fresh View to collect any proceeds as a result of the court driven bankruptcy process. Since 2013, account sales have no longer been part of our core liquidation strategy.
Industry Overview
The accounts receivable management industry can best be explained by separately describing its (i) composition, practice, and size, (ii) market, (iii) regulation, and (iv) recent industry trends.
Composition, Practice, and Size
Receivables in the accounts receivable industry are classified as consumer and commercial obligations which consist of short- and intermediate-term credit extended to individuals and businesses. The unsecured consumer and commercial debt is segmented as revolving and non-revolving installment loan debt.
The U.S. accounts receivable management industry is comprised of a wide range of entities from very small local operating entities to large public corporations with national and international operations and includes the following types of operating entities: (i) contingency collection agencies, (ii) debt purchasers and (iii) collection law firms.
Contingency collection agencies work predominantly for issuers of credit on a fee per dollar collected basis and represent the largest segment (in terms of number of firms and annual collections) in the industry. Credit issuers use contingency collection agencies primarily to supplement their own internal recovery efforts. A contingency collection agency will typically receive placements of accounts for a pre-specified period of time, typically four to six months, during which they will have the opportunity to collect the accounts before they are recalled by the credit issuer and moved to a different agency or method of collection.
Historically, debt purchasers have ranged from large purchasers of debt that have their own collection platform, diversified portfolios, and international operations to contingency collection agencies that acquire additional purchased debt volume as a secondary business. Smaller purchasers of debt may acquire accounts specific to a particular asset class or geography or may represent a discrete group of investors that outsources all collections work. Due to increasing regulatory scrutiny over the accounts receivable industry, the number of debt purchasers that can meet stringent regulatory requirements has dramatically decreased, leaving large purchasers of debt as the primary debt purchasers in the U.S.
6
Debt purchasers often focus on different stages of delinquent or charged-off accounts. Credit card and consumer loan asset classes typically vary from fresh charge-offs to "quad" charge-offs (accounts that have been placed with three prior agencies at the time of sale). There are also active debt purchasing markets for other consumer receivables including charge-offs in the telecom, utility and healthcare markets which tend to consist of smaller average account balances than credit card charge-offs.
Collection law firms generally work for a combination of credit issuers and debt purchasers to pursue legal recoveries on accounts. These firms typically receive reimbursement for non-personnel costs associated with pursuing legal recoveries and are compensated on a fee per dollar collected basis. The placement of an account with a collection law firm typically lasts much longer than the placement of an account with a contingency agency as the legal recovery process can take several years.
While several national and regional networks of collection law firms have been developed, we believe our Closed Loop Network consisting of company owned call centers and a network of exclusive regional branch offices, all of which operate on our proprietary technology platform and in accordance with our Compliance Management System, is unique within the industry. Both the integrated account management technology platform and our Compliance Management System provide our call centers and branch offices with a holistic suite of tools to maximize liquidations while providing each customer with a best-in-class customer experience. In addition, unlike the typical collection law firm or collection agency, our agreements contain provisions which restrict the ability of the branch offices to collect debt for other providers.
Market
At a high-level, the supply of debt available for purchase in our markets is determined based on business and consumer reliance on credit, charge-off rates, changing regulatory requirements, and the originating financial institutions' strategy to sell charged-off receivables. Historically, business and consumer reliance on credit and the corresponding charge-off rates associated with that credit have moved in tandem with the broader economy, albeit sometimes on a lagged basis. However, the originating financial institutions' decision to sell can be impacted by multiple factors that do not always trend with the macro-economic environment. These factors have included (i) changing regulatory requirements associated with selling charged-off receivables, (ii) the benefits versus perceived risks to produce returns on their charged-off portfolio through collection efforts rather than selling, and (iii) the demand of the accounts receivable management industry to buy and corresponding market pricing. These factors and others can cause the supply of charged-off debt available to purchase to move in cycles that can be unpredictable.
The price of charged-off debt for sale is primarily dictated by the supply and quality of charged-off debt for sale. Similar to a commodity, supply and pricing for charged-off debt have an inverse relationship and can ebb and flow as the willingness of originating financial institutions to sell changes.
In addition to consumer credit quality impacts, collectability of charged-off accounts receivable is generally dictated by the ability to find the customer and the customer's willingness to pay. We believe that economic indicators such as unemployment rates, consumer confidence and home equity values are generally indicative of trends in the recoverability of charged-off receivables. These economic indicators have experienced positive trends over the last several years which we believe will be a long term positive for the accounts receivable management industry.
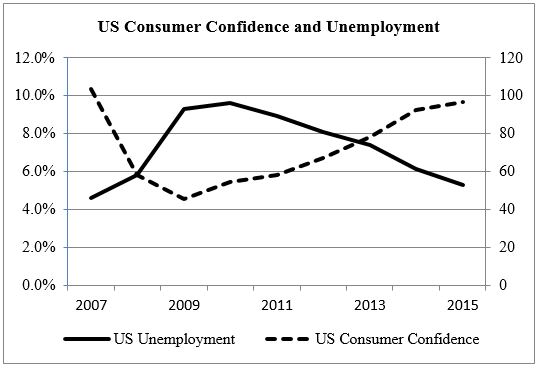
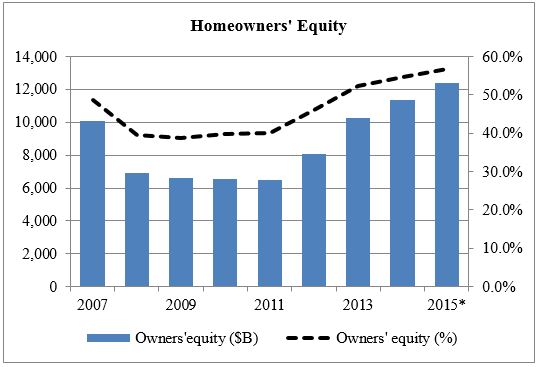
Source: Moody's Analytics Source: Federal Reserve. *Data through Q3 2015
7
Regulation
The industry is regulated by multiple regulatory bodies and rules. As a purchaser of charged-off receivables that relies on the efforts of our Closed Loop Network, we are impacted by federal, state and local laws that establish specific guidelines and procedures that debt collection account representatives must follow when collecting consumer accounts. Failure to comply with these laws could lead to fines or loss of licensure of our call centers or branch offices that could have a material and adverse effect on us. Court rulings in various jurisdictions also impact call centers and branch offices’ ability to collect our charged-off receivables.
Significant regulatory bodies, federal laws and regulations applicable to us, our call centers and our branch offices include the following:
Dodd-Frank Wall Street Reform and Consumer Protection Act. With the passage of the Dodd-Frank Wall Street Reform and Consumer Protection Act (“Dodd-Frank”) in 2010, the Consumer Financial Protection Bureau (“CFPB”) was established and initiated regulatory authority over certain entities in the industry starting in January 2013. The CFPB has jurisdiction over the debt purchasing, debt collection and credit issuance industries and will be allowed to pursue enforcement actions and issue regulations interpreting the Fair Debt Collection Practices Act ("FDCPA"). Late in 2013, the CFPB issued an Advance Notice of Proposed Rulemaking (the “ANPR”) pursuant to which it posed 162 questions addressing issues raised in the debt collection and purchasing markets. The expressed intention of the CFPB is to use the responses to the questions to guide it in the issuance of regulations governing these industries. The timing and content of these regulations and the impact of these regulations on the debt purchasing and debt collection industries remain uncertain.
FDCPA. The FDCPA was adopted in 1977 to provide the collection industry with guidance as to appropriate actions in the collection of consumer indebtedness and to provide protection to consumers from deceptive and abusive collection practices. While the FDCPA has been amended periodically, the basic structure of the law has remained unchanged since its enactment. Under Section 814(a) of the FDCPA, the Federal Trade Commission ("FTC") has the authority to investigate actions that may violate the FDCPA or that may be considered to be unfair or deceptive acts or practices forbidden by Section 5 of the FTC Act. The FTC does not have the authority to issue regulations interpreting the FDCPA but the FTC issues an annual written report to Congress with recommendations for legislative improvements to the FDCPA. Pursuant to Section 814(b)-(d) of the FDCPA, the CFPB has both rulemaking and enforcement authority with regard to the FDCPA’s provisions.
Fair Credit Reporting Act/Fair and Accurate Credit Transaction Act of 2003. The Fair Credit Reporting Act and its amendment entitled the Fair and Accurate Credit Transaction Act of 2003 ("FACT Act") place requirements on providers of credit information regarding verification of the accuracy of information provided to credit reporting agencies and requires such information providers to investigate consumer disputes concerning the accuracy of such information. The FACT Act also requires certain conduct in the cases of identity theft or unauthorized use of a credit card and direct disputes with the creditor.
The Financial Privacy Rule. Promulgated under the Gramm-Leach-Bliley Act, this rule requires that financial institutions, including collection agencies, develop policies to protect the privacy of consumers' private financial information and provide notices to consumers advising them of their privacy policies. It also requires that if private personal information concerning a consumer is shared with another unrelated institution, the consumer must be given an opportunity to opt out of having such information shared. Since we do not share consumer information with non-related entities, except as required by law, or except as allowed in connection with the collection efforts of our call centers and branch offices, the customers of our owned and managed charged-off receivables are not entitled to any opt-out rights under this act. This rule is enforced by the CFPB. Consumers do not have a private cause of action for violations of the Gramm-Leach-Bliley Act.
The Safeguards Rule. Also promulgated under the Gramm-Leach-Bliley Act, this rule specifies that we, and our branch offices, must safeguard financial information of consumers and have a written security plan setting forth information technology safeguards and the ongoing monitoring of the storage and safeguarding of electronic information. Enforcement of the Safeguards Rule remains with the FTC.
Telephone Consumer Protection Act. In the process of collecting accounts, our call centers and branch offices may use automated dialers to place calls to consumers. This act and similar state laws place certain restrictions on telemarketers and users of automated dialing equipment that place telephone calls to consumers.
8
U.S. Bankruptcy Code. To prevent any collection activity with bankrupt customers by creditors and collection agencies, the U.S. Bankruptcy Code provides for an automatic stay, which prohibits certain contacts with consumers after the filing of bankruptcy petitions.
Additionally, there are state and local statutes and regulations comparable to the above federal laws and other state-and-local-specific licensing requirements that affect our operations and the operations of our call centers and branch offices. State laws may also limit interest rates and fees, methods of collections, as well as the timeframe in which judicial actions may be initiated to enforce the collection of consumer accounts. Failure to comply with current or future laws and regulations may result in the imposition of fines and/or restrictions or prohibitions on us, our call centers or our branch offices' ability to operate. Laws, administrative regulations and their future changes or interpretations may ultimately have a negative impact on our industry.
Recent Industry Trends
The following summarizes a number of recent trends which we believe are driving the U.S. accounts receivable management industry:
Increased Regulatory Oversight. Pursuant to Dodd-Frank, the CFPB was established and effective as of January 2, 2013, the CFPB has assumed direct regulatory oversight of the debt purchasing and collection industry including supervisory jurisdiction over large market participants, defined as having over $10 million in annual receipts. According to the FDPCA annual report issued by the CFPB in March 2015, this represents over 60 percent of the accounts receivable management industry. The CFPB has stated its main areas of focus for the industry are to ensure that industry participants are (i) providing adequate disclosures to consumers, (ii) providing accurate consumer information during the collection process, (iii) providing consumers with a complaint and resolution process, and (iv) communicating civilly and honestly with consumers.
These areas of focus are driving significant improvements within the industry that affect both accounts receivable management firms and the financial institutions that originate consumer debt. This has resulted in even stronger partnerships between the accounts receivable management firms and financial institutions that are able to satisfy the new requirements and focus areas of the CFPB and the industry as a whole.
As a large market participant, we have had ongoing interaction with the CFPB in regard to our policies and procedures and the experience that our customers receive in the context of collection interactions. In addition, we believe that the ongoing regulation of the industry will continue its impact resulting in (i) additional market participants exiting the industry and (ii) financial institutions being significantly more selective about the entities to which they sell charged-off accounts. Additionally, the CFPB has gathered and released certain data relating to consumer interactions with debt collectors and debt purchasers. The data indicates that our call centers and branch offices receive substantially fewer complaints than other large participants in the accounts receivable management industry.
In November 2013, the CFPB issued an ANPR to assist in the development of rules interpreting the laws which govern the purchase and collection of consumer obligations. As of December 31, 2015, no rules have been issued by the CFPB. While the timing and outcome of the rulemaking process is unclear, we believe that the certainty allowed by a clearer set of rules will benefit the Company, our branch offices, the industry and the customers with whom we interact on a daily basis.
In 2015, the CFPB concluded several high profile enforcement proceedings, which are of great interest to debt sale and debt market participants, by issuing consent orders (the "Consent Orders"). On July 8, 2015 the CFPB issued a Consent Order against Chase Bank USA, N.A. and Chase Bankcard Services, Inc. (“Chase”). On September 9, 2015, the CFPB filed Consent Orders against Encore Capital Group, Inc. (“Encore”) and Portfolio Recovery Associates, LLC (“PRA”). On December 28, 2015 the CFPB and Frederick J. Hanna & Associates, P.C. (“Hanna”) filed a stipulated final judgment and order settling the pending lawsuit between them. By their terms in the Consent Orders, the Encore, PRA and Hanna matters apply to consumer debts - those incurred primarily for personal, family or household purposes. No implementation timeframe was announced in the PRA and Encore Consent Orders, although select provisions apply to their post-Consent Order purchases. The Hanna stipulated final judgment required that Hanna comply with the judgment’s provisions within 90 days of entry.
Although not formal rules or law, the Consent Orders telegraph what the CFPB believes is required under the FDCPA and Dodd-Frank, as they exist today. CFPB Director Richard Cordray stated in a September 9, 2015 press release regarding the Encore and PRA Consent Orders, “industry members who sell, buy and collect debt would be well served by carefully reviewing these orders." It is anticipated that the CFPB will propose formal rules in accord with the principles and requirements set forth in the Consent Orders.
9
On November 4, 2015, the FTC announced a major new law enforcement initiative targeting deceptive and abusive debt collection practices titled “Operation Collection Protection”. The initiative is a nationwide effort the FTC is coordinating with the Department of Justice, the CFPB and more than 45 state and local enforcement agencies and regulators. FTC Chairwoman Edith Ramirez stated that Operation Collection Protection will conduct a comprehensive review of debt collection industry practices and will target corporate entities as well as individuals.
Industry Consolidation and Increased Barriers to Entry. With the establishment of the CFPB, there has been a dramatic increase in the emphasis on compliance, data security, and consumer protection by both large financial institutions and the largest U.S. debt purchasers. As a result, we believe large issuers of credit will rarely sell accounts directly to smaller debt purchasers, and their strategy to sell to larger debt purchasers has and may continue to fluctuate as they work to improve their own compliance, data security, and consumer protection standards.
Since the announcements by the Office of the Comptroller of the Currency in August 2014 requiring banking institutions to (i) engage in substantial due diligence of those entities that purchase debt and (ii) follow specific guidelines in order to sell charged-off receivables, large purchasers have incurred substantial expenses to improve and align their compliance, data security, and consumer protection standards with large financial institutions. While the Office of the Comptroller of the Currency does not have direct jurisdiction over debt purchasers, it is influential in our industry because of the jurisdiction it possesses over the banks who sell accounts to debt purchasers. We believe these changes create a significant market advantage to larger purchasers and will serve as a barrier for smaller debt purchasers to interact directly with financial institutions.
We believe smaller debt purchasers still may source accounts through other debt purchasers or portfolio brokers. However, the costs of meeting regulatory requirements associated with heightened industry standards for compliance, data security, and consumer protection has and may result in continued consolidation or elimination of certain smaller debt purchasers. We also believe that the enhanced regulatory requirements will also serve as a barrier to entry to new, significant debt purchasers.
Changes in Quality and Supply of Charged-Off Debt. As a result of the housing and credit crises that occurred during the 2005 - 2008 period, most large financial institutions significantly tightened their underwriting standards for revolving consumer debt. This resulted in sustained higher quality of borrowers' credit in the consumer loan and credit card market. As some of those borrowers charged-off in the following years, pricing of charged-off debt increased steadily between 2009 and 2013. We attribute the majority of pricing increases from 2010 to 2012 to the resulting increase in quality of charged-off assets being offered for sale from large financial institutions. However, during 2013, prices continued to increase steadily throughout the year while the quality of charged-off assets reached a plateau in the second half of 2013. Pricing increases in late 2013 and 2014 were driven primarily by a decrease in larger financial institutions’ willingness to sell charged-off debt as they improved compliance, data security, and consumer protection standards to meet more stringent regulatory requirements. During 2015, a few of the large financial institutions were still absent from the debt sales market as they continued to build out the necessary infrastructure to sell charged-off debt in accordance with current regulatory requirements. As a result, pricing remained elevated during 2015.
10
The following graph depicts the market prices of fresh charged-off receivables from 2009 through 2015:
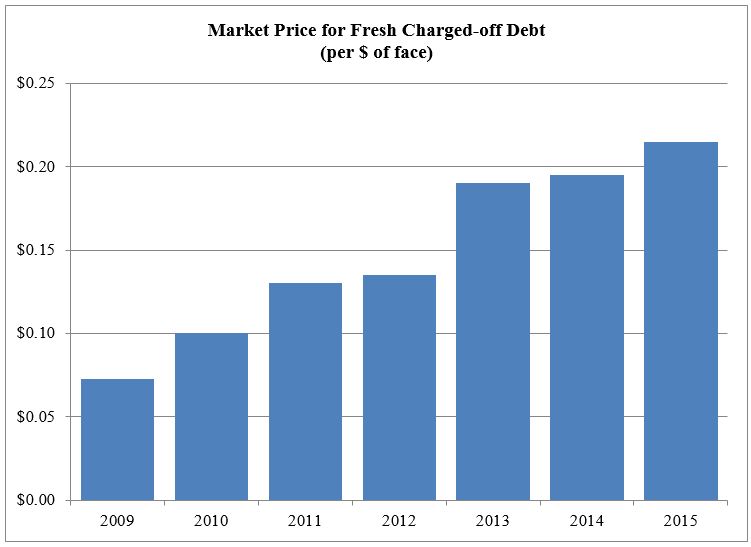
Source: January 2016 Charge-Off Portfolio Sales: Market Overview from Garnet Capital Advisors
Our Competitive Strengths
We believe that we possess the following competitive strengths that differentiate us from our competitors:
Customer Satisfaction. We believe that our success fundamentally depends on providing a positive customer experience within the context of a collection interaction. Therefore, we strive to treat each customer fairly, while also requiring that those customers who are able to make payments satisfy their validly incurred obligations to the maximum extent reasonably possible. We believe that treating customers fairly, honestly, and with respect improves overall collection performance, and is critical to long-term business success. We believe two equally important components are needed to create customer satisfaction: (i) strict compliance to state and federal regulations and (ii) a comprehensive and dynamic strategy that establishes a culture of customer service. Full compliance lays the basic foundation for a customer experience; regulatory oversight provides specific guardrails that guide every customer interaction. Creating customer satisfaction requires providing a high level of customer service. Consequently, we believe that conducting business through our call centers and branch offices that are committed to following consistent policies, programs, and business tools within the framework of our Compliance Management System will offer us a competitive advantage. We continually invest in ongoing improvement, oversight, and auditing of all areas of compliance, and dedicate ourselves to creating a culture focused on consistently providing a positive customer experience.
U.S. Closed Loop Network. Our Closed Loop Network consists of both Fresh View call centers and our network of exclusive regional branch offices, all of which use our proprietary systems in the collection of customer obligations. We believe that this model is unique to the accounts receivable management industry. Regardless of whether we commence collections through Fresh View or place an account with one of our branch offices, all customer account information and collection activity is contained and managed within our proprietary integrated account management system, and in accordance with SquareTwo’s Compliance Management System. This ensures that regardless of the chosen recovery option, we strive to provide a uniform customer experience.
Proprietary Technology Platform. We have developed and will continue to advance a sophisticated software, computing and network architecture to support the acquisition, management and collection activities of our charged-off receivables within our Closed Loop Network of call centers and branch offices. In partnership with Oracle®, we have developed and will continue to enhance our proprietary eAGLE technology platform, which we feel provides our call centers and branch offices with the data necessary to optimize collections. Each of our call centers and branch offices conduct all collection activities through eAGLE leveraging identical real-time account level data regardless of location. As account level data is affected by activity performed at our corporate headquarters, our call centers and branch offices see this account level
11
activity in real-time. We believe this creates a significant competitive advantage as our industry competitors outsource various collection activities resulting in less control and delayed account updates for customers.
In addition to the advantages described above, this integrated account management system tracks multiple collection and operational metrics at the collector and account levels and delivers results in real time, providing us with immediate and comprehensive data on the performance of our call centers and branch offices. This enables us to better allocate charged-off receivables among our locations based on their relative performance and adherence to our strict compliance requirements. The depth of our historical databases and current performance metrics enables us to perform sophisticated analyses on potential debt purchasing opportunities that help us to achieve our target returns. The quantity and quality of the account and collector level information captured and reported by our systems is also critical to our ability to effectively manage the collection efforts and compliance standards on our charged-off receivables. As we evolve our proprietary technological system, we will continue to provide each individual collector with enhanced insights into the appropriate collection strategies, while also using the system to guide collectors in the use of appropriate customer handling techniques and account resolution.
Disciplined and Proprietary Underwriting Process. We adhere to a disciplined underwriting process, which we believe allows us to price purchasing opportunities at levels that meet our targeted return thresholds. Our underwriting process centers around our proprietary analytical models, which utilize historical data collected over our 20 years in the industry and incorporate current account-level data, as well as information regarding current economic, pricing and collection trends. Our models use multiple internally and externally generated variables, including credit bureau attributes, customer data, and asset class information to provide comprehensive measures of value and potential collection rates at the individual account level. Since inception, our disciplined purchasing process has allowed us to achieve strong expected cash on cash returns on our purchased debt of 2.2x on a gross basis, and typically results in 100% of our initial cash investment being returned within 12-24 months on a gross basis.
Strong Relationships with Major Credit Issuers. We have developed strong, long-standing relationships with a number of leading consumer credit, business credit, and student loan issuers that, we believe, view us as an important part of their charged-off receivables recovery strategy. We believe that credit issuers value our unique Closed Loop Network model, which ensures integrity of customer data and enhances our focus on compliance and ethical collection practices.
Focus on Fresh Charged-off Credit Card and Consumer Loan Receivables. We believe that we are one of the largest purchasers of fresh charged-off credit-card and consumer loan receivables in the U.S. Fresh charged-off receivables are generally 180-210 days past due at the time of sale and have typically not been subject to previous collection attempts by a third-party collection agency. Typically, fresh charged-off receivables have a more rapid collection cycle than charged-off receivables that have been subject to previous collection attempts by collection agencies. Additionally, our direct relationship with issuers of credit provides enhanced accuracy and control of customer data. We believe that our focus on fresh charged-off credit card and consumer loan receivables reduces the risk profile of our investments, increases our ability to maximize our cash-on-cash rates of return, and accelerates our ability to reinvest the capital we deploy. Additionally, we believe that fresh charged-off receivables provide a higher quality asset base and more predictable future cash flows than charged-off receivables that have been subject to prior third party collection attempts, further mitigating risks associated with the future cash flows from our owned debt portfolios. In the year ended December 31, 2015, approximately 41.1% of our aggregate purchases, based on purchase price, have been of U.S. fresh charged-off credit card and consumer loan receivables. This compares with approximately 70.7% in the year ended December 31, 2014 and approximately 71.7% in the year ended December 31, 2013. As noted above in the “Industry Overview" section under the "Recent Industry Trends" heading and the "Changes in Quality and Supply of Charged-Off Debt” sub-heading, the market price for fresh charged-off debt has risen substantially in the last few years, and our ability to acquire fresh charged-off credit card and consumer loan receivables, on economic terms or at all, has declined.
Continued Diversification. We continue to leverage internally developed best practices combined with external client relationships to diversify the revenue streams of the Company. Having built deep relationships with banks, commercial finance companies and other non-bank financial institutions, SquareTwo has expanded its focus to evaluate, purchase and liquidate portfolios comprised of Canadian receivables, small business loan and lease products, non-bank issued consumer loans, and private student loans that have been charged off by their owners. These diversification efforts provide significant opportunities for growth, balance and flexibility, which complement the Company's extensive history and success in the unsecured consumer credit marketplace. Our purchases of Canadian, commercial and private student loans were 48.4% and 25.3% of total purchases in the years ended December 31, 2015 and 2014, respectively.
12
Experienced Management Team. We have an experienced management team with considerable expertise in the financial services industry, including the credit card and charged-off receivables management sectors. The key members of our management team have on average over 20 years of experience in financial services and related industries, including previous leadership roles at Key National Finance, Bank of America, MBNA, and ING. We believe that the experience and expertise of our senior leadership team positions us to continue to successfully maintain and grow our core business. We have actively sought to complement internally developed management talent with externally recruited managers who bring new skill sets and perspectives to our company.
Our Strategy
Key components of our strategy include the following:
Customer Focus. We are committed to treating each customer fairly, while also requiring that those customers who are able to make payments satisfy their validly incurred obligations to the maximum extent possible. Inherent in our culture is the desire to work together with our customer as we believe that our success fundamentally depends on providing a positive customer experience within the context of a collection interaction. We believe this strategy creates the most beneficial solution for our customers to help resolve their validly incurred debts.
Inspire a Culture of Leadership by Living Our Core Values. We believe that our success depends upon both SquareTwo and its network of exclusive branch offices hiring, developing and retaining personnel of the highest quality who help create a culture of personal responsibility. In addition, we believe that this culture is sustained by the daily demonstration by our personnel of our five core values: Focus, Alignment, Accountability, Integrity and Trust. We believe that this commitment to clearly identify and implement these values at each location enables us to attract and retain the highest quality employees.
Pursue Systemic Operational and Compliance Excellence. We leverage our sophisticated proprietary technology and our operational and analytical models to properly analyze and liquidate our accounts via eAGLE. From refining our forecast models to determining appropriate acquisition prices for charged-off receivables, to developing the best methods to select accounts and the ideal collection procedures, our business strategies are data driven. Consequently, we make ongoing, significant investments in our processes and systems to ensure our data is available, accessible, accurate, and actionable. We maintain constant focus on building operational efficiencies to drive collections and build comprehensive programs to maximize our recoveries through new and existing liquidation strategies. Additionally, we continually enhance our internal controls and auditing capabilities within our Compliance Management System to ensure we are compliant, and that our data is secure across all areas of the organization. We leverage technological tools to manage our recovery and compliance efforts on our owned receivables. We have built comprehensive controls into our systems to help ensure compliance with applicable law and the highest level of data security at both the corporate and branch office levels, to protect the privacy of our customers. Finally, we believe that both our intense focus on the customer experience and our desire to lead the industry in compliance practices are competitive advantages.
Create an Outstanding Network of Call Centers and Exclusive Branch Offices. We believe that our unique Closed Loop Network model of company-owned call centers and our network of exclusive regional branch offices provides us with an integrated framework for collection performance, compliance achievement and customer satisfaction. As we continue to enhance policies, procedures and controls through each of our call centers and branch offices, we improve the customer experience that is essential to a successful liquidation of validly incurred contractual obligations. Our technological advances allow our call centers and branch offices to operate more efficiently by contacting only those customers who we believe have both the willingness and ability to make payments. They also provide ongoing reinforcement of the collection and compliance training that has been provided to those individuals interacting with our customers.
Deliver Solid Financial Results. Our focus is on delivering solid bottom line results. By adhering to our other core strategies, we strive to deliver sustainable growth and provide financial results that meet and exceed the expectations of our key stakeholders. To achieve this end, we continue to focus on buying assets at the analytically correct price and manage them in an efficient, cost-effective manner. We continue to expand our existing relationships into other related product lines, and diversify our acquisition efforts into other categories of charged-off receivables. These continued diversification efforts into parallel products and assets will assist us in meeting our long-term financial goals by quickly adapting to dynamic markets.
13
Our Owned Portfolios
As of December 31, 2015, our active owned charged-off receivables in the U.S. and Canada totaled $9.0 billion in face value and consisted of approximately 2.3 million accounts. The following table sets forth summary information on our active owned charged-off receivables as of December 31, 2015:
Account Type | # of Active Accts (in thousands) | Avg. Bal. per Acct. | Active Face Value(3) ($ in millions) | Active Face Value (% of Total) | Capital Deployed(1) ($ in millions) | Capital Deployed(1) (% of Total) | |||||||||||||||
Credit Card/Consumer Loan - Fresh | 1,303 | $ | 4,074 | $ | 5,308 | 59.0 | % | $ | 2,149 | 80.1 | % | ||||||||||
Credit Card/Consumer Loan - Non-Fresh | 927 | 3,010 | 2,790 | 31.0 | % | 367 | 13.6 | % | |||||||||||||
Other(2) | 48 | 18,729 | 899 | 10.0 | % | 166 | 6.2 | % | |||||||||||||
Total/Average | 2,278 | $ | 3,950 | $ | 8,997 | 100.0 | % | $ | 2,682 | 100.0 | % | ||||||||||
(1) Capital Deployed is an aggregate life-to-date total by account type. It is a representation of resource allocation and includes active and inactive accounts. Canadian Capital Deployed is converted using the historical end of month exchange rate in the month of purchase.
(2) Other includes commercial, student loan, and other purchased debt assets.
(3) Canadian Active Face is converted to U.S. dollars using the exchange rate as of December 31, 2015.
Account Management Model
Recovery efforts in the U.S. on all newly acquired debt are managed within our Closed Loop Network, a unique combination of call centers and a network of regional branch offices exclusively dedicated to SquareTwo. Historically, our branch offices were the primary channel for recovery work on our behalf, but during 2014, we expanded our asset recovery options in the U.S by opening a company-owned call center dedicated to consumer collections. Since the opening of our Fresh View consumer call center, newly acquired accounts are placed for collection exclusively within Fresh View. However, certain of the accounts that had previously been placed into our branch office network for non-legal collections are still being pursued by the respective branch office. Legal recovery operations will continue to progress as necessary through our dedicated network of regional branch offices.
SquareTwo mandates specific expectations that both the call centers and the branch offices must meet. Success is contingent on both SquareTwo and our branch offices’ ability to hire, train and lead their teams in a manner which maximizes liquidation while maintaining adherence to policies and procedures relating to compliance and customer service.
We continue to make significant investments in both our call centers and our relationship with the branch offices. Corporate teams are exclusively dedicated to monitoring, auditing and evaluating all of our locations within the Closed Loop Network on an ongoing basis. However, we do not merely measure and observe; we have implemented financial penalties for failing to meet our customer experience expectations. The knowledge gained from our monitoring efforts provides us insight on how we then incentivize, train and support our call center management and employees and well as branch offices and their respective employees to achieve our mutual success. Members from our executive, operations, technology, legal and compliance teams make multiple on-site visits to each call center and branch office location each year. These efforts ensure we maintain a close and productive relationship with each and provide additional opportunities to ensure that our branch offices remain committed to and accountable for our expressed strategies.
Through our alignment with our network of branch offices, we have achieved symbiotic profitability. We rely on our branch offices to conduct collection efforts on our owned charged-off receivables, so we make thoughtful and deliberate investments in their long-term success and sustainability. A significant focus of our Company is providing our branch offices the resources, tools, and training to enable them to manage their businesses efficiently and to identify opportunities to improve their operations. We pay particular attention to providing training and feedback to offices surrounding the customer experience and our desire to have this experience remain a competitive advantage. The presentation of these materials is aimed at providing our branch offices with insights into best practices and the cause-and-effect relationships of each metric and its impact on overall performance. Additionally, our Operations team uses information available on our system to proactively address development opportunities with each branch office.
We also strive to incentivize our branch offices' liquidation performance of the accounts placed with them by using a variable fee structure. This operational practice aligns each branch office's profitability with that of SquareTwo, and should improve our branch office performance, as poorer performing offices are continually evaluated and possibly replaced. We make decisions about the need for each individual office in the context of current performance and business need for capacity.
14
We have created numerous and diverse channels of interaction to ensure we remain in constant communication with our branch offices. We conduct conference calls with all branch offices to discuss key business issues. We hold several conferences that serve as educational forums for our branch offices, including an annual Partner Summit where we present substantial training on operational, legal, and compliance issues. We also hold an annual Attorney Conference for our attorneys and compliance professionals. This conference typically includes significant content on regulatory trends, legal compliance and collection best practices, and other considerations pertinent to the legal collections process presented by third-party experts and SquareTwo personnel. In addition, we periodically invite each office’s senior leaders to meet with key members of our management team at our headquarters in Denver, Colorado.
Business Development and Purchasing Contracts
We have a dedicated Business Development team that consists of professionals who focus on sourcing charged-off and distressed receivable purchasing opportunities. This team actively maintains relationships with a significant majority of the leading issuers of domestic credit cards, commercial, and consumer loans in addition to relationships with a broad group of national and regional issuers of credit. Within this team, we have individuals who focus specifically on opportunities in the consumer, commercial, student loan and Canadian markets.
We are continuously improving the structure of our Business Development department as part of an effort to both broaden our relationships with institutions from which we have historically acquired charged-off receivables and to expand our active purchasing relationships with both national and regional financial institutions. Depending on whether an institution has historically sold its charged-off receivables, our sourcing efforts require different levels of education on our capabilities and the process of selling charged-off receivables. We believe the efforts of our Business Development team are important to enhancing our relationships with existing credit issuers and in forming effective partnerships with new credit issuers. In addition, we hold our Business Development team responsible for providing the executive management team with market insights, trends and competitive behavior.
We have developed longstanding relationships with a number of leading credit issuers including U.S. and Canadian credit card, consumer loan, student loan, and small business credit issuers. Historically, we have purchased assets from seven of the ten largest credit card issuers in the U.S. In aggregate, we have purchased from over 40 different issuers of credit over the last three years as of December 31, 2015.
When we acquire a portfolio of charged-off receivables, there are generally two types of arrangements that we utilize. While a majority of our purchases occur through short-term forward flow agreements that provide for a range of purchased volumes at predetermined pricing on a monthly basis, we actively manage the risk associated with fixed pricing under these agreements. These contracts typically cover six months or less and can be generally canceled by the Company at its discretion with 30-60 days’ notice. Finally, our purchased debt agreements contain specific criteria around the credit quality and characteristics of the accounts we purchase to protect us from receiving future assets that do not conform to the product we evaluated to establish pricing. In addition to purchases under our short-term forward flow agreements, we regularly acquire charged-off receivable portfolios through individually negotiated transactions at spot market prices.
Under the terms of our purchase contracts, we typically have recourse, or the right to return, certain accounts to the seller within a designated time period from the purchase date should the account not meet certain agreed upon requirements, including the accounts of customers who were deceased or bankrupt at the time of purchase. If a customer enters into bankruptcy after our contractual recourse period, we utilize Fresh View to collect any proceeds as a result of the court driven bankruptcy process. Since 2013, account sales have no longer been part of our core liquidation strategy.
Proprietary Technology and Analytics
Our proprietary debt distribution, portfolio management and collection system, eAGLE, is built on the latest Oracle® database, middleware and application framework technology to enhance performance, security, flexibility and scalability. The eAGLE platform is housed on Oracle's high performance database and application hardware platforms - ExaData and ExaLogic. This platform represents years of continuing development and investment over $35 million. Each of our U.S. call centers and branch offices conduct all collection activities through eAGLE. Controls have been added into eAGLE which provide significant insight into and control over the actions of the call centers and branch offices, ensuring continuous regulatory compliance. eAGLE is a user friendly tool that enables a new or seasoned collector to collect debt using the latest collection techniques and information repositories and provides the data that we believe is necessary to enhance collections. Our eAGLE platform is designed as an asset management system as well as a collections platform. The system monitors and evaluates the performance of our call centers and branch offices and their individual collectors. The system also provides standard operating metrics to enhance performance and visibility on a daily, weekly and monthly basis for the call centers and
15
branch offices. It allows us to track the data that we believe is necessary to efficiently allocate purchased debt to our call centers and branch offices based on state licensing requirements, historical collection success rates and other factors, and to move purchased debt within our branch offices (recalling and replacing accounts) to maximize performance. eAGLE is scalable, with the ability to expand our business operations while still maintaining rigorous internal controls, and it is built with architecture to provide flexibility for future operational and process changes that we may choose to implement. In addition to enabling an efficient, effective and continuously improving collection process, eAGLE was designed to capture data to help us better understand the market and debt performance, which further enhances our ability to acquire receivables. We believe that the eAGLE platform is a key competitive advantage for us relative to our primary competitors that utilize "off-the-shelf" or legacy platforms.
Our Decision Science team provides in-depth statistical analyses on the receivables we purchase to provide our management team with the data necessary to track and enhance performance at the call center and branch office level. These robust statistical models create accurate portfolio forecasts that, when combined with our reporting platform, provide the business leaders at our Company the data required to manage our business and to make decisions using real-time performance. The team has developed and implemented a structured projection model that generates portfolio-level cash flow expectations. The team also operates a grading model that utilizes multiple variables comprised of third party customer-level data, asset class information, and other details to determine internal account-level grades.
Risk Management, Compliance and Insurance
We operate in a regulated industry and have devoted significant resources to risk management and compliance. Our Office of Compliance, in conjunction with the Law and Regulatory Affairs department, is directly responsible for the design, management and implementation of our Compliance and Control Operational Framework. The Office of Compliance, under the direction of the Chief Compliance Officer, along with the Compliance Risk Committee ("CRC"), manages internal compliance and leads compliance within our Closed Loop Network. Once regulatory requirements are identified, the CRC identifies business processes, assesses risk and prioritization and reports those findings to the Office of Compliance. The Office of Compliance along with the CRC define specific policies, assign responsibilities to process owners, establish procedures and controls, engage in communication and training, monitor and test adherence to established compliance policies, and remediate deficiencies.
Included in the Operational Framework is the independent monitoring of customer calls. This involves the independent scoring of calls and the reporting of those results to our Chief Compliance Officer. A heavy emphasis in this monitoring process surrounds the quality of the interaction between the parties on the telephone. We believe the customer experience is often a direct reflection of the quality of a call, and thus we evaluate and constantly work to improve these interactions. Failure to meet our standards could lead to financial penalties, could impact future placement of accounts, and could ultimately lead to termination of the branch office. The results of the call monitoring are used to provide insight to the call centers and branch offices on collector behavior and the training required to improve customer experiences.
The Office of Compliance and the Customer Experience Department also monitor and analyze all customer disputes and complaints. The Office of Compliance reports its findings directly to the Company’s Board of Directors. We also leverage the experience of third-party law firms that have particular expertise in our industry to monitor important regulatory trends. We believe our business model of call centers and branch offices exclusive to our Company contributes to a two-pronged approach to compliance and risk management. In addition to our corporate efforts, our exclusive branch offices have a strong interest in compliance and actively oversee collection operations. As attorneys, they have a vested interest in compliance as any complaints at their offices could require the state bar association to investigate and thereby jeopardize their license. We believe that the resources and support we provide to our call centers and branch offices help them to provide customers a positive customer experience, and we view this as a competitive strength.
Our Law and Regulatory Affairs department manages our corporate licensing and tracks the licensing of our Closed Loop Network. The Law and Regulatory Affairs department also manages our insurance policies and claims on a company-wide basis. Our Closed Loop Network is required to report any actual or threatened claims to our Law and Regulatory Affairs department, which allows us to evaluate trends. In addition to internal legal resources, we regularly work with outside counsel to manage our exposure on specific claims. As a debt purchasing entity, we are periodically forced to defend claims that allege the violation of applicable state and federal law. We believe that we have obtained appropriate liability insurance policies to protect us from claims in this area. In addition, we have obtained insurance to help protect us from general and employee-related claims.
16
Prior to allowing any person employed by any call center or branch office to work on any of our owned or managed accounts, we require that such persons be screened for past criminal violations and undergo comprehensive training relating to the FDCPA and other statutes attendant to the collection of debt to ensure that those individuals attempting to collect on our accounts understand and meet their legal obligations. All corporate, call center, and branch office personnel also receive extensive training on applicable federal and state laws directed at protecting consumers.
In all of our insurance policies, all costs of defense, negotiation and costs incurred in liquidating a claim are considered insured costs, beyond any applicable policy retentions. Our personnel costs involved in managing insured claims are not reimbursed. We evaluate our insurance coverage regularly and typically renew our policies on an annual basis, although as market conditions change, we may elect to have our policies carry a multi-year term. We believe our insurance coverage is adequate. Certain of the parties from whom we purchase indebtedness require us to maintain specified levels of insurance under their contracts. We believe that we are currently in compliance with these requirements.
For our technology and operations, we currently host the majority of our systems at a secure location distinct from our headquarters. The site offers secure physical and logical access and provides a data center out of which we can conduct business. We have disaster recovery capabilities such that we can switch over primary collection operations to our alternate data center within an acceptable outage window that meets our business continuity guidelines. In the event of an outage on our eAGLE platform at our primary data center we can switch over collection operations to our disaster recovery site. In addition, we perform system backups every night with physical tapes sent offsite once a week and virtual tapes sent to our disaster recovery site daily. Our information technology team has developed a comprehensive disaster recovery plan outlining decision authority in the event of a disaster, the processes for completing switchovers, the results of previous tests and testing plans. The plan also contemplates two different types of scenarios, a graceful fail scenario in which we still have access to our facilities and a hard fail scenario in which access to our facilities is non-existent or severely limited.
Law and Regulatory Affairs Department
Our Law and Regulatory Affairs department, under the leadership of our General Counsel, manages general corporate governance; litigation; insurance; corporate transactions; intellectual property; contract and document preparation and review, including portfolio purchase documents and agreements with our branch offices; compliance with federal securities laws and other regulations and statutes; obtaining and maintaining insurance coverage; and in conjunction with our Customer Experience department, dispute and complaint resolution. In conjunction with our Office of Compliance, our Office of General Counsel is responsible for the implementation of our Code of Business Conduct. We have established a confidential telephone hotline to report suspected policy violations, fraud, embezzlement, deception in record keeping and reporting, accounting, auditing matters and other acts which are inappropriate, criminal and/or unethical.
Our Law and Regulatory Affairs department also works closely with and provides guidance to Fresh View and our branch offices and assists with advising our staff in relevant areas including the FDCPA and other relevant laws and regulations. Our Law and Regulatory Affairs department regularly researches, and provides our Training Department, the Office of Compliance, Fresh View and our branch offices with summaries and updates of changes in federal and state statutes and relevant case law so that they are aware of and in compliance with changing laws and judicial decisions attendant to the collection process.
Employees
As of December 31, 2015 we had 396 employees, none of which are represented by a union or covered by a collective bargaining agreement. We believe our relations with our employees are good. Of our 396 employees, 267 are employed by SquareTwo at our headquarters in Denver, Colorado. These employees consist of executive, operations, business development and corporate services personnel. Our executives develop and execute our corporate business plan. Our operations personnel oversee the development and operation of the branch offices. Our business development personnel acquire charged-off receivables. Corporate services supports our executives, operations and business development personnel through human resources, information technology, accounting, finance and legal support. Of our remaining 129 employees, 36 are employed at the offices of SquareTwo Canada in Newmarket, Ontario and Montreal, Quebec, and 93 are employed at the offices of Fresh View in Denver, Colorado and Overland Park, Kansas. The majority of the employees at both of these subsidiaries conduct recovery efforts.
17
Description of Principal Equity Holder
CA Holding owns 100% of the outstanding equity in SquareTwo. CA Holding is majority-owned by affiliates of KRG Capital Management, L.P. ("KRG") and one of our co-founders, P. Scott Lowery. Refer to the "Certain Relationships and Related Transactions" section for a description of the relationships between our company and KRG and between our company and Mr. Lowery. The remainder of CA Holding's equity is primarily owned by certain institutional investors, including private equity funds, banks and other financial institutions, who purchased interests in CA Holding at the time of CA Holding's acquisition of SquareTwo.
Founded in 1996, KRG is a Denver-based private equity firm with approximately $4.5 billion of cumulative capital either deployed or available for future investment through its affiliated funds, including approximately $1.1 billion deployed since inception on behalf of equity co-investors. KRG specializes in investing in differentiated middle-market companies that focus on growth strategies tied to creating value for their customers. The firm seeks investment opportunities where KRG can partner with owners and operating managers who are committed to expanding their companies and becoming industry leaders. The result is a partnership that focuses on creating a larger enterprise through a combination of internal growth and complementary investments.
Pursuant to the Third Amended and Restated Stockholders Agreement of CA Holding, affiliates of KRG have the right to designate a majority of the board of directors of CA Holding (the “CA Board”) and, so long as certain continued ownership thresholds are met, P. Scott Lowery is entitled to be elected as a director of CA Holding and to appoint another member of the CA Board. KRG has designated Christopher Lane, Bennett Thompson, and Thomas Sandler as members of the CA Board. Currently, Mr. Lowery's designee on the CA Board is Paul A. Larkins, the President and Chief Executive Officer of CA Holding and SquareTwo. The Board of Directors has designated Kimberly Patmore, Thomas Bunn, and Messrs. Lane, Sandler, and Thompson as independent directors. Refer to the "Certain Relationships and Related Transactions" section for a further description of the relationships between our company and related parties.
Corporate Information
SquareTwo's corporate headquarters are located at 4340 South Monaco Street, Second Floor, Denver, Colorado 80237, and our telephone number at that location is (303) 296-3345. The Company's annual report on Form 10-K, quarterly reports on Form 10-Q, current reports on Form 8-K, and amendments to those reports are available free of charge through the "About Us", "Investor Relations" portion of the Company's website, www.squaretwofinancial.com, as soon as reasonably practical after they are filed with the Securities and Exchange Commission ("SEC"). Information contained on our website is not incorporated by reference in, or considered a part of, this Annual Report on Form 10-K. The SEC maintains a website, www.sec.gov, which contains reports and other information filed electronically with the SEC by the Company.
18
Item 1A. Risk Factors.
Our operations and financial results are subject to various risks and uncertainties, including but not limited to those described in this section, which could adversely affect our business, results of operations, and financial condition.
We may not be able to continue as a going concern
The consolidated financial statements included in this annual report have been prepared using the going concern assumption, which contemplates continuity of operations, realization of assets, and satisfaction of liabilities and commitments in the normal course of business. The accompanying consolidated financial statements do not reflect any adjustments that might result if the Company is unable to continue as a going concern. However, certain events described herein related to our senior revolving credit facility and outstanding Senior Second Lien Notes could impact our ability to continue as a going concern.
At December 31, 2015, our total liquidity to fund operations was $48.2 million, which consisted of non-restricted cash balances of $19.6 million and total availability under our senior revolving line of credit of $28.6 million. Our senior revolving credit facility, which had an outstanding balance of $134.8 million at December 31, 2015, originally matured on April 6, 2016. On April 5, 2016, the Company entered into Amendment No. 7 (“Amendment No. 7”) to the senior revolving credit facility. Pursuant to the terms of Amendment No. 7, the maximum commitment amount of the revolving credit facility was decreased from $245 million to $140 million, the term of the revolving credit facility was extended to April 29, 2016, and certain progress requirements related to the refinancing of the senior revolving credit facility were added. On April 20, 2016, the administrative agent for the senior revolving credit facility notified the Company of the occurrence of an event of default related to the Company’s failure to deliver a loan commitment to the administrative agent by April 18, 2016 for a refinancing in full of all obligations under the senior revolving credit facility. The administrative agent also reserved cretain rights of the administrative agent and lenders under the senior revolving credit facility. On April 20, 2016, the Company and a certain financial institution entered into a commitment letter setting forth the terms of a $165 million senior secured financing facility (the “New Financing Facility”). The obligation of the financial institution to provide the New Financing Facility is subject to certain conditions, including without limitation (i) the consummation of an exchange offer (the "Exchange Offer"), as further described below, in which the holders of at least 70% of the Company’s Senior Second Lien Notes exchange their outstanding Senior Second Lien Notes for participation in a 1.5 lien term loan and preferred stock of the Company, and (ii) the Company’s entry into a $30 million 1.25 lien term loan, at least $15 million of which will be funded on the closing date of the New Financing Facility. The Company expects to enter into definitive documentation for the New Financing Facility and borrow the full amount available thereunder concurrently with the settlement of the exchange offer discussed below. However, there can be no assurance that the senior revolving line of credit facility will be further extended, modified, or replaced by a new facility, or that the financial institution commitment will be consummated and result in enhancing the Company’s liquidity.
Under the terms of the Senior Second Lien Notes, we were required to make a semi-annual bond interest payment in the amount of $16.9 million on April 1, 2016. The Company did not make the April 1 bond interest payment to the holders of the Senior Second Lien Notes while it has continued to negotiate with certain of the holders concerning financing alternatives to enhance the Company's liquidity. As of April 25, 2016, the Company has prepared an offering memorandum for the Exchange Offer with a consent solicitation (the “Consent Solicitation”) to holders of the Senior Second Lien Notes and plans to commence the Exchange Offer upon the filing of this report. Participating holders will receive $620 principal amount of a new 1.5 lien term loan and $350 initial liquidation amount of a new class of preferred stock of the Company for each $1,000 principal amount of Senior Second Lien Notes tendered. In addition, holders who provide consents by the consent expiration time on May 6, 2016 (which may be extended by the Company) will receive an additional $30 principal amount of the 1.5 lien term loan for each $1,000 principal amount of Senior Second Lien Notes. The Exchange Offer and Consent Solicitation will be made upon the terms and subject to the conditions set forth in the offering memorandum for the Exchange Offer and Consent Solicitation statement and related consent and letter of transmittal. The Exchange Offer and Consent Solicitation will be subject to certain conditions, including there being tendered at least 70% of the aggregate principal amount of the Senior Second Lien Notes. The Exchange Offer will expire on or around May 20, 2016, unless extended by the Company. Concurrently with the commencement of the Exchange Offer, the Company plans to enter into a recapitalization support agreement with holders of more than 75% in aggregate principal amount of the Senior Second Lien Notes, which agreement sets for the obligations and commitments of the parties with respect to the proposed restructuring of the Company. However, there can be no assurance that the Exchange Offer will be consummated as described above.
Failure to pay the semi-annual bond interest for 30 days, or May 2, 2016 in this case, could cause us to suffer an event of default under the indenture governing our Senior Second Lien Notes. Failure to satisfy our obligations under the senior revolving credit facility could cause us to suffer an event of default, which could, among other things, lead to the amounts due thereunder becoming immediately due and payable. Moreover, because our debt obligations are represented by separate agreements with different parties, any event of default under our senior revolving credit facility may create an event of default
19
under the indenture governing our Senior Second Lien Notes, resulting in the acceleration of our obligation to pay principal, interest and potential penalties under the Senior Second Lien Notes, even though we may otherwise be in compliance with all of our obligations under the indenture governing the Senior Second Lien Notes. Any event of default could also have an adverse impact on the Company's capital and operating leases, including early termination, mandatory prepayment, or repossession of equipment. Under current circumstances, if the Exchange Offer and the New Financing Facility are not consummated, it is unlikely that we would be able to obtain additional sources of capital to repay our debt obligations and it is likely that one or more of our lenders would proceed against the collateral securing that indebtedness. In addition, management currently projects that the Company will not be in compliance with the Adjusted EBITDA covenant of the senior revolving credit facility at March 31, 2016. Failure to comply with the covenant could cause us to suffer an event of default under the senior revolving credit facility.
The circumstances and events described above raise substantial doubt as to whether the Company will be able to continue as a going concern for a reasonable period of time. As a result, our independent public accounting firm has issued an opinion on our consolidated financial statements that states that the consolidated financial statements were prepared assuming we will continue as a going concern. However, this opinion further states that factors described above raise substantial doubt about our ability to continue as a going concern. Based upon the Company’s current financial condition as discussed above, management believes that the New Financing Facility and the Exchange Offer will need to be consummated in order for the Company to continue to operate as a going concern and to avoid (as is the Company’s preference) filing for protection under the U.S. Bankruptcy Code. For additional information, refer to our consolidated financial statements appearing elsewhere in this Annual Report on Form 10-K.
If we default on our obligations to pay our indebtedness, we may not be able to make payments on the notes.
Any default under the agreements governing our indebtedness, including a default under our senior revolving credit facility, that is not waived by the required lenders, and the remedies sought by the holders of such indebtedness, could prevent us from paying principal, premium, if any, and interest on the notes and substantially decrease the market value of the notes. If we are unable to generate sufficient cash flow and are otherwise unable to obtain funds necessary to meet required payments of principal, premium, if any, and interest on our indebtedness, or if we otherwise fail to comply with the various covenants, including financial and operating covenants, in the instruments governing our indebtedness (including covenants in our senior revolving credit facility and the indenture governing the notes), we could be in default under the terms of the agreements governing such indebtedness.
In the event of such default, the holders of such indebtedness could elect to declare all the funds borrowed thereunder to be due and payable, together with accrued and unpaid interest, the lenders under our senior revolving credit facility could elect to terminate their commitments thereunder, cease making further loans and institute foreclosure proceedings against our assets, and we could be forced into bankruptcy or liquidation. If our operating performance declines, we may in the future need to obtain waivers from the required lenders under our senior revolving credit facility to avoid being in default. If we breach our covenants under our senior revolving credit facility and seek a waiver, we may not be able to obtain a waiver from the required lenders. If this occurs, we would be in default under our senior revolving credit facility, the lenders could exercise their rights, as described above, and we could be forced into bankruptcy or liquidation. In any such event, the lenders under our senior revolving credit facility and the holders of certain hedging obligations would be entitled to be repaid with the proceeds of the sale of any collateral prior to the note holders. In addition, any pending event of default under our senior revolving credit facility could substantially impair our ability to make interest payments on the notes, including the scheduled interest payment on April 1, 2016.
Our senior revolving credit facility matures in 2016
Borrowings under our senior revolving credit facility are a primary source of working capital which we use to purchase charged-off receivables, service our indebtedness, and fund our operations to generate long-term growth. Our senior revolving credit facility matures in April 2016 and at maturity the entire outstanding balance, together with accrued and unpaid interest will become due and payable. We may not have the ability to extend the maturity date, renegotiate the terms, or obtain replacement financing at favorable terms or at all and as a consequence our growth could be adversely impacted which could adversely affect our business, results of operations or financial position.
The liens on the collateral securing the notes and the guarantees are junior and subordinate to the liens on the collateral securing the senior revolving credit facility and certain other first lien obligations.
The notes and the guarantees are secured by second priority liens granted by us and our existing domestic guarantors and any of our future domestic guarantors on our assets and the assets of such guarantors that secure obligations under our
20
senior revolving credit facility and certain hedging obligations, subject to certain permitted liens, exceptions and encumbrances described in the indenture governing the notes and the security documents relating to the notes. The lenders under our senior revolving credit facility and holders of certain of our hedging obligations will be entitled to receive all proceeds from the realization of the collateral under most circumstances, including upon default in payment on, or the acceleration of, any obligations under our senior revolving credit facility, or in the event of our, or any of our subsidiary guarantors', bankruptcy, insolvency, liquidation, dissolution, reorganization or similar proceeding, to repay such obligations in full before the note holders will be entitled to any recovery from such collateral. In addition, the indenture governing the notes permits us and the guarantors to create additional liens under specified circumstances, including liens senior in priority to the liens securing the notes. We cannot assure note holders that in the event of a foreclosure by the holders of the first priority lien obligations, the proceeds from the sale of collateral would be sufficient to satisfy all or any of the amounts outstanding under the notes after payment in full of the obligations secured by first priority liens on the collateral.
Bankruptcy laws may limit note holders' ability to realize value from the collateral.
The right of the second lien collateral agent to repossess and dispose of the collateral upon the occurrence of an event of default under the indenture governing the notes is likely to be significantly impaired by applicable bankruptcy law if a bankruptcy case were to be commenced by or against us before the second lien collateral agent repossessed and disposed of the collateral. Upon the commencement of a case under the bankruptcy code, a secured creditor such as the second lien collateral agent is prohibited from repossessing its security from a customer in a bankruptcy case, or from disposing of security repossessed from such customer, without bankruptcy court approval, which may not be given. Moreover, the bankruptcy code permits the customer to continue to retain and use collateral even though the customer is in default under the applicable debt instruments, provided that the secured creditor is given "adequate protection." The meaning of the term "adequate protection" may vary according to circumstances, but it is intended in general to protect the value of the secured creditor's interest in the collateral as of the commencement of the bankruptcy case and may include cash payments or the granting of additional security if and at such times as the bankruptcy court in its discretion determines that the value of the secured creditor's interest in the collateral is declining during the pendency of the bankruptcy case. A bankruptcy court may determine that a secured creditor may not require compensation for a diminution in the value of its collateral if the value of the collateral exceeds the debt it secures.
In view of the lack of a precise definition of the term "adequate protection" and the broad discretionary power of a bankruptcy court, it is impossible to predict:
• how long payments under the notes could be delayed following commencement of a bankruptcy case;
• whether or when the collateral agent could repossess or dispose of the collateral;
• the value of the collateral at the time of the bankruptcy petition; or
• whether or to what extent note holders would be compensated for any delay in payment or loss of value of the collateral through the requirement of "adequate protection."
In addition, the intercreditor agreement provides that, in the event of a bankruptcy, the trustee and the second lien collateral agent may not object to a number of important matters following the filing of a bankruptcy petition so long as any first priority lien obligations are outstanding. After such a filing, the value of the collateral securing the notes could materially deteriorate and the note holders would be unable to raise an objection. The right of the holders of obligations secured by first priority liens on the collateral to foreclose upon and sell the collateral upon the occurrence of an event of default also would be subject to limitations under applicable bankruptcy laws if we or any of our subsidiaries become subject to a bankruptcy proceeding.
Any disposition of the collateral during a bankruptcy case would also require permission from the bankruptcy court. Furthermore, in the event a bankruptcy court determines the value of the collateral is not sufficient to repay all amounts due on first priority lien debt and, thereafter, the notes, the note holders would hold a secured claim only to the extent of the value of the collateral to which they are entitled and unsecured claims with respect to such shortfall. The bankruptcy code only permits the payment and accrual of post-petition interest, costs and attorney's fees to a secured creditor during a customer's bankruptcy case to the extent the value of its collateral is determined by the bankruptcy court to exceed the aggregate outstanding principal amount of the obligations secured by the collateral.
We face intense competition that could impair our ability to maintain or grow our purchasing volumes and to achieve our goals.
21
The charged-off receivables purchasing market is highly competitive and fragmented. We compete with a wide range of other purchasers of charged-off receivables, third-party collection agencies, other financial service companies and credit issuers who may aggressively attempt to collect defaulted receivables internally, and other owners of debt that manage their own charged-off receivables. Some of these companies may have substantially greater numbers of collectors and financial resources and may experience lower collector turnover rates than our call centers or our branch offices. To the extent our competitors are able to better maximize recoveries on their assets or are willing to accept lower rates of return, we may not be able to grow or sustain our purchasing volumes or we may acquire portfolios at lower expected returns. We believe that several of our larger competitors have capital structures that result in a lower cost of funds for them, which may put us at a significant competitive disadvantage. Furthermore, some of our competitors may obtain alternative sources of financing at more favorable rates than those available to us, the proceeds from which may be used to fund expansion and to increase the amount of charged-off receivables they purchase.
Barriers to entry into the consumer debt collection industry vary based upon the business model deployed. In addition to our traditional industry competitors, over time we have seen several financial investors such as hedge funds and private equity firms invest in the direct acquisition of charged-off receivables or finance other competitors. Companies with greater financial resources than we have may elect to enter the charged-off-receivables purchasing business. We believe that the entrance of new market participants in our industry can lead to upward pricing pressure on charged-off receivables as a result of increased demand for charged-off receivables, but also because new purchasers may pay higher prices for the portfolios than more experienced purchasers would due to a lack of experience, data and analytics necessary to properly assess risks and return potential of the portfolios or a desire to add size to their existing operations. In addition, we believe that marginal competitors who struggle to purchase sufficient assets may pay prices for accounts that our analytical tools could not reasonably justify making it more difficult for us to purchase appropriate amounts of reasonably priced accounts. To the extent existing or new participants in our markets drive up pricing levels, we may decide to dramatically reduce our investment activity.
We have historically focused on purchasing recently charged-off, or "fresh," consumer receivables. We believe our competitors are working to improve their processes, pricing abilities, and collection techniques. We cannot guarantee that we will remain competitive with the increased and improved competition. Furthermore, the volume of fresh, charged-off credit card and consumer loan receivables volume may be impacted by the trends of underlying consumer credit issuance.
We believe that our substantial use of legal collections through our branch offices in the U.S. and third-party law firms in Canada has been a historical competitive advantage for us. We also believe that our competitors are increasingly focusing on legal collection. Their increased use of legal collection may impact the relative competitiveness of our business model, dilute the value of having customers contacted by collectors associated with attorneys, or increase the compensation we must provide to attract and retain collection attorneys within our branch offices.
We face bidding competition in our acquisition of charged-off receivables. We believe that successful bids are predominantly awarded based on price and, to a lesser extent, based on service, compliance, reputation and relationships with the sellers of charged-off receivables. Some of our current competitors, and potential new competitors, may have more effective pricing and collection models, greater adaptability to changing market needs and more established relationships in our industry than we do. Moreover, our competitors may elect to pay prices for portfolios that we determine are not economically sustainable and, in that event, our volume of portfolio purchases may be diminished. There can be no assurance that our existing or potential sources of debt portfolios will continue to sell their charged-off receivables at recent levels or at all, or that we will continue to offer competitive bids for charged-off receivables.
Historically, a significant portion of our purchases had been contracted using a mechanism known as a “forward flow contract” These contracts require the financial institution to sell and the debt purchaser to acquire, a series of pools of assets. Given the uncertainty in the marketplace and the concerns relating to regulatory requirements, certain financial institutions which have historically sold assets using forward flow contracts have either ceased using forward flows or ceased selling accounts altogether. This change away from forward flow contracts makes our purchasing activity more difficult to predict on a consistent basis.
If we are unable to develop and expand our business or to adapt to changing market needs as well as our current or future competitors, we may experience reduced access to portfolios of charged-off receivables in sufficient face value amounts at appropriate prices. As a result, we may experience reduced profitability which, in turn, may impair our ability to achieve our goals.
Instability in the financial markets and the global economy may affect both our ability to purchase charged-off receivables and the success of our recovery efforts in collecting such receivables.
22
Significant stress in the global capital markets, including concerns over inflation, deflation, geopolitical issues, and the availability and cost of credit may contribute to increased volatility and diminished growth expectations for the economy and the financial markets. An economic downturn coupled with reduced consumer confidence would likely adversely impact the ability and willingness of consumers to pay their debts.
Further, as the recovery period for accounts on which we pursue legal action or litigation requires longer lead times, we may not fully understand the impact of an economic downturn on our recovery rates until much later in the collection cycle. If economic growth lags normal rates of economic growth, consumer confidence is depressed, or unemployment or underemployment is elevated, the ability and willingness of consumers to pay their debts and, accordingly, our ability to collect on our receivables, could be adversely affected or be reduced, which could have a material and adverse effect on our results of operations and financial condition.
We may be contractually required to purchase portfolios at a higher price than desired.
Periodically, we purchase charged-off receivables based upon forward flow contracts. Forward flow contracts typically contain termination clauses that allow termination at any time for any reason upon the delivery of advance written notice delivered a negotiated number of days prior to the termination of the contract. We may, from time to time, be required to purchase charged-off receivables under a forward flow contract for an amount higher than we would otherwise agree and therefore, these purchases may result in reduced returns or losses on our investments. We also cannot guarantee that all of our future forward flow agreements will contain the same termination provisions included in our current agreements.
We may not recover the cost of investments in purchased charged-off receivables and be able to support operations.
We purchase charged-off receivables generated primarily by consumer credit transactions. These are obligations that the individual consumer has failed to pay when due. The charged-off receivables are purchased from consumer and commercial creditors such as banks, finance companies, and other consumer-oriented and other small business-orientated companies. Substantially all of the charged-off receivables consist of account balances that the credit grantor has made numerous attempts to collect, subsequently deemed uncollectible, and charged-off. Therefore, the credit quality of these receivables is impaired. We purchase these charged-off receivables at a significant discount to their then current face value, and, although we expect that our recoveries on these receivables will exceed the amount that we paid for them, actual recoveries will vary, and may be less than the amount expected, or may even be less than the amount we paid for them. In addition, the timing or amounts collected on the charged-off receivables cannot be assured. After purchase, collections on charged-off receivables could be reduced by consumer bankruptcy filings or other economic or regulatory factors. If cash flows from operations are less than anticipated as a result of our inability to collect on the charged-off receivables, we may have difficulty servicing our debt obligations and may not be able to purchase new charged-off receivables.
We may not be successful in acquiring or collecting on receivables of new asset types.
We continually seek to diversify our revenue streams and therefore we may pursue the acquisition of charged-off receivables types not previously purchased by us. We may not be successful in acquiring such charged-off receivables or, if acquired, we may be unsuccessful in achieving our required return on such charged-off receivables which may have a material adverse effect on our results of operations and financial condition.
We are dependent upon our call centers and branch offices to service our charged-off receivables.
We are dependent upon the efforts of our call centers and branch offices to service and collect our charged-off receivables in accordance with legal requirements and our commitment to customer satisfaction. Any failure by these call centers and branch offices to adequately perform collection services for us or to remit such collections to us could materially reduce our cash flows, income and profitability. To the extent these call centers or branch offices violate laws or other regulatory requirements in their collection efforts, it could also negatively impact us and we may not be aware of the risk or occurrence.
Since we rely on our call centers and branch offices for liquidation on the accounts, we are dependent on our and our branch offices’ ability to attract, hire, train and lead qualified employees. The collection industry, by its nature, is labor intensive and experiences a high employee turnover rate. Many of our call center and branch office employees receive modest hourly wages combined with a performance-based bonus and some of these employees are employed on a part-time basis. A higher turnover rate among these individuals would increase recruiting and training costs for us and our branch offices and could have a material and adverse impact on collections because we believe that experienced collection professionals generally
23
tend to collect substantially more than inexperienced collections personnel. If we and our branch offices are unable to recruit and retain a sufficient number of employees with the appropriate skill sets, we would be forced to limit our growth or possibly curtail our operations or purchasing of debt portfolios. We have historically seen periods when we believe that our performance has been negatively impacted by the ability of our branch offices to hire, train, and retain the appropriate sized staff to manage the recovery efforts on our accounts.
Our branch offices account for a significant portion of our total recoveries.
Our branch offices provide a significant amount of our collections on purchased debt. Branch owners may own one or more branch locations. We may, from time to time, have concentrations with our largest owners. Although no branch owner accounted for more than 15% of our total collections during 2015, the loss of any one or more of our branch offices or branch owners could materially impact our collections capacity and the recovery rates on our accounts.
It can take several years to realize cash returns on our investments in charged-off receivables, during which time we are exposed to a number of risks in our business.
It is possible to take in excess of 24 or 36 months for us to recoup the original purchase price of our investment in charged-off receivables after taking into consideration our direct and indirect operating costs, our financing costs, court costs, taxes and other factors. Currently, we typically underwrite our investments based on a projected return achieved in a period of not more than twelve years. During this period, significant changes may occur in the economy, the regulatory environment, our company, or our markets, which could lead to a substantial reduction in our expected returns or reduce the value of the accounts we have purchased. Given the multi-year payback period on substantially all of our purchases, we are exposed to the risk of any such changes for a significant period of time.
Furthermore, because of the lengthy payback period on our investments, our growth strategy will require additional capital funding to finance a continued increase in the size of our base of charged-off receivables. Our strategy could be negatively impacted by changes in the costs to finance such growth or our ability to refinance debt obligations that have funded such growth as they become due.
A significant portion of our portfolio purchases during any period may be concentrated with a small number of sellers of charged-off receivables.
A significant percentage of our portfolio purchases for any given fiscal year may be concentrated with a few large sellers. The five largest sellers accounted for approximately 53% of our portfolio purchases in 2015 and 67% in 2014. While we have initiated efforts to continue to diversify our purchasing relationships, both within and outside the credit card industry, given the current concentration in the consumer credit card market, we expect significant levels of concentration to continue to exist in our business. We cannot be certain that any of our significant sellers will continue to sell charged-off receivables to us on terms or in quantities acceptable to us, or that we would be able to replace such purchases with purchases from other sellers of a quantity and quality of historical purchases.
24
The statistical models we use to project remaining cash flows from our charged-off receivables may prove to be inaccurate, which could result in reduced revenues or the recording of a valuation allowance if we do not achieve the recoveries forecasted by our models.
We use internally developed models to project the remaining cash flows from our charged-off receivables. These models and our Decision Science team are critical to determining the prices we are willing to pay for the portfolios that we acquire, the strategies that we use to pursue recovery on receivables, and selecting the accounts on which we will pursue legal recoveries. Our models consider known data about the accounts we acquire, including, among other things, our collection experience and changes in external factors impacting the customer, in addition to certain data elements known when we acquired the accounts. Because the historical collection experience may not reflect current realities, there can be no absolute assurance, however, that we will be able to achieve the recoveries forecasted by our models or that our models appropriately capture and weigh the important predictive elements or that all the models we create and use will yield correct or accurate forecasts. The foregoing notwithstanding, it is our belief that the models that we have generated appropriately reflect, to the extent possible, our estimates of expected reality. Our models are based in part on information provided to us by third parties. We have no control over the accuracy of such information. If our models are not accurate, it could lead us to pay too much for charged-off receivables, pursue the wrong collection techniques on accounts and experience lower liquidation rates or larger investments in court costs and operating expenses. Furthermore, if we are not able to achieve these levels of forecasted liquidations, valuation allowances may be recognized and our revenues and returns will be reduced. Any of these events may have a material and adverse impact on our results of operations and financial condition. Furthermore, if our models understate the full expected liquidations on the accounts, then we may not be able to be competitive in bidding on the accounts.
Our success depends on our senior leadership team, and if we are not able to retain them, it could have a material and adverse effect on us.
We are highly dependent upon the continued services and experience of our senior leadership team, including Paul A. Larkins, our President and Chief Executive Officer; John D. Lowe, our Chief Financial Officer; J.B. Richardson, Jr., our Chief Operating Officer; Brian W. Tuite, our Chief Business Development Officer and Alan Singer, our General Counsel, as well as the managers and employees who report to these individuals. We depend on the services of our senior leadership team to, among other things, continue the development and implementation of our strategies, and to maintain and develop relationships with our branch offices and the issuers from whom we purchase charged-off receivables. We have employment agreements with certain of these named individuals; however, these agreements do not and cannot assure the continued services of these officers. We have historically experienced voluntary and involuntary turnover of senior management personnel and can provide no assurance that such turnover will not happen in the future. To the extent such turnover occurs, it could have a material and adverse effect on our business, results of operations, and financial condition.
Failure to effectively manage our growth could adversely affect our business and operating results.
We have expanded significantly over our history and we intend to grow in the future. However, any future growth will place additional demands on our resources, and we cannot be sure that we will be able to manage our growth effectively. To successfully manage our growth, we may need to:
• expand and enhance our administrative infrastructure;
• expand or enhance our access to debt or equity capital; and
• enhance our management systems, our financial and information systems, and our controls.
Uncontrolled growth could put additional emphasis on recruiting, training, managing and retaining our employees and the employees of our branch offices, and place a strain on management, operations, and financial resources. We cannot assure you that the existing infrastructure, facilities, call centers, branch offices and employees will be adequate to support our future operations or to effectively adapt to future growth. If we cannot manage our growth effectively, our results of operations and financial condition may be materially and adversely affected.
25
We may not be successful in recovering court costs.
We generally direct charged-off receivables for legal collection when we believe the related customer has sufficient assets to repay the indebtedness but has, to date, been unwilling to pay. In connection with our agreements with our branch offices, we pay certain court costs. While these costs are typically expensed as incurred, our recovery estimates of these costs are factored into our cash flow projections used to determine our revenue recognition in accordance with the interest method, or level yield method, of accounting. These court costs may be difficult to collect, and we may not be successful in collecting amounts we expected to collect. If we are not able to recover these court costs, this may have a significant impact on our results of operations and financial condition.
We may incur losses related to the collapse of a financial institution where we maintain deposits.
We maintain cash deposits with several financial institutions in the U.S. and Canada. We may have exposure with certain financial institutions to the extent our cash balances exceed the current maximum Federal Deposit Insurance Corporation coverage of $250,000 in the U.S., or $100,000 maximum in Canada under the coverage provided by the Canada Deposit Insurance Corporation. If one of these financial institutions were to collapse, we may be unable to retrieve our deposits and may incur significant losses that would have an adverse effect on our results of operations and financial condition.
Exchange rate fluctuations could have an adverse effect on us.
Our Canadian subsidiaries, which acquire and service Canadian accounts only, conduct business in Canadian dollars, but we report their financial results in U.S. dollars. We are exposed to fluctuations in currency exchange rates as part of the translation of these financial results into U.S. dollars. In addition, we periodically repatriate and utilize excess cash held by our Canadian subsidiaries to pay down our U.S. borrowings under our senior revolving credit facility, which further increases our risk related to unforeseen negative currency exchange rate fluctuations. Fluctuations in currency exchange rates may have a material adverse effect on our results of operations or financial condition.
A portion of our borrowings have floating interest rates that may expose us to higher interest payments should interest rates increase substantially.
As of December 31, 2015, we had approximately $134.8 million of floating rate debt outstanding (primarily based on spreads above LIBOR or a base rate), which represents the outstanding balance of the senior revolving credit facility. Prior to the impact of any interest rates swaps or caps we may enter into in the future, each 25 basis point increase in interest rates could increase our annual cash interest expense by $125,000 for each $50 million of our base rate variable rate borrowings outstanding for the entire year. Our LIBOR loans are subject to a LIBOR floor of 1.00%, excluding our fixed margin, which is more fully described in our consolidated financial statements, and until certain LIBOR rates exceed 1.00%, the interest rates we pay on those loans per dollar borrowed will not increase. We utilize LIBOR loans for the majority of our variable rate borrowings. As our strategy is to fund our growth in purchasing with additional borrowings under the senior revolving credit facility, our exposure to floating interest rates is likely to increase. In addition, the senior revolving credit facility contains interest rate floors which will eliminate the benefit of interest rates below certain thresholds even though we will be negatively impacted by increased interest rates.
We may seek to make strategic acquisitions. Acquisitions involve additional risks that may adversely affect us.
From time to time, we, CA Holding or any of its other subsidiaries may seek to make acquisitions of businesses. We, CA Holding or any of its other subsidiaries may elect to borrow money, incur liabilities, or sell or issue stock to pay for future acquisitions and we, CA Holding or any of its other subsidiaries may not be able to do so on favorable terms, or at all. Additional borrowings and liabilities may have a material and adverse effect on our, CA Holding or any of its other subsidiaries' liquidity and capital resources. Our, CA Holding or any of its other subsidiaries' common stock is not publicly traded and potential sellers may be unwilling to accept equity in a privately held company as payment for the sale of their business. If potential sellers are not willing to accept equity as payment for the sale of their business, we, CA Holding or any of our other subsidiaries may be required to use more cash resources, if available, in order to continue with the potential acquisition.
Completing acquisitions involves a number of risks, including diverting management's attention from our daily operations, expenditures of other additional management, operational and financial resources, system conversions and the inability to maintain key pre-acquisition relationships with customers, suppliers and employees. We, CA Holding or any of its other subsidiaries might not be able to successfully integrate future acquisitions into our business or operate the acquired businesses profitably, and we, CA Holding or any of its other subsidiaries may be subject to unanticipated problems and
26
liabilities of acquired companies. We, CA Holding or any of its other subsidiaries may also be unable to make acquisitions of businesses with key strategic capabilities if we, CA Holding or any of its other subsidiaries cannot secure financing or required approvals under our debt agreements or they are not available at favorable prices due to increased competition for these businesses which might adversely impact our competitive positioning in our industry.
Risks Relating to Compliance and Regulatory Matters
If we, or our branch offices, fail to comply with applicable government regulation of the collections industry, it could result in the suspension or termination of our ability to conduct business.
The collections industry is regulated under various U.S. federal and state and Canadian laws and regulations. Many states, as well as provinces in Canada, require that we, and our third-party collectors, be licensed as debt collection companies. Both the Federal Trade Commission ("FTC") and the Consumer Financial Protection Bureau (“CFPB”) have the authority to investigate consumer complaints against debt collection companies, recommend enforcement actions, and seek monetary penalties. State regulatory authorities have similar powers. In addition, the CFPB has jurisdiction to conduct examinations of SquareTwo. The CFPB has conducted examinations of SquareTwo and from time to time SquareTwo receives requests for information from the CFPB. There can be no assurance that such examinations or requests for information will not result in regulatory actions that may be material to our business. Furthermore, we rely extensively on the attorneys affiliated with our branch offices to perform and supervise collection operations in a highly compliant fashion. Such attorneys are subject to regulation by their respective licensing and regulatory bodies. Failure of SquareTwo or our vendor attorneys to comply with applicable laws, regulations, and rules could result in further investigations and enforcement actions, and we could be subject to fines as well as the suspension or termination of our ability to conduct collections through our branch offices, which would have a material and adverse effect on our results of operations and financial condition.
In addition, new federal, state or foreign laws or regulations in the jurisdictions in which we or our branch offices operate, or changes in the ways these rules or laws are interpreted or enforced, could limit our activities, or the activities of our branch offices, in the future or significantly increase the cost of regulatory compliance. If we expand our international operations, we may become subject to additional government controls and regulations in other countries, which may be stricter or more burdensome than those government controls and regulations to which we are currently subject.
Late in 2013, the CFPB issued an Advance Notice of Proposed Rulemaking (the “ANPR”) pursuant to which it posed 162 questions addressing issues raised in the debt collection and purchasing markets. The expressed intention of the CFPB is to use the responses to the questions to guide it in the issuance of rules governing these industries. The timing and content of these rules and the impact of these rules on the debt purchasing and debt collection industries remain uncertain. Depending on the ultimate content of the rules, changes may need to be made in the operational approaches made by our call centers and branch offices.
In 2015, the CFPB concluded several high profile enforcement proceedings, which are of great interest to debt sale and debt market participants, by issuing consent orders (the "Consent Orders"). On July 8, 2015 the CFPB issued a Consent Order against Chase Bank USA, N.A. and Chase Bankcard Services, Inc. (“Chase”). On September 9, 2015, the CFPB filed Consent Orders against Encore Capital Group, Inc. (“Encore”) and Portfolio Recovery Associates, LLC (“PRA”). On December 28, 2015 the CFPB and Frederick J. Hanna & Associates, P.C. (“Hanna”) filed a stipulated final judgment and order settling the pending lawsuit between them. By their terms in the Consent Orders, the Encore, PRA and Hanna matters apply to consumer debts - those incurred primarily for personal, family or household purposes. No implementation timeframe was announced in the PRA and Encore Consent Orders, although select provisions apply to their post-Consent Order purchases. The Hanna stipulated final judgment required that Hanna comply with the judgment’s provisions within 90 days of entry.
Although not formal rules or law, the Consent Orders telegraph what the CFPB believes is required under the FDCPA and Dodd-Frank, as they exist today. CFPB Director Richard Cordray stated in a September 9, 2015 press release regarding the Encore and PRA Consent Orders, “industry members who sell, buy and collect debt would be well served by carefully reviewing these orders." It is anticipated that the CFPB will propose formal rules in accord with the principles and requirements set forth in the Consent Orders. In the event the formal rules are proposed and implemented, we could become subject to additional regulation, which may increase our costs of compliance.
On November 4, 2015, the FTC announced a major new law enforcement initiative targeting deceptive and abusive debt collection practices titled “Operation Collection Protection”. The initiative is a nationwide effort the FTC is coordinating with the Department of Justice, the CFPB and more than 45 state and local enforcement agencies and regulators. FTC Chairwoman Edith Ramirez stated that Operation Collection Protection will conduct a comprehensive review of debt collection industry practices and will target corporate entities as well as individuals.
27
The Consent Orders and Operation Collection Protection may signal an aggressive new enforcement posture on the part of the CFPB and the FTC, and may result in increased scrutiny and regulatory enforcement risk for participants in the debt collection industry, including the Company.
Our ability to recover on our charged-off receivables may be limited under federal, state and Canadian laws.
Federal, state or local, and Canadian consumer protection, privacy and related laws, rules, and regulations extensively regulate the relationship between debt collectors and customers. These laws, rules, and regulations may limit our ability to recover on our charged-off receivables regardless of any act or omission on our part or on our branch offices' part. Some laws and regulations applicable to credit card issuers may preclude us from collecting on charged-off receivables we purchase if the credit card issuer or receivable owner previously failed to comply with applicable law in generating or servicing those receivables.
New federal, state, local, or Canadian laws, rules or regulations, or changes in interpretation or enforcement, could limit our activities in the future or significantly increase the cost of regulatory compliance for us and our branch offices. In addition, federal and state governmental bodies are considering, and may consider in the future, other legislative proposals that would regulate the collection of consumer receivables or the use of the consumer data that is critical to valuing and collecting charged-off receivables.
The CFPB also has the ability to issue rules interpreting the FDCPA that may adversely affect our business, results of operations, and financial condition. The CFPB may also take enforcement actions against either debt sellers or debt purchasers that could have adverse impacts on our industry generally and our business specifically. This Bureau may also impose requirements on credit card issuers that could create a disincentive for credit card issuers to sell these accounts.
A significant portion of our collections relies upon our success in individual lawsuits brought against consumers, which are inherently unpredictable, and our ability to collect on judgments in our favor.
We generate a significant portion of our cash flows and revenue by collecting on judgments that are granted by courts in lawsuits filed against customers. A decrease in the willingness of courts to grant such judgments, a change in the requirements for filing such cases or obtaining such judgments, a decrease in the applicable statute of limitations, or a decrease in our ability to collect on such judgments could have a material and adverse effect on our results of operations and financial condition. As we increase our use of legal channels for collections, our margins and recoveries may decrease as a result of an increase in upfront court costs and costs related to counter claims. We may be subject to adverse effects of regulatory or judicial changes that we cannot predict.
Our inability to provide sufficient evidence on accounts that are subject to legal collections may negatively impact the liquidation rate on these accounts.
When we collect accounts using a legal channel, courts in certain jurisdictions require that a copy of the account statements or applications be attached to the pleadings to obtain a judgment against the defendant. In addition, enhanced document requirements were articulated in the Consent Orders discussed above. If we are unable to produce account documents, or if courts require documentation that the original creditor is not able, or contractually required, to provide, these courts may deny our claims. As our industry has increased its use of legal collection efforts significantly over the last several years, we have witnessed the imposition of enhanced evidentiary requirements in excess of those required for claims brought by entities other than debt purchasers and more consumer friendly behavior from judges and courts in various jurisdictions. We believe the current trend toward consumer protectionism could lead to judicial proceedings or practices that create increasingly challenging requirements that could limit our ability to effectively pursue litigation on accounts, or substantially increase our costs incurred in pursuing our legal remedies.
28
We are subject to ongoing risks of litigation, including individual and class actions under consumer credit, collections, and other laws.
We operate in a litigious climate and currently are, and may in the future be, named as defendants in litigation, including individual and class actions under consumer credit, collections, and other laws. In certain situations, our current legal liability is limited by provisions of the Fair Debt Collections Practices Act. To the extent this act is amended or repealed in the future in a manner that eliminates the limitations on our liability for certain claims or to the extent that we are sued under laws that do not have these liability caps, we could face significantly larger litigation and claims expense going forward. We accrue for loss contingencies arising from litigation as they become probable and estimable; however, actual losses incurred by the Company may be higher than the amount accrued. An unfavorable resolution to any litigation proceeding may adversely impact our results of operations or financial condition.
Our collections may decrease if bankruptcy filings increase or if bankruptcy laws change.
Our ability to recover on an account where the customer is subject to a Chapter 7 bankruptcy is substantially eliminated. During times of significant economic challenges, the amount of charged-off receivables generally increases and the amount of personal bankruptcy filings also increases. Under certain bankruptcy filings, a customer's non-exempt assets are sold to repay creditors. Because the charged-off receivables we are attempting to collect are generally unsecured or secured on a second- or third-priority basis, we often would not be able to collect on those receivables if a customer files for bankruptcy and secured creditors have a claim on the customer's assets. As a result, our collections may decline with an increase in bankruptcy filings or if the bankruptcy laws change in a manner adverse to our business, in which case, our results of operations and financial condition could suffer.
Negative attention and news regarding the debt collection industry and individual debt collectors may have a negative impact on a customer's willingness to pay the charged-off receivables we acquire.
The following factors may cause consumers to be more reluctant to pay their debts or more willing to pursue legal actions against us:
• Annually the FTC publishes a report summarizing the complaints it has received regarding debt collection practices. The report contains the total number of complaints filed, the percentage of increases or decreases from the previous year, and an outline of key types of complaints.
• The CFPB periodically reports on complaints received and trends seen in areas of its jurisdiction, including the accounts receivable management industry and the debt collection industry.
• Print and television media, from time to time, may publish stories about the debt collection or accounts receivable management industry that may cite specific examples of real or perceived abusive collection practices. These stories are also published on websites, which can lead to the rapid dissemination of the story increasing the exposure to negative publicity about us or the industry.
• Websites exist where consumers list their concerns about the activities of debt collectors and seek guidance from other website posters on how to handle the situation. These websites are increasingly providing consumers with legal forms and other strategies to protest collection efforts and to try to avoid their obligations. To the extent that these forms and strategies are based upon erroneous legal information, the cost of collections is unnecessarily increased.
As a result of this negative publicity, customers may be more reluctant to pay their debts or could pursue legal action against us regardless of whether those actions are warranted. Additionally, adverse publicity may invite legislation or regulatory action. These actions could impact our ability to collect on the charged-off receivables we acquire and impact our ability to operate profitably.
Risks Related to Information Technology and Telecommunications
We are highly dependent on our telecommunications and computer systems, including our proprietary collections platform.
Our business is highly dependent on our telecommunications and computer systems. These systems could be interrupted by terrorist acts, natural disasters, power losses, computer viruses, or similar events. Our call centers and branch offices use common Voice over IP ("VOIP") technology and services to make calls to our customers that are also subject to disruption. Although disaster recovery provisions are in place, disruptions to these services affect our ability to make phone
29
calls and thus communicate with the customer base and generate revenue. Our business is also materially dependent on services provided by various Internet service providers and local and long distance telephone companies. Furthermore, our ability to use telecommunications systems to contact customers is limited by laws, rules, and regulations. If our equipment or systems cease to work or become legally unavailable, if there is any change in the telecommunications market that would affect our ability or our branch offices' ability to obtain favorable rates on communication services, or if there is any significant interruption in internet or telephone services, we may be prevented from providing services and our call centers or branch offices may not be able to collect on the charged-off receivables we have purchased. Because we generally recognize revenue and generate operating cash flow primarily through collections, any failure or interruption of services and collections would mean that we, and our branch offices, would continue to incur payroll and other expenses without any corresponding income.
Each of our call centers and branch offices is required to conduct all collection activities through our proprietary collections platform called eAGLE. We maintain eAGLE through internal resources and are not typically able to rely on third-party providers to remedy systems issues or errors. As the eAGLE platform is highly complex, we may also discover future errors in existing or newly created proprietary software coding that could have material and adverse impacts on our business or require substantial investments to remedy, or which we may not be able to remedy at all. We cannot be assured that our level of development documentation for eAGLE is comparable to that on third-party software packages and we may have certain employees that possess important, undocumented, knowledge of our systems. If any such employee no longer works for us, our ability to maintain, repair or modify our collections platform may be limited.
Security and privacy breaches of the systems we use to protect personal data could adversely affect our business, results of operations, and financial condition.
Our databases contain personal data of our customers, including credit card and healthcare information. This information includes, but is not limited to (i) personal information relating to the customer, such as name, social security number and credit card account number; (ii) location information relating to the location and telephone numbers for the customer and (iii) account specific information such as the date of issuance of the card, charge-off date and charge-off balance for the card. Any security or privacy breach of these databases could expose us to liability, increase our expenses relating to the resolution of these breaches, and deter suppliers from selling charged-off receivables to us or clients from placing charged-off receivables with us on a contingency basis. Our data security procedures may not effectively counter evolving security risks, address the security and privacy concerns of existing or potential clients or be compliant with federal, state, and local laws and regulations in all respects. As each call center and branch office has access to our collections platform and this confidential information, we may also be subject to security breaches at these locations. Any failures in our or our branch offices' security and privacy measures could adversely affect our business, results of operations, and financial condition.
If we are not able to respond to technological changes in telecommunications and computer systems in a timely manner, we may not be able to remain competitive.
Our success depends in large part on our sophisticated telecommunications and computer systems. We use these systems to enable our call centers and branch offices to identify and contact large numbers of customers and to record the results of the collection efforts on our owned and managed portfolios. If we are not able to respond to technological changes in telecommunications and computer systems in a timely manner, we may not be able to remain competitive. We have made a significant investment in technology to remain competitive and we anticipate that it will be necessary to continue to do so in the future. Telecommunications and computer technologies are changing rapidly and are characterized by short product life cycles, so we must anticipate technological developments. If we are not successful in anticipating, managing, or adopting technological changes on a timely basis, or if we do not have the capital resources available to invest in new technologies, our business could suffer.
We may not be able to adequately protect the intellectual property rights upon which we rely.
We rely on proprietary software programs and valuation and collection processes and techniques, and we believe that these assets provide us with a competitive advantage. We consider our proprietary software, processes and techniques to be trade secrets, but a significant portion of them are not protected by patent or registered copyright. We may not be able to adequately protect our technology and data resources, which may materially diminish our competitive advantage.
30
Risks Relating to Accounting and Controls
We generally account for purchased charged-off receivables revenues using the interest method, or level yield method, of accounting in accordance with GAAP, which requires making reasonable estimates of the timing and amount of future cash collections. If the timing is delayed or the actual amount recovered by us is materially different from our estimates, it could cause us to recognize valuation allowances, and negatively impact our earnings.
We utilize the interest, or level yield, method of accounting for the majority of our purchased charged-off receivables because we believe that the purchased receivables are discounted as a result of deterioration of credit quality and that the amounts and timing of cash proceeds for our purchased receivables can be reasonably estimated. This belief is predicated on our historical results and our knowledge of the industry. The interest method is prescribed by Accounting Standards Codification ("ASC") Subtopic 310-30, Loans and Debt Securities Acquired with Deteriorated Credit Quality ("ASC 310-30")."
We first implemented the level yield method of accounting in January 2005 for a limited number of our purchases and applied them to certain purchased receivables acquired after December 31, 2004. Beginning with purchases in 2007, we have adopted the level yield method of accounting for the substantial majority of our purchases. The cost recovery method prescribed by ASC 310-30 is used when proceeds on a particular portfolio cannot be reasonably predicted in timing and amount. When appropriate, the cost recovery method may be used for pools that previously had a yield assigned. Under the cost recovery method, no revenue on a net basis is recognized until we have fully amortized the carrying value of a purchase net of collection fees.
Purchased debt portfolios with similar economic characteristics accounted for under the level yield method are accumulated into static pools on a quarterly basis. Under the level yield method of accounting, cash proceeds on each static pool are allocated to revenue and to reduce the carrying value (purchased debt line item on our consolidated balance sheets) based on an estimated gross internal rate of return ("IRR") for that pool. We determine the applicable IRR for each static pool based on our estimate of the expected cash proceeds of that pool and the rate of return required to reduce the carrying value of that pool to zero over its estimated life. Each pool's IRR is typically determined using an expected life up to 144 months. As described below, if cash proceeds for a purchase deviate from the forecast in timing or amount, then we adjust the carrying value of the pool or its IRR (which determines our future revenue recognition), as applicable.
Application of the level yield method of accounting requires the use of estimates, primarily estimated remaining cash proceeds, to calculate a projected IRR for each pool. These estimates are primarily based on historical experience and our proprietary models. The expected trends of each pool are analyzed at least quarterly. If future cash proceeds are materially different in amount or timing than the original estimate, earnings could be affected, either positively or negatively. Higher cash proceeds, or cash proceeds that occur sooner than projected cash proceeds, will have a favorable impact and may result in a reversal of valuation allowances or an increase in the IRR, thereby increasing revenues. Lower cash proceeds, or cash proceeds that occur later than projected, will have an unfavorable impact and may result in a valuation allowance being recorded, thereby decreasing revenues. As the accounting required under the level yield method of accounting treats current or projected underperformance as a current charge and current or projected over performance as a prospective increase in revenue recognition, it can create increased volatility in our consolidated financial statements as there is no effective netting of over and underperforming pools. We believe the charged-off receivables we acquire will continue to exhibit variability that will make continued valuation allowances probable in our business. We believe this variability is accentuated in periods of changing economic environments as is evidenced by the level of valuation allowances we recorded in 2008 through 2011, some of which have been partially reversed in 2012 through 2015.
In accordance with GAAP, we continue to have purchases that are accounted for under the cost recovery method, and expect to continue to apply the cost recovery method of accounting for certain purchases that do not meet the criteria for the level yield method of accounting. The use of two different revenue recognition procedures may result in a lack of comparability of our financial performance or may increase the volatility of our revenues and earnings on our consolidated financial statements. In addition, our continued use of cost recovery accounting results in a more rapid reduction in the carrying value of purchased debt and slower recognition of revenue.
31
Goodwill and other intangible assets represented 28.1% of our total assets at December 31, 2015. While non-cash impairment charges were recorded for goodwill and intangible assets in 2015 we may record future impairment charges, which could have a material adverse impact on our financial results.
A significant portion of our assets consists of goodwill and other long-lived assets, the carrying value of which may be reduced if we determine that those assets are impaired. Goodwill represents the excess of the purchase price over the fair market value of the net assets of acquired businesses based on their respective fair values at the date of acquisition. Our other intangible assets include the value of our network of regional branch offices, which was valued as part of purchase accounting applied at the date of CA Holding's acquisition of SquareTwo during 2005.
We evaluate our finite lived assets for impairment whenever events or circumstances indicate that the carrying amount may not be recoverable. We evaluate our goodwill and intangible assets for impairment annually, or more frequently if events or changes in circumstances suggest that impairment may exist. Our evaluation of impairment requires us to make certain estimates and assumptions including projections of future results.
The test for goodwill impairment uses a fair value based approach, whereby if the implied fair value of a reporting unit's goodwill is less than its carrying amount, goodwill would be considered impaired. If our goodwill is deemed to be impaired, we will need to take a charge to earnings in the future to write-down this asset to its fair value. We make significant assumptions to estimate the future revenue and cash flows used to determine our fair value. These assumptions include future growth rates, profitability, discount factors, market comparables, future tax rates, and other factors. Variations in any of these assumptions could result in materially different calculations of impairment amounts. If the expected revenue and cash flows are not realized, impairment or valuation allowance losses may be recorded in the future.
The branch office intangible asset was originally determined to have an indefinite life, and is tested annually for impairment, or more frequently, if events or changes in circumstances indicate impairment. We also annually evaluate the remaining useful life of the branch office intangible to determine whether events and circumstances continue to support the indefinite life assertion. We make significant assumptions to estimate the future cash flows used to determine the fair value of the network of branch offices. If the branch offices can no longer contribute materially to our profitability, the future cash flows expected to be generated by the network of branch office may be less than the carrying amount, and an impairment charge may be recorded. If the remaining useful life is deemed to no longer be indefinite, we may amortize the remaining book value over the estimated useful life.
Due to certain triggering events during the third quarter of fiscal 2015, as further described in Note 4 to the consolidated financial statements, an interim impairment test was performed, which was finalized in connection with the preparation of our annual consolidated financial statements. This impairment test resulted in non-cash impairment charges of $74.0 million and $10.6 million, before tax impacts, related to goodwill and the branch office network, respectively. Because of the continued significance of our goodwill and intangible assets, any future impairment of these assets could have a further material adverse effect on our results of operations and financial condition. Should there be continued deterioration in the Company's position and operating results, or if the Company is not be able to comply with any of its financial or non-financial covenants, specifically projected non-compliance with our Adjusted EBITDA covenant, there is increasing risk that the Domestic segment goodwill, and / or branch office network intangible, may be further impaired.
We may be subject to examinations and challenges by tax authorities.
Our industry is relatively unique and, as a result, there is not a set of well-defined laws, regulations, or case law for us to follow that matches our particular facts and circumstances for certain tax positions. Therefore, certain tax positions we take are based on industry practice, tax advice, and drawing similarities of our facts and circumstances to those in case law relating to other industries. These tax positions may relate to tax compliance, sales and use, franchise, gross receipts, payroll, property, and income tax issues, including tax base and apportionment. Challenges made by tax authorities to our application of tax rules may result in adjustments to the timing or amount of taxable income or deductions, the allocation of income among tax jurisdictions, and inconsistent positions between different jurisdictions on similar matters. If any such challenges are made and are not resolved in our favor, we may be required to pay additional taxes and/or penalties which may be substantial, and could have a material and adverse effect on our result of operations and financial condition. Due to the differences in our tax and GAAP financial statements, we also expect to continue to generate deferred tax asset balances on our consolidated financial statements. To the extent we cannot satisfy the "more likely than not" requirement that we are confident these assets will be used in a reasonable time frame, we may be required to record valuation allowances against these assets as we did in the years ended December 31, 2015, 2014, and 2013.
32
Our operating results and cash collections are cyclical and may vary from quarter to quarter.
Our business depends on the ability to collect on our purchased charged-off receivables. Without consideration of purchasing volumes, collections tend to be seasonally higher in the first and second quarters of the year, due to consumers' receipt of tax refunds and other factors. Conversely, collections within portfolios tend to be lower in the third and fourth quarters of the year, due to consumers' spending in connection with summer vacations, back-to-school purchases, the holiday season, and other factors. However, revenue recognized is relatively level due to our application of the interest method for revenue recognition. In addition, our operating results may be affected by the timing of purchases of charged-off receivables due to the initial costs associated with purchasing and integrating these receivables into our system. As the interest method of accounting is sensitive to the timing of cash proceeds, a shift in the expected timing of significant receipts on purchases can have a material impact on the projected yield on a static pool and can result in valuation allowance charges. Consequently, income and margins may fluctuate quarter to quarter and our results in any particular quarter may not be indicative of future operating results.
If we fail to maintain an effective system of internal control over financial reporting, we may be unable to accurately report our financial results and to comply with the reporting requirements under the Securities Exchange Act of 1934, as amended (the “Exchange Act”). As a result, creditors and investors may lose confidence in our financial reporting and disclosure required under the Exchange Act, which could adversely affect our business and could subject us to regulatory scrutiny.
We are required to file Annual Reports on Form 10-K and are registered with the SEC. Our Annual Reports include management's certification of establishing and maintaining disclosure controls and procedures. We cannot guarantee that we will not have any "significant deficiencies" or "material weaknesses". Compliance with these reporting requirements is expensive and time consuming. If in the future we fail to complete this evaluation in a timely manner, we could be subject to regulatory scrutiny and a loss of public confidence in our internal control over financial reporting, and would likely be in default under certain of our borrowing agreements. Meeting these requirements may result in a significant increase in costs for us. In addition, any failure to establish an effective system of internal control over financial reporting could cause our current and potential creditors and investors to lose confidence in our financial reporting and disclosure required under the Exchange Act, which could adversely affect our business.
Other Risks
We are controlled by an investor group led by KRG, a private equity firm, and its affiliates, whose interests may not be aligned with those of our note holders.
Under the stockholders agreement of our parent corporation, CA Holding, KRG has a contractual right to appoint a majority of the CA Board and thereby has the power to control our affairs and policies through its control of CA Holding, including but not limited to the power of appointment or removal of management, the issuance of additional stock, stock repurchase programs and the declaration and payment of dividends. This majority control means CA Holding must consent to the entering into of mergers, sales of substantially all our assets and certain other transactions.
Circumstances may occur in which the interests of CA Holding and its equity investors could be in conflict with those of our note holders. KRG may also have an interest in pursuing acquisitions, divestitures, financing or other transactions that, in their judgment, could enhance their equity investments, even though such transaction might involve risk to our note holders. Additionally, CA Holding and its equity investors have significant knowledge of our business operations and strategy and are not prohibited from making investments in any of our competitors.
We have substantial debt and have the ability to incur additional debt, a portion of which may be secured. The principal and interest payment obligations of such debt may restrict our future operations and impair our ability to meet our obligations under the notes.
As of December 31, 2015, we have approximately $426.3 million aggregate principal amount of outstanding indebtedness, of which substantially all is senior debt, and of which approximately $134.8 million is effectively ranked senior to the outstanding notes to the extent of the assets securing such debt.
Our substantial debt may have important consequences to its holders. For instance, it could:
• make it more difficult for us to satisfy our financial obligations, including those relating to the notes;
33
• require us to dedicate a substantial portion of any cash flow from operations to the payment of interest and principal due under our debt, which will reduce funds available for other business purposes, including portfolio investments and capital expenditures;
• place us at a competitive disadvantage compared with some of our competitors that may have less debt and better access to capital resources; and
• limit our ability to obtain additional financing required to fund working capital and capital expenditures and for other general corporate purposes.
Our ability to satisfy our obligations and to reduce our total debt depends on our future operating performance and on economic, financial, competitive and other factors, many of which are beyond our control. Our business may not generate sufficient cash flow, and future financings may not be available to provide sufficient net proceeds, to meet these obligations or to successfully execute our business strategy.
We may be unable to repay or repurchase the notes at maturity.
At maturity, the entire outstanding principal amount of the notes, together with accrued and unpaid interest, will become due and payable. We may not have the funds to fulfill these obligations or the ability to refinance these obligations. If the maturity date occurs at a time when other arrangements prohibit us from repaying the notes, we would try to obtain waivers of such prohibitions from the lenders and note holders under those arrangements, or we could attempt to refinance the borrowings that contain such restrictions. If we could not obtain a waiver or refinance the borrowings on favorable terms or at all, we would be unable to repay the notes.
The indenture governing the notes and our other debt agreements contain covenants that significantly restrict our operations.
The indenture governing the notes and the senior revolving credit facility each contain, and any of our other future debt agreements may contain, numerous covenants imposing financial and operating restrictions on our business. These restrictions may have a material and adverse effect on our ability to operate our business and take advantage of potential business opportunities as they arise, including by restricting our ability to finance future operations and capital needs and limiting our ability to engage in other business activities. These covenants place restrictions on our ability and the ability of our restricted subsidiaries to, among other things:
• incur additional indebtedness;
• declare or pay dividends, redeem stock or make other distributions to stockholders;
• make certain investments;
• create liens or use assets as security in other transactions;
• merge or consolidate, or sell, transfer, lease or dispose of substantially all of our assets;
• engage in transactions with affiliates; and
• sell or transfer certain assets.
The senior revolving credit facility also includes restrictions on our ability, among other things, to make capital expenditures; to make changes in the nature of our business; to enter into acquisitions, reorganizations and recapitalization; to make guarantees; and to make debt repayments and requires us to maintain certain financial performance ratios. A payment default or an acceleration of indebtedness thereunder as a result of an event of default under the senior revolving credit facility would give rise to an event of default under the indenture governing the notes, which would entitle the note holders to exercise the remedies provided in the indenture, subject to the restrictions and other provisions set forth in the intercreditor agreement.
34
A default under any of the agreements governing our indebtedness could result in a default and acceleration of indebtedness under other agreements.
Our senior revolving credit facility contains cross default provisions whereby a default under the indenture governing the notes could result in a default and acceleration of our repayment obligations under our senior revolving credit facility. If a cross-default were to occur, we may not be able to pay our debts or borrow sufficient funds to refinance such indebtedness. Even if new financing were available, it may not be on commercially reasonable terms or acceptable terms. If some or all of our indebtedness is in default for any reason, our business, results of operations and financial condition could be materially and adversely affected.
The right to receive payment on the notes is structurally subordinated to the obligations of our non-guarantor subsidiaries.
The notes are jointly and severally guaranteed on a senior secured basis by substantially all of our existing and future domestic subsidiaries that guarantee, or are otherwise obligors with respect to, indebtedness under our senior revolving credit facility. Although CA Holding and our Canadian subsidiaries guarantee our obligations under our senior revolving credit facility, they do not guarantee our obligations under the notes. Our non-U.S. subsidiaries are not required by the indenture to guarantee the notes. Our non-guarantor subsidiaries are separate and distinct legal entities with no obligation to pay any amounts due pursuant to the notes or the guarantees of the notes or to provide us or the guarantors with funds for our payment obligations. Our cash flow and our ability to service our debt, including the notes, depend in part on the earnings of our non-guarantor subsidiaries and on the distribution of earnings, loans or other payments to us by these subsidiaries. Our non-guarantor subsidiaries represented approximately 13.4% of our total assets and approximately 1.2% of our liabilities as of December 31, 2015, and represented approximately 14.0% and approximately 18.8% of our consolidated revenue and Adjusted EBITDA, respectively, for the year ended December 31, 2015.
The notes are structurally subordinated to all current and future liabilities, including trade payables, of our subsidiaries that do not guarantee the notes, and the claims of creditors of those subsidiaries, including trade creditors, have priority as to the assets and cash flows of those subsidiaries. In the event of a bankruptcy, liquidation, dissolution or similar proceeding of any of the non-guarantor subsidiaries, holders of their liabilities, including their trade creditors, will generally be entitled to payment on their claims from assets of those subsidiaries before any assets are made available for distribution to us or our guarantor subsidiaries. As of December 31, 2015, the non-guarantor subsidiaries had no indebtedness, excluding intercompany indebtedness.
The lenders under our senior revolving credit facility have the discretion to release the guarantors under the senior revolving credit facility in a variety of circumstances, which will cause those guarantors to be released from their guarantees of the notes.
While any obligations under our senior revolving credit facility remain outstanding, any guarantee of the notes may be released without action by, or consent of, any note holder or the trustee under the indenture governing the notes if the related guarantor is no longer a guarantor of obligations under the senior revolving credit facility or certain other indebtedness. The lenders under the senior revolving credit facility or such other indebtedness have the discretion to release the guarantors under the senior revolving credit facility in a variety of circumstances. Note holders will not have a claim as a creditor against any subsidiary that is no longer a guarantor of the notes.
We may not be able to repurchase the notes upon a change of control or sale of certain assets.
Upon the occurrence of specific changes of control events or the sale of certain assets, we will be required to offer to repurchase all or a portion of the outstanding notes. We may not be able to repurchase the notes upon a change of control or sale of certain assets because we may not have sufficient funds. Further, we will be contractually restricted under the terms of our senior revolving credit facility from repurchasing all of the notes tendered by note holders upon a change of control or sale of certain assets. Accordingly, we may not be able to satisfy our obligations to purchase notes unless we are able to refinance or obtain waivers under the senior revolving credit facility. Our failure to repurchase the notes upon a change of control or sale of certain assets would cause a default under the indenture governing the notes and a cross-default under the senior revolving credit facility, which would permit the lenders thereunder to accelerate the maturity of borrowings under our senior revolving credit facility and, if such indebtedness is not paid, to enforce security interests in the collateral, thereby limiting the practical benefit of the offer-to-purchase provisions to the note holders. Any of our future debt agreements may contain similar provisions.
35
In addition, the change of control provisions in the indenture governing the notes may not protect note holders from certain important corporate events, such as a leveraged recapitalization (which would increase the level of our indebtedness), reorganization, restructuring, merger or other similar transaction. Such a transaction may not involve a change in voting power or beneficial ownership or, even if it does, may not involve a change that constitutes a "Change of Control" as defined in the indenture governing the notes that would trigger our obligation to repurchase the notes. If an event occurs that does not constitute a "Change of Control" as defined in the indenture governing the notes, we will not be required to make an offer to repurchase the notes and note holder may be required to continue to hold their notes despite the event.
Note holders do not control decisions regarding collateral.
The lenders under our senior revolving credit facility, as holders of first priority lien obligations, control substantially all matters related to the collateral pursuant to the terms of the intercreditor agreement. The holders of the first priority lien obligations may cause the collateral agent thereunder (the "first lien agent") to dispose of, release, or foreclose on, or take other actions with respect to, the collateral (including amendments of and waivers under the security documents) with which note holders may disagree or that may be contrary to the interests of note holders, even after a default under the notes. To the extent collateral is released from securing the first priority lien obligations, the intercreditor agreement provides that, subject to certain exceptions, the second priority liens securing the notes will also be released. In addition, the security documents related to the second priority liens generally provide that, so long as the first priority lien obligations are in effect, the holders of the first priority lien obligations may change, waive, modify or vary the security documents governing such first priority liens without the consent of the note holders (except under certain limited circumstances) and that the security documents governing the second priority liens will be automatically changed, waived and modified in the same manner. Further, the security documents governing the second priority liens may not be amended in any manner adverse to the holders of the first-priority obligations without the consent of the first lien agent until the first priority lien obligations are paid in full. The security agreement governing the second priority liens prohibits second priority lienholders from foreclosing on the collateral until payment in full of the first priority lien obligations. We cannot assure note holders that in the event of a foreclosure by the holders of the first priority lien obligations, the proceeds from the sale of collateral would be sufficient to satisfy all or any of the amounts outstanding under the notes after payment in full of the obligations secured by first priority liens on the collateral.
It may be difficult to realize the value of the collateral securing the notes.
The collateral securing the notes is subject to any and all exceptions, defects, encumbrances, liens and other imperfections as may be accepted by the trustee for the notes and the second lien collateral agent and any other creditors that have the benefit of first liens on the collateral securing the notes from time to time, whether on or after the date the notes are issued. The existence of any such exceptions, defects, encumbrances, liens and other imperfections could adversely affect the value of the collateral securing the notes as well as the ability of the second lien collateral agent to realize or foreclose on such collateral.
We believe our purchased debt accounts represent the significant majority of our collateral value. These assets, in particular, may be subject to significant changes in value due to economic or regulatory trends. In addition, it may be challenging for note holders to realize the value of our purchased debt collateral as these are financial assets, not physical assets, and represent liabilities of consumers who have defaulted on their obligations. Charged-off receivables typically decline in value over time. Due to the priority of the first lien security interests, and the provisions of the intercreditor agreement, note holders may not be able to take action on the collateral prior to it declining in value. To realize the value of the collateral, note holders may need to rely on third-party collection resources. In the event of a liquidation or winding up of our business, our branch offices may not be willing to continue to pursue recovery efforts on our accounts or may require us to increase the fees we pay them to do so. If we had to rely on third parties outside of our branch offices, we may not be able to access attorney-based collections or may be required to provide significant upfront investments in expenses. Furthermore, the institutions from which we acquire charged-off receivables may be unwilling to provide us with the account level documentation we would need to successfully pursue litigation on accounts which may significantly reduce the realizable value of the collateral.
The value of the collateral at any time will also depend on the availability of suitable buyers. By their nature, some or all of the pledged assets may be illiquid and may have no readily ascertainable market value. We cannot assure note holders that the fair market value of the collateral as of the date of this Annual Report on Form 10-K exceeds the principal amount of the debt secured thereby. The value of the assets pledged as collateral for the notes could be impaired in the future as a result of changing economic conditions, our failure to implement our business strategy, the failure by us and our branch offices to adequately collect on such assets, competition, regulatory or judicial changes, unforeseen liabilities and other future events. Accordingly, there may not be sufficient collateral to pay all or any of the amounts due on the notes. Any claim for the difference between the amount, if any, realized by note holders from the sale of the collateral securing the notes and the obligations under the notes will rank equally in right of payment with all of our other unsecured unsubordinated indebtedness
36
and other obligations, including trade payables. Additionally, if a bankruptcy case is commenced by or against us, if the value of the collateral is less than the amount of principal and accrued and unpaid interest on the notes and all other senior secured obligations, interest may cease to accrue on the notes from and after the date the bankruptcy petition is filed.
In the future, the obligation to grant additional security over assets, or a particular type or class of assets, whether as a result of the acquisition or creation of future assets or subsidiaries, the designation of a previously unrestricted subsidiary or otherwise, is subject to the provisions of the security agreement. The security agreement sets out a number of limitations on the rights of the note holders to require security in certain circumstances, which may result in, among other things, the amount recoverable under any security provided by any subsidiary being limited and/or security not being granted over a particular type or class of assets. Accordingly, this may affect the value of the security provided by us and our subsidiaries. Furthermore, upon enforcement against any collateral or in insolvency, under the terms of the intercreditor agreement the claims of the note holders to the proceeds of such enforcement will rank behind the claims of the holders of obligations under our senior revolving credit facility, which are first priority obligations, and holders of additional secured indebtedness (to the extent permitted to have priority by the indenture).
The security interest of the second lien collateral agent will be subject to practical problems generally associated with the realization of security interests in collateral. For example, the second lien collateral agent may need to obtain the consent of a third party to obtain or enforce a security interest in a contract. We cannot assure note holders that the collateral agent will be able to obtain any such consent. We also cannot assure note holders that the consents of any third parties will be given when required to facilitate a foreclosure on such assets. Accordingly, the second lien collateral agent may not have the ability to foreclose upon those assets and the value of the collateral may significantly decrease.
A court could void our subsidiaries' guarantees of the notes and the liens securing such guarantees under fraudulent transfer laws.
Although the guarantees provide note holders with a direct claim against the assets of the subsidiary guarantors and the guarantees will be secured by the collateral owned by the guarantors, under the federal bankruptcy laws and comparable provisions of state fraudulent transfer laws, a guarantee or lien could be voided, or claims with respect to a guarantee or lien could be subordinated to all other debts of that guarantor. In addition, a bankruptcy court could void (i.e., cancel) any payments by that guarantor pursuant to its guarantee and require those payments and enforcement proceeds from the collateral to be returned to the guarantor or to a fund for the benefit of the other creditors of the guarantor. Each guarantee will contain a provision intended to limit the guarantor's liability to the maximum amount that it could incur without causing the incurrence of obligations under its guarantee to be a fraudulent transfer. This provision may not be effective to protect the guarantees from being voided under fraudulent transfer law, or may eliminate the guarantor's obligations or reduce the guarantor's obligations to an amount that effectively makes the guarantee worthless. In a recent Florida bankruptcy case, this kind of provision was found to be ineffective to protect the interests of the creditors in the guarantees.
The bankruptcy court might take these actions if it found, among other things, that when a subsidiary guarantor executed its guarantee or granted its lien (or, in some jurisdictions, when it became obligated to make payments under its guarantee):
• such subsidiary guarantor received less than reasonably equivalent value or fair consideration for the incurrence of its guarantee or granting of the lien; and
• such subsidiary guarantor:
• was (or was rendered) insolvent by the incurrence of the guarantee;
• was engaged or about to engage in a business or transaction for which its assets constituted unreasonably small capital to carry on its business;
• intended to incur, or believed that it would incur, obligations beyond its ability to pay as those obligations matured; or
• was a defendant in an action for money damages, or had a judgment for money damages docketed against it and, in either case, after final judgment, the judgment was unsatisfied.
37
A bankruptcy court would likely find that a subsidiary guarantor received less than fair consideration or reasonably equivalent value for its guarantee or lien to the extent that it did not receive direct or indirect benefit from the issuance of the notes. A bankruptcy court could also void a guarantee or lien if it found that the subsidiary issued its guarantee or granted its lien with actual intent to hinder, delay or defraud creditors.
Although courts in different jurisdictions measure solvency differently, in general, an entity would be deemed insolvent if the sum of its debts, including contingent and unliquidated debts, exceeds the fair value of its assets, or if the present fair salable value of its assets is less than the amount that would be required to pay the expected liability on its debts, including contingent and unliquidated debts, as they become due.
If a court voided a guarantee or lien, it could require that note holders return any amounts previously paid under such guarantee or enforcement proceeds from the collateral. If any guarantee or lien were voided, note holders would retain their rights against us and any other subsidiary guarantors, although there is no assurance that those entities' assets would be sufficient to pay the notes in full.
Any future pledge of collateral might be avoidable in bankruptcy.
Any future pledge of collateral in favor of the second lien collateral agent, including pursuant to mortgages and other security documents delivered after the date of the indenture governing the notes, might be avoidable by the pledgor (as debtor-in-possession) or by its trustee in bankruptcy if certain events or circumstances exist or occur, including, among others, if the pledgor is insolvent at the time of the pledge, the pledge permits the note holders to receive a greater recovery than if the pledge had not been given and a bankruptcy proceeding in respect of the pledgor is commenced within 90 days following the pledge or, in certain circumstances, a longer period.
We cannot be sure that a market for the notes, if any, will continue.
We cannot assure note holders as to:
• the liquidity of any trading market for the notes;
• their ability to sell their notes; or
• the price at which they may be able to sell their notes.
The notes may trade at a discount from their initial offering price, depending upon prevailing interest rates, the market for similar securities and other factors, including general economic conditions, our financial condition, performance and prospects and prospects for companies in our industry generally. In addition, the liquidity of the trading market in the notes and the market prices quoted for the notes may be adversely affected by changes in the overall market for high-yield securities.
The lease of our Denver corporate office and call center expires on October 31, 2016. We currently do not have a new lease agreement in place after that period.
We are actively working with advisors and potential lessors to address the lease expiration. There can be no assurance that the current lease will be extended, modified, or replaced by a new lease facility prior to its expiration. Failure to satisfy our facility needs could have a detrimental impact on our ability to continue day to day operations.
38
Item 1B. Unresolved Staff Comments.
None.
Item 2. Properties.
Our headquarters are located on leased property at 4340 South Monaco Street, Second Floor, Denver, Colorado 80237. We own no real property. The following table sets forth certain information regarding our leased facilities as of December 31, 2015.
Location | Principal Use | Reporting Segment | Type | Square Footage | Lease Expiration Date | |||||
Denver, CO | Headquarters | Domestic | Office | 75,232 | October 31, 2016 | |||||
Denver, CO | Call Center | Domestic | Office | 18,687 | October 31, 2016 | |||||
Overland Park, KS | Call Center | Domestic | Office | 4,138 | December 31, 2017 | |||||
Newmarket, Ontario | Canadian Operations | Canada | Office | 6,651 | September 30, 2018 | |||||
Montreal, Quebec | Canadian Operations | Canada | Office | 1,352 | April 30, 2019 | |||||
Item 3. Legal Proceedings.
From time to time the Company is a defendant in ordinary routine litigation alleging violations of applicable state and federal laws by the Company or the branch offices acting on its behalf that is incidental to our business. These suits may include actions which may purport to be on behalf of a class of consumers. While the litigation and regulatory environment is challenging and continually changing, both for the Company, our branch offices and our industry, in our opinion, such matters will not individually, or in the aggregate, result in a materially adverse effect on the Company's financial position, results of operations or cash flows. Management believes the range of reasonably possible loss for outstanding claims beyond those previously accrued is between zero and $1.5 million. The Company accrues for loss contingencies as they become probable and estimable.
Item 4. Mine Safety Disclosures.
Not applicable.
39
PART II
Item 5. Market for Registrant's Common Equity, Related Stockholder Matters and Issuer Purchases of Equity Securities.
There is no established public trading market for the Company's common stock. The Company had one record holder of common stock on April 25, 2016. The Company did not declare or pay any dividends during the fiscal years ended December 31, 2015, 2014, and 2013.
Item 6. Selected Financial Data.
The following table summarizes certain selected historical financial data about our company for the last five years. The data has been derived from our audited consolidated financial statements for the years indicated. You should read this data in conjunction with “Management's Discussion and Analysis of Financial Condition and Results of Operations” and our audited consolidated financial statements and notes related thereto contained herein.
Year Ended December 31, | ||||||||||||||||||||
($ in thousands) | 2015 | 2014 | 2013 | 2012 | 2011 | |||||||||||||||
Revenues | ||||||||||||||||||||
Purchased debt revenue, net | $ | 202,611 | $ | 247,035 | $ | 337,578 | $ | 353,360 | $ | 227,068 | ||||||||||
Other revenue | 42 | 56 | 675 | 917 | 3,771 | |||||||||||||||
Total revenues | 202,653 | 247,091 | 338,253 | 354,277 | 230,839 | |||||||||||||||
Expenses | ||||||||||||||||||||
Purchased debt expense | 114,887 | 147,813 | 189,184 | 197,067 | 153,703 | |||||||||||||||
Court costs, net | 26,857 | 34,719 | 40,155 | 37,317 | 26,280 | |||||||||||||||
Salaries and payroll taxes | 34,601 | 30,552 | 26,348 | 26,136 | 25,644 | |||||||||||||||
General and administrative | 13,654 | 14,457 | 14,418 | 12,653 | 10,209 | |||||||||||||||
Depreciation and amortization | 6,753 | 6,883 | 7,986 | 6,860 | 5,264 | |||||||||||||||
Impairments of goodwill and intangible assets | 84,606 | — | — | — | — | |||||||||||||||
Total operating expenses | 281,358 | 234,424 | 278,091 | 280,033 | 221,100 | |||||||||||||||
Operating income | (78,705 | ) | 12,667 | 60,162 | 74,244 | 9,739 | ||||||||||||||
Other expenses | ||||||||||||||||||||
Interest expense | 44,609 | 44,217 | 45,984 | 48,456 | 49,113 | |||||||||||||||
Other expense (income) | 338 | 440 | 3,872 | (2,261 | ) | (1,058 | ) | |||||||||||||
Total other expenses | 44,947 | 44,657 | 49,856 | 46,195 | 48,055 | |||||||||||||||
(Loss) income before income taxes | (123,652 | ) | (31,990 | ) | 10,306 | 28,049 | (38,316 | ) | ||||||||||||
Income tax benefit (expense) | 5,951 | (5,950 | ) | (5,243 | ) | (5,435 | ) | (2,805 | ) | |||||||||||
Net (loss) income | $ | (117,701 | ) | $ | (37,940 | ) | $ | 5,063 | $ | 22,614 | $ | (41,121 | ) | |||||||
Statement of Financial Position Data: | ||||||||||||||||||||
Cash and cash equivalents | $ | 19,584 | $ | 15,677 | $ | 9,379 | $ | 7,538 | $ | 2,657 | ||||||||||
Purchased debt, net of valuation allowance | 167,494 | 222,700 | 274,357 | 251,682 | 243,413 | |||||||||||||||
Total assets | 307,818 | 448,087 | 498,404 | 480,236 | 470,594 | |||||||||||||||
Debt, including capital leases | 426,297 | 430,382 | 437,427 | 423,519 | 437,637 | |||||||||||||||
Total (deficiency) equity | (146,793 | ) | (23,306 | ) | 16,994 | 13,039 | (10,044 | ) | ||||||||||||
Operating and Other Data: | ||||||||||||||||||||
Total cash proceeds on purchased debt | $ | 353,148 | $ | 420,132 | $ | 563,709 | $ | 608,017 | $ | 470,680 | ||||||||||
Purchases—total, face | 1,137,201 | 1,223,860 | 2,823,674 | 3,755,448 | 3,895,875 | |||||||||||||||
Purchases—total, price | 98,247 | 126,747 | 258,110 | 272,757 | 267,704 | |||||||||||||||
Purchases—total, price (%) | 8.6 | % | 10.4 | % | 9.1 | % | 7.3 | % | 6.9 | % | ||||||||||
Capital expenditures(1) | 5,224 | 4,747 | 5,012 | 5,536 | 4,416 | |||||||||||||||
(1) Capital expenditures exclude expenditures financed through capital leases and capitalized interest related to capital leases.
40
Item 7. Management's Discussion and Analysis of Financial Condition and Results of Operations.
You should read this discussion and analysis in conjunction with the consolidated financial statements and notes that appear elsewhere in this Annual Report on Form 10-K. Our financial information may not be indicative of our future performance and does not necessarily reflect what our financial condition and results of operations would have been had we operated as an independent, stand-alone entity during all periods presented.
Our Company
We are a leading purchaser of charged-off consumer and commercial receivables in the accounts receivable management industry. Our primary business is the acquisition, management and collection of charged-off consumer and commercial accounts receivable that we purchase from financial institutions, finance and leasing companies, and other issuers in the United States (U.S.) and Canada. Charged-off accounts receivable, which we refer to as "charged-off receivables" or "accounts," are defaulted accounts receivable that credit issuers have charged-off as bad debt, but that remain subject to collection. We refer to a group of accounts as a "portfolio," and, once purchased, we refer to our owned charged-off receivables as our "purchases" or "purchased debt." We believe that we are one of the largest purchasers of "fresh" charged-off credit card and consumer loan receivables in the U.S. Fresh charged-off credit card and consumer loan receivables are generally 180-210 days past due at the time of sale and typically have not been subject to previous collection attempts by a third-party collection agency. The act of charging off an account is an action required by banking regulations and is an accounting action that does not release the obligor on the account from his/her responsibility to pay amounts due on the account. Because the credit issuer was unable to collect the charged-off receivables that we purchase, we are able to acquire these portfolios at a substantial discount to their face value.
Our business model leverages our analytic expertise, technology platform, and in the U.S., a unique combination of company-owned call centers operating under the d/b/a name Fresh View Solutions (“Fresh View”), one independently owned collections agency exclusively dedicated to SquareTwo, and a network of regional law offices, also referred to as "branch offices", exclusively dedicated to SquareTwo. We refer to this network of branch offices and company-owned call centers as the “Closed Loop Network” because all newly acquired customer accounts are managed within this network through our centralized, proprietary technology platform called eAGLE, regardless of where an account is in its lifecycle. This integrated account management system and the Closed Loop Network allow us to achieve the highest level of information security and data accuracy, as well as to strive to provide a uniform customer experience during every stage of collections regardless of location. We utilize non-exclusive law firms to liquidate legacy customer commitments, for collections on accounts where legal judgments and payment plans had been established prior to the formation of our Closed Loop Network. Lastly, in Canada, where we exclusively service our Canadian customers, we utilize a company-owned call center as well as third-party non-legal and legal collection firms.
Our focus throughout the recovery process is on the customer, and helping the customer resolve their outstanding financial commitments, while ensuring that those customers who demonstrate a significant ability to pay their contractual obligations actually satisfy their obligations. In accordance with our commitment to customer service, respect, and operational excellence, we are dedicated to treating customers fairly and ethically and maintaining stringent compliance standards, which we believe allows us to liquidate more effectively.
From 1999, our first full year of purchasing debt, to December 31, 2015, we have invested approximately $2.7 billion in the acquisition of charged-off receivables, representing over $39.0 billion in face value of accounts. From 1999 to December 31, 2015, we have grown our business from $8.7 million to $353.1 million of annual cash proceeds on owned charged-off receivables, representing a compound annual growth rate of approximately 26%.
The combination of our historical and future recovery efforts is expected to result in cumulative gross cash proceeds of approximately 2.2x our invested capital since our first purchase in 1998. Based on our proprietary analytical models, which utilize historical and current account level data, as well as economic, pricing and collection trends, we expect that our U.S. owned charged-off receivables as of December 31, 2015 of $7.1 billion (active face value) will generate approximately $482.6 million in gross cash proceeds. We refer to this as estimated remaining proceeds ("ERP"). In addition, we expect our Canadian owned charged-off receivables of $1.9 billion (active face value) to generate approximately $74.0 million in additional ERP. Therefore, the total ERP for both our U.S. and Canadian owned charged-off receivables was $556.6 million as of December 31, 2015. This compares to total ERP of $654.9 million as of December 31, 2014 and $840.9 million as of December 31, 2013. These expectations are based on historical data as well as assumptions about future collection rates and consumer behavior. We cannot guarantee that we will achieve such proceeds.
41
Our U.S. Closed Loop Network
Recovery efforts on all newly acquired U.S. purchased debt are managed by the Closed Loop Network discussed in the preceding section. Historically, our branch offices were the primary channel for recovery work on our behalf, but during 2014, we expanded our asset recovery options in the U.S. by opening a company-owned call center dedicated to consumer collections. Newly acquired accounts are placed for collection exclusively within our Fresh View call centers, where our call center employees are compensated based on their ability to meet our stringent compliance and operating standards. Legal recovery operations, if necessary, continue to progress through our dedicated branch office legal channel.
Fresh View enables us to satisfy a wide array of our bank clients’ needs while helping SquareTwo remain a leader in compliance. Regardless of where in our Closed Loop Network we place an account, either with Fresh View or with one of our branch offices, all customer account information and collection activity is managed within eAGLE, our proprietary integrated account management system, and in accordance with a standardized set of comprehensive policies and operational procedures, which we refer to as our “Compliance Management System.” This ensures that regardless of the chosen recovery option, we strive to provide a uniform customer experience. In addition, our Closed Loop Network business model creates valuable operating efficiencies and synergies, which we believe will translate to improved financial performance in the future.
Once accounts are designated for legal recovery efforts, they are placed into the network of legal branch offices. The branch offices perform recovery work exclusively on our behalf and utilize our account management system in accordance with specified contractual arrangements. Effective June 1, 2015, the Company entered into new business agreements with its branch offices replacing the previous contractual arrangements that were subject to franchise law. The new legal framework removed the legal requirements of franchise law in multiple jurisdictions and enables the Company more control and flexibility in how we manage the branch offices. These contractual agreements have a term of three years and provide the branch offices with a license to use our proprietary collection and account management software; however, SquareTwo no longer charges royalty fees as a percentage of each dollar collected.
We are under no obligation to provide accounts to any branch office. We pay these offices a service fee, which varies based upon the amount collected as well as their performance against certain of our operational incentives. We have historically allocated accounts to our branch offices based on capacity, geographic coverage, and their performance against our return expectations and adherence to operational and compliance requirements. In addition, branches are required to meet our stringent compliance standards to continue to be a part of our Closed Loop Network.
Underwriting and Purchasing
The success of our business depends heavily on our ability to find charged-off receivables for purchase, evaluate these assets accurately and acquire them at the appropriate pricing. We have a dedicated Business Development team that generates acquisition opportunities. Historically, we have purchased charged-off receivables from seven of the ten largest U.S. credit card issuers identified in The Nilson Report, which is a leading source of news and proprietary research on the payment system industry. In addition to our relationships within the largest U.S. credit card issuers, we have extensive relationships with marketplace lenders or financial technology companies, also known as "FinTechs", super-regional and regional banks and other credit issuers. Potential purchasing opportunities are reviewed in detail by our Decision Science department, which is responsible for creating forecasted cash flows for each purchase using our proprietary statistical models and our experience with similar purchases. These models and related assumptions are reviewed by our investment committee, which includes members of our senior leadership team and representatives from each key business function, to determine the appropriate purchase price for the available portfolios. We target purchases that meet return thresholds determined by our investment committee. In times of increased pricing in the market, we may accept a lower return, while still maintaining our yield-based purchasing strategy. In addition to the relationships described above, we are actively engaged in the development of business opportunities in purchasing other forms of charged-off domestic and Canadian receivables.
42
Sources of Revenue and Expense
Sources of Revenue
Our primary source of revenue is revenues recognized on our portfolio base of purchased debt assets which is driven by cash proceeds from non-legal collections, legal collections, court cost recoveries, recourse and bankruptcy. In addition, prior to June 1, 2015, we earned royalties from our branch offices ranging from 2% to 4% of each dollar collected in the non-legal channels for the use of our proprietary collection platform, eAGLE. In conjunction with the new contractual arrangements with our branch offices, effective June 1, 2015, the Company no longer charges royalty fees as a percentage of each dollar collected.
Sources of Expense
Purchased Debt Expense
Purchased debt expense represents direct and indirect costs of collections related to our purchased debt. In the U.S., the majority of our direct expenses relate to the fees that we pay to our branch offices based on their collections on our U.S. purchased debt. We pay these offices a service fee, which varies based upon the amount collected as well as their performance against certain of our operational incentives. Purchased debt expense in the U.S. also includes all costs related to our call centers, as well as legal compliance costs and certain other indirect operating and branch office costs. In Canada, purchased debt expense includes the cost of our collectors as well as fees paid to outside agencies with whom we place certain accounts.
Court Costs, Net
Court costs represent court costs and related fees on accounts placed for legal action. Court costs are expensed as incurred and are reduced by court cost recoveries for purchased debt accounted for under the cost recovery method. Court cost recoveries for purchased debt accounted for under the level yield method are included in level yield proceeds which drive purchased debt revenue, net. We estimate that we recover in excess of one-third of all court costs expended.
Costs to Collect
We refer to the costs related to the collection of purchased debt as our "costs to collect" which includes purchased debt expense and gross court costs. We evaluate our costs to collect, both including and excluding court costs, in relation to total collections rather than revenue due to the timing differences between revenue and expense recognition under U.S. generally accepted accounting principles ("GAAP").
Salaries and Payroll Taxes
Salaries and payroll taxes include all employment-related expenses, including salaries, wages, bonuses, insurance, payroll taxes and benefits, except those associated with our call centers which are included in purchased debt expense.
General and Administrative
General and administrative expenses consist of rent, utilities, marketing, information technology, property and other miscellaneous taxes, office, travel and entertainment, accounting and payroll services, consulting fees, licenses, and general insurance.
Depreciation and Amortization
We incur depreciation related to our property and equipment. We incur amortization on the value of our internally developed proprietary collection platform, eAGLE, which is used by our call centers and branch offices.
43
Results of Operations
We have two reportable operating segments, as defined by the Financial Accounting Standards Board's ("FASB") Accounting Standards Codification ("ASC") Topic 280, Segment Reporting: Domestic and Canada.
A reporting segment's operating results are regularly reviewed by the Company's Chief Operating Decision Maker ("CODM"), our Chief Executive Officer, to make decisions about resources to be allocated to the segment and assess its performance. Consistent with how the Board of Directors, the CODM, and the leadership team review the Company's results, the following discussion and analysis is primarily around consolidated results. Segment specific information reviewed by the CODM and Company directors is discussed later in this section under the heading "Segment Performance Summary".
Year Ended December 31, 2015 Compared to Year Ended December 31, 2014
Purchasing Activity
The following table summarizes the purchasing activity for the year ended December 31, 2015 ("2015") compared to the year ended December 31, 2014 ("2014"):
Year Ended | |||||||||||||||
Purchasing Activity ($ in thousands) | December 31, | ||||||||||||||
2015 | 2014 | $ Variance | % Variance | ||||||||||||
Credit Card/Consumer Loan - Fresh(1) | |||||||||||||||
Face Value | $ | 454,697 | $ | 714,681 | $ | (259,984 | ) | (36.4 | )% | ||||||
Price | 52,093 | 101,102 | (49,009 | ) | (48.5 | )% | |||||||||
Price (%) | 11.5 | % | 14.1 | % | |||||||||||
Credit Card/Consumer Loan - Non-Fresh(1) | |||||||||||||||
Face Value | 470,871 | 284,554 | 186,317 | 65.5 | % | ||||||||||
Price | 19,989 | 14,346 | 5,643 | 39.3 | % | ||||||||||
Price (%) | 4.2 | % | 5.0 | % | |||||||||||
Other(2) | |||||||||||||||
Face Value | 211,633 | 224,625 | (12,992 | ) | (5.8 | )% | |||||||||
Price | 26,165 | 11,299 | 14,866 | 131.6 | % | ||||||||||
Price (%) | 12.4 | % | 5.0 | % | |||||||||||
Purchased Debt - Total | |||||||||||||||
Face Value | $ | 1,137,201 | $ | 1,223,860 | $ | (86,659 | ) | (7.1 | )% | ||||||
Price | 98,247 | 126,747 | (28,500 | ) | (22.5 | )% | |||||||||
Price (%) | 8.6 | % | 10.4 | % | |||||||||||
(1) Includes both Domestic and Canadian purchases.
(2) Other includes commercial, student loan, and other purchased debt assets.
Credit Card/Consumer Loan - Fresh
Credit card and consumer loan - fresh purchases were $454.7 million of face value receivables at a price of $52.1 million during 2015, compared to $714.7 million of face value receivables at a price of $101.1 million in 2014. Our average price for credit card/consumer loan - fresh purchases decreased from 14.1% to 11.5%. The decrease in overall fresh purchases is attributed to reduced supply of portfolios meeting our underwriting criteria as a result of the continued absence from the debt sales market of historically significant sellers which has increased competition for, and pricing of, fresh portfolios in the market since 2013. While general pricing of fresh portfolios remained elevated throughout 2015, the decrease in average price we paid for fresh portfolios during 2015 compared to 2014 is primarily attributed to a change in seller and portfolio mix and quality. Although our disciplined acquisitions strategy enabled us to slightly increase the estimated returns for all 2015 portfolios in aggregate as compared to 2014, as shown in the Supplemental Performance Data tables in this section, we continued to accept lower returns on certain purchases relative to 2013 and prior years before the regulatory scrutiny resulted in certain financial institutions reducing or ceasing debt sales.
44
Credit Card/Consumer Loan - Non-Fresh
Credit card and consumer loan - non-fresh purchases consist of purchases of charged-off receivables that have been worked by an external agency or other party external to the originating financial institution. Credit card and consumer loan - non-fresh purchases were $470.9 million of face value receivables at a price of $20.0 million during 2015, compared to $284.6 million of face value receivables at a price of $14.3 million during 2014, an increase of $186.3 million in face and an increase of $5.6 million in capital deployed. This increase is primarily attributable to more favorable return opportunities for capital deployment in this category as compared to fresh both domestically and in Canada. While both face and price increased respectively, the average price decreased from 5.0% to 4.2%, primarily attributed to a change in portfolio mix and quality.
Other
Other purchases consist of commercial, student loan, and other various asset classes. The capital deployed for these purchases was $26.2 million during 2015 compared to $11.3 million in 2014, an increase of $14.9 million due to increases in both commercial and student loan purchasing consistent with our diversification and return based acquisition strategies. Our average price for other purchases increased from 5.0% to 12.4% during 2015 primarily due to the product and portfolio mix purchased, with certain commercial fresh portfolios containing an increased concentration of high quality accounts. We continue to deploy capital into the other category only if the anticipated return meets or exceeds our targeted return thresholds.
Cash Proceeds on Purchased Debt
A key driver to our performance, and one of the primary metrics monitored by our management team, is cash proceeds received from our purchased debt. This measurement, and our focus on cash proceeds, is important because proceeds drive our business operations. Included in cash proceeds are non-legal collections, legal collections, the reimbursement of court costs, bankruptcy proceeds and returns of non-conforming accounts (which we refer to as recourse).
The following table summarizes the cash proceeds activity for the year ended December 31, 2015 compared to the year ended December 31, 2014:
Year Ended | |||||||||||||||
December 31, | |||||||||||||||
Cash Proceeds ($ in thousands) | 2015 | 2014 | $ Variance | % Variance | |||||||||||
Credit card/consumer loan collections | |||||||||||||||
Non-legal collections | $ | 129,918 | $ | 184,974 | $ | (55,056 | ) | (29.8 | )% | ||||||
Legal collections | 183,578 | 207,420 | (23,842 | ) | (11.5 | )% | |||||||||
Other collections(1) | 32,563 | 21,385 | 11,178 | 52.3 | % | ||||||||||
Total collections | 346,059 | 413,779 | (67,720 | ) | (16.4 | )% | |||||||||
Recourse & bankruptcy proceeds | 7,089 | 6,353 | 736 | 11.6 | % | ||||||||||
Total cash proceeds on purchased debt | $ | 353,148 | $ | 420,132 | $ | (66,984 | ) | (15.9 | )% | ||||||
(1) Other includes non-legal collections, legal collections, and court cost recoveries on commercial, student loan, and other accounts.
Credit Card/Consumer Loan Collections
Overall, our domestic consumer portfolio is aging as we have purchased less during 2014 and 2015 than in years prior. As our consumer portfolio becomes weighted more heavily towards older portfolios, legal collections increase as a percentage of total cash proceeds, which is the case in 2015.
Non-legal Collections
Credit card and consumer loan non-legal collections were $129.9 million during 2015 compared to $185.0 million during 2014, representing a decrease of $55.1 million or 29.8%. This decrease is driven primarily by lower face value of purchases in 2015 and 2014 and therefore less inventory in the non-legal channel. As a result of the aforementioned aging of our total purchased debt portfolio, credit card/consumer loan non-legal collections decreased from 44.0% of total cash proceeds on purchased debt in 2014 to 36.8% in 2015.
45
Legal Collections
Credit card and consumer loan legal collections were $183.6 million during 2015 compared to $207.4 million during 2014, representing a decrease of $23.8 million or 11.5%. Legal collections have been impacted less by the lower volume of purchases over last few years than non-legal collections due to the time lag between when portfolios are acquired versus when legal action, our strategy of last resort, is commenced. Also, as noted above, with the weighting of our domestic consumer portfolio towards older portfolios, collections in the legal channel have increased as a percentage of total cash proceeds. Credit card/consumer loan legal collections represented 52.0% and 49.4% of total cash proceeds on purchased debt in 2015 and 2014, respectively.
Other Collections
Other collections were $32.6 million during 2015 compared to $21.4 million during 2014, an increase of $11.2 million or 52.3%. The increase in other collections was primarily due to an increase in commercial collections resulting from increased commercial purchasing consistent with our diversification and return based acquisitions strategies.
Recourse and Bankruptcy Proceeds
Recourse and bankruptcy proceeds were $7.1 million during 2015 compared to $6.4 million in 2014. While total recourse and bankruptcy proceeds have remained fairly consistent in 2015, bankruptcy proceeds have increased by $3.0 million due to the expansion of our bankruptcy channel and account base, which was offset by a continued decrease in recourse due to lower purchasing volumes.
Consolidated Results
The following table summarizes the results of our operations for the year ended December 31, 2015 compared to the year ended December 31, 2014:
Year Ended | |||||||||||||||
December 31, | |||||||||||||||
Consolidated Results ($ in thousands) | 2015 | 2014 | $ Variance | % Variance | |||||||||||
Revenues | |||||||||||||||
Purchased debt revenue, net | $ | 202,611 | $ | 247,035 | $ | (44,424 | ) | (18.0 | )% | ||||||
Other revenue | 42 | 56 | (14 | ) | (25.0 | )% | |||||||||
Total revenues | 202,653 | 247,091 | (44,438 | ) | (18.0 | )% | |||||||||
Expenses | |||||||||||||||
Purchased debt expense | 114,887 | 147,813 | (32,926 | ) | (22.3 | )% | |||||||||
Court costs, net | 26,857 | 34,719 | (7,862 | ) | (22.6 | )% | |||||||||
Salaries and payroll taxes | 34,601 | 30,552 | 4,049 | 13.3 | % | ||||||||||
General and administrative | 13,654 | 14,457 | (803 | ) | (5.6 | )% | |||||||||
Depreciation and amortization | 6,753 | 6,883 | (130 | ) | (1.9 | )% | |||||||||
Impairments of goodwill and intangible assets | 84,606 | — | 84,606 | (1 | ) | ||||||||||
Total operating expenses | 281,358 | 234,424 | 46,934 | 20.0 | % | ||||||||||
Operating income | (78,705 | ) | 12,667 | (91,372 | ) | (1 | ) | ||||||||
Other expenses | |||||||||||||||
Interest expense | 44,609 | 44,217 | 392 | 0.9 | % | ||||||||||
Other expense | 338 | 440 | (102 | ) | (23.2 | )% | |||||||||
Total other expenses | 44,947 | 44,657 | 290 | 0.6 | % | ||||||||||
Loss before income taxes | (123,652 | ) | (31,990 | ) | (91,662 | ) | 286.5 | % | |||||||
Income tax benefit (expense) | 5,951 | (5,950 | ) | 11,901 | (1 | ) | |||||||||
Net loss | $ | (117,701 | ) | $ | (37,940 | ) | $ | (79,761 | ) | 210.2 | % | ||||
(1) Not meaningful
46
Purchased Debt Revenue, Net
Purchased debt revenue, net was $202.6 million during 2015 compared to $247.0 million during 2014, a decrease of $44.4 million or 18.0%. The change was predominantly due to a $47.5 million decrease in gross revenue on level yield assets as a result of a decrease in the carrying value of purchased debt driven by lower purchasing. The average carrying value of level yield purchased debt assets decreased from $230.5 million in 2014 to $176.3 million in 2015.
An increase in net valuation allowance reversals partially offset the decrease in gross revenue on level yield assets. During 2015, we recorded $6.7 million in net reversals of non-cash valuation allowances primarily related to over performance on certain 2007 - 2009 level yield pools and partially offset by non-cash valuation allowances primarily on certain cost recovery portfolios. During 2014, we recorded $1.8 million in net non-cash valuation allowances.
In addition, purchased debt royalties decreased $4.1 million primarily due to lower non-legal collections on which royalty was calculated prior to June 1, 2015 as well as the discontinuance of royalty fees effective June 1, 2015.
Purchased Debt Expense
Purchased debt expense was $114.9 million during 2015 compared to $147.8 million during 2014. Purchased debt expense decreased $32.9 million or 22.3% primarily due to a decrease of 16.4% in total collections on purchased debt. Also, effective May 1, 2015, the Company fundamentally restructured the compensation plan by lowering fees paid to our branch offices on legal collections, including those on accounts placed prior to May 2015. The lower fee structure on legal collections more than offset the otherwise negative impact on purchased debt expense of the increase in legal collections as a percentage of total cash proceeds due to the cost of collecting in the legal channel being higher than the non-legal channel. Legal collections as a percent of total cash proceeds increased to 52.0% in 2015 from 49.4% in 2014 due to the previously discussed aging of the entire purchased debt portfolio.
Court Costs, Net
Court costs, net were $26.9 million in 2015 compared to $34.7 million in 2014, a decrease of $7.9 million or 22.6% primarily due to lower volumes purchased over the past two years. Court costs are expensed as incurred; however, partial recovery of these costs occurs over many years. We estimate that we recover in excess of one-third of all court costs expended.
Costs to Collect
Costs to collect include purchased debt expense and gross court costs. We evaluate our costs to collect, both including and excluding court costs, in relation to total collections rather than revenue due to the timing differences between revenue and expense recognition for GAAP purposes. For the purpose of this metric, we use gross court costs in the numerator because court cost recoveries are included in total collections.
The following table summarizes our costs to collect and our costs to collect excluding court costs as a percentage of total collections for the years ended December 31, 2015 compared to the year ended December 31, 2014:
Year Ended | |||||||||||||||
December 31, | |||||||||||||||
Costs to Collect ($ in thousands) | 2015 | 2014 | $ Variance | % Variance | |||||||||||
Total collections | $ | 346,059 | $ | 413,779 | $ | (67,720 | ) | (16.4 | )% | ||||||
Costs to collect(1) | 142,962 | 183,755 | (40,793 | ) | (22.2 | )% | |||||||||
Costs to collect as a % of collections | 41.3 | % | 44.4 | % | |||||||||||
Costs to collect excluding court costs | 114,887 | 147,813 | (32,926 | ) | (22.3 | )% | |||||||||
Costs to collect excluding court costs as a % of collections | 33.2 | % | 35.7 | % | |||||||||||
(1) Excludes court cost recoveries of $1.2 million and $1.2 million, respectively, to arrive at gross court costs.
The decrease in costs to collect as a percentage of collections was primarily due to the lower fees paid to our branch offices with the new legal channel compensation structure effective May 1, 2015, and partially offset by a slight increase in certain fixed collection expenses as a percentage of total collections. In addition, court costs as a percentage of collections decreased primarily due to the timing of legal proceedings.
47
Salaries and Payroll Taxes
Salaries and payroll taxes were $34.6 million in 2015 compared to $30.6 million in 2014, an increase of $4.0 million or 13.3%. The increase was mostly driven by an increase in headcount and related compensation expenses primarily related to increased compliance staffing. There was a reduction in force that occurred at the beginning of the fourth quarter of 2015 that resulted in cost savings of approximately $0.8 million in salaries and related benefit expenses for the quarter and year ended December 31, 2015 offset by approximately $0.6 million in severance and related benefit expenses incurred as a result of the reduction in force.
General and Administrative Expenses
General and administrative expenses were $13.7 million in 2015 compared to $14.5 million in 2014, a decrease of $0.8 million or 5.6%. This decrease was primarily due to decreases in marketing and travel and entertainment expenses, as the Company reduced discretionary spending in light of lower collections and revenues.
Impairments of Goodwill and Intangible Assets
The Domestic segment recorded a non-cash goodwill impairment of $74.0 million and a non-cash impairment of its branch office intangible network in the amount of $10.6 million in 2015. No goodwill or intangible asset impairments were recognized in 2014.
The Company tests its indefinite-lived intangibles annually for impairment unless there is a triggering event during an interim period that would necessitate testing. We initially assessed goodwill for impairment as of September 30, 2015 due to the then projected non-compliance with the Adjusted EBITDA covenant for the fourth quarter ended December 31, 2015, as well as other factors, which represented indicators of impairment and triggered the interim test. As a result of the first step of our interim goodwill impairment test performed on both segments, we concluded that the fair value of the Domestic reporting unit did not exceed its carrying value, suggesting the $145.9 million of goodwill assigned to this reporting unit, or a portion thereof, could be impaired. However, due to the time involved in engaging a third party valuation firm and completing the step two goodwill analysis, we were unable to perform the theoretical purchase price allocation for the domestic reporting unit until we were engaged in the preparation of our annual consolidated financial statements.
As prescribed by ASC 350, step two of the impairment test requires that we perform a theoretical purchase price allocation for the Domestic reporting unit to determine the implied fair value of goodwill. If the implied fair value of goodwill, after considering the fair values of remaining assets and liabilities, is less than the recorded amount on the balance sheet, an impairment is recorded. Since goodwill represents the difference between the fair value of the reporting unit, on a debt free basis, and the fair value of its assets and liabilities, any increase in the fair value of the assets decreases the amount of goodwill implied by the fair value of the reporting unit. Similarly, any increase in the fair value of the reporting unit’s liabilities increases the amount of goodwill supported by the reporting unit. The Company's step two analysis indicates that the fair value of the Domestic reporting unit’s assets, excluding the branch office network intangible, was approximately $57.0 million higher than the carrying value, primarily due to the increase in the value of the purchased debt asset. Partially offsetting this is an increase of approximately $24.6 million in the reporting unit’s liabilities primarily attributable to the deferred tax impact associated with the increase in the fair value of the assets. As a result of the completed analysis, a non-cash goodwill impairment charge of $74.0 million and a non-cash impairment charge of $10.6 million, before a tax benefit of $4.0 million, related to the branch office intangible, were recorded in the fourth quarter of 2015. These impairment charges represent a substantial impairment of goodwill and the branch office intangible, respectively, and are recorded in the impairments of goodwill and intangible assets line item on the consolidated statements of operations.
As part of the step two goodwill assessment, the Company also determined the fair value of the branch office network using the replacement cost method. As part of this methodology, management made a number of assumptions regarding both internal and external resources that would be required to recreate the network, including but not limited to, recruitment and on-boarding of partners, development of the technology and compliance framework, excluding the cost of the eAGLE system which was valued separately, based on which the network operates and currently provides the Closed Loop competitive advantage. The branch office network was originally valued in 2005 at the date of the Acquisition. The 2005 valuation was performed before the rationalization of the Company’s legal network to meet the evolving regulatory environment. This has involved the elimination of multiple legal offices as the Company regionalized its legal efforts, providing increased regulatory oversight and control.
48
Income Tax Expense
For the year ended December 31, 2015, the combined state, federal and Canadian tax benefit from operations was $6.0 million, compared to tax expense of $6.0 million for the same period in 2014. The $12.0 million change was primarily attributable to a $9.3 million benefit related to the branch office intangible asset. This was comprised of a $4.0 million reduction to the deferred tax liability as a result of the branch office intangible impairment and a $5.3 million release of the valuation as a result of the change from indefinite life to definite life classification. Also included is a $1.4 million decrease in withholding tax recognized under IRC Section 956 attributable to foreign earnings, $0.5 million decrease in income tax from operations in Canada, and a $0.7 million benefit in the U.S. related to a refund of previously paid taxes from the State of Colorado. The decrease in withholding tax on the amount of foreign earnings deemed distributed under IRC Section 956 is due to the 2014 expense including an amount on all previously accumulated but undistributed earnings and profits in Canada whereas the 2015 expense only relates to amounts attributable to 2015 earnings.
Any tax benefits related to pretax losses generated by the Company’s ongoing U.S. operations during 2015 have been fully offset by a corresponding increase in the valuation allowance as the Company remains in full valuation allowance position at December 31, 2015.
Adjusted EBITDA
Adjusted EBITDA is calculated as income before interest, taxes, depreciation and amortization (including amortization of the carrying value on our purchased debt), as adjusted by several items. Adjusted EBITDA generally represents cash proceeds on our owned charged-off receivables plus the contributions of our other business activities less operating expenses (other than non-cash expenses, such as depreciation and amortization) as adjusted. Adjusted EBITDA, which is a non-GAAP financial measure, should not be considered an alternative to, or more meaningful than, net income prepared on a GAAP basis. We present Adjusted EBITDA because we consider it to be an important supplemental measure of our performance. We believe Adjusted EBITDA is representative of our cash flow generation that can be used to purchase charged-off receivables, pay down or service debt, pay income taxes, and for other uses. We believe that Adjusted EBITDA is frequently used by investors and other interested parties in the evaluation of companies in our industry. In addition, the instruments governing our indebtedness use Adjusted EBITDA to measure our compliance with certain covenants and, in certain circumstances, our ability to make certain borrowings.
The following table summarizes our Adjusted EBITDA for the year ended December 31, 2015 compared to the year ended December 31, 2014:
Year Ended | |||||||||||||||
December 31, | |||||||||||||||
Adjusted EBITDA ($ in thousands) | 2015 | 2014 | $ Variance | % Variance | |||||||||||
Non-legal collections | $ | 129,918 | $ | 184,974 | $ | (55,056 | ) | (29.8 | )% | ||||||
Legal collections | 183,578 | 207,420 | (23,842 | ) | (11.5 | )% | |||||||||
Other collections(1) | 32,563 | 21,385 | 11,178 | 52.3 | % | ||||||||||
Recourse & bankruptcy proceeds | 7,089 | 6,353 | 736 | 11.6 | % | ||||||||||
Contribution of other business activities(2) | 1,682 | 5,818 | (4,136 | ) | (71.1 | )% | |||||||||
Total inflows | 354,830 | 425,950 | (71,120 | ) | (16.7 | )% | |||||||||
Purchased debt expense | 114,887 | 147,813 | (32,926 | ) | (22.3 | )% | |||||||||
Court costs, net | 26,857 | 34,719 | (7,862 | ) | (22.6 | )% | |||||||||
Salaries, general and administrative expenses | 48,255 | 45,009 | 3,246 | 7.2 | % | ||||||||||
Other(3) | 1,891 | 1,983 | (92 | ) | (4.6 | )% | |||||||||
Total outflows | 191,890 | 229,524 | (37,634 | ) | (16.4 | )% | |||||||||
Adjustments(4) | 3,034 | 1,287 | 1,747 | 135.7 | % | ||||||||||
Adjusted EBITDA | $ | 165,974 | $ | 197,713 | $ | (31,739 | ) | (16.1 | )% | ||||||
(1) Other includes non-legal collections, legal collections, and court cost recoveries on commercial, student loan, and other accounts.
(2) Includes royalties on purchased debt (discontinued as of June 1, 2015) and other revenue.
(3) Represents certain other items consistent with our debt covenant calculation.
49
(4) Consistent with the covenant calculations within our revolving credit facility, adjustments include, as applicable, the non-cash expense related to option grants of Parent’s equity granted to our employees, directors and branch office owners, branch office note reserve, lease breakup costs, certain consulting fees, management fees paid to KRG Capital Management, L.P., certain transaction expenses, recruiting expense, severance expense, and certain non-recurring items.
The table above represents cash generated by collecting debt and other business activities, less operating and other cash expenses, resulting in Adjusted EBITDA. The table below reconciles net income to EBITDA and adjusts for certain purchasing items and other non-cash items to reconcile to Adjusted EBITDA for the year ended December 31, 2015 compared to the year ended December 31, 2014:
Year Ended | |||||||||||||||
Reconciliation of Net Loss to Adjusted EBITDA ($ in thousands) | December 31, | ||||||||||||||
2015 | 2014 | $ Variance | % Variance | ||||||||||||
Net loss | $ | (117,701 | ) | $ | (37,940 | ) | $ | (79,761 | ) | (210.2 | )% | ||||
Interest expense | 44,609 | 44,217 | 392 | 0.9 | % | ||||||||||
Interest income | (157 | ) | (163 | ) | 6 | 3.7 | % | ||||||||
Income tax (benefit) expense | (5,951 | ) | 5,950 | (11,901 | ) | (5 | ) | ||||||||
Depreciation and amortization | 6,753 | 6,883 | (130 | ) | (1.9 | )% | |||||||||
Impairments of goodwill and intangible assets | 84,606 | — | 84,606 | (5 | ) | ||||||||||
EBITDA | 12,159 | 18,947 | (6,788 | ) | (35.8 | )% | |||||||||
Adjustments related to purchased debt accounting | |||||||||||||||
Proceeds applied to purchased debt principal(1) | 157,500 | 175,695 | (18,195 | ) | (10.4 | )% | |||||||||
Purchased debt valuation allowance (reversals) charges(2) | (6,719 | ) | 1,784 | (8,503 | ) | (5 | ) | ||||||||
Certain other or non-cash expenses | |||||||||||||||
Stock option expense(3) | 34 | 79 | (45 | ) | (57.0 | )% | |||||||||
Other(4) | 3,000 | 1,208 | 1,792 | 148.3 | % | ||||||||||
Adjusted EBITDA | $ | 165,974 | $ | 197,713 | $ | (31,739 | ) | (16.1 | )% | ||||||
(1) Cash proceeds applied to purchased debt principal rather than recorded as revenue.
(2) Represents non-cash valuation allowance charges (reversals) on purchased debt.
(3) Represents the non-cash expense related to option grants of Parent’s equity granted to certain employees, directors and branch office owners.
(4) Consistent with the covenant calculations within our revolving credit facility, other includes, as applicable, branch office note reserves, lease breakup costs, certain consulting fees, management fees paid to KRG Capital Management, L.P., certain transaction expenses, recruiting expense, severance expense, and certain non-recurring items.
(5) Not meaningful.
The table below reconciles net cash flows from operations to Adjusted EBITDA for the year ended December 31, 2015 compared to the year ended December 31, 2014:
Year Ended | |||||||||||||||
Reconciliation of Net Cash Used in Operating Activities to Adjusted EBITDA ($ in thousands) | December 31, | ||||||||||||||
2015 | 2014 | $ Variance | % Variance | ||||||||||||
Net cash used in operating activities | $ | (39,684 | ) | $ | (26,703 | ) | $ | (12,981 | ) | (48.6 | )% | ||||
Proceeds applied to purchased debt principal(1) | 157,500 | 175,695 | (18,195 | ) | (10.4 | )% | |||||||||
Interest expense to be paid in cash(2) | 41,306 | 41,220 | 86 | 0.2 | % | ||||||||||
Interest income | (157 | ) | (163 | ) | 6 | 3.7 | % | ||||||||
Amortization of prepaid and other non-cash expenses | (6,032 | ) | (4,532 | ) | (1,500 | ) | (33.1 | )% | |||||||
Changes in operating assets and liabilities and deferred taxes: | |||||||||||||||
Restricted cash(3) | (1,210 | ) | (2,347 | ) | 1,137 | 48.4 | % | ||||||||
Other operating assets and liabilities and deferred taxes(4) | 17,202 | 7,385 | 9,817 | 132.9 | % | ||||||||||
Income tax (benefit) expense | (5,951 | ) | 5,950 | (11,901 | ) | (6 | ) | ||||||||
Other(5) | 3,000 | 1,208 | 1,792 | 148.3 | % | ||||||||||
Adjusted EBITDA | $ | 165,974 | $ | 197,713 | $ | (31,739 | ) | (16.1 | )% | ||||||
50
(1) Cash proceeds applied to purchased debt principal are shown in the investing activities section of the consolidated statements of cash flows.
(2) Represents interest expense, excluding non-cash amortization of loan origination fees and debt discount.
(3) Represents the change in restricted cash balances for the period due to the timing of payments on our line of credit and semi-annual interest payments on our Senior Second Lien Notes.
(4) The amount represents timing differences due to the recognition of certain expenses and revenue items on a cash versus accrual basis.
(5) Consistent with the covenant calculations within our revolving credit facility, other includes, as applicable, branch office note reserves, lease breakup costs, certain consulting fees, management fees paid to KRG Capital Management, L.P., certain transaction expenses, recruiting expense, severance expense, and certain non-recurring items.
(6) Not meaningful.
Year Ended December 31, 2014 Compared to Year Ended December 31, 2013
Purchasing Activity
The following table summarizes the purchasing activity for the year ended December 31, 2014 ("2014") compared to the year ended December 31, 2013 ("2013"):
Year Ended | |||||||||||||||
Purchasing Activity ($ in thousands) | December 31, | ||||||||||||||
2014 | 2013 | $ Variance | % Variance | ||||||||||||
Credit Card/Consumer Loan - Fresh(1) | |||||||||||||||
Face Value | $ | 714,681 | $ | 1,572,612 | $ | (857,931 | ) | (54.6 | )% | ||||||
Price | 101,102 | 197,420 | (96,318 | ) | (48.8 | )% | |||||||||
Price (%) | 14.1 | % | 12.6 | % | |||||||||||
Credit Card/Consumer Loan - Non-Fresh(1) | |||||||||||||||
Face Value | 284,554 | 800,694 | (516,140 | ) | (64.5 | )% | |||||||||
Price | 14,346 | 40,912 | (26,566 | ) | (64.9 | )% | |||||||||
Price (%) | 5.0 | % | 5.1 | % | |||||||||||
Other(2) | |||||||||||||||
Face Value | 224,625 | 450,368 | (225,743 | ) | (50.1 | )% | |||||||||
Price | 11,299 | 19,778 | (8,479 | ) | (42.9 | )% | |||||||||
Price (%) | 5.0 | % | 4.4 | % | |||||||||||
Purchased Debt - Total | |||||||||||||||
Face Value | $ | 1,223,860 | $ | 2,823,674 | $ | (1,599,814 | ) | (56.7 | )% | ||||||
Price | 126,747 | 258,110 | (131,363 | ) | (50.9 | )% | |||||||||
Price (%) | 10.4 | % | 9.1 | % | |||||||||||
(1) Includes both Domestic and Canadian purchases.
(2) Other includes commercial, student loan, and other purchased debt assets.
Credit Card/Consumer Loan - Fresh
Credit card and consumer loan - fresh purchases were $0.7 billion of face value receivables at a price of $101.1 million during 2014, compared to $1.6 billion of face value receivables at a price of $197.4 million in 2013. Our average price for credit card/consumer loan - fresh purchases increased from 12.6% to 14.1%. The decrease in purchasing and the increase in price are primarily due to a decreased supply from certain financial institutions, which we attribute to their anticipation and implementation of expected rules to be promulgated by the CFPB. Anticipated regulations were the key focus of the industry as a whole, and in particular a few large sellers remained absent from the debt sales market while they focused on reviewing internal compliance activities as well as the compliance capabilities of their select group of approved buyers.
While we maintained a disciplined acquisitions strategy, we did accept lower returns on certain purchases relative to prior years. Refer to the Supplemental Performance Data for further information regarding purchases made during 2014.
51
Credit Card/Consumer Loan - Non-Fresh
Credit card and consumer loan - non-fresh purchases consist of purchases of charged-off receivables that have been worked by an external agency or other party external to the originating financial institution. Credit card and consumer loan - non-fresh purchases were $284.6 million of face value receivables at a price of $14.3 million during 2014, compared to $800.7 million of face value receivables at a price of $40.9 million during 2013. The decrease was due to a reduction in the supply of charged-off receivables in the U.S. similar to credit card/consumer loan - fresh.
Other
Other purchases consist of commercial, student loan, and other various asset classes. Other purchases were $224.6 million in face value at a price of $11.3 million during 2014, compared to $450.4 million in face value at a price of $19.8 million in 2013, representing a decrease of 50.1% in face value and a decrease of 42.9% in capital deployed. These decreases were primarily driven by a decrease in face value and capital deployed for student loan purchases. We deploy capital into the other category as part of our diversification strategy and only if the anticipated return meets or exceeds our targeted return thresholds.
Cash Proceeds on Purchased Debt
The following table summarizes the cash proceeds activity for the year ended December 31, 2014 compared to the year ended December 31, 2013:
Year Ended | |||||||||||||||
December 31, | |||||||||||||||
Cash Proceeds ($ in thousands) | 2014 | 2013 | $ Variance | % Variance | |||||||||||
Credit card/consumer loan collections | |||||||||||||||
Non-legal collections | $ | 184,974 | $ | 306,222 | $ | (121,248 | ) | (39.6 | )% | ||||||
Legal collections | 207,420 | 212,529 | (5,109 | ) | (2.4 | )% | |||||||||
Other collections(1) | 21,385 | 23,198 | (1,813 | ) | (7.8 | )% | |||||||||
Total collections | 413,779 | 541,949 | (128,170 | ) | (23.6 | )% | |||||||||
Sales, recourse & bankruptcy proceeds | 6,353 | 21,760 | (15,407 | ) | (70.8 | )% | |||||||||
Total cash proceeds on purchased debt | $ | 420,132 | $ | 563,709 | $ | (143,577 | ) | (25.5 | )% | ||||||
(1) Other includes non-legal collections, legal collections, and court cost recoveries on commercial, student loan, and other accounts.
Credit Card/Consumer Loan Collections
Non-legal Collections
Credit card and consumer loan non-legal collections were $185.0 million during 2014 compared to $306.2 million during 2013, representing a decrease of $121.2 million or 39.6%. This decrease is driven primarily by lower face value of purchases in 2013 and 2014 and therefore less inventory in the non-legal channel. Credit card/consumer loan non-legal collections represented 44.0% and 54.3% of total cash proceeds on purchased debt in 2014 and 2013, respectively.
Legal Collections
Credit card and consumer loan legal collections were $207.4 million during 2014 compared to $212.5 million during 2013, representing a decrease of $5.1 million or 2.4%. Legal collections were largely unaffected by the lower purchases in 2013 and 2014 due to the time lag between when portfolios are acquired versus when legal action, our strategy of last resort, is commenced. Credit card/consumer loan legal collections represented 49.4% and 37.7% of total cash proceeds on purchased debt in 2014 and 2013, respectively.
52
Other Collections
Other collections were $21.4 million during 2014 compared to $23.2 million during 2013, a decrease of $1.8 million or 7.8%. The decrease in other collections was primarily a result of decreases in student loan and medical collections. The decrease in student loan collections is due to a reduction in student loan purchasing since 2013. Also, the Company is no longer pursuing purchases of medical accounts and has not purchased any medical portfolios since the first quarter of 2013.
Recourse and Bankruptcy Proceeds
Recourse and bankruptcy proceeds were $6.4 million during 2014 compared to sales and recourse proceeds of $21.8 million in 2013. Historically, based on operational considerations, market pricing, or capacity constraints within our branch offices, we resold certain purchased debt accounts at various stages of their collection cycle. Since 2013, account sales have no longer been part of our core liquidation strategy.
Consolidated Results
The following table summarizes the results of our operations for the year ended December 31, 2014 compared to the year ended December 31, 2013:
Year Ended | |||||||||||||||
December 31, | |||||||||||||||
Consolidated Results ($ in thousands) | 2014 | 2013 | $ Variance | % Variance | |||||||||||
Revenues | |||||||||||||||
Purchased debt revenue, net | $ | 247,035 | $ | 337,578 | $ | (90,543 | ) | (26.8 | )% | ||||||
Other revenue | 56 | 675 | (619 | ) | (91.7 | )% | |||||||||
Total revenues | 247,091 | 338,253 | (91,162 | ) | (27.0 | )% | |||||||||
Expenses | |||||||||||||||
Purchased debt expense | 147,813 | 189,184 | (41,371 | ) | (21.9 | )% | |||||||||
Court costs, net | 34,719 | 40,155 | (5,436 | ) | (13.5 | )% | |||||||||
Salaries and payroll taxes | 30,552 | 26,348 | 4,204 | 16.0 | % | ||||||||||
General and administrative | 14,457 | 14,418 | 39 | 0.3 | % | ||||||||||
Depreciation and amortization | 6,883 | 7,986 | (1,103 | ) | (13.8 | )% | |||||||||
Total operating expenses | 234,424 | 278,091 | (43,667 | ) | (15.7 | )% | |||||||||
Operating income | 12,667 | 60,162 | (47,495 | ) | (78.9 | )% | |||||||||
Other expenses | |||||||||||||||
Interest expense | 44,217 | 45,984 | (1,767 | ) | (3.8 | )% | |||||||||
Other expense | 440 | 3,872 | (3,432 | ) | (88.6 | )% | |||||||||
Total other expenses | 44,657 | 49,856 | (5,199 | ) | (10.4 | )% | |||||||||
(Loss) income before income taxes | (31,990 | ) | 10,306 | (42,296 | ) | (1) | |||||||||
Income tax expense | (5,950 | ) | (5,243 | ) | (707 | ) | (13.5 | )% | |||||||
Net (loss) income | $ | (37,940 | ) | $ | 5,063 | $ | (43,003 | ) | (1) | ||||||
(1) Not meaningful.
Purchased Debt Revenue, Net
Purchased debt revenue, net was $247.0 million during 2014 compared to $337.6 million during 2013, a decrease of $90.5 million or 26.8%. The change was predominantly driven by a $69.3 million decrease in gross revenue on level yield assets. Increased purchase prices led to lower return expectations on certain 2013 and 2014 purchases, which resulted in a decrease in the weighted average internal rate of return ("IRR"). Furthermore, the average carrying value of level yield purchased debt assets decreased from $242.6 million to $230.5 million. Gross revenue on cost recovery assets decreased $8.2 million which was in line with the decrease in cost recovery proceeds due to an older base of existing non-commercial assets accounted for under the cost recovery method of accounting.
53
Also contributing to the decrease in purchased debt revenue, net was the change in the valuation allowance. During 2014 we recorded $1.8 million in net non-cash valuation allowances primarily related to certain of our older cost recovery portfolios compared to $6.6 million in net reversals in 2013 primarily related to over performance on 2007 and 2008 level yield pools relative to previously reduced expected proceeds.
In addition, purchased debt royalties decreased $4.7 million, or 44.8%, which was a direct result of a 42.2% decrease in domestic non-legal collections.
Purchased Debt Expense
Purchased debt expense was $147.8 million during 2014 compared to $189.2 million during 2013. Purchased debt expense decreased 21.9%, which was primarily attributable to a decrease of 23.6% in total collections on purchased debt. In addition, this line item included $4.9 million of expense in 2013 related to the termination of five branch office relationships and license agreements. Partially offsetting these decreases was an increase in expense associated with the launch of our U.S. consumer call center in the fourth quarter of 2014.
Court Costs, Net
Court costs, net were $34.7 million in 2014 compared to $40.2 million in 2013. Court costs are expensed as incurred; however, partial recovery of these costs occurs over many years. We estimate that we recover in excess of one-third of all court costs expended. The decrease in court costs, net was due to lower lawsuit volumes in 2014 compared to 2013.
Costs to Collect
The following table summarizes our costs to collect and our costs to collect excluding court costs as a percentage of total collections for the year ended December 31, 2014 compared to the year ended December 31, 2013:
Year Ended | |||||||||||||||
December 31, | |||||||||||||||
Costs to Collect ($ in thousands) | 2014 | 2013 | $ Variance | % Variance | |||||||||||
Total collections | $ | 413,779 | $ | 541,949 | $ | (128,170 | ) | (23.6 | )% | ||||||
Costs to collect(1)(2) | 183,755 | 225,818 | (42,063 | ) | (18.6 | )% | |||||||||
Costs to collect as a % of collections | 44.4 | % | 41.7 | % | |||||||||||
Costs to collect excluding court costs(2) | 147,813 | 184,284 | (36,471 | ) | (19.8 | )% | |||||||||
Costs to collect excluding court costs as a % of collections | 35.7 | % | 34.0 | % | |||||||||||
(1) Excludes court cost recoveries of $1.2 million and $1.4 million, respectively, to arrive at gross court costs.
(2) Excludes termination fees of $4.9 million in 2013.
The increase in costs to collect as a percentage of collections was partially due to the mix of legal collections as a percentage of total collections having increased from 39.2% in 2013 to 50.1% in 2014 as well as an increase in court costs as a percentage of collections. In addition, the increase is partially due to an increase in expense associated with the launch of our U.S. consumer call center in the fourth quarter of 2014.
Salaries and Payroll Taxes
Salaries and payroll taxes were $30.6 million in 2014, compared to $26.3 million in 2013. The increase was primarily driven by an increase in headcount as well as increased salaries and incentive compensation.
Depreciation and Amortization
Depreciation and amortization was $6.9 million in 2014, compared to $8.0 million in 2013. The decrease primarily related to an increase in the useful life of our proprietary collection system, eAGLE.
54
Interest Expense
Interest expense was $44.2 million in 2014, compared to $46.0 million in 2013. The decrease was primarily due to lower outstanding balances on the revolving credit facility in 2014 compared to 2013 as well as lower applicable interest rates effective April 30, 2013.
Other Expense
Other expense was $0.4 million in 2014, compared to $3.9 million in 2013. Other expense recognized in 2013 primarily consisted of charges related to the harmonized sales tax ("HST") assessment in Canada. In addition, in 2013 we prepaid and satisfied all future obligations under a residual interest arrangement with a former lender for $1.2 million which is included in other expense.
Income Tax Expense
For the year ended December 31, 2014, the combined state, federal and Canadian tax expense from operations was $6.0 million, compared to $5.2 million for the same period in 2013. Tax expense in 2014 was comprised of foreign taxes on Canadian operations based on an effective tax rate of approximately 26.5%, U.S. state income tax expense of $0.5 million, and $1.5 million deferred expense related to Canadian withholding tax recognized in connection with Internal Revenue Code (“IRC”) Section 956 income from Canadian operations. Any tax benefits related to pretax losses generated by the Company’s ongoing U.S. operations during 2014 have been fully offset by a corresponding increase in the valuation allowance as the Company remains in full valuation allowance position at December 31, 2014.
Under IRC Section 956, the pledge of Canadian assets, resulting from Amendment No. 5 to the revolving credit agreement, generates taxable income in the U.S. equal to the lesser of the outstanding amount of borrowings being guaranteed or the accumulated undistributed earnings and profits (“E&P”) of the Canadian entities that have pledged assets. In accordance with accounting for income taxes, the Company had previously asserted to permanently reinvest its Canadian E&P up through the year ended December 31, 2012, and accordingly, it has not accounted for those earnings as part of its provision for income taxes at December 31, 2013 or before. As a result of the foreign pledge of assets during the quarter ended June 30, 2014, the Company no longer asserts the permanent reinvestment criteria with respect to its Canadian earnings. While virtually all of the IRC Section 956 income generated in the U.S. during 2014 can be offset by the Company’s net operating losses in the U.S., the $1.5 million expense relates specifically to withholding taxes on the amount of the deemed distribution under IRC Section 956, which would be payable in Canada upon an actual distribution in the future. Therefore, to the extent the amount of Canadian E&P deemed distributed is not actually repatriated to the U.S., the withholding tax will not be paid.
55
Adjusted EBITDA
The following table summarizes our Adjusted EBITDA for the year ended December 31, 2014 compared to the year ended December 31, 2013:
Year Ended | |||||||||||||||
December 31, | |||||||||||||||
Adjusted EBITDA | 2014 | 2013 | $ Variance | % Variance | |||||||||||
Non-legal collections | $ | 184,974 | $ | 306,222 | $ | (121,248 | ) | (39.6 | )% | ||||||
Legal collections | 207,420 | 212,529 | (5,109 | ) | (2.4 | )% | |||||||||
Other collections(1) | 21,385 | 23,198 | (1,813 | ) | (7.8 | )% | |||||||||
Sales, recourse & bankruptcy proceeds | 6,353 | 21,760 | (15,407 | ) | (70.8 | )% | |||||||||
Contribution of other business activities(2) | 5,818 | 11,108 | (5,290 | ) | (47.6 | )% | |||||||||
Total inflows | 425,950 | 574,817 | (148,867 | ) | (25.9 | )% | |||||||||
Purchased debt expense | 147,813 | 189,184 | (41,371 | ) | (21.9 | )% | |||||||||
Court costs, net | 34,719 | 40,155 | (5,436 | ) | (13.5 | )% | |||||||||
Salaries, general and administrative expenses | 45,009 | 40,766 | 4,243 | 10.4 | % | ||||||||||
Other(3) | 1,983 | 4,360 | (2,377 | ) | (54.5 | )% | |||||||||
Total outflows | 229,524 | 274,465 | (44,941 | ) | (16.4 | )% | |||||||||
Adjustments(4) | 1,287 | 8,028 | (6,741 | ) | (84.0 | )% | |||||||||
Adjusted EBITDA | $ | 197,713 | $ | 308,380 | $ | (110,667 | ) | (35.9 | )% | ||||||
(1) Other includes non-legal collections, legal collections, and court cost recoveries on commercial, student loan, medical, and other accounts.
(2) Includes royalties on purchased debt and other revenue.
(3) Represents certain other items consistent with our debt covenant calculation.
(4) Consistent with the covenant calculations within our revolving credit facility, adjustments include, as applicable, the non-cash expense related to option grants of Parent’s equity granted to our employees, directors and branch office owners, branch office note reserves, lease breakup costs, certain consulting fees, management fees paid to KRG Capital Management, L.P., certain transaction expenses, recruiting expense, severance expense, and certain non-recurring items. The decrease in Adjustments in 2014 compared to 2013 is primarily attributable to termination fees related to separation agreements with certain of our branch offices, the HST assessment in Canada, and satisfaction of a residual interest arrangement with a former lender during 2013, all discussed in the Results of Operations section herein.
The table above represents cash generated by collecting debt, selling debt and other business activities, less operating and other cash expenses, resulting in Adjusted EBITDA. The table below reconciles net income to EBITDA and adjusts for certain purchasing items and other non-cash items to reconcile to Adjusted EBITDA for the year ended December 31, 2014 compared to the year ended December 31, 2013:
56
Year Ended | |||||||||||||||
Reconciliation of Net (Loss) Income to Adjusted EBITDA | December 31, | ||||||||||||||
2014 | 2013 | $ Variance | % Variance | ||||||||||||
Net (loss) income | $ | (37,940 | ) | $ | 5,063 | $ | (43,003 | ) | (6) | ||||||
Interest expense | 44,217 | 45,984 | (1,767 | ) | (3.8 | )% | |||||||||
Interest income | (163 | ) | (103 | ) | (60 | ) | (58.3 | )% | |||||||
Income tax expense | 5,950 | 5,243 | 707 | 13.5 | % | ||||||||||
Depreciation and amortization | 6,883 | 7,986 | (1,103 | ) | (13.8 | )% | |||||||||
EBITDA | 18,947 | 64,173 | (45,226 | ) | (70.5 | )% | |||||||||
Adjustments related to purchased debt accounting | |||||||||||||||
Proceeds applied to purchased debt principal(1) | 175,695 | 241,561 | (65,866 | ) | (27.3 | )% | |||||||||
Amortization of step-up of carrying value(2) | — | 107 | (107 | ) | (6) | ||||||||||
Purchased debt valuation allowance charges (reversals)(3) | 1,784 | (6,648 | ) | 8,432 | (6) | ||||||||||
Certain other or non-cash expenses | |||||||||||||||
Stock option expense(4) | 79 | 128 | (49 | ) | (38.3 | )% | |||||||||
Termination fees | — | 4,900 | (4,900 | ) | (6) | ||||||||||
Other(5) | 1,208 | 4,159 | (2,951 | ) | (71.0 | )% | |||||||||
Adjusted EBITDA | $ | 197,713 | $ | 308,380 | $ | (110,667 | ) | (35.9 | )% | ||||||
(1) Cash proceeds applied to purchased debt principal rather than recorded as revenue.
(2) Non-cash amortization of a step-up in the carrying value of certain purchased debt assets related to purchase accounting adjustments resulting from the 2005 acquisition of the Company by Parent.
(3) Represents non-cash valuation allowance charges (reversals) on purchased debt.
(4) Represents the non-cash expense related to option grants of Parent’s equity granted to certain employees, directors and branch office owners.
(5) Consistent with the covenant calculations within our revolving credit facility, other includes, as applicable, branch office note reserves, lease breakup costs, certain consulting fees, management fees paid to KRG Capital Management, L.P., certain transaction expenses, recruiting expense, severance expense, and certain non-recurring items. The decrease in Other in 2014 compared to 2013 is primarily attributable to the HST assessment in Canada and satisfaction of a residual interest arrangement with a former lender during 2013, both discussed in the Results of Operations section herein.
(6) Not meaningful.
The table below reconciles net cash (used in) provided by operating activities to Adjusted EBITDA for the year ended December 31, 2014 compared to the year ended December 31, 2013:
Year Ended | |||||||||||||||
Reconciliation of Net Cash (Used in) Provided by Operating Activities to Adjusted EBITDA | December 31, | ||||||||||||||
2014 | 2013 | $ Variance | % Variance | ||||||||||||
Net cash (used in) provided by operating activities | $ | (26,703 | ) | $ | 15,045 | $ | (41,748 | ) | (6) | ||||||
Proceeds applied to purchased debt principal(1) | 175,695 | 241,561 | (65,866 | ) | (27.3 | )% | |||||||||
Interest expense to be paid in cash(2) | 41,220 | 42,782 | (1,562 | ) | (3.7 | )% | |||||||||
Interest income | (163 | ) | (103 | ) | (60 | ) | (58.3 | )% | |||||||
Amortization of prepaid and other non-cash expenses | (4,532 | ) | (4,658 | ) | 126 | 2.7 | % | ||||||||
Changes in operating assets and liabilities and deferred taxes: | |||||||||||||||
Restricted cash(3) | (2,347 | ) | (4,899 | ) | 2,552 | 52.1 | % | ||||||||
Other operating assets and liabilities and deferred taxes(4) | 7,385 | 4,350 | 3,035 | 69.8 | % | ||||||||||
Income tax expense | 5,950 | 5,243 | 707 | 13.5 | % | ||||||||||
Termination fees | — | 4,900 | (4,900 | ) | (6) | ||||||||||
Other(5) | 1,208 | 4,159 | (2,951 | ) | (71.0 | )% | |||||||||
Adjusted EBITDA | $ | 197,713 | $ | 308,380 | $ | (110,667 | ) | (35.9 | )% | ||||||
(1) Cash proceeds applied to purchased debt principal are shown in the investing activities section of the consolidated statements of cash flows.
57
(2) Represents interest expense, excluding non-cash amortization of loan origination fees and debt discount.
(3) Represents the change in restricted cash balances for the period due to the timing of payments on our line of credit and semi-annual interest payments on our Senior Second Lien Notes.
(4) The amount represents timing differences due to the recognition of certain expenses and revenue items on a cash versus accrual basis.
(5) Consistent with the covenant calculations within our revolving credit facility, other includes, as applicable, branch office note reserves, lease breakup costs, certain consulting fees, management fees paid to KRG Capital Management, L.P., certain transaction expenses, recruiting expense, severance expense, and certain non-recurring items. The decrease in Other in 2014 compared to 2013 is primarily attributable to the HST assessment in Canada and satisfaction of a residual interest arrangement with a former lender during 2013, both discussed in the Results of Operations section herein.
(6) Not meaningful.
Segment Performance Summary
We have two reportable segments in accordance with the GAAP criteria for segment reporting: Domestic and Canada. A reporting segment's operating results are regularly reviewed by the CODM to make decisions about resources to be allocated to the segment and assess its performance. The segment operating results discussed in this section are presented on a basis consistent with our current management reporting being reviewed by our Board of Directors and the CODM.
Domestic Performance Summary
The following table presents selected financial data for our Domestic operating segment for the periods presented:
Year Ended | ||||||||||||||||||
Domestic Segment Performance Summary | December 31, | Percent Change | ||||||||||||||||
($ in thousands) | 2015 | 2014 | 2013 | 2015 vs. 2014 | 2014 vs. 2013 | |||||||||||||
Purchases - face | $ | 721,560 | $ | 917,885 | $ | 2,607,405 | (21.4 | )% | (64.8 | )% | ||||||||
Purchases - price | 76,835 | 105,532 | 240,595 | (27.2 | )% | (56.1 | )% | |||||||||||
Purchases - price (%) | 10.6 | % | 11.5 | % | 9.2 | % | ||||||||||||
Cash proceeds on purchased debt | 310,338 | 376,563 | 515,696 | (17.6 | )% | (27.0 | )% | |||||||||||
Total revenues | 174,312 | 220,141 | 309,570 | (20.8 | )% | (28.9 | )% | |||||||||||
Impairments of goodwill and intangible assets | 84,606 | — | — | (2 | ) | — | % | |||||||||||
Adjusted EBITDA(1) | 134,715 | 166,281 | 273,475 | (19.0 | )% | (39.2 | )% | |||||||||||
(1) Segment Adjusted EBITDA is calculated consistently with the methodology used to report the Company's consolidated Adjusted EBITDA, except with regard to the costs of certain overhead items that may benefit both operating segments. The costs of these overhead items are included in the calculation of Domestic Adjusted EBITDA, but have not been allocated to Canada. This treatment of certain overhead costs is consistent with CODM review.
(2) Not meaningful
Purchases
Fiscal year 2015 compared with fiscal year 2014
Total domestic purchases decreased $196.3 million or 21.4% in face value and $28.7 million or 27.2% in capital deployed. Credit card/consumer loan - fresh debt purchases decreased $265.9 million in face value and $49.3 million in capital deployed due to the reduced supply of portfolios meeting our underwriting criteria as a result of the continued absence from the debt sales market of historically significant sellers which has increased competition for, and pricing of, fresh portfolios in the market since 2013. Credit card/consumer loan - non-fresh debt purchases increased $82.6 million in face value and $5.7 million in capital deployed which is primarily attributable to more opportunities for capital deployment in this category than in the prior year. Purchases of student loan and commercial accounts decreased a combined $2.5 million in face value but increased by $15.3 million in capital deployed. The increase in both commercial and student loan purchasing is consistent with our diversification and return based acquisition strategies. Average price increased in this category due to the product and portfolio mix purchased, with certain commercial fresh portfolios containing an increased concentration of high quality accounts.
58
Fiscal year 2014 compared with fiscal year 2013
Total domestic purchases decreased $1,689.5 million or 64.8% in face value and $135.1 million or 56.1% in capital deployed. Credit card/consumer loan - fresh debt purchases decreased $850.2 million in face value and $95.4 million in capital deployed. In addition, credit card/consumer loan - non-fresh debt purchases decreased $613.6 million in face value and $31.2 million in capital deployed. Purchases of student loan and commercial accounts decreased a combined $225.1 million in face value and $8.2 million in capital deployed. We generally attribute the decrease in purchasing to decreased supply from certain financial institutions resulting from their anticipation and implementation of expected rules to be promulgated by the CFPB. While the regulations continue to be better understood by the industry, thereby providing improved clarity and direction, many banks remain almost entirely focused on enhancing internal activities to ensure they have their respective processes in order before they will reenter the market.
Cash Proceeds
Fiscal year 2015 compared with fiscal year 2014
Domestic cash proceeds on purchased debt decreased $66.2 million or 17.6%. The largest driver was a $44.7 million decrease in credit card/consumer loan non-legal collections, due to lower face value of purchases in the past two years and therefore less inventory in the non-legal channel. In addition, credit card/consumer loan legal collections decreased $21.8 million. Legal collections have been impacted less by the lower volume of purchases over last few years than non-legal collections due to the time lag between when portfolios are acquired versus when legal action, our strategy of last resort, is commenced. Overall, our domestic consumer portfolio is aging as we have purchased less during 2014 and 2015 than in years prior. As our consumer portfolio becomes weighted more heavily towards older portfolios, legal collections increase as a percentage of total cash proceeds, which is the case in 2015.
Fiscal year 2014 compared with fiscal year 2013
Domestic total cash proceeds decreased $139.1 million. The largest driver was a $118.7 million decrease in credit card/consumer loan non-legal collections, due to lower face value of purchases in late 2013 and 2014 and therefore less inventory in the non-legal channel. In addition, domestic recourse and bankruptcy proceeds decreased $15.5 million due to a shift in the Company's strategy away from account resales. Since 2013, account sales have no longer been part of our core liquidation strategy.
Total Revenues
Fiscal year 2015 compared with fiscal year 2014
Total domestic revenues decreased $45.8 million or 20.8%. Gross revenue on level yield assets decreased by $51.8 million which was driven by a decrease in the carrying value of purchased debt. Partially offsetting the decrease in purchased debt revenue, net was the change in the valuation allowance. During 2015 we recorded $6.9 million in net reversals of non-cash valuation allowances primarily related to over performance on certain 2007 - 2009 level yield pools compared to $1.8 million net expense for non-cash valuation allowances in 2014.
In addition, purchased debt royalties decreased $4.1 million, or 71.5%, which was a direct result of the discontinuance of royalty fees effective June 1, 2015.
Fiscal year 2014 compared with fiscal year 2013
Total domestic revenues decreased $89.4 million or 28.9%. Gross revenue on level yield assets decreased by $72.3 million due to a decrease in the weighted average IRR. Increased purchase prices led to lower return expectations on certain 2013 and 2014 purchases, which resulted in a lower overall weighted average IRR. Gross revenue on cost recovery assets decreased $4.1 million, which was in line with the decrease in cost recovery proceeds due to an older base of existing non-commercial assets accounted for under the cost recovery method of accounting.
Also contributing to the decrease in purchased debt revenue, net was the change in the valuation allowance. During 2014 we recorded $1.8 million in non-cash valuation allowances compared to $6.6 million in net reversals of non-cash valuation allowances in 2013.
59
In addition, purchased debt royalties decreased $4.7 million, which was in line with the decrease in domestic non-legal collections.
Impairments of Goodwill and Intangible Assets
Fiscal year 2015 compared with fiscal year 2014
The Domestic segment recorded a non-cash goodwill impairment of $74.0 million and a non-cash impairment of its branch office intangible asset in the amount of $10.6 million in 2015. No goodwill or intangible asset impairments were recognized in 2014.
The Company tests its indefinite-lived intangibles annually for impairment unless there is a triggering event during an interim period that would necessitate testing. We initially assessed goodwill for impairment as of September 30, 2015 due to the then projected non-compliance with the Adjusted EBITDA covenant for the fourth quarter ended December 31, 2015, as well as other factors, which represented indicators of impairment and triggered the interim test. As a result of the first step of our interim goodwill impairment test performed on both segments, we concluded that the fair value of the Domestic reporting unit did not exceed its carrying value, suggesting the $145.9 million of goodwill assigned to this reporting unit, or a portion thereof, could be impaired. However, due to the time involved in engaging a third party valuation firm and completing the step two goodwill analysis, we were unable to perform the theoretical purchase price allocation for the domestic reporting unit until we were engaged in the preparation of our annual consolidated financial statements.
As prescribed by ASC 350, step two of the impairment test requires that we perform a theoretical purchase price allocation for the Domestic reporting unit to determine the implied fair value of goodwill. If the implied fair value of goodwill, after considering the fair values of remaining assets and liabilities, is less than the recorded amount on the balance sheet, an impairment is recorded. Since goodwill represents the difference between the fair value of the reporting unit, on a debt free basis, and the fair value of its assets and liabilities, any increase in the fair value of the assets decreases the amount of goodwill implied by the fair value of the reporting unit. Similarly, any increase in the fair value of the reporting unit’s liabilities increases the amount of goodwill supported by the reporting unit. The Company's step two analysis indicates that the fair value of the Domestic reporting unit’s assets, excluding the branch office network intangible, was approximately $57.0 million higher than the carrying value, primarily due to the increase in the value of the purchased debt asset. Partially offsetting this is an increase of approximately $24.6 million in the reporting unit’s liabilities primarily attributable to the deferred tax impact associated with the increase in the fair value of the assets. As a result of the completed analysis, a non-cash goodwill impairment charge of $74.0 million and a non-cash impairment charge of $10.6 million, before a tax benefit of $4.0 million, related to the branch office intangible, were recorded in the fourth quarter of 2015. These impairment charges represent a substantial impairment of goodwill and the branch office intangible, respectively, and are recorded in the impairments of goodwill and intangible assets line item on the consolidated statements of operations.
As part of the step two goodwill assessment, the Company also determined the fair value of the branch office network using the replacement cost method. As part of this methodology, management made a number of assumptions regarding both internal and external resources that would be required to recreate the network, including but not limited to, recruitment and on-boarding of partners, development of the technology and compliance framework, excluding the cost of the eAGLE system which was valued separately, based on which the network operates and currently provides the Closed Loop competitive advantage. The branch office network was originally valued in 2005 at the date of the Acquisition. The 2005 valuation was performed before the rationalization of the Company’s legal network to meet the evolving regulatory environment. This has involved the elimination of multiple legal offices as the Company regionalized its legal efforts, providing increased regulatory oversight and control.
Fiscal year 2014 compared with fiscal year 2013
The domestic segment did not record goodwill or intangible asset impairments in 2014 or 2013.
Adjusted EBITDA
Fiscal year 2015 compared with fiscal year 2014
Domestic Adjusted EBITDA decreased $31.6 million or 19.0%, primarily driven by the decrease in cash proceeds on purchased debt of $66.2 million, partially offset by a $39.9 million decrease in costs to collect.
60
Fiscal year 2014 compared with fiscal year 2013
Domestic Adjusted EBITDA decreased $107.2 million or 39.2%, primarily driven by the decrease in cash proceeds on purchased debt of $139.1 million, which resulted in a partially offsetting $41.1 million decrease in costs to collect.
Canada Performance Summary
The following table presents selected financial data for our Canada operating segment for the periods presented:
Year Ended | ||||||||||||||||||
Canada Segment Performance Summary | December 31, | Percent Change | ||||||||||||||||
($ in thousands) | 2015 | 2014 | 2013 | 2015 vs. 2014 | 2014 vs. 2013 | |||||||||||||
Purchases - face | $ | 415,641 | $ | 305,975 | $ | 216,269 | 35.8 | % | 41.5 | % | ||||||||
Purchases - price | 21,412 | 21,215 | 17,515 | 0.9 | % | 21.1 | % | |||||||||||
Purchases - price (%) | 5.2 | % | 6.9 | % | 8.1 | % | ||||||||||||
Cash proceeds on purchased debt | 42,810 | 43,569 | 48,013 | (1.7 | )% | (9.3 | )% | |||||||||||
Total revenues | 28,341 | 26,950 | 28,683 | 5.2 | % | (6.0 | )% | |||||||||||
Impairments of goodwill and intangible assets | — | — | — | — | % | — | % | |||||||||||
Adjusted EBITDA(1) | 31,259 | 31,432 | 34,905 | (0.6 | )% | (9.9 | )% | |||||||||||
(1) Segment Adjusted EBITDA is calculated consistently with the methodology used to report the Company's consolidated Adjusted EBITDA, except with regard to the costs of certain overhead items that may benefit both operating segments. The costs of these overhead items are included in the calculation of Domestic Adjusted EBITDA, but have not been allocated to Canada. This treatment of certain overhead costs is consistent with CODM review.
Purchases
Fiscal year 2015 compared with fiscal year 2014
Purchases by our Canada segment increased $109.7 million in face value and $0.2 million in capital deployed, net of negative foreign currency translation impact of $93.3 million in face value and $4.0 million in capital deployed. The increase in capital deployed prior to foreign currency translation of approximately 18.1% is primarily due to greater acquisition opportunities in both fresh and non-fresh that met our return criteria, including a significant portfolio acquisition during the third quarter.
Fiscal year 2014 compared with fiscal year 2013
Purchases by our Canada segment increased $89.7 million in face purchased and $3.7 million in capital deployed, net of negative foreign currency translation impact of $1.7 million, due to greater acquisition opportunities in credit card/consumer loan - non-fresh that met our return criteria.
Cash Proceeds
Fiscal year 2015 compared with fiscal year 2014
Canada's cash proceeds on purchased debt decreased $0.8 million or 1.7%, which includes negative foreign currency translation impact of $7.5 million. The increase in proceeds prior to foreign currency translation of 14.0% was primarily due to an increase in purchasing in 2015 and higher collections on those purchases.
Fiscal year 2014 compared with fiscal year 2013
Canada's total cash proceeds decreased $4.4 million or 9.3%, which includes foreign currency translation impact of $3.1 million. This decrease was due primarily to a $5.0 million decrease in non-legal collections due to lower face value purchases in late 2013 and 2014 and therefore less inventory in the non-legal channel.
61
Total Revenues
Fiscal year 2015 compared with fiscal year 2014
The Canada segment increased $1.4 million or 5.2%, net of negative foreign currency translation impact of $5.5 million. The increase in revenue prior to foreign currency translation of 23.0% is primarily due to an increase in gross revenue on level yield assets. This increase was due to better than expected collections on a number of level yield pools that resulted in full amortization of those pools and thus an increase in level yield revenue. In addition, higher level yield revenue resulted from a 49.4% increase in the average carrying value of level yield purchased debt assets partially due to the significant portfolio acquisition in the third quarter and purchases of higher returning products during 2015.
Fiscal year 2014 compared with fiscal year 2013
Total revenues from our Canada segment decreased $1.7 million or 6.0% primarily due to foreign currency translation impact of $1.9 million.
Impairments of Goodwill and Intangible assets
Fiscal year 2015 compared with fiscal year 2014
The Canada segment did not record goodwill or intangible asset impairments in 2015 or 2014.
Fiscal year 2014 compared with fiscal year 2013
The Canada segment did not record goodwill or intangible asset impairments in 2014 or 2013.
Adjusted EBITDA
Fiscal year 2015 compared with fiscal year 2014
Canada Adjusted EBITDA decreased $0.2 million or 0.6%, which includes negative foreign currency translation impact of $5.6 million. The increase in Adjusted EBITDA prior to foreign currency translation was primarily due to an increase in proceeds of 14.0% partially offset by increase in outflows of 9.9%.
Fiscal year 2014 compared with fiscal year 2013
Canada Adjusted EBITDA decreased $3.5 million or 9.9%, which includes foreign currency translation impact of $2.2 million. This decrease was primarily driven by the decrease in cash proceeds on purchased debt of $4.4 million, which resulted in a partially offsetting decrease in costs to collect.
Supplemental Performance Data
Owned Portfolio Performance
The following tables show certain data related to our U.S. and Canada purchased debt portfolios. These tables describe purchase price, cash proceeds received to date, estimated remaining cash proceeds, and related gross return on investment.
The gross ROIs for 2013 - 2015 purchases are lower in comparison to most of our historical returns, primarily due to lower supply that has resulted in increased market competition and higher prices.
62
U.S. Purchased Debt Portfolio as of December 31, 2015 ($ in thousands)
Purchase Period | Purchase Price(1) | Valuation Allowance (2) | Purchased Debt, net Carrying Value(3) | % of Carrying Value Unamortized(4) | Actual Proceeds Life to Date | Estimated Remaining Proceeds | Total Estimated Proceeds(5) | Gross ROI(6) | |||||||||||||||||||||
2009 and prior | $ | 1,463,532 | $ | (123,820 | ) | $ | 5,400 | — | % | $ | 3,040,871 | $ | 22,465 | $ | 3,063,336 | 2.09x | |||||||||||||
2010 | 164,117 | (2,170 | ) | 73 | — | % | 415,686 | 27,819 | 443,505 | 2.70x | |||||||||||||||||||
2011 | 244,959 | (2,750 | ) | 665 | — | % | 579,569 | 60,036 | 639,605 | 2.61x | |||||||||||||||||||
2012 | 246,011 | (4,077 | ) | 7,865 | 3 | % | 488,028 | 79,177 | 567,205 | 2.31x | |||||||||||||||||||
2013 | 240,595 | (4,543 | ) | 44,158 | 18 | % | 326,431 | 116,773 | 443,204 | 1.84x | |||||||||||||||||||
2014 | 105,532 | (799 | ) | 32,219 | 31 | % | 91,594 | 69,850 | 161,444 | 1.53x | |||||||||||||||||||
2015 | 76,835 | (436 | ) | 57,483 | 75 | % | 24,850 | 106,459 | 131,309 | 1.71x | |||||||||||||||||||
Total | $ | 2,541,581 | $ | (138,595 | ) | $ | 147,863 | $ | 4,967,029 | $ | 482,579 | $ | 5,449,608 | 2.14x | |||||||||||||||
(1) Purchase price represents cost of each purchase.
(2) Valuation allowance represents the total valuation allowance on our purchased debt, net of reversals.
(3) Portfolio carrying value represents the net book value of our purchased debt portfolios excluding the impact of the branch office asset purchase program (discontinued).
(4) Percentage of carrying value unamortized represents the carrying value divided by the purchase price.
(5) Total estimated proceeds represent actual proceeds life to date plus the estimated remaining proceeds.
(6) Gross ROI represents the total estimated proceeds divided by purchase price.
Canada Purchased Debt Portfolio as of December 31, 2015 (U.S. dollars in thousands)
Purchase Period | Purchase Price(1) | Valuation Allowance | Purchased Debt, net Carrying Value (2) | % of Carrying Value Unamortized | Actual Proceeds Life to Date(1) | Estimated Remaining Proceeds(2) | Total Estimated Proceeds | Gross ROI(3) | |||||||||||||||||||||
2009 and prior | $ | 23,406 | $ | — | $ | — | — | % | $ | 44,980 | $ | 467 | $ | 45,447 | 1.94x | ||||||||||||||
2010 | 7,706 | — | — | — | % | 31,175 | 2,175 | 33,350 | 4.33x | ||||||||||||||||||||
2011 | 22,745 | — | — | — | % | 64,530 | 4,087 | 68,617 | 3.02x | ||||||||||||||||||||
2012 | 26,746 | — | — | — | % | 54,758 | 3,977 | 58,735 | 2.20x | ||||||||||||||||||||
2013 | 17,515 | (138 | ) | 1,118 | 6 | % | 27,659 | 7,709 | 35,368 | 2.02x | |||||||||||||||||||
2014 | 21,215 | — | 5,797 | 27 | % | 21,564 | 16,660 | 38,224 | 1.80x | ||||||||||||||||||||
2015 | 21,412 | — | 13,590 | 63 | % | 11,927 | 38,937 | 50,864 | 2.38x | ||||||||||||||||||||
Total | $ | 140,745 | $ | (138 | ) | $ | 20,505 | $ | 256,593 | $ | 74,012 | $ | 330,605 | 2.35x | |||||||||||||||
(1) Converted to U.S. dollars using average historical exchange rates effective in the month of activity.
(2) Converted to U.S. dollars using the exchange rate as of December 31, 2015.
(3) Calculated by converting historical proceeds using average historical exchange rates effective in the month of activity and our estimated remaining proceeds using the exchange rate as of December 31, 2015.
63
Consolidated Purchased Debt Portfolio as of December 31, 2015 (U.S. dollars in thousands)
Purchase Period | Purchase Price | Valuation Allowance | Purchased Debt, net Carrying Value | % of Carrying Value Unamortized | Actual Proceeds Life to Date | Estimated Remaining Proceeds | Total Estimated Proceeds | Gross ROI | |||||||||||||||||||||
2009 and prior(1) | $ | 1,486,938 | $ | (123,820 | ) | $ | 5,400 | — | % | $ | 3,085,851 | $ | 22,932 | $ | 3,108,783 | 2.09x | |||||||||||||
2010 | 171,823 | (2,170 | ) | 73 | — | % | 446,861 | 29,994 | 476,855 | 2.78x | |||||||||||||||||||
2011 | 267,704 | (2,750 | ) | 665 | — | % | 644,099 | 64,123 | 708,222 | 2.65x | |||||||||||||||||||
2012 | 272,757 | (4,077 | ) | 7,865 | 3 | % | 542,786 | 83,154 | 625,940 | 2.29x | |||||||||||||||||||
2013 | 258,110 | (4,681 | ) | 45,276 | 18 | % | 354,090 | 124,482 | 478,572 | 1.85x | |||||||||||||||||||
2014 | 126,747 | (799 | ) | 38,016 | 30 | % | 113,158 | 86,510 | 199,668 | 1.58x | |||||||||||||||||||
2015 | 98,247 | (436 | ) | 71,073 | 72 | % | 36,777 | 145,396 | 182,173 | 1.85x | |||||||||||||||||||
Total | $ | 2,682,326 | $ | (138,733 | ) | $ | 168,368 | $ | 5,223,622 | $ | 556,591 | $ | 5,780,213 | 2.15x | |||||||||||||||
(1) Domestic asset purchase vintage years 1998-2009, Canadian asset purchase vintage years 2005-2009.
Estimated Remaining Proceeds
Based on our proprietary models and analytics, we have developed detailed cash flow forecasts for our charged-off receivables. As outlined in the tables below, we anticipate that our U.S. and Consolidated owned charged-off receivables as of December 31, 2015 will generate a total of approximately $482.6 million and $556.6 million, respectively, of gross cash proceeds. Our ERP expectations are based on historical data as well as assumptions about future collection rates and consumer behavior and are subject to a variety of factors that are beyond our control, and we cannot guarantee that we will achieve these results.
U.S. Purchased Debt Rolling Twelve Months Estimated Remaining Proceeds by Year of Purchase ($ in thousands)
Purchase Year | 0 - 12 Months | 13 - 24 Months | 25 - 36 Months | 37 - 48 Months | 49 - 60 Months | 61 - 72 Months | 73 Months+ (2) | Total | ||||||||||||||||||||||||
2009 and prior(1) | $ | 12,310 | $ | 5,759 | $ | 2,769 | $ | 1,191 | $ | 370 | $ | 66 | $ | — | $ | 22,465 | ||||||||||||||||
2010 | 12,544 | 8,366 | 4,174 | 1,158 | 1,006 | 457 | 114 | 27,819 | ||||||||||||||||||||||||
2011 | 22,198 | 15,509 | 10,069 | 5,674 | 2,753 | 2,134 | 1,699 | 60,036 | ||||||||||||||||||||||||
2012 | 30,330 | 19,237 | 13,420 | 8,712 | 4,077 | 1,354 | 2,047 | 79,177 | ||||||||||||||||||||||||
2013 | 47,073 | 26,148 | 18,275 | 12,769 | 8,220 | 3,725 | 563 | 116,773 | ||||||||||||||||||||||||
2014 | 28,263 | 15,485 | 8,868 | 5,625 | 4,124 | 3,263 | 4,222 | 69,850 | ||||||||||||||||||||||||
2015 | 38,591 | 23,012 | 13,653 | 9,138 | 6,825 | 5,447 | 9,793 | 106,459 | ||||||||||||||||||||||||
Total | $ | 191,309 | $ | 113,516 | $ | 71,228 | $ | 44,267 | $ | 27,375 | $ | 16,446 | $ | 18,438 | $ | 482,579 | ||||||||||||||||
Cumulative Percent | 39.6 | % | 63.2 | % | 77.9 | % | 87.1 | % | 92.8 | % | 96.2 | % | 100 | % | ||||||||||||||||||
(1) Represents estimated remaining proceeds for purchased debt acquired during the years 2004-2009.
(2) Although the maximum forecast period for charged-off receivables is 144 months, cash flows for portfolios purchased after 2013 are not currently forecasted beyond 108 months.
64
Consolidated Purchased Debt Rolling Twelve Months Estimated Remaining Proceeds by Year of Purchase
(U.S. dollars in thousands)(3)
Purchase Year | 0 - 12 Months | 13 - 24 Months | 25 - 36 Months | 37 - 48 Months | 49 - 60 Months | 61 - 72 Months | 73 Months+ (2) | Total | ||||||||||||||||||||||||
2009 and prior(1) | $ | 12,605 | $ | 5,891 | $ | 2,809 | $ | 1,191 | $ | 370 | $ | 66 | $ | — | $ | 22,932 | ||||||||||||||||
2010 | 13,796 | 9,060 | 4,390 | 1,171 | 1,006 | 457 | 114 | 29,994 | ||||||||||||||||||||||||
2011 | 24,637 | 16,523 | 10,424 | 5,895 | 2,811 | 2,134 | 1,699 | 64,123 | ||||||||||||||||||||||||
2012 | 32,148 | 20,239 | 13,966 | 9,043 | 4,283 | 1,428 | 2,047 | 83,154 | ||||||||||||||||||||||||
2013 | 49,866 | 27,990 | 19,469 | 13,578 | 8,781 | 4,116 | 682 | 124,482 | ||||||||||||||||||||||||
2014 | 35,344 | 19,924 | 11,089 | 6,917 | 4,913 | 3,716 | 4,607 | 86,510 | ||||||||||||||||||||||||
2015 | 52,194 | 32,485 | 20,021 | 13,299 | 9,436 | 7,026 | 10,935 | 145,396 | ||||||||||||||||||||||||
Total | $ | 220,590 | $ | 132,112 | $ | 82,168 | $ | 51,094 | $ | 31,600 | $ | 18,943 | $ | 20,084 | $ | 556,591 | ||||||||||||||||
Cumulative Percent | 39.6 | % | 63.4 | % | 78.1 | % | 87.3 | % | 93.0 | % | 96.4 | % | 100 | % | ||||||||||||||||||
(1) Represents estimated remaining proceeds for purchased debt acquired during the years 2004-2009 on Domestic assets and 2005-2009 on Canada assets.
(2) Although the maximum forecast period for charged-off receivables is 144 months, cash flows for portfolios purchased after 2013 are not currently forecasted beyond 108 months.
(3) Canadian estimated remaining proceeds are converted to U.S. dollars using the exchange rate as of December 31, 2015.
Historical Proceeds
The following table demonstrates our ability to realize continuing cash flow streams on our purchased debt, showing our cash proceeds by year, and year of purchase for the U.S. and Consolidated:
U.S. Period of Proceeds ($ in thousands)
Purchase Year | 2009 & Prior(2) | 2010 | 2011 | 2012 | 2013 | 2014 | 2015 | Total | ||||||||||||||||||||||||
2009 & Prior(1) | $ | 2,445,621 | $ | 232,834 | $ | 141,304 | $ | 93,593 | $ | 56,831 | $ | 38,511 | $ | 32,177 | $ | 3,040,871 | ||||||||||||||||
2010 | — | 90,429 | 130,132 | 94,374 | 53,213 | 27,698 | 19,840 | 415,686 | ||||||||||||||||||||||||
2011 | — | — | 163,304 | 196,236 | 120,068 | 60,322 | 39,639 | 579,569 | ||||||||||||||||||||||||
2012 | — | — | — | 176,605 | 163,096 | 88,015 | 60,312 | 488,028 | ||||||||||||||||||||||||
2013 | — | — | — | — | 122,488 | 119,738 | 84,205 | 326,431 | ||||||||||||||||||||||||
2014 | — | — | — | — | — | 42,279 | 49,315 | 91,594 | ||||||||||||||||||||||||
2015 | — | — | — | — | — | — | 24,850 | 24,850 | ||||||||||||||||||||||||
Total | $ | 2,445,621 | $ | 323,263 | $ | 434,740 | $ | 560,808 | $ | 515,696 | $ | 376,563 | $ | 310,338 | $ | 4,967,029 | ||||||||||||||||
(1) Represents purchase vintage years 1998-2009.
(2) Represents proceeds from purchased debt during the years 1998-2009.
65
Consolidated Period of Proceeds (U.S. dollars in thousands) (3)
Purchase Year | 2009 & Prior(2) | 2010 | 2011 | 2012 | 2013 | 2014 | 2015 | Total | ||||||||||||||||||||||||
2009 & Prior(1) | $ | 2,470,856 | $ | 239,249 | $ | 145,176 | $ | 96,983 | $ | 59,238 | $ | 40,615 | $ | 33,734 | $ | 3,085,851 | ||||||||||||||||
2010 | — | 97,831 | 138,926 | 100,294 | 57,368 | 30,491 | 21,951 | 446,861 | ||||||||||||||||||||||||
2011 | — | — | 186,578 | 212,802 | 131,304 | 68,108 | 45,307 | 644,099 | ||||||||||||||||||||||||
2012 | — | — | — | 197,938 | 180,029 | 98,336 | 66,483 | 542,786 | ||||||||||||||||||||||||
2013 | — | — | — | — | 135,770 | 129,240 | 89,080 | 354,090 | ||||||||||||||||||||||||
2014 | — | — | — | — | — | 53,342 | 59,816 | 113,158 | ||||||||||||||||||||||||
2015 | — | — | — | — | — | — | 36,777 | 36,777 | ||||||||||||||||||||||||
Total | $ | 2,470,856 | $ | 337,080 | $ | 470,680 | $ | 608,017 | $ | 563,709 | $ | 420,132 | $ | 353,148 | $ | 5,223,622 | ||||||||||||||||
(1) Represents Domestic purchase vintage years 1998-2009, Canadian purchase vintage years 2005-2009.
(2) Represents proceeds from purchased debt during the years 1998-2009 on Domestic assets and 2005-2009 for Canadian assets.
(3) Canadian proceeds converted to U.S. dollars using average historical exchange rates effective in the month of activity.
The following chart represents our historical consolidated proceeds, including U.S. and Canada, on owned debt by quarter, with collections shown in black and sales, recourse & bankruptcy proceeds in gray:
Consolidated Quarterly Cash Proceeds (U.S. dollars in millions)
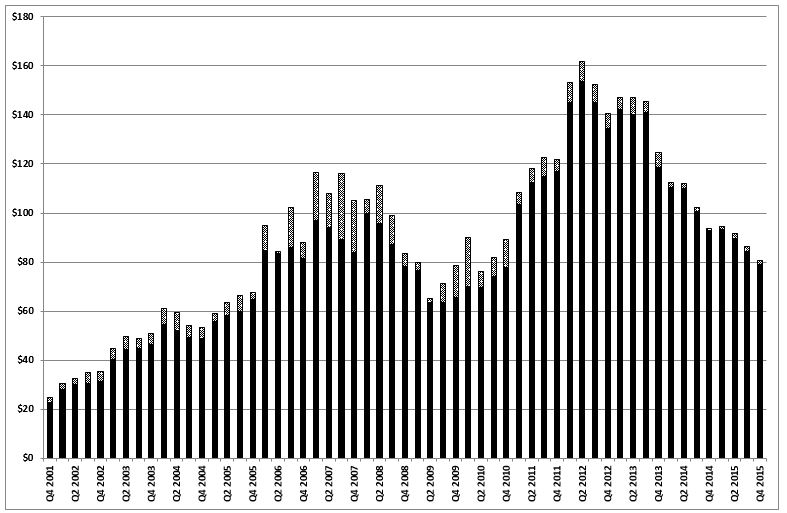
66
Liquidity and Capital Resources
Subsequent Events and Recent Developments
At December 31, 2015, our total liquidity to fund operations was $48.2 million, which consisted of non-restricted cash balances of $19.6 million and total availability under our senior revolving line of credit of $28.6 million. Our senior revolving credit facility, which had an outstanding balance of $134.8 million at December 31, 2015, originally matured on April 6, 2016. On April 5, 2016, the Company entered into Amendment No. 7 (“Amendment No. 7”) to the senior revolving credit facility. Pursuant to the terms of Amendment No. 7, the maximum commitment amount of the revolving credit facility was decreased from $245 million to $140 million, the term of the revolving credit facility was extended to April 29, 2016, and certain requirements related to the refinancing of the senior revolving credit facility were added. On April 20, 2016, the administrative agent for the senior revolving credit facility notified the Company of the occurrence of an event of default related to the Company’s failure to deliver a loan commitment to the administrative agent by April 18, 2016 for a refinancing in full of all obligations under the senior revolving credit facility. The administrative agent also reserved certain rights of the administrative agent and lenders under the senior revolving credit facility. On April 20, 2016, the Company and and a certain financial institution entered into a commitment letter setting forth the terms of a $165 million senior secured financing facility (the “New Financing Facility”). The obligation of the financial institution to provide the New Financing Facility is subject to certain conditions, including without limitation (i) the consummation of an exchange offer (the "Exchange Offer"), as further described below, in which the holders of at least 70% of the Company’s Senior Second Lien Notes exchange their outstanding Senior Second Lien Notes for participation in a 1.5 lien term loan and preferred stock of the Company, and (ii) the Company’s entry into a $30 million 1.25 lien term loan, at least $15 million of which will be funded on the closing date of the New Financing Facility. The Company expects to enter into definitive documentation for the New Financing Facility and borrow the full amount available thereunder concurrently with the settlement of the exchange offer discussed below. However, there can be no assurance that the senior revolving line of credit facility will be further extended, modified, or replaced by a new facility, or that the financial institution commitment will be consummated and result in enhancing the Company’s liquidity.
Under the terms of the Senior Second Lien Notes, we were required to make a semi-annual bond interest payment in the amount of $16.9 million on April 1, 2016. The Company did not make the April 1 bond interest payment to the holders of the Senior Second Lien Notes while it has continued to negotiate with certain of the holders concerning financing alternatives to enhance the Company's liquidity. As of April 25, 2016, the Company has prepared an offering memorandum for the Exchange Offer along with a consent solicitation (the “Consent Solicitation”) to holders of the Senior Second Lien Notes and plans to commence the Exchange Offer upon filing of this report. Participating holders will receive $620 principal amount of a new 1.5 lien term loan and $350 initial liquidation amount of a new class of preferred stock of the Company for each $1,000 principal amount of Senior Second Lien Notes tendered. In addition, holders who provide consents by the consent expiration time on May 6, 2016 (which be extended by the Company) will receive an additional $30 principal amount of the 1.5 lien term loan for each $1,000 principal amount of Senior Second Lien Notes. The Exchange Offer and Consent Solicitation will be made upon the terms and subject to the conditions set forth in the offering memorandum for the Exchange Offer and Consent Solicitation statement and related consent and letter of transmittal. The Exchange Offer and Consent Solicitation will be subject to certain conditions, including there being tendered at least 70% of the aggregate principal amount of the Senior Second Lien Notes. The Exchange Offer will expire on or around May 20, 2016, unless extended by the Company. Concurrently with the commencement of the Exchange Offer, the Company plans to enter into a recapitalization support agreement with holders of more than 75% in aggregate principal amount of the Senior Second Lien Notes, which agreement sets for the obligations and commitments of the parties with respect to the proposed restructuring of the Company. However, there can be no assurance that the Exchange Offer will be consummated as described above.
Failure to pay the semi-annual bond interest for 30 days could cause us to suffer an event of default under the indenture governing our Senior Second Lien Notes. Failure to satisfy our obligations under the senior revolving credit facility could cause us to suffer an event of default, which could, among other things, lead to the amounts due thereunder becoming immediately due and payable. Moreover, because our debt obligations are represented by separate agreements with different parties, any event of default under our senior revolving credit facility may create an event of default under the indenture governing our Senior Second Lien Notes, resulting in the acceleration of our obligation to pay principal, interest and potential penalties under the Senior Second Lien Notes, even though we may otherwise be in compliance with all of our obligations under the indenture governing the Senior Second Lien Notes. Any event of default could also have an adverse impact on the Company's capital and operating leases, including early termination, mandatory prepayment, or repossession of equipment. Under current circumstances, if the Exchange Offer and the New Financing Facility are not consummated, it is unlikely that we would be able to obtain additional sources of capital to repay our debt obligations and it is likely that one or more of our lenders would proceed against the collateral securing that indebtedness. In addition, management currently projects that the Company will not be in compliance with the Adjusted EBITDA covenant of the senior revolving credit facility at March 31, 2016. Failure to comply with the covenant could cause us to suffer an event of default under the senior revolving credit facility.
67
The circumstances and events described above raise substantial doubt as to whether the Company will be able to continue as a going concern for a reasonable period of time. As a result, our independent public accounting firm has issued an opinion on our consolidated financial statements that states that the consolidated financial statements were prepared assuming we will continue as a going concern. However, this opinion further states that factors described above raise substantial doubt about our ability to continue as a going concern. Based upon the Company’s current financial condition as discussed above, management believes that the New Financing Facility and the Exchange Offer will need to be consummated in order for the Company to continue to operate as a going concern and to avoid (as is the Company’s preference) filing for protection under the U.S. Bankruptcy Code. Management has assessed the financial impacts of the proposed restructuring, including changes in commitment levels and covenants, and believes that if the Exchange Offer and the New Financing Facility are consummated, the proposed restructuring would provide the Company with adequate liquidity and capital to execute its business plan for the foreseeable future. However, no assurance can be made that the Company will be successful in implementing the proposed restructuring.
Working Capital and Long-term Financing
Our primary sources of working capital are cash proceeds from purchased debt, excess cash balances and bank borrowings. Our working capital levels fluctuate throughout the year based on purchasing volumes and are generally positively affected by first and second quarter collections each year when we historically tend to have higher collections. Generally, these higher first and second quarter collections are driven by tax refunds, patterns of seasonal employment, and the impact of reductions in consumer spending following the holiday season. We use our working capital to purchase charged-off receivables, service our indebtedness, and fund our operations to generate long-term growth.
Our purchasing volumes and proceeds in any period fluctuate based on pricing and other macro-economic factors. We view our liquidity as our availability to borrow on our domestic and Canadian line of credit, plus our domestic and Canadian non-restricted cash balances, which primarily includes excess Canadian cash on hand. At December 31, 2015, our total liquidity to fund operations was $48.2 million, which consisted of non-restricted cash balances of $19.6 million and total availability under our senior revolving line of credit of $28.6 million.
Senior Revolving Credit Facility and Senior Second Lien Notes
The following represents the terms of the Company's outstanding line of credit borrowings as of December 31, 2015:
Type of Debt and Maximum Commitment | Collateral | Interest Rate Terms | Fees | Payment Terms | Maturity(1) | |||||
Domestic Line of Credit; maximum commitment $245.0 million subject to borrowing on Canadian Line of Credit and other terms.(1) | Substantially all assets of SquareTwo, its U.S. guarantor subsidiaries, and its Canadian subsidiaries. | Option of (1) Base Rate, highest of (a) the Bank Prime Loan rate, (b) the Federal Funds rate plus 0.50%, (c) one-month LIBOR plus 1.00%, or (d) 2.00%, plus a margin of 2.75%; or (2) LIBOR Rate, higher of (a) LIBOR or (b) 1.00%, plus a margin of 3.75%. | Unused line fees of 0.50%. | Due at maturity. | April 6, 2016 | |||||
Canadian Line of Credit; maximum commitment $24.7 million subject to borrowing on U.S. Line of Credit and other terms. | Substantially all assets of the Company. | Option of (1) Canadian Index Rate, the highest of (a) the reference rate for commercial Canadian loans, (b) the Canadian 30-day BA rate plus 1.00%, or (c) 2.00%, plus a margin of 2.75%; or (2) Canadian BA Rate, higher of (a) the Canadian BA rate, or (b) 1.00%, plus a margin of 4.25%. | Unused line fees of 0.50%. | Due at maturity. | April 6, 2016 | |||||
The following represents the terms of the Company's outstanding Senior Second Lien Notes as of December 31, 2015:
Type of Debt | Guarantee/Collateral | Interest Rate Terms | Repayment Terms | |||
Senior Second Lien Notes | Jointly and severally guaranteed by substantially all of SquareTwo's existing and future domestic subsidiaries. Guarantees are secured by a second priority lien by substantially all of the guarantors' assets. | 11.625% annual interest paid semi-annually in cash, on April 1 and October 1. | Mandatory redemption not required. Optional redemption permitted at any time, in whole or in part, subject to certain redemption prices and make-whole premiums based on the date of the redemption. | |||
The balance of the outstanding Senior Second Lien Notes, net of unamortized discount, was $289.1 million and $288.4 million at December 31, 2015 and December 31, 2014, respectively. The Senior Second Lien Notes mature on April 1, 2017.
68
The following chart shows our total debt outstanding as a multiple of Trailing Twelve Month ("TTM") Adjusted EBITDA (refer to the discussion of Adjusted EBITDA in the "Results of Operations" section herein). Adjusted EBITDA, which is a non-GAAP financial measure, should not be considered an alternative to, or more meaningful than, net income prepared on a GAAP basis. We present Adjusted EBITDA because we consider it to be an important supplemental measure of our performance and cash flows.
Company Debt Outstanding as a Multiple of TTM Adjusted EBITDA
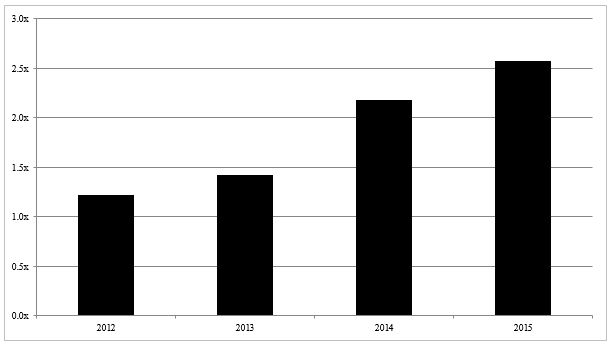
We believe the metric of debt outstanding as a multiple of TTM Adjusted EBITDA is representative of the Company's business model operating leverage. The ratio increased from 1.4x at December 31, 2013, to 2.2x at December 31, 2014 and further to 2.6x at December 31, 2015 as a result of a 35.9% decrease and 16.1% decrease in our TTM Adjusted EBITDA, respectively, and a 1.6% decrease and 0.9% decrease, respectively, in our total debt. Adjusted EBITDA declined primarily due to lower cash proceeds on purchased debt as a result of lower purchasing volumes during 2015.
Covenants
The senior revolving credit facility and the Senior Second Lien Notes have certain covenants and restrictions, as is customary for such facilities, with which the Company must comply. Some of the financial covenants under the revolving credit facility include: minimum Adjusted EBITDA, capital expenditures limits, and maximum operating lease obligations. The minimum Adjusted EBITDA covenant, as defined in detail in the revolving credit facility agreement is $165 million for each of the trailing twelve month periods beginning with the fiscal quarter ending December 31, 2014. The maximum capital expenditures covenant for any fiscal year, as further described in the revolving credit facility agreement, is $8 million and is subject to provisions set forth in the agreement. Maximum aggregate rent expense and certain other operating lease obligations, excluding a certain operating lease, are $3 million in any fiscal year. As of December 31, 2015, the Company was in compliance with all covenants and restrictions of the revolving credit facility and Senior Second Lien Notes. Subsequent to December 31, 2015, the Company was not in compliance with all covenants and restrictions of the senior revolving credit facility and Senior Second Lien Notes. Refer to Subsequent Events and Recent Developments section above.
Capital Leases
We had outstanding capital lease obligations relating to computer and office equipment of $1.2 million and software agreements of $0.9 million as of December 31, 2015.
69
Related Party Loans
During 2001, we entered into two promissory notes with two individuals related to a co-founder and member of our Board of Directors, P. Scott Lowery. The notes were issued to repurchase common stock of SquareTwo held by these related parties. These notes bear interest at a fixed rate of 8.0% and require us to make monthly principal and interest payments of less than $0.1 million. As of December 31, 2015, these notes had outstanding balances of $0.3 million and less than $0.1 million, respectively. The $0.1 million note matured and was paid in January of 2016. The $0.3 million note matures on August 15, 2021.
Cash Flows
Our primary sources of liquidity are cash proceeds from purchased debt, excess cash balances, and borrowings on our senior revolving credit facility. Our primary uses of liquidity are to purchase additional charged-off receivables, fund operating expenses, and service our indebtedness. Our total indebtedness, net of discount, at December 31, 2015 and December 31, 2014 was $426.3 million and $430.4 million, respectively, including obligations under capital leases. Our ability to service our debt and to fund planned purchases of charged-off receivables will depend on our ability to generate cash proceeds in the future, which, to a certain extent, is subject to general economic, financial, competitive, legislative, regulatory and other factors beyond our control.
The following table provides a summary of the components of cash flow for the periods presented:
Year Ended | ||||||||||||
December 31, | ||||||||||||
$ in thousands | 2015 | 2014 | 2013 | |||||||||
Net cash (used in) provided by operating activities | $ | (39,684 | ) | $ | (26,703 | ) | $ | 15,045 | ||||
Net cash provided by (used in) investing activities | 53,770 | 44,201 | (21,781 | ) | ||||||||
Net cash (used in) provided by financing activities | (6,543 | ) | (9,973 | ) | 9,748 | |||||||
Increase in cash and cash equivalents (1) | $ | 7,543 | $ | 7,525 | $ | 3,012 | ||||||
(1) Before the impact of foreign currency translation on cash of $(3,636), $(1,227), and $(1,171) respectively.
Operating Activities
Cash generated from operations is dependent upon our ability to generate proceeds on our purchased debt. Many factors, including the economy and our Closed Loop Network's ability to maintain low collector turnover and adequate liquidation rates, are essential to our ability to generate cash proceeds. Fluctuations in these factors that cause volatility in our business could have a material impact on our expected future cash flows. Proceeds on purchased debt recorded as revenue are included in the operating activities, while proceeds recorded as amortization of purchased debt principal are included in the investing activities. Refer to the reconciliation of net cash (used in) provided by operating activities to Adjusted EBITDA in the "Results of Operations" section herein.
Our operating activities used net cash of $39.7 million during the year ended December 31, 2015 and used net cash of $26.7 million during the year ended December 31, 2014. The increase in cash used by operating activities of $13.0 million was primarily due to a decrease of $48.8 million in proceeds on purchased debt recorded as revenue, excluding non-cash valuation allowance charges and reversals. This was partially offset by a corresponding decrease in costs to collect including court costs of $40.8 million. The remaining change in net cash used by operating activities was due to normal changes in operating assets and liabilities.
Operating activities used net cash of $26.7 million during the year ended December 31, 2014 and provided net cash of $15.0 million during the year ended December 31, 2013. The decrease in cash provided by operating activities of $41.7 million was primarily due to a decrease of $77.6 million in proceeds on purchased debt recorded as revenue, excluding non-cash valuation allowance charges and reversals. This was partially offset by a corresponding decrease in costs to collect including court costs of $42.1 million. The remaining change in net cash provided by operating activities was due to normal changes in operating assets and liabilities.
70
Investing Activities
Our investing activities provided net cash of $53.8 million during the year ended December 31, 2015 and provided net cash of $44.2 million during the year ended December 31, 2014. Cash used in investing activities is primarily driven by investments in charged-off receivables offset by cash proceeds applied to the carrying value of our purchased debt. The increase in cash provided of $9.6 million was due to a $28.5 million decrease in investments in purchased debt, partially offset by an $18.2 million decrease in cash proceeds recorded as a reduction of our purchased debt carrying value.
Investing activities provided net cash of $44.2 million during the year ended December 31, 2014 and used net cash of $21.8 million during the year ended December 31, 2013. Cash used in investing activities is primarily driven by investments in charged-off receivables offset by cash proceeds applied to the carrying value of our purchased debt. The decrease in cash used of $66.0 million was due to a $131.4 million decrease in investments in purchased debt, partially offset by a $65.9 million decrease in cash proceeds recorded as a reduction of our purchased debt carrying value.
Financing Activities
Our financing activities used net cash of $6.5 million during the year ended December 31, 2015 and used net cash of $10.0 million during the year ended December 31, 2014. Financing activities are primarily driven by purchasing volume (which drives our incremental borrowing), payments on our revolving credit facility, capital lease obligations, and payments of origination fees on our revolving line of credit. Cash is provided by draws on our revolving credit facility and proceeds are used to pay down the revolving credit facility. The decrease in cash used by financing activities of $3.4 million was primarily due to a decrease of $79.6 million in draws on our revolving credit facility offset by a decrease of $82.3 million in payments on our revolving line of credit resulting from reduced proceeds on purchased debt during 2015 compared to 2014.
Financing activities used net cash of $10.0 million during the year ended December 31, 2014 and provided net cash of $9.7 million during the year ended December 31, 2013. Financing activities are primarily driven by purchasing volume (which drives our incremental borrowing), payments on our revolving credit facility, capital lease obligations, and payments of origination fees on our revolving line of credit. Cash is provided by draws on our revolving credit facility and proceeds are used to pay down the revolving credit facility. The decrease in cash provided by financing activities of $19.7 million was primarily due to a decrease of $160.3 million in draws on our revolving credit facility offset by a decrease of $140.9 million in payments on our revolving credit facility resulting from reduced proceeds on purchased debt during 2014 compared to 2013.
Off-Balance Sheet Arrangements
As of December 31, 2015, we did not have any off balance sheet arrangements as defined by Item 303(a)(4) of Regulation S-K.
Contractual Obligations
The following summarizes our contractual obligations that exist as of December 31, 2015 (amounts in thousands) and their payments due by period:
Payments due by period | ||||||||||||||||||||
Contractual Obligations | Total | Less than 1 year(4) | 1-3 Years(5) | 3-5 Years(6) | More than 5 years | |||||||||||||||
Line of Credit(1) | $ | 136,446 | $ | 136,446 | $ | — | $ | — | $ | — | ||||||||||
Notes Payable(1) | 332,464 | 33,779 | 298,538 | 110 | 37 | |||||||||||||||
Capital Leases(2) | 2,358 | 1,446 | 912 | — | — | |||||||||||||||
Operating Leases | 5,776 | 3,379 | 1,411 | 651 | 335 | |||||||||||||||
Purchase Commitments(3) | — | — | — | — | — | |||||||||||||||
Total | $ | 477,044 | $ | 175,050 | $ | 300,861 | $ | 761 | $ | 372 | ||||||||||
(1) Payments on line of credit and notes payable include interest calculated at our effective rates at December 31, 2015 on floating rate debt.
(2) Payments on capital lease obligations include interest and maintenance fees.
(3) Represents the non-cancelable obligations outstanding at December 31, 2015. Purchase commitment contracts typically cover a year or less and can be generally canceled by the Company at its discretion with a 30-60 days' notice.
71
(4) Represents payments due within 1 year or less.
(5) Represents payments due within more than 1 year and up to and including 3 years.
(6) Represents payments due within more than 3 years and up to and including 5 years.
Critical Accounting Policies
The preparation of financial statements and related disclosures in conformity with GAAP and our discussion and analysis of our financial condition and results of operations require our management to make judgments, assumptions and estimates that affect the amounts reported in our consolidated financial statements and accompanying notes. We base our estimates on historical experience and on various other assumptions we believe to be reasonable under the circumstances, the results of which form the basis for making judgments about the carrying values of assets and liabilities. Actual results may differ from these estimates and such differences may be material.
Management believes our critical accounting policies and estimates are those related to revenue recognition, accounting estimates, valuation of acquired goodwill and intangible assets, and income taxes. Management believes these policies to be critical because they are both important to the portrayal of our financial condition and results, and they require management to make judgments and estimates about matters that are inherently uncertain.
Revenue Recognition from Purchased Debt
We account for our purchased debt under the guidance of ASC Subtopic 310-30, Loans and Debt Securities Acquired with Deteriorated Credit Quality (“ASC 310-30”). Under ASC 310-30, static pools of purchased debt, aggregated based on certain common risk criteria, can be accounted for under either the interest method of accounting or the cost recovery method of accounting. Revenue recognition under ASC 310-30 is based in part on life-to-date performance of our static pools as well as our forecasts of future proceeds on those pools, which reflect our judgments and various assumptions and estimates made quarterly. Refer to accounting for income recognized on purchased debt discussed in detail in Note 2 to the consolidated financial statements.
Accounting Estimates
The preparation of financial statements in conformity with GAAP requires management to make estimates and assumptions that affect the amounts reported in the financial statements and the accompanying notes. Actual results could differ from those estimates. Our consolidated financial statements are based on a number of significant estimates, including the collectability of purchased debt and the timing of such proceeds. Due to the uncertainties inherent in the estimation process, it is at least reasonably possible that our estimates in connection with these items could be materially revised within the near term.
Goodwill and Intangible Assets
Intangible assets consist of goodwill and the value of the Company’s network of branch offices. Both were identified as part of purchase accounting at the date of the Acquisition. The value of the branch office network of $24.9 million was originally identified as an indefinite-lived intangible asset and has therefore not been subject to amortization. Goodwill represents the excess of the purchase price over the fair value of identifiable net assets acquired in a business combination.
We have two operating segments: Domestic and Canada. In accordance with FASB ASC Topic 350, Intangibles-Goodwill and Other, we have deemed our operating segments to be reporting units for the purpose of testing goodwill for impairment.
The Company tests its indefinite-lived intangibles annually for impairment unless there is a triggering event during an interim period that would necessitate testing. As a result of the first step of our interim goodwill impairment test performed on both segments, we concluded that the fair value of the Domestic reporting unit did not exceed its carrying value, suggesting the $145.9 million of goodwill assigned to this reporting unit, or a portion thereof, could be impaired.
As prescribed by ASC 350, step two of the impairment test requires that we perform a theoretical purchase price allocation for the Domestic reporting unit to determine the implied fair value of goodwill. If the implied fair value of goodwill, after considering the fair values of remaining assets and liabilities, is less than the recorded amount on the balance sheet, an impairment is recorded. The Company's step two analysis indicates that the fair value of the Domestic reporting unit’s assets, excluding the branch office network intangible, was approximately $57.0 million higher than the carrying value, primarily due to the increase in the value of the purchased debt asset. Partially offsetting this is an increase of approximately $24.6 million in the reporting unit’s liabilities primarily attributable to the deferred tax impact associated with the increase in the fair value of the assets. As a result of the completed analysis, a non-cash goodwill impairment charge of $74.0 million and a non-cash impairment charge of $10.6 million, before a tax benefit of $4.0 million, related to the branch office intangible, were recorded in the fourth quarter of 2015.
In addition, as part of the step two goodwill assessment, the Company determined the fair value of the branch office network using the replacement cost method. As part of this methodology, management made a number of assumptions regarding both internal and external resources that would be required to recreate the network, including but not limited to, recruitment and on-boarding of partners, development of the technology and compliance framework, excluding the cost of the eAGLE system which was valued separately, based on which the network operates and currently provides the Closed Loop competitive advantage. The branch office network was originally valued in 2005 at the date of the Acquisition. The process of evaluating the potential impairment of goodwill and other intangible assets is highly subjective and requires significant judgment at many points during the analysis. This fair value determination was categorized as Level 3 in the fair value hierarchy.
The Company also reassessed certain underlying assumptions regarding the estimated useful life of the domestic branch office intangible asset. The assessment resulted in the Company changing the estimated useful life from indefinite-lived to finite lived. The Company assigned a life of 20 years to the remaining asset value which is being amortized to the
72
depreciation and amortization expense line item on the consolidated statements of operations on a straight-line basis beginning with the fourth quarter of 2015.
Income Taxes
The Company uses the liability method of accounting for income taxes in accordance with the authoritative guidance for income taxes. When the Company prepares its consolidated financial statements, it estimates income taxes based on the various jurisdictions where it conducts business. This requires the Company to estimate current tax exposure and to assess temporary differences that result from differing treatments of certain items for tax and accounting purposes. Deferred income taxes are recognized based on the difference between the consolidated financial statements and income tax bases of assets and liabilities using the enacted tax rates in effect for the year in which the differences are expected to reverse. The Company then assesses the likelihood that deferred tax assets will be realized. Valuation allowances are established, when necessary, to reduce deferred tax assets to the amount expected to be realized. When the Company establishes a valuation allowance or increases this allowance in an accounting period, it records a corresponding tax expense in the consolidated statements of operations. The Company includes interest and penalties related to the income taxes within its provision for income taxes.
Management must make significant judgments to determine the provision for income taxes, deferred tax assets and liabilities, and any valuation allowance to be recorded against the deferred tax assets.
Item 7A. Quantitative and Qualitative Disclosure About Market Risk.
Market Risk
We are exposed to various types of market risk in the normal course of business, including the impact of interest rate changes, foreign currency exchange rate fluctuations, changes in corporate tax rates, and inflation. From time to time, we employ risk management strategies that may include the use of derivatives, such as interest rate swap agreements. We do not enter into derivatives for trading purposes.
Foreign Currency Risk
Foreign currency exposures arise from transactions denominated in Canadian dollars translated into U.S. dollars. During 2015, we continued to see volatility in the exchange rate of the Canadian dollar. The Canadian dollar value eroded by 16.2% at December 31, 2015 from December 31, 2014. We believe this trend may continue, and if so, it could have a negative impact on our future results of operations. For 2015, if the exchange rate of Canadian to U.S. dollar averaged 10% higher or lower, we would have recorded an increase or decrease in revenue of approximately $2.8 million, an increase or decrease in Adjusted EBITDA by approximately $3.1 million, an increase or decrease in cash and cash equivalents by $1.9 million, and an increase or decrease in our Canadian ERP by $7.4 million.
Interest Rate Risk
At December 31, 2015 and 2014, we had $134.8 million and $138.7 million, respectively, of variable rate indebtedness. As of December 31, 2015, our domestic variable rate borrowings have margins, at our option, of (1) 2.75% over the highest of (a) the Bank Prime Loan rate, (b) the Federal Funds rate plus 0.50%, (c) one-month LIBOR plus 1.00%, or (d) 2.00%, referred to as our Base Rate; or (2) 3.75% over LIBOR, where LIBOR has a floor of 1.00%, referred to as our LIBOR Rate.
As of December 31, 2015, our Canadian variable rate borrowings have margins, at our option, of (1) 2.75% over the highest of (a) the reference rate for commercial Canadian Loans, (b) the Canadian 30-day BA rate plus 1.00%, or (c) 2.00%; or (2) 4.25% over the higher of (a) the Canadian BA rate or (b) 1.00%.
A material change in interest rates could adversely affect our operating results and cash flows. A 25 basis point increase in interest rates could increase our annual interest expense by $125,000 for each $50 million of our Base Rate variable
73
rate borrowings outstanding for the entire year. Our LIBOR Rate loans are subject to a LIBOR floor of 1.00%, as described above, and, until certain LIBOR rates exceed 1.00%, the interest rates we pay on those loans per dollar borrowed will not increase. We utilize LIBOR Rate loans for the majority of our variable rate borrowings. We did not utilize the Canadian line of credit during 2014. We have, from time to time, utilized derivative financial instruments in an effort to limit potential losses from adverse interest rate changes. These transactions have generally been interest rate swap agreements entered into with large multinational banks. At December 31, 2015 and 2014, we had no derivative instruments outstanding.
74
Item 8. Financial Statements and Supplementary Data.
Index to Financial Statements
Index to Financial Statements | Page |
75
Report of Independent Registered Public Accounting Firm
The Board of Directors
SquareTwo Financial Corporation
We have audited the accompanying consolidated balance sheets of SquareTwo Financial Corporation and Subsidiaries as of December 31, 2015 and 2014, and the related consolidated statements of operations, comprehensive (loss) income, changes in stockholder's (deficiency) equity, and cash flows for each of the three years in the period ended December 31, 2015. These financial statements are the responsibility of the Company's management. Our responsibility is to express an opinion on these financial statements based on our audits.
We conducted our audits in accordance with the standards of the Public Company Accounting Oversight Board (United States). Those standards require that we plan and perform the audit to obtain reasonable assurance about whether the financial statements are free of material misstatement. We were not engaged to perform an audit of the Company's internal control over financial reporting. Our audits included consideration of internal control over financial reporting as a basis for designing audit procedures that are appropriate in the circumstances, but not for the purpose of expressing an opinion on the effectiveness of the Company's internal control over financial reporting. Accordingly, we express no such opinion. An audit also includes examining, on a test basis, evidence supporting the amounts and disclosures in the financial statements, assessing the accounting principles used and significant estimates made by management, and evaluating the overall financial statement presentation. We believe that our audits provide a reasonable basis for our opinion.
In our opinion, the financial statements referred to above present fairly, in all material respects, the consolidated financial position of SquareTwo Financial Corporation and Subsidiaries as of December 31, 2015 and 2014, and the consolidated results of their operations and their cash flows for each of the three years in the period ended December 31, 2015, in conformity with U.S. generally accepted accounting principles.
The accompanying consolidated financial statements have been prepared assuming that the Company will continue as a going concern. As discussed in Note 2 to the financial statements, the Company has incurred significant operating losses and has liabilities significantly in excess of assets. Without access to additional liquidity, the Company does not expect it will be able to fund its obligations as they come due in 2016 and beyond, which raises substantial doubt about its ability to continue as a going concern. Management's plans in regard to these matters are also described in Note 2. The consolidated financial statements do not include any adjustments that might result from the outcome of this uncertainty.
/s/ Ernst & Young, LLP
Denver, Colorado
April 25, 2016
76
SquareTwo Financial Corporation and Subsidiaries
Consolidated Balance Sheets
(in thousands except share data)
December 31, | ||||||||
2015 | 2014 | |||||||
Assets | ||||||||
Cash and cash equivalents | $ | 19,584 | $ | 15,677 | ||||
Restricted cash | 2,927 | 4,137 | ||||||
Trade receivables, net of allowance for doubtful accounts of $15 | 1,495 | 1,851 | ||||||
Notes receivable | 163 | 194 | ||||||
Purchased debt, net | 167,494 | 222,700 | ||||||
Property and equipment, net | 23,445 | 23,189 | ||||||
Goodwill and intangible assets | 86,457 | 171,348 | ||||||
Other assets | 6,253 | 8,991 | ||||||
Total assets | $ | 307,818 | $ | 448,087 | ||||
Liabilities and deficiency | ||||||||
Liabilities: | ||||||||
Accounts payable, trade | $ | 1,939 | $ | 3,225 | ||||
Payable from trust accounts | 1,538 | 1,404 | ||||||
Taxes payable | 1,034 | 475 | ||||||
Accrued interest and other liabilities | 22,152 | 24,499 | ||||||
Deferred tax liability, net | 1,651 | 11,408 | ||||||
Line of credit | 134,831 | 138,702 | ||||||
Notes payable, net of discount | 289,348 | 289,370 | ||||||
Obligations under capital lease agreements | 2,118 | 2,310 | ||||||
Total liabilities | 454,611 | 471,393 | ||||||
Commitments and contingencies (Note 10) | ||||||||
Deficiency: | ||||||||
Common stock, par value $0.001 per share; 1,000 shares authorized, issued and outstanding | — | — | ||||||
Additional paid-in capital | 190,225 | 190,191 | ||||||
Accumulated deficit | (335,247 | ) | (215,823 | ) | ||||
Accumulated other comprehensive loss | (9,456 | ) | (3,636 | ) | ||||
Total deficiency before noncontrolling interest | (154,478 | ) | (29,268 | ) | ||||
Noncontrolling interest | 7,685 | 5,962 | ||||||
Total deficiency | (146,793 | ) | (23,306 | ) | ||||
Total liabilities and deficiency | $ | 307,818 | $ | 448,087 | ||||
See Notes to the Consolidated Financial Statements
77
SquareTwo Financial Corporation and Subsidiaries
Consolidated Statements of Operations
(in thousands)
Year Ended | ||||||||||||
December 31, | ||||||||||||
2015 | 2014 | 2013 | ||||||||||
Revenues | ||||||||||||
Purchased debt revenue, net | $ | 202,611 | $ | 247,035 | $ | 337,578 | ||||||
Other revenue | 42 | 56 | 675 | |||||||||
Total revenues | 202,653 | 247,091 | 338,253 | |||||||||
Expenses | ||||||||||||
Purchased debt expense | 114,887 | 147,813 | 189,184 | |||||||||
Court costs, net | 26,857 | 34,719 | 40,155 | |||||||||
Salaries and payroll taxes | 34,601 | 30,552 | 26,348 | |||||||||
General and administrative | 13,654 | 14,457 | 14,418 | |||||||||
Depreciation and amortization | 6,753 | 6,883 | 7,986 | |||||||||
Impairments of goodwill and intangible assets | 84,606 | — | — | |||||||||
Total operating expenses | 281,358 | 234,424 | 278,091 | |||||||||
Operating (loss) income | (78,705 | ) | 12,667 | 60,162 | ||||||||
Other expenses | ||||||||||||
Interest expense | 44,609 | 44,217 | 45,984 | |||||||||
Other expense | 338 | 440 | 3,872 | |||||||||
Total other expenses | 44,947 | 44,657 | 49,856 | |||||||||
(Loss) income before income taxes | (123,652 | ) | (31,990 | ) | 10,306 | |||||||
Income tax benefit (expense) | 5,951 | (5,950 | ) | (5,243 | ) | |||||||
Net (loss) income | (117,701 | ) | (37,940 | ) | 5,063 | |||||||
Less: Net income attributable to the noncontrolling interest | 1,723 | 1,529 | 1,401 | |||||||||
Net (loss) income attributable to SquareTwo | $ | (119,424 | ) | $ | (39,469 | ) | $ | 3,662 | ||||
See Notes to the Consolidated Financial Statements
78
SquareTwo Financial Corporation and Subsidiaries
Consolidated Statements of Comprehensive (Loss) Income
(in thousands)
Year Ended | ||||||||||||
December 31, | ||||||||||||
2015 | 2014 | 2013 | ||||||||||
Net (loss) income | $ | (117,701 | ) | $ | (37,940 | ) | $ | 5,063 | ||||
Other comprehensive (loss) income, net of tax: | ||||||||||||
Currency translation adjustment | (5,820 | ) | (2,289 | ) | (1,236 | ) | ||||||
Comprehensive (loss) income | (123,521 | ) | (40,229 | ) | 3,827 | |||||||
Less: Comprehensive income attributable to the noncontrolling interest | 1,723 | 1,529 | 1,401 | |||||||||
Comprehensive (loss) income attributable to SquareTwo | $ | (125,244 | ) | $ | (41,758 | ) | $ | 2,426 | ||||
See Notes to the Consolidated Financial Statements
79
SquareTwo Financial Corporation and Subsidiaries
Consolidated Statements of Changes in Stockholder's Equity (Deficiency)
(in thousands)
Common Stock | Additional Paid-In Capital | Accumulated Deficit | Accumulated Other Comprehensive Loss | Total SquareTwo Equity (Deficiency) | Noncontrolling Interest | Total Stockholder's Equity (Deficiency) | ||||||||||||||||||||||
Balances, December 31, 2012 | $ | — | $ | 190,134 | $ | (180,016 | ) | $ | (111 | ) | $ | 10,007 | $ | 3,032 | $ | 13,039 | ||||||||||||
Net income | — | — | 3,662 | — | 3,662 | 1,401 | 5,063 | |||||||||||||||||||||
Currency translation adjustment | — | — | — | (1,236 | ) | (1,236 | ) | — | (1,236 | ) | ||||||||||||||||||
Stock option expense | — | 128 | — | — | 128 | — | 128 | |||||||||||||||||||||
Balances, December 31, 2013 | $ | — | $ | 190,262 | $ | (176,354 | ) | $ | (1,347 | ) | $ | 12,561 | $ | 4,433 | $ | 16,994 | ||||||||||||
Net (loss) income | — | — | (39,469 | ) | — | (39,469 | ) | 1,529 | (37,940 | ) | ||||||||||||||||||
Currency translation adjustment | — | — | — | (2,289 | ) | (2,289 | ) | — | (2,289 | ) | ||||||||||||||||||
Distribution to Parent | — | (150 | ) | — | — | (150 | ) | — | (150 | ) | ||||||||||||||||||
Stock option expense | — | 79 | — | — | 79 | — | 79 | |||||||||||||||||||||
Balances, December 31, 2014 | $ | — | $ | 190,191 | $ | (215,823 | ) | $ | (3,636 | ) | $ | (29,268 | ) | $ | 5,962 | $ | (23,306 | ) | ||||||||||
Net (loss) income | — | — | (119,424 | ) | — | (119,424 | ) | 1,723 | (117,701 | ) | ||||||||||||||||||
Currency translation adjustment | — | — | — | (5,820 | ) | (5,820 | ) | — | (5,820 | ) | ||||||||||||||||||
Stock option expense | — | 34 | — | — | 34 | — | 34 | |||||||||||||||||||||
Balances, December 31, 2015 | $ | — | $ | 190,225 | $ | (335,247 | ) | $ | (9,456 | ) | $ | (154,478 | ) | $ | 7,685 | $ | (146,793 | ) | ||||||||||
See Notes to the Consolidated Financial Statements
80
SquareTwo Financial Corporation and Subsidiaries
Consolidated Statements of Cash Flows
(in thousands)
Year Ended | ||||||||||||
December 31, | ||||||||||||
2015 | 2014 | 2013 | ||||||||||
Operating activities | ||||||||||||
Net (loss) income | $ | (117,701 | ) | $ | (37,940 | ) | $ | 5,063 | ||||
Adjustments to reconcile net (loss) income to net cash (used in) provided by operating activities: | ||||||||||||
Depreciation and amortization | 6,753 | 6,883 | 7,986 | |||||||||
Impairments of goodwill and intangible assets | 84,606 | — | — | |||||||||
Amortization of loan origination fees and debt discount | 3,303 | 2,997 | 3,202 | |||||||||
Recovery of step-up in basis of purchased debt | — | — | 107 | |||||||||
Purchased debt valuation allowance (reversals) charges | (6,719 | ) | 1,784 | (6,648 | ) | |||||||
Stock option expense | 34 | 79 | 128 | |||||||||
Amortization of prepaid and other non-cash expenses | 6,032 | 4,532 | 4,658 | |||||||||
Deferred tax provision, net of valuation allowance | (9,757 | ) | 1,472 | 335 | ||||||||
Changes in operating assets and liabilities: | ||||||||||||
Income tax payable/receivable | 577 | (8 | ) | (1,870 | ) | |||||||
Restricted cash | 1,210 | 2,347 | 4,899 | |||||||||
Other assets | (5,543 | ) | (5,052 | ) | (4,688 | ) | ||||||
Accounts payable and accrued liabilities | (2,479 | ) | (3,797 | ) | 1,873 | |||||||
Net cash (used in) provided by operating activities | (39,684 | ) | (26,703 | ) | 15,045 | |||||||
Investing activities | ||||||||||||
Investment in purchased debt | (98,247 | ) | (126,747 | ) | (258,110 | ) | ||||||
Proceeds applied to purchased debt principal | 157,500 | 175,695 | 241,561 | |||||||||
Payments to branch offices related to asset purchase program | (259 | ) | — | (297 | ) | |||||||
Net proceeds from notes receivable | — | — | 77 | |||||||||
Investment in property and equipment, including internally developed software | (5,224 | ) | (4,747 | ) | (5,012 | ) | ||||||
Net cash provided by (used in) investing activities | 53,770 | 44,201 | (21,781 | ) | ||||||||
Financing activities | ||||||||||||
Repayments of investment by Parent, net | — | (150 | ) | — | ||||||||
Payments on notes payable, net | (741 | ) | (763 | ) | (596 | ) | ||||||
Proceeds from line of credit | 341,668 | 421,308 | 581,644 | |||||||||
Payments on line of credit | (345,539 | ) | (427,875 | ) | (568,787 | ) | ||||||
Origination fees on line of credit | (200 | ) | (767 | ) | (1,035 | ) | ||||||
Payments on capital lease obligations | (1,731 | ) | (1,726 | ) | (1,478 | ) | ||||||
Net cash (used in) provided by financing activities | (6,543 | ) | (9,973 | ) | 9,748 | |||||||
Increase in cash and cash equivalents | 7,543 | 7,525 | 3,012 | |||||||||
Impact of foreign currency translation on cash | (3,636 | ) | (1,227 | ) | (1,171 | ) | ||||||
Cash and cash equivalents at beginning of period | 15,677 | 9,379 | 7,538 | |||||||||
Cash and cash equivalents at end of period | $ | 19,584 | $ | 15,677 | $ | 9,379 | ||||||
Supplemental cash flow information | ||||||||||||
Cash paid for interest | $ | 41,390 | $ | 41,343 | $ | 43,005 | ||||||
Cash paid for income taxes | 3,196 | 4,481 | 6,779 | |||||||||
Property and equipment financed with capital leases and notes payable | 1,539 | 1,292 | 2,407 | |||||||||
See Notes to the Consolidated Financial Statements
81
SquareTwo Financial Corporation and Subsidiaries
Notes to the Consolidated Financial Statements
(in thousands except share amounts or otherwise indicated)
1. Organization and Basis of Presentation
SquareTwo Financial Corporation (together with its subsidiaries referred to herein as “SquareTwo,” "we," "our," "us," or the “Company”) is a Delaware corporation that was organized in February 1994 and is headquartered in Denver, Colorado. On August 5, 2005, CA Holding, Inc. (“Parent”) acquired 100% of the outstanding stock of SquareTwo and its subsidiaries (the “Acquisition”). The accompanying consolidated financial statements reflect Parent’s basis in SquareTwo. SquareTwo’s subsidiaries purchase domestic and Canadian charged-off receivables (referred to herein as “purchased debt”).
The Company is a leading purchaser of charged-off consumer and commercial receivables in the accounts receivable management industry. Our primary business is the acquisition, management and collection of charged-off consumer and commercial accounts receivable that we purchase from financial institutions, finance and leasing companies, and other issuers in the United States ("U.S.") and Canada. In the U.S., we pursue recovery of accounts through our Closed Loop Network, a unique combination of company-owned call centers along with a network of regional law offices, also referred to as "branch offices", exclusively dedicated to SquareTwo. Branch offices pursue proceeds on purchased debt owned by the Company for a fee. Each of our branch offices is independently owned and has executed agreements that provide the legal structure for the exclusive relationship with SquareTwo. SquareTwo places newly acquired accounts for collection with its call centers operating under the subsidiary SquareTwo Financial Services Corporation d/b/a Fresh View Solutions ("Fresh View").
Our Canadian subsidiaries exclusively purchase and service charged-off Canadian accounts. We utilize a combination of a company-owned call center and third-party non-legal and legal collection firms to pursue recovery of our Canadian accounts.
2. Summary of Significant Accounting Policies
Going Concern
The accompanying consolidated financial statements included in this annual report have been prepared using the going concern assumption, which contemplates continuity of operations, realization of assets, and satisfaction of liabilities and commitments in the normal course of business. The accompanying consolidated financial statements do not reflect any adjustments that might result if the Company is unable to continue as a going concern. However, certain events described herein related to our senior revolving credit facility and outstanding Senior Second Lien Notes could impact our ability to continue as a going concern.
At December 31, 2015, our total liquidity to fund operations was $48.2 million, which consisted of non-restricted cash balances of $19.6 million and total availability under our senior revolving line of credit of $28.6 million. Our senior revolving credit facility, which had an outstanding balance of $134.8 million at December 31, 2015, originally matured on April 6, 2016. On April 5, 2016, the Company entered into Amendment No. 7 (“Amendment No. 7”) to the senior revolving credit facility. Pursuant to the terms of Amendment No. 7, the maximum commitment amount of the revolving credit facility was decreased from $245 million to $140 million, the term of the revolving credit facility was extended to April 29, 2016, and certain progress requirements related to the refinancing of the senior revolving credit facility were added. On April 20, 2016, the administrative agent for the senior revolving credit facility notified the Company of the occurrence of an event of default related to the Company’s failure to deliver a loan commitment to the administrative agent by April 18, 2016 for a refinancing in full of all obligations under the senior revolving credit facility. The administrative agent also reserved the rights of the administrative agent and lenders under the senior revolving credit facility. On April 20, 2016, the Company and a certain financial institution entered into a commitment letter setting forth the terms of a $165 million senior secured financing facility (the “New Financing Facility”). The obligation of the financial institution to provide the New Financing Facility is subject to certain conditions, including without limitation (i) the consummation of an exchange offer (the "Exchange Offer"), as further described below, in which the holders of at least 70% of the Company’s Senior Second Lien Notes exchange their outstanding Senior Second Lien Notes for participation in a 1.5 lien term loan and preferred stock of the Company, and (ii) the Company’s entry into a $30 million 1.25 lien term loan, at least $15 million of which will be funded on the closing date of the New Financing Facility. The Company expects to enter into definitive documentation for the New Financing Facility and borrow the full amount available thereunder concurrently with the settlement of the exchange offer discussed below. However, there can be no assurance that the
82
senior revolving line of credit facility will be further extended, modified, or replaced by a new facility, or that the financial institution commitment will be consummated and result in enhancing the Company’s liquidity.
Under the terms of the Senior Second Lien Notes, we were required to make a semi-annual bond interest payment in the amount of $16.9 million on April 1, 2016. The Company did not make the April 1 bond interest payment to the holders of the Senior Second Lien Notes while it has continued to negotiate with certain of the holders concerning financing alternatives to enhance the Company's liquidity. As of April 25, 2016, the Company has prepared an offering memorandum for the Exchange Offer along with a consent solicitation (the “Consent Solicitation”) to holders of the Senior Second Lien Notes and plans to commence the Exchange Offer upon the filing of this report. Participating holders will receive $620 principal amount of a new 1.5 lien term loan and $350 initial liquidation amount of a new class of preferred stock of the Company for each $1,000 principal amount of Senior Second Lien Notes tendered. In addition, holders who provide consents by the consent expiration time on May 6, 2016 (as may be extended by the Company) will receive an additional $30 principal amount of the 1.5 lien term loan for each $1,000 principal amount of Senior Second Lien Notes. The Exchange Offer and Consent Solicitation will be made upon the terms and subject to the conditions set forth in the offering memorandum for the Exchange Offer and Consent Solicitation statement and related consent and letter of transmittal. The Exchange Offer and Consent Solicitation will be subject to customary conditions, including there being tendered at least 70% of the aggregate principal amount of the Senior Second Lien Notes. The Exchange Offer will expire on or around May 20, 2016, unless extended by the Company. Concurrently with the commencement of the Exchange Offer, the Company plans to enter into a recapitalization support agreement with holders of more than 75% in aggregate principal amount of the Senior Second Lien Notes, which agreement sets for the obligations and commitments of the parties with respect to the proposed restructuring of the Company. However, there can be no assurance that the Exchange Offer will be consummated as described above.
Failure to pay the semi-annual bond interest for 30 days could cause us to suffer an event of default under the indenture governing our Senior Second Lien Notes. Failure to satisfy our obligations under the senior revolving credit facility could cause us to suffer an event of default, which could, among other things, lead to the amounts due thereunder becoming immediately due and payable. Moreover, because our debt obligations are represented by separate agreements with different parties, any event of default under our senior revolving credit facility may create an event of default under the indenture governing our Senior Second Lien Notes, resulting in the acceleration of our obligation to pay principal, interest and potential penalties under the Senior Second Lien Notes, even though we may otherwise be in compliance with all of our obligations under the indenture governing the Senior Second Lien Notes. Any event of default could also have an adverse impact on the Company's capital and operating leases, including early termination, mandatory prepayment, or repossession of equipment. Under current circumstances, if the Exchange Offer and the New Financing Facility are not consummated, it is unlikely that we would be able to obtain additional sources of capital to repay our debt obligations and it is likely that one or more of our lenders would proceed against the collateral securing that indebtedness. In addition, management currently projects that the Company will not be in compliance with the Adjusted EBITDA covenant of the senior revolving credit facility at March 31, 2016. Failure to comply with the covenant could cause us to suffer an event of default under the senior revolving credit facility.
The circumstances and events described above raise substantial doubt as to whether the Company will be able to continue as a going concern for a reasonable period of time. As a result, our independent public accounting firm has issued an opinion on our consolidated financial statements that states that the consolidated financial statements were prepared assuming we will continue as a going concern. However, this opinion further states that factors described above raise substantial doubt about our ability to continue as a going concern. Based upon the Company’s current financial condition as discussed above, management believes that the New Financing Facility and the Exchange Offer will need to be consummated in order for the Company to continue to operate as a going concern and to avoid (as is the Company’s preference) filing for protection under the U.S. Bankruptcy Code. For additional information, refer to our consolidated financial statements appearing elsewhere in this Annual Report on Form 10-K.
Principles of Consolidation
The consolidated financial statements of the Company have been prepared in accordance with U.S. generally accepted accounting principles ("GAAP") and include the accounts of SquareTwo and its subsidiaries. SquareTwo owns the following subsidiaries: ReFinance America, Ltd.; CACV of Colorado, LLC; CACH, LLC; Collect Air, LLC; Healthcare Funding Solutions, LLC; SquareTwo Financial Services Corporation (d/b/a Fresh View Solutions); Collect America of Canada, LLC, and certain other inactive entities not listed. Collect America of Canada, LLC has a wholly-owned subsidiary, SquareTwo Financial Canada Corporation, which has an 86% ownership interest in CCL Financial Inc. ("CCL"). CCL is a consolidated subsidiary of the Company. As previously disclosed, Parent owns 100% of the outstanding equity of SquareTwo and all other Parent investments are dormant. Expenses incurred by Parent on SquareTwo’s behalf have been allocated to SquareTwo and are reflected in the consolidated financial statements of SquareTwo. Intercompany transactions and balances have been eliminated in consolidation.
83
SquareTwo has two reportable operating segments, as defined by the Financial Accounting Standards Board's ("FASB") Accounting Standards Codification ("ASC") Topic 280, Segment Reporting: Domestic and Canada.
Accounting Estimates
The preparation of financial statements in conformity with GAAP requires management to make estimates and assumptions that affect the amounts reported in the financial statements and the accompanying notes. Actual results could differ from those estimates. The Company's consolidated financial statements are based on a number of significant estimates, including the collectability of purchased debt and the timing of such proceeds, impairment testing of goodwill and the branch office network intangible asset, and accounting for income taxes. Due to the uncertainties inherent in the estimation process, it is at least reasonably possible that the Company's estimates in connection with these items could be materially revised within the near term.
Cash and Cash Equivalents
The Company considers all highly liquid investments with a maturity date of 90 days or less from the date of acquisition to be cash and cash equivalents. The balance in cash and cash equivalents includes $19,266 and $15,677 held by our Canadian subsidiaries at December 31, 2015 and 2014, respectively.
Restricted Cash
Restricted cash primarily represents deposits from purchased debt collections, which under the Company's revolving line of credit further described in Note 6, pay down the line of credit balance on a daily basis based on funds available in the bank.
Concentrations of Risk
Financial instruments, which potentially expose the Company to concentrations of credit risk, consist primarily of cash and cash equivalents. The Company maintains cash balances with high-quality financial institutions. Management periodically evaluates the creditworthiness of such institutions.
Trade Receivables and Credit Policies
Trade receivables consist primarily of receivables from uncollateralized obligations due from branch offices. Payments on trade receivables are applied to the earliest unpaid invoices. Management reviews trade receivables periodically and reduces the carrying amount by a valuation allowance that reflects management's best estimate of the amount that may not be collectible.
Notes Receivable
The Company periodically extends credit to some of its branch offices and certain employees and records notes receivable for the amounts financed. The notes are both secured and unsecured and bear interest at interest rates that approximate prevailing market rates for similar loans.
Property and Equipment
Property and equipment is stated at cost, less accumulated depreciation. Depreciation on property and equipment is calculated using the straight-line method over the estimated useful life of the asset. Leasehold improvements are depreciated over the shorter of the estimated useful life of the improvement or the remaining term of the lease. The cost of normal maintenance and repairs is charged to operating expenses as incurred. Material expenditures which increase the life of an asset are capitalized and depreciated over the estimated remaining useful life of the asset.
Software Development and Maintenance Costs
The Company expenses normal and recurring software maintenance expenses and costs considered to be routine upgrades to its systems. The Company capitalizes internally developed software costs in accordance with ASC Subtopic 350-40, Internal-Use Software and amortizes those costs using the straight-line method over the estimated useful lives of the assets. Refer to Note 5 for additional discussion of internally developed software.
84
Goodwill and Intangible Assets
Intangible assets consist of goodwill and the value of the Company’s network of branch offices. Both were identified as part of purchase accounting at the date of the Acquisition. The value of the branch office network of $24.9 million was originally identified as an indefinite-lived intangible asset and has therefore not been subject to amortization. Goodwill represents the excess of the purchase price over the fair value of identifiable net assets acquired in a business combination. Refer to Note 4 for details on the 2015 impairment analysis.
Prepaid Assets
Prepaid assets consist primarily of support contracts related to information technology and prepaid insurance. Total prepaid assets were $1,533 and $1,762 as of December 31, 2015 and 2014, respectively, and are included in the other assets line item on the consolidated balance sheets.
Impairment of Long-Lived Assets
If facts and circumstances indicate that the cost of property and equipment or other long-lived assets may be impaired, an evaluation of recoverability of net carrying value is performed. If an evaluation is required, the estimated future undiscounted cash flows associated with the asset are compared to the asset's carrying amount to determine if a write-down to estimated fair value is required.
Income Taxes
The Company uses the liability method of accounting for income taxes in accordance with the authoritative guidance for income taxes. When the Company prepares its consolidated financial statements, it estimates income taxes based on the various jurisdictions where it conducts business. This requires the Company to estimate current tax exposure and to assess temporary differences that result from differing treatments of certain items for tax and accounting purposes. Deferred income taxes are recognized based on the difference between the consolidated financial statements and income tax bases of assets and liabilities using the enacted tax rates in effect for the year in which the differences are expected to reverse. The Company then assesses the likelihood that deferred tax assets will be realized. Valuation allowances are established, when necessary, to reduce deferred tax assets to the amount expected to be realized. When the Company establishes a valuation allowance or increases this allowance in an accounting period, it records a corresponding tax expense in the consolidated statements of operations. The Company includes interest and penalties related to the income taxes within its provision for income taxes. Refer to Note 9 for additional discussion of income taxes.
Management must make significant judgments to determine the provision for income taxes, deferred tax assets and liabilities, and any valuation allowance to be recorded against the deferred tax assets.
Fair Value of Financial Instruments
In accordance with the requirements of ASC Topic 825, Financial Instruments, the Company discloses the fair value of its financial instruments. The Company's financial instruments consist of cash and cash equivalents, accounts receivable, notes receivable, purchased debt, accounts payable, accrued expenses, line of credit, and notes payable. Refer to Note 8 for additional discussion on the fair value of financial instruments.
Revenue Recognition from Purchased Debt
Purchased debt represents receivables that have been charged-off as uncollectible by the originating organization and that may or may not have been subject to previous collection efforts. Through its subsidiaries, the Company purchases the rights to the unrecovered balances owed by individual customers from various financial institutions at a substantial discount from face value and records the purchase at the Company's cost to acquire the portfolio.
We account for our purchased debt under the guidance of ASC Subtopic 310-30, Loans and Debt Securities Acquired with Deteriorated Credit Quality ("ASC 310-30"). Under ASC 310-30, static pools of purchased debt may be established and accounted for under either the interest method of accounting (referred to by us as "level yield") or the cost recovery method of accounting. These pools are aggregated based on certain common risk criteria. Each static pool is recorded at cost and is accounted for as a single unit for the recognition of income, reduction of carrying value and any valuation allowance. Once a static pool is established, individual accounts are not added to or removed from the pool. Purchased debt accounted for under
85
our level yield method of accounting is pooled each quarter, whereas purchased debt accounted for under cost recovery is pooled by each individual purchase. The cost recovery method prescribed by ASC 310-30 is required when cash proceeds on a particular purchase cannot be reasonably predicted in timing or amount. Purchased debt accounted for under the cost recovery method is comprised of Canadian portfolios acquired prior to January 1, 2012, commercial, student loan, medical, and any other purchases in the U.S. or Canada for which we do not have the necessary experience to forecast the timing and amount of cash flows. For purchased debt that we believe we can reasonably forecast the timing and amount of our cash proceeds we utilize the level yield method.
Level Yield Method
Most of our purchased debt is accounted for under the level yield method of accounting. Under the level yield method of accounting, cash proceeds on each static pool are allocated to both revenue and to reduce the carrying value (the purchased debt, net line item on the consolidated balance sheets) based on an estimated gross internal rate of return ("IRR") for that pool. We determine the applicable IRR for each static pool based on our estimate of the expected cash proceeds of that pool which is based on our estimated remaining proceeds ("ERP") for the static pool, and the rate of return required to reduce the carrying value of that pool to zero over its estimated life. Each pool's IRR is typically determined using an expected life up to twelve years. As described below, if cash proceeds for a pool deviate from the forecast in timing or amount, we adjust the carrying value of the pool or its IRR (which determines our future revenue recognition), as applicable.
Purchased debt portfolios with similar economic characteristics accounted for under the level yield method are accumulated into static pools on a quarterly basis. Cash proceeds on a pool that are greater than the revenue recognized in accordance with the established IRR will reduce the carrying value of the static pool (also referred to as "amortization" of the pool). Cash proceeds on a pool that are lower than the revenue recognized in accordance with the established IRR will increase the carrying value of the static pool as required by ASC 310-30.
The expected trends of each pool are analyzed at least quarterly. If these trends are different than the original estimates, certain adjustments may be required. Each quarter, we use our ERP to determine our estimate of future cash proceeds for each pool. We consider all factors available, such as the types of assets within the pool, our experience with those assets, the age of the pool, any recent fluctuations in our recovery rates from the various channels we collect from, and where that pool is in its own collection life cycle. We use these factors for each static pool to determine a range of future proceeds, which becomes smaller as we gain more experience with each static pool. We determine our best estimate of future proceeds within that range, which may be used for adjustments to our revenue recognition, or for our determination of allowance charges.
Using our best estimate of future proceeds, if we estimate a reduction or delay in the receipt of the aggregate future cash proceeds on a pool, a valuation allowance may be recognized and the original IRR remains unchanged. The valuation allowance is determined to the extent that the present value (using the established IRR) of the revised future cash proceeds is less than the current carrying value of the pool. If we estimate an increase in the aggregate future cash proceeds or an acceleration of the timing of future cash proceeds on a pool, the IRR may be increased prospectively to reflect revised best estimates of those future cash proceeds over the remaining life of the pool. If there was a previous valuation allowance taken, reversal of the previously recognized valuation allowance occurs prior to any increases to the IRR. ASC 310-30 requires that each pool be evaluated independently and does not allow netting across pools. Thus, even in periods of increasing cash proceeds for our entire purchased debt portfolio, we may be required to record a valuation allowance. Allowance charges for purchased debt are included as adjustments to the purchased debt revenue, net line item in the consolidated statements of operations.
Canadian purchases made on or after January 1, 2012 are being accounted for under the level yield method unless we are unable to reasonably forecast the timing and amount of cash proceeds. Purchases eligible for the level yield method are being accumulated into static pools on a quarterly basis separately from U.S. purchases.
Cost Recovery Method
Treatment of cash proceeds under the cost recovery method differs from treatment under the level yield method. Under the cost recovery method, as cash proceeds, excluding court cost recoveries, less collection fees paid are received, they directly reduce the carrying value of the purchased debt. For every dollar recorded as a fee paid to the branch offices or third party collection firms, there is a corresponding dollar recorded as revenue in the purchased debt revenue, net line item in the consolidated statements of operations (i.e. the expense and revenue amounts are equal). Once the purchase's carrying value has been reduced to zero, all cash proceeds, excluding court cost recoveries, are recorded as revenues. Court cost recoveries received for purchased debt accounted for under the cost recovery method of accounting are netted against court cost expenditures in the court costs, net line item in the consolidated statements of operations. As compared to the level yield
86
method of accounting, the cost recovery method of accounting generally results in a more rapid reduction in the carrying value of purchased debt and slower recognition of revenue with respect thereto.
We assess our purchased debt accounted for under the cost recovery method at least annually, or more frequently if necessary, to determine if a valuation allowance is necessary. If the carrying value of a purchase is greater than our best estimate of future cash proceeds, excluding court cost recoveries, net of the fees expected to be paid for collections on that purchase, we record a valuation allowance for the difference. In the instance that our best estimate of future cash proceeds, excluding court cost recoveries, increases for a cost recovery purchase that had a valuation allowance previously recorded, we may reverse a portion or the entire valuation allowance, as estimates indicate. Similar to our process to determine our revenue recognition, or allowance charges for our level yield pools as described above, we use all factors available, and our ERP to determine our best estimate of future cash proceeds for our purchased debt accounted for under the cost recovery method.
Royalty Fees
Prior to June 2015, we earned royalties from our branch offices ranging from 2% to 4% of each dollar collected in the non-legal channels for the use of our proprietary collection platform, eAGLE. In conjunction with the new contractual arrangements with our branch offices, effective June 1, 2015, the Company no longer charges royalty fees as a percentage of each dollar collected.
Stock-Based Compensation
As permitted by the CA Holding 2005 Equity Incentive Plan ("Equity Plan"), Parent periodically grants stock options to SquareTwo employees, officers, directors, and branch office owners. Stock options granted to employees, officers, directors, and branch office owners are options on the equity of Parent. The Equity Plan permits the granting of authorized, but unissued, or reacquired shares of Parent stock to satisfy exercises of options. The stock options generally vest over one to five years of continuous service, and have 10-year contractual terms. Employee and director stock option fair values are determined using the Black-Scholes option pricing model at the grant date of each option and includes estimates of forfeitures. Stock option compensation expense is recognized on a straight-line basis over the vesting period for options that vest based on time of service only. Options granted to branch office owners are considered to be granted to non-employees and require variable accounting; therefore, they are revalued as they vest and the amount of expense is based upon the revalued amount. Employee, branch office and director stock option compensation expense is recorded in the salaries and payroll taxes line item, purchased debt expense line item, and general and administrative line item in the consolidated statements of operations, respectively. No stock options were exercised in the periods presented.
Comprehensive Income (Loss)
Comprehensive income (loss) is defined as all changes in stockholder's equity, exclusive of transactions with stockholders, such as capital investments. Comprehensive income (loss) includes net income (loss), and changes in certain assets and liabilities that are reported directly in equity such as translation adjustments on investments in foreign subsidiaries.
Marketing Expenses
The Company expenses marketing costs as incurred. Marketing expense was $807, $1,304, and $972 for the years ended December 31, 2015, 2014, and 2013, respectively.
Earnings Per Share
The Company does not report net income or loss of the Company on a per share basis due to its equity being privately held.
Reclassifications
Certain reclassifications have been made to the previously disclosed 2013 fiscal year amounts in order to conform to the current year presentation. The Company has revised the presentation of its consolidated statements of operations for all the periods presented to provide improved visibility and comparability with the current year presentation. Other direct operating expenses, previously a separate line item for the year ended December 31, 2013 consolidated statements of operations, of $17,551 has been reclassified to purchased debt expense.
87
Restructuring
As part of the Company's cost reduction initiatives, the Company incurred $0.7 million in severance and related benefit expenses during the third quarter of 2015 in connection with a reduction in force. At December 31, 2015, no amount accrued was outstanding.
Recently Issued Accounting Pronouncements
In May 2014, the FASB and the IASB issued Accounting Standards Update ("ASU") No. 2014-09, Revenue from Contracts with Customers (Topic 606). ASU No. 2014-09 is a comprehensive new revenue recognition standard that supersedes virtually all existing revenue guidance under GAAP and IFRS. The standard’s core principle is that a company will recognize revenue when it transfers promised goods or services to customers in an amount that reflects the consideration to which the company expects to be entitled in exchange for those goods or services. In doing so, companies will need to use more judgment and make more estimates than under current guidance. The effective date of the new standard was deferred by one year by ASU No. 2015-14. The standard, which does not apply to financial instruments, is now effective for annual reporting periods beginning after December 15, 2017, including interim periods within that reporting period and early adoption is permitted for periods beginning after December 15, 2016. The Company is in the process of determining the impact this standard may have on its consolidated financial statements.
In August 2014, the FASB issued ASU No. 2014-15, Presentation of Financial Statements-Going Concern (Subtopic 205-40): Disclosure of Uncertainties about an Entity’s Ability to Continue as a Going Concern. ASU No. 2014-15 provides guidance about management's responsibility to evaluate whether there is substantial doubt about an entity's ability to continue as a going concern at each annual and interim reporting period, and to provide related footnote disclosures. This update will be effective for the Company for the annual period ending after December 15, 2016.
In February 2015, the FASB issued ASU No. 2015-02, Consolidation (Topic 810): Amendments to the Consolidation Analysis. ASU No. 2015-02 amends current consolidation guidance, affecting the evaluation of whether certain legal entities should be consolidated. All legal entities are subject to reevaluation under the revised consolidation model. The Company is evaluating this ASU to determine whether any of our current conclusions with respect to consolidation of legal entities will change under the new guidance; however, we do not anticipate any material impact to our consolidated financial statements and related disclosures. This update will be effective for the Company for the annual period beginning after December 15, 2015 and for interim periods within that period.
In April 2015, the FASB issued ASU No. 2015-03, Interest—Imputation of Interest (Subtopic 835-30): Simplifying the Presentation of Debt Issuance Costs. ASU No. 2015-03 requires entities to present debt issuance costs related to a recognized debt liability as a direct deduction from the carrying value of that debt liability and will therefore impact our presentation of debt issuance costs when implemented. The recognition and measurement guidance for debt issuance costs is not impacted by ASU No. 2015-03. This update will be effective for the Company for the annual period beginning after December 15, 2015 and for interim periods within that period.
In April 2015, the FASB issued ASU No. 2015-05, Intangibles—Goodwill and Other—Internal-Use Software (Subtopic 350-40): Customer's Accounting for Fees Paid in a Cloud Computing Arrangement. ASU 2015-05 provides guidance for customers to determine whether a cloud computing arrangement includes a software license to be accounted for consistent with the acquisition of other software licenses. Cloud computing arrangements that do not include a software license shall be accounted for as service contracts. This update will be effective for the Company for the annual period beginning after December 15, 2015 and for interim periods within that reporting period. The Company will adopt this update prospectively for any cloud computing arrangements entered into or materially modified after the effective date.
In August 2015, the FASB issued ASU No. 2015-15, Interest — Imputation of Interest (Subtopic 835-30): Presentation and Subsequent Measurement of Debt Issuance Costs Associated with Line-of-Credit Arrangements — Amendments to SEC Paragraphs Pursuant to Staff Announcement at June 18, 2015 EITF Meeting ASU 2015-15. In particular, ASU 2015-15 clarifies that the SEC would not object to an entity deferring and presenting debt issuance costs related to a line-of-credit arrangement as an asset and subsequently amortizing the deferred debt issuance costs ratably over the term of such arrangement, regardless of whether there are any outstanding borrowings on the line-of-credit arrangement. ASU 2015-15 is effective concurrently with ASU 2015-03 and will not materially impact our presentation of debt issuance costs upon adoption.
In January 2016, the FASB issued ASU 2016-01, Financial Instruments–Overall: Recognition and Measurement of
88
Financial Assets and Financial Liabilities (“ASU 2016-01”), which makes a number of changes to the current GAAP model, including changes to the accounting for equity investments and financial liabilities under the fair value option, and the presentation and disclosure requirements for financial instruments. ASU 2016-01 is effective beginning after December 15, 2017 and we are currently assessing the impact the adoption will have on our consolidated financial statements.
In February 2016, the FASB issued ASU 2016-02, Leases (Topic 842) ("ASU 2016-02"), which requires that lessees recognize assets and liabilities on the balance sheet for the rights and obligations created by all leases with terms of more than twelve months. The ASU also will require disclosures designed to give financial statement users information on the amount, timing, and uncertainty of cash flows arising from leases. These disclosures include qualitative and quantitative information. ASU 2016-02 is effective for fiscal years, and interim periods within those fiscal years, beginning after December 15, 2018 and we are evaluating the impact the adoption will have on our consolidated financial statements.
3. Purchased Debt
The following table shows the changes in purchased debt, net for the periods presented:
Level Yield | Cost Recovery | Totals | ||||||||||||||||||||||||||||||||||
Year Ended December 31, | Year Ended December 31, | Year Ended December 31, | ||||||||||||||||||||||||||||||||||
2015 | 2014 | 2013 | 2015 | 2014 | 2013 | 2015 | 2014 | 2013 | ||||||||||||||||||||||||||||
Balance at beginning of period | $ | 206,642 | $ | 254,419 | $ | 230,773 | $ | 16,058 | $ | 19,938 | $ | 20,909 | $ | 222,700 | $ | 274,357 | $ | 251,682 | ||||||||||||||||||
Purchases | 72,082 | 115,448 | 238,332 | 26,165 | 11,299 | 19,778 | 98,247 | 126,747 | 258,110 | |||||||||||||||||||||||||||
Valuation allowance reversals (charges) | 7,928 | 326 | 10,518 | (1,209 | ) | (2,110 | ) | (3,870 | ) | 6,719 | (1,784 | ) | 6,648 | |||||||||||||||||||||||
Proceeds applied to purchased debt principal | (137,918 | ) | (162,353 | ) | (224,396 | ) | (19,582 | ) | (13,342 | ) | (17,165 | ) | (157,500 | ) | (175,695 | ) | (241,561 | ) | ||||||||||||||||||
Other(1) | (2,730 | ) | (1,198 | ) | (808 | ) | 58 | 273 | 286 | (2,672 | ) | (925 | ) | (522 | ) | |||||||||||||||||||||
Balance at end of period | $ | 146,004 | $ | 206,642 | $ | 254,419 | $ | 21,490 | $ | 16,058 | $ | 19,938 | $ | 167,494 | $ | 222,700 | $ | 274,357 | ||||||||||||||||||
(1) Other includes impacts of the Company’s currency translation, branch office asset purchase program (discontinued), and recovery of step-up in basis on purchased debt.
The following table shows the relationship of purchased debt proceeds to gross revenue recognized and proceeds applied to principal for the periods presented:
Level Yield | Cost Recovery | Totals | ||||||||||||||||||||||||||||||||||
Year Ended December 31, | Year Ended December 31, | Year Ended December 31, | ||||||||||||||||||||||||||||||||||
2015 | 2014 | 2013 | 2015 | 2014 | 2013 | 2015 | 2014 | 2013 | ||||||||||||||||||||||||||||
Proceeds | $ | 298,784 | $ | 370,748 | $ | 502,122 | $ | 54,364 | $ | 49,384 | $ | 61,587 | $ | 353,148 | $ | 420,132 | $ | 563,709 | ||||||||||||||||||
Less: | ||||||||||||||||||||||||||||||||||||
Gross revenue recognized | 160,866 | 208,395 | 277,726 | 33,564 | 34,819 | 43,043 | 194,430 | 243,214 | 320,769 | |||||||||||||||||||||||||||
Cost recovery court cost recoveries(1) | — | — | — | 1,218 | 1,223 | 1,379 | 1,218 | 1,223 | 1,379 | |||||||||||||||||||||||||||
Proceeds applied to purchased debt principal | 137,918 | 162,353 | 224,396 | 19,582 | 13,342 | 17,165 | 157,500 | 175,695 | 241,561 | |||||||||||||||||||||||||||
$ | — | $ | — | $ | — | $ | — | $ | — | $ | — | $ | — | $ | — | $ | — | |||||||||||||||||||
(1) Cost recovery court cost recoveries are recorded as a contra expense in the court costs, net line item in the consolidated statements of operations.
89
The following table reconciles gross revenue recognized to purchased debt revenue, net for the periods presented:
Level Yield | Cost Recovery | Totals | ||||||||||||||||||||||||||||||||||
Year Ended December 31, | Year Ended December 31, | Year Ended December 31, | ||||||||||||||||||||||||||||||||||
2015 | 2014 | 2013 | 2015 | 2014 | 2013 | 2015 | 2014 | 2013 | ||||||||||||||||||||||||||||
Gross revenue recognized | $ | 160,866 | $ | 208,395 | $ | 277,726 | $ | 33,564 | $ | 34,819 | $ | 43,043 | $ | 194,430 | $ | 243,214 | $ | 320,769 | ||||||||||||||||||
Purchased debt royalties(1) | 1,443 | 5,219 | 9,228 | 197 | 543 | 1,204 | 1,640 | 5,762 | 10,432 | |||||||||||||||||||||||||||
Valuation allowance reversals (charges) | 7,928 | 326 | 10,518 | (1,209 | ) | (2,110 | ) | (3,870 | ) | 6,719 | (1,784 | ) | 6,648 | |||||||||||||||||||||||
Other(2) | — | — | — | (178 | ) | (157 | ) | (271 | ) | (178 | ) | (157 | ) | (271 | ) | |||||||||||||||||||||
Purchased debt revenue, net | $ | 170,237 | $ | 213,940 | $ | 297,472 | $ | 32,374 | $ | 33,095 | $ | 40,106 | $ | 202,611 | $ | 247,035 | $ | 337,578 | ||||||||||||||||||
(1) In conjunction with the new contractual arrangements with our branch offices, effective June 1, 2015, the Company no longer charges royalty fees on collections.
(2) Other items relate to certain profit sharing items that reduce the Company’s revenue recorded on purchased debt, the branch office asset purchase program (discontinued), and recovery of step-up in basis.
The following table shows the detail of the Company’s purchases for the periods presented:
Level Yield | Cost Recovery | Totals | ||||||||||||||||||||||||||||||||||
Year Ended December 31, | Year Ended December 31, | Year Ended December 31, | ||||||||||||||||||||||||||||||||||
2015 | 2014 | 2013 | 2015 | 2014 | 2013 | 2015 | 2014 | 2013 | ||||||||||||||||||||||||||||
Purchase price | $ | 72,082 | $ | 115,448 | $ | 238,332 | $ | 26,165 | $ | 11,299 | $ | 19,778 | $ | 98,247 | $ | 126,747 | $ | 258,110 | ||||||||||||||||||
Face value | 925,568 | 999,235 | 2,373,306 | 211,633 | 224,625 | 450,368 | 1,137,201 | 1,223,860 | 2,823,674 | |||||||||||||||||||||||||||
% of face | 7.8 | % | 11.6 | % | 10.0 | % | 12.4 | % | 5.0 | % | 4.4 | % | 8.6 | % | 10.4 | % | 9.1 | % | ||||||||||||||||||
Accretable yield represents the difference between the ERP of our purchased debt accounted for under the level yield method and the carrying value of those assets. The ERP is used in determining our revenue recognition, and adjustments to our revenue recognition, for our purchased debt accounted for under the level yield method, which is described in further detail in Note 2.
During the year ended December 31, 2015, the Company purchased $925.6 million in face value debt that qualified for the level yield method of accounting for a purchase price of $72.1 million. The ERP expected at acquisition for these level yield portfolios amounted to $136.7 million. The accretable yield for these purchases was $64.6 million, or the ERP of $136.7 million less the purchase price of $72.1 million.
The following table represents the change in accretable yield for the periods presented:
Year Ended December 31, | ||||||||
2015 | 2014 | |||||||
Balance at December 31, prior year | $ | 389,803 | $ | 523,006 | ||||
Impact from revenue recognized on purchased debt, net | (168,794 | ) | (208,721 | ) | ||||
Additions from current purchases | 64,577 | 64,624 | ||||||
Reclassifications to accretable yield, including foreign currency translation | 54,670 | 10,894 | ||||||
Balance at December 31, | $ | 340,256 | $ | 389,803 | ||||
The following table shows the changes in the valuation allowance for the Company’s purchased debt for the periods presented:
Level Yield | Cost Recovery | Totals | ||||||||||||||||||||||||||||||||||
Year Ended December 31, | Year Ended December 31, | Year Ended December 31, | ||||||||||||||||||||||||||||||||||
2015 | 2014 | 2013 | 2015 | 2014 | 2013 | 2015 | 2014 | 2013 | ||||||||||||||||||||||||||||
Balance at beginning of period | $ | 125,758 | $ | 126,084 | $ | 136,602 | $ | 19,694 | $ | 17,584 | $ | 13,714 | $ | 145,452 | $ | 143,668 | $ | 150,316 | ||||||||||||||||||
Valuation allowance (reversals) charges | (7,928 | ) | (326 | ) | (10,518 | ) | 1,209 | 2,110 | 3,870 | (6,719 | ) | 1,784 | (6,648 | ) | ||||||||||||||||||||||
Balance at end of period | $ | 117,830 | $ | 125,758 | $ | 126,084 | $ | 20,903 | $ | 19,694 | $ | 17,584 | $ | 138,733 | $ | 145,452 | $ | 143,668 | ||||||||||||||||||
4. Goodwill and Intangible Assets
Intangible assets consist of goodwill and the value of the Company’s network of branch offices. Both were identified as part of purchase accounting at the date of the Acquisition. The value of the branch office network was originally identified as an indefinite-lived intangible asset and has therefore not been subject to amortization until the fourth quarter of 2015. Goodwill represents the excess of the purchase price over the fair value of identifiable net assets acquired in a business combination.
We have two operating segments: Domestic and Canada. In accordance with FASB ASC Topic 350, Intangibles-Goodwill and Other, we have deemed our operating segments to be reporting units for the purpose of testing goodwill for impairment.
The following is a summary of intangible assets as of the dates presented:
Domestic Goodwill | Domestic Branch Office Intangible | Canada Goodwill | Total Goodwill and Intangible Assets | |||||||||||||
December 31, 2014 | $ | 145,889 | $ | 24,890 | $ | 569 | $ | 171,348 | ||||||||
Foreign currency adjustment | — | — | (106 | ) | (106 | ) | ||||||||||
Impairment | (74,016 | ) | (10,590 | ) | — | (84,606 | ) | |||||||||
Amortization expense | N/A | (179 | ) | N/A | (179 | ) | ||||||||||
December 31, 2015 | $ | 71,873 | $ | 14,121 | $ | 463 | $ | 86,457 | ||||||||
The Company tests its indefinite-lived intangibles annually for impairment unless there is a triggering event during an interim period that would necessitate testing. We initially assessed goodwill for impairment as of September 30, 2015 due to the then projected non-compliance with the Adjusted EBITDA covenant for the fourth quarter ended December 31, 2015, as well as other factors, which represented indicators of impairment and triggered the interim test. As a result of the first step of our interim goodwill impairment test performed on both segments, we concluded that the fair value of the Domestic reporting unit did not exceed its carrying value, suggesting the $145.9 million of goodwill assigned to this reporting unit, or a portion thereof, could be impaired. However, due to the time involved in engaging a third party valuation firm and completing the step two goodwill analysis, we were unable to perform the theoretical purchase price allocation for the domestic reporting unit until we were engaged in the preparation of our annual consolidated financial statements.
As prescribed by ASC 350, step two of the impairment test requires that we perform a theoretical purchase price allocation for the Domestic reporting unit to determine the implied fair value of goodwill. If the implied fair value of goodwill, after considering the fair values of remaining assets and liabilities, is less than the recorded amount on the balance sheet, an
90
impairment is recorded. Since goodwill represents the difference between the fair value of the reporting unit, on a debt free basis, and the fair value of its assets and liabilities, any increase in the fair value of the assets decreases the amount of goodwill implied by the fair value of the reporting unit. Similarly, any increase in the fair value of the reporting unit’s liabilities increases the amount of goodwill supported by the reporting unit. The Company's step two analysis indicates that the fair value of the Domestic reporting unit’s assets, excluding the branch office network intangible, was approximately $57.0 million higher than the carrying value, primarily due to the increase in the value of the purchased debt asset. Partially offsetting this is an increase of approximately $24.6 million in the reporting unit’s liabilities primarily attributable to the deferred tax impact associated with the increase in the fair value of the assets. As a result of the completed analysis, which included a material increase in the fair value of purchased debt and other assets, a non-cash goodwill impairment charge of $74.0 million and a non-cash impairment charge of $10.6 million, before a tax benefit of $4.0 million, related to the branch office intangible, were recorded in the fourth quarter of 2015. These impairment charges represent a substantial impairment of goodwill and the branch office intangible, respectively, and are recorded in the impairments of goodwill and intangible assets line item on the consolidated statements of operations.
We engaged a third party appraisal firm to assist us in determining the fair value of the Company, including the fair values of the Domestic and Canada segments, using a probability weighted expected return method which considered common valuation techniques including income, market and cost approaches. Assumptions critical to the process included forecasted financial information, discount rates, estimation of replacement costs, and analysis of data from market competitors. Inherent in the operating forecasts are certain assumptions regarding cash collection and other metrics including, revenue growth rates, projected cost saving initiatives and projected long-term growth rates in the determination of terminal values. The Company determined the fair value of the branch office network using the replacement cost method. As part of this methodology, management made a number of assumptions regarding both internal and external resources that would be required to recreate the network, including but not limited to, recruitment and on-boarding of partners, development of the technology and compliance framework, excluding the cost of the eAGLE system which was valued separately, based on which the network operates and currently provides the Closed Loop competitive advantage. The branch office network was originally valued in 2005 at the date of the Acquisition. The 2005 valuation was performed before the rationalization of the Company’s legal network to meet the evolving regulatory environment. This has involved the elimination of multiple legal offices as the Company regionalized its legal efforts, providing increased regulatory oversight and control. The estimates of the fair values of the intangible assets are based on the best information currently available; however, further adjustments may be necessary in the future if conditions differ substantially from the assumptions utilized. This fair value determination was categorized as Level 3 in the fair value hierarchy: refer to Note 8 for the definition of Level 3 inputs.
In conjunction with the fair value assessment of the Company as of September 30, 2015, the Company also reassessed certain underlying assumptions regarding the estimated useful life of the domestic branch office intangible asset. The assessment resulted in the Company changing the estimated useful life from indefinite-lived to finite lived, commencing in the fourth quarter of 2015. The indefinite life conclusion was originally determined in 2005, and while the branch office network remains a critical element of the Company's strategy and its unique operating structure in the industry, the ongoing and potential future changes in the industry preclude the Company from asserting the indefinite life assertion at this point. After recording the $10.6 million impairment to the intangible asset, the Company assigned a life of 20 years to the remaining asset value which is being amortized to the depreciation and amortization expense line item on the consolidated statements of operations on a straight-line basis beginning with the fourth quarter of 2015. The Company incurred $0.2 million in amortization expense related to the branch office intangible as of December 31, 2015.
Year Ended December 31, | ||||
Domestic Branch Office Intangible | 2015 (1) | |||
Gross carrying amount | $ | 14,300 | ||
Accumulated amortization | (179 | ) | ||
Net book value | $ | 14,121 | ||
(1) As of September 30, 2015 the branch office intangible asset changed from indefinite-lived to finite lived.
91
As of December 31, 2015, amortization expense for the next five years is expected to be as follows:
Amortization Expense | ||||
2016 | $ | 715 | ||
2017 | 715 | |||
2018 | 715 | |||
2019 | 715 | |||
2020 | 715 | |||
Thereafter | 10,546 | |||
Total future amortization expense | 14,121 | |||
As of December 31, 2015, the remaining amortization period is 19.75 years.
5. Property and Equipment
Property and equipment consisted of the following as of the dates presented:
December 31, | ||||||||
2015 | 2014 | |||||||
Computer equipment and software | $ | 55,934 | $ | 50,814 | ||||
Furniture and fixtures | 393 | 399 | ||||||
Leasehold improvements | 1,719 | 1,719 | ||||||
58,046 | 52,932 | |||||||
Less accumulated depreciation and amortization | (34,601 | ) | (29,743 | ) | ||||
Balance at end of period | $ | 23,445 | $ | 23,189 | ||||
Property and equipment is stated at cost, less accumulated depreciation. Depreciation is calculated using the straight-line method over the estimated useful life of the asset. Leasehold improvements are depreciated over the shorter of the estimated useful life of the improvement or the remaining term of the lease. Depreciation expense was $3,270, $3,864, and $3,018 for the years ended December 31, 2015, 2014, and 2013, respectively.
Included in the computer equipment and software category are capitalized internally developed software costs with a gross carrying value of $39,206 and $36,571 and accumulated amortization of $20,577 and $18,460 at December 31, 2015 and 2014, respectively. For the years ended December 31, 2015 and 2014, property and equipment included capitalized interest costs related to internally developed software of $88 and $85, respectively. Internally developed software begins amortizing when it is determined to be ready for its intended use and amortizes over the economic life. Subsequent additional development on a project is amortized over the remaining useful life. Amortization expense on the internally developed software was $3,304, $3,019, and $4,968 for the years ended December 31, 2015, 2014, and 2013, respectively. The estimated future aggregate amortization expense on internally developed software is $4,148, $4,148, $4,148, $3,093, and $3,093 over the succeeding five years.
Also included in the computer equipment and software category are assets financed under capital leases with a gross carrying value of $6,176 and $6,485, and accumulated amortization of $2,851 and $4,117, respectively, for the years ended December 31, 2015 and 2014, respectively. Amortization of computer equipment and software financed under capital leases is included in depreciation expense.
6. Notes Payable and Other Borrowings
Subsequent Events and Recent Developments
At December 31, 2015, our total liquidity to fund operations was $48.2 million, which consisted of non-restricted cash balances of $19.6 million and total availability under our senior revolving line of credit of $28.6 million. Our senior revolving credit facility, which had an outstanding balance of $134.8 million at December 31, 2015, originally matured on April 6, 2016. On April 5, 2016, the Company entered into Amendment No. 7 to the senior revolving credit facility. Pursuant to the terms of Amendment No. 7, the maximum commitment amount of the revolving credit facility was decreased from $245 million to $140
92
million, the term of the revolving credit facility was extended to April 29, 2016, and certain progress requirements related to the refinancing of the senior revolving credit facility were added. On April 20, 2016, the administrative agent for the senior revolving credit facility notified the Company of the occurrence of an event of default related to the Company’s failure to deliver a loan commitment to the administrative agent by April 18, 2016 for a refinancing in full of all obligations under the senior revolving credit facility. The administrative agent also reserved the rights of the administrative agent and lenders under the senior revolving credit facility. On April 20, 2016, the Company and a certain financial institution entered into a commitment letter setting forth the terms of a $165 million New Financing Facility. The obligation of the financial institution to provide the New Financing Facility is subject to certain conditions, including without limitation (i) the consummation of an Exchange Offer, as further described below, in which the holders of at least 70% of the Company’s Senior Second Lien Notes exchange their outstanding Senior Second Lien Notes for participation in a 1.5 lien term loan and preferred stock of the Company, and (ii) the Company’s entry into a $30 million 1.25 lien term loan, at least $15 million of which will be funded on the closing date of the New Financing Facility. The Company expects to enter into definitive documentation for the New Financing Facility and borrow the full amount available thereunder concurrently with the settlement of the Exchange Offer discussed below. However, there can be no assurance that the senior revolving line of credit facility will be further extended, modified, or replaced by a new facility, or that the financial institution commitment will be consummated and result in enhancing the Company’s liquidity.
Under the terms of the Senior Second Lien Notes, we were required to make a semi-annual bond interest payment in the amount of $16.9 million on April 1, 2016. The Company did not make the April 1 bond interest payment to the holders of the Senior Second Lien Notes while it has continued to negotiate with certain of the holders concerning financing alternatives to enhance the Company's liquidity. As of April 25, 2016, the Company announced the commencement of an Exchange Offer and Consent Solicitation to holders of the Senior Second Lien Notes and plans to commence the Exchange Offer upon filing of this report. Participating holders will receive $620 principal amount of a new 1.5 lien term loan and $350 initial liquidation amount of a new class of preferred stock of the Company for each $1,000 principal amount of Senior Second Lien Notes tendered. In addition, holders who provide consents by the consent expiration time on May 6, 2016 (as may be extended by the Company) will receive an additional $30 principal amount of the 1.5 lien term loan for each $1,000 principal amount of Senior Second Lien Notes. The Exchange Offer and Consent Solicitation are being made upon the terms and subject to the conditions set forth in the offering memorandum for the Exchange Offer and Consent Solicitation statement and related consent and letter of transmittal. The Exchange Offer and Consent Solicitation are subject to customary conditions, including there being tendered at least 70% of the aggregate principal amount of the Senior Second Lien Notes. The Exchange Offer will expire on or around May 20, 2016, unless extended by the Company. Concurrently with the commencement of the Exchange Offer, the Company entered into a recapitalization support agreement with holders of more than 75% in aggregate principal amount of the Senior Second Lien Notes, which agreement sets for the obligations and commitments of the parties with respect to the proposed restructuring of the Company. However, there can be no assurance that the Exchange Offer will be consummated as described above.
Failure to pay the semi-annual bond interest for 30 days could cause us to suffer an event of default under the indenture governing our Senior Second Lien Notes. Failure to satisfy our obligations under the senior revolving credit facility could cause us to suffer an event of default, which could, among other things, lead to the amounts due thereunder becoming immediately due and payable. Moreover, because our debt obligations are represented by separate agreements with different parties, any event of default under our senior revolving credit facility may create an event of default under the indenture governing our Senior Second Lien Notes, resulting in the acceleration of our obligation to pay principal, interest and potential penalties under the Senior Second Lien Notes, even though we may otherwise be in compliance with all of our obligations under the indenture governing the Senior Second Lien Notes. Any event of default could also have an adverse impact on the Company's capital and operating leases, including early termination, mandatory prepayment, or repossession of equipment. In addition, management currently projects that the Company will not be in compliance with the Adjusted EBITDA covenant of the senior revolving credit facility at March 31, 2016. Failure to comply with the covenant could cause us to suffer an event of default under the senior revolving credit facility.
93
Line of Credit
The following is a listing of the Company’s outstanding line of credit borrowings, balances, and interest rates under the revolving credit facility as of the dates presented:
December 31, 2015 | December 31, 2014 | |||||||||||||||||
Type of Debt | Weighted Average Interest Rate(1) | Balance | Maturity | Weighted Average Interest Rate(1) | Balance | Maturity | ||||||||||||
Line of Credit US | 4.8 | % | $ | 134,831 | April 2016 | 4.8 | % | $ | 138,702 | April 2016 | ||||||||
Line of Credit Canada | N/A | — | April 2016 | N/A | — | April 2016 | ||||||||||||
Total Line of Credit | $ | 134,831 | $ | 138,702 | ||||||||||||||
(1) Weighted average interest rates exclude the impact of the amortization of fees associated with the origination of these instruments.
The Company capitalized $567 during the years ended December 31, 2014, in connection with amendments to the Loan Agreement completed in 2014. The remaining unamortized costs of the facility were $339 and $1,443 at December 31, 2015 and 2014, respectively, and are included in the other assets line item on the consolidated balance sheets. These costs are amortized on a straight-line basis over the remaining term of the facility.
The Company had accrued interest on its line of credit of $86 and $81 at December 31, 2015 and 2014, respectively, which are included in the accrued interest and other liabilities line item on the consolidated balance sheets.
The following represents the terms of the Company's outstanding line of credit borrowings as of December 31, 2015:
Type of Debt and Maximum Commitment | Collateral | Interest Rate Terms | Fees | Payment Terms | Maturity(1) | |||||
Domestic Line of Credit; maximum commitment $245.0 million subject to borrowing on Canadian Line of Credit and other terms.(1) | Substantially all assets of SquareTwo, its U.S. guarantor subsidiaries, and its Canadian subsidiaries. | Option of (1) Base Rate, highest of (a) the Bank Prime Loan rate, (b) the Federal Funds rate plus 0.50%, (c) one-month LIBOR plus 1.00%, or (d) 2.00%, plus a margin of 2.75%; or (2) LIBOR Rate, higher of (a) LIBOR or (b) 1.00%, plus a margin of 3.75%. | Unused line fees of 0.50%. | Due at maturity. | April 6, 2016 | |||||
Canadian Line of Credit; maximum commitment $24.7 million subject to borrowing on U.S. Line of Credit and other terms. | Substantially all assets of the Company. | Option of (1) Canadian Index Rate, the highest of (a) the reference rate for commercial Canadian loans, (b) the Canadian 30-day BA rate plus 1.00%, or (c) 2.00%, plus a margin of 2.75%; or (2) Canadian BA Rate, higher of (a) the Canadian BA rate, or (b) 1.00%, plus a margin of 4.25%. | Unused line fees of 0.50%. | Due at maturity. | April 6, 2016 | |||||
Notes Payable
The following is a listing of the Company’s outstanding notes payable borrowings, balances, and interest rates as of the dates presented:
December 31, 2015 | December 31, 2014 | |||||||||||||||||
Type of Debt | Weighted Average Interest Rate(1) | Balance | Maturity | Weighted Average Interest Rate(1) | Balance | Maturity | ||||||||||||
Senior Second Lien Notes, net of $912 and $1,631 unamortized discount | 11.625 | % | $ | 289,088 | April 2017 | 11.625 | % | $ | 288,369 | April 2017 | ||||||||
Other Notes Payable | 8.00 | % | 260 | 2016 - 2021 | 5.50 | % | 1,001 | 2015 - 2021 | ||||||||||
Total Notes Payable | $ | 289,348 | $ | 289,370 | ||||||||||||||
(1) Weighted average interest rates exclude the impact of the amortization of fees associated with the origination of these instruments.
94
The remaining unamortized costs of the Senior Second Lien Notes were $1,623 and $2,904 at December 31, 2015 and 2014, respectively, and are included in the other assets line item on the consolidated balance sheets. These costs are amortized on a straight-line basis over the remaining term of the notes.
The Company had accrued interest on its Senior Second Lien Notes payable of $8,428 at December 31, 2015 and 2014, which is included in the accrued interest and other liabilities line item on the consolidated balance sheets.
The following represents the terms of the Company's notes payable as of December 31, 2015:
Type of Debt | Guarantee/Collateral | Interest Rate Terms | Repayment Terms | |||
Senior Second Lien Notes | Jointly and severally guaranteed by substantially all of SquareTwo's existing and future domestic subsidiaries. Guarantees are secured by a second priority lien by substantially all of the guarantors' assets. | 11.625% annual interest paid semi-annually in cash, on April 1 and October 1. | Mandatory redemption not required. Optional redemption permitted at any time, in whole or in part, subject to certain redemption prices and make-whole premiums based on the date of the redemption. | |||
Other Notes | Underlying stock and computer equipment | Fixed interest rates at a weighted average rate of 8.00%. | Due in monthly or quarterly principal and interest payments through maturity based on contractual terms. | |||
Covenants
The senior revolving credit facility, as amended, and the Senior Second Lien Notes have certain covenants and restrictions, as is customary for such facilities, with which the Company must comply. Some of the financial covenants under the revolving credit facility include: minimum Adjusted EBITDA, capital expenditure limits, and maximum operating lease obligations. The minimum Adjusted EBITDA covenant, as defined in detail in the revolving credit facility agreement is $165 million for each of the trailing twelve month periods beginning with the fiscal quarter ending December 31, 2014. The maximum capital expenditures covenant for any fiscal year, as further described in the revolving credit facility agreement, is $8.0 million and is subject to provisions set forth in the agreement. Maximum aggregate rent expense and certain other operating lease obligations, excluding a certain operating lease, are $3.0 million in any fiscal year. Both the credit facility and the indenture also contain covenants that limit, among other restrictions, the Company's ability to incur additional indebtedness, sell or transfer certain assets, declare or pay dividends or make certain investments. All covenants and restrictions, including the aforementioned covenants and restrictions are further detailed in the senior revolving credit facility and the Senior Second Lien Notes agreements. As of December 31, 2015, the Company was in compliance with all covenants and restrictions of the senior revolving credit facility and Senior Second Lien Notes.
Letters of Credit
The Company had outstanding letters of credit at December 31, 2015 and 2014 totaling $2,492 and $492, respectively, which had not been drawn on and remained outstanding. The letters of credit have been issued to provide support in connection with our licensing applications.
Scheduled Debt Maturities
Principal payments due during each of the next five calendar years and thereafter for the Company's line of credit and notes payable were as follows as of December 31, 2015:
Line of Credit | Notes Payable | |||||||||||||||||||
Regularly scheduled principal amortization | Final maturities and other | Regularly scheduled principal amortization | Final maturities and other(1) | Total | ||||||||||||||||
2016 | $ | — | $ | 134,831 | $ | 47 | $ | — | $ | 134,878 | ||||||||||
2017 | — | — | 39 | 290,000 | 290,039 | |||||||||||||||
2018 | — | — | 43 | — | 43 | |||||||||||||||
2019 | — | — | 46 | — | 46 | |||||||||||||||
2020 | — | — | 50 | — | 50 | |||||||||||||||
Thereafter | — | — | 35 | — | 35 | |||||||||||||||
Total | $ | — | $ | 134,831 | $ | 260 | $ | 290,000 | $ | 425,091 | ||||||||||
95
(1) The maturity of $290,000 includes the unamortized discount of $912 which is included in the notes payable line item on the consolidated balance sheets.
7. Stockholder's Deficiency
Common Stock
As of December 31, 2015 and 2014, the Company was authorized to issue 1,000 shares, all of which are reserved as common stock, with 1,000 shares outstanding with a par value of $0.001 per share. There are no other equity shares outstanding that would take preference over the common stock in the instance that the Company pays dividends or liquidates. The outstanding shares are voting common stock and are owned 100% by Parent.
Noncontrolling Interest
The Company holds a controlling interest of approximately 86% in its Canadian subsidiary, CCL. The portions of net income and comprehensive income attributable to the noncontrolling interest in CCL are shown on our consolidated statements of operations and consolidated statements of comprehensive income (loss).
Accumulated Other Comprehensive Loss
During the years ended December 31, 2015, 2014, and 2013, comprehensive (loss) income included currency translation adjustments resulting from converting transactions and balances related to our Canada segment's operations from Canadian dollars to U.S. dollars. The following is a summary of the changes in accumulated other comprehensive loss for the periods presented:
Accumulated Other Comprehensive Loss | Currency Translation Adjustment | Accumulated Other Comprehensive Loss | ||||||
Balance, December 31, 2012 | $ | (111 | ) | $ | (111 | ) | ||
Other comprehensive loss, net of tax of $0, before reclassifications | (1,236 | ) | (1,236 | ) | ||||
Amounts reclassified from accumulated other comprehensive loss | — | — | ||||||
Balance, December 31, 2013 | (1,347 | ) | (1,347 | ) | ||||
Other comprehensive loss, net of tax of $0, before reclassifications | (2,289 | ) | (2,289 | ) | ||||
Amounts reclassified from accumulated other comprehensive loss | — | — | ||||||
Balance, December 31, 2014 | (3,636 | ) | (3,636 | ) | ||||
Other comprehensive loss, net of tax of $0, before reclassifications | (5,820 | ) | (5,820 | ) | ||||
Amounts reclassified from accumulated other comprehensive loss | — | — | ||||||
Balance, December 31, 2015 | $ | (9,456 | ) | $ | (9,456 | ) | ||
8. Fair Value of Financial Instruments
ASC Topic 820, Fair Value Measurements and Disclosures ("ASC 820"), defines fair value based on the price that would be received to sell an asset or paid to transfer a liability in an orderly transaction between market participants at the measurement date. ASC 820 establishes a fair value hierarchy that prioritizes observable and unobservable inputs used to measure fair value. The fair value hierarchy consists of three broad levels, which are described below:
· Level 1-Quoted prices (unadjusted) in active markets for identical assets or liabilities that the reporting entity can access at the measurement date.
· Level 2-Inputs other than quoted prices included in Level 1, that are observable for the asset or liability, either directly or indirectly, such as quoted prices for similar assets or liabilities in active markets; quoted prices for identical or similar assets or liabilities in markets that are not active; or other inputs that are observable or can be corroborated by observable market data.
· Level 3-Unobservable inputs that are supported by little, if any, market activity and that are significant to the fair value of the assets and liabilities. This includes certain pricing models, discounted cash flow methodologies and similar techniques that use significant unobservable inputs.
Purchased Debt
The Company records its investment in purchased debt at cost, which represents a significant discount from the contractual receivable balances due. Purchased debt for which a valuation allowance has not been recorded are subsequently recorded net of amortization under the interest method or the cost recovery method as discussed previously in Note 2. If a valuation allowance is required for a level yield pool, the Company records that portion of the total purchased debt balance by discounting the future cash flows generated by its proprietary forecasting model using the IRR as a discount rate. Valuation allowances for cost recovery pools are determined using the Company's proprietary forecasting model cash flows, which are undiscounted.
96
Estimated Fair Value
The following tables display the carrying value and estimated fair value of the Company's financial instruments held in accordance with ASC 820 as of the dates presented:
December 31, 2015 | ||||||||||||||||||||
Carrying Amounts | Estimated Fair Value | Level 1 | Level 2 | Level 3 | ||||||||||||||||
Purchased debt(1) | $ | 167,494 | $ | 240,888 | $ | — | $ | — | $ | 240,888 | ||||||||||
Line of credit(2) | $ | 134,831 | $ | 134,831 | $ | — | $ | 134,831 | $ | — | ||||||||||
Senior Second Lien Notes, net of $912 unamortized discount(3) | $ | 289,088 | $ | 140,202 | $ | 140,202 | $ | — | $ | — | ||||||||||
Other Notes Payable(4) | $ | 260 | $ | 260 | $ | — | $ | 260 | $ | — | ||||||||||
(1) The December 31, 2015 fair value was calculated based on a methodology consistent with the theoretical purchase price allocation completed by a third party appraisal firm in connection with the goodwill impairment analysis as of September 30, 2015. The fair value was determined using (i) our consolidated ERP, (ii) an estimate of a market participant's cost to collect, and (iii) a discount rate of 18%. The estimated fair value of purchased debt should not be construed to represent the underlying value of the Company or the amount which could be realized if its portfolio of purchased debt accounts were sold.
(i) Our ERP expectations are based on historical data as well as assumptions about future collection rates and customer behavior.
(ii) The market participant cost to collect assumption of 47% was generated based on consideration of publicly available competitor information, including the Company's own actual and projected data. Collection cost assumptions are subjective, require significant judgment and include assessing an assumed market participant’s business model and operating structure, including specific consideration of various collection strategies, operating efficiencies as well as fixed versus variable costs. Depending on these considerations and assumptions, the estimated fair value could vary significantly from the fair value disclosure in the table above.
(iii) The net cash flows, after considering the impacts of the costs to collect, are discounted at 18%. The Company determined the discount rate was appropriate after considering its weighted average cost of capital, as well as market rates that approximate a return on similar assets such as U.S. High Yield Bonds and recent collateralized loan obligation residual trades.
(2) The Company has both a domestic and Canadian revolving credit facility. These instruments contain variable borrowing rates that are based in part on observed available market interest rates. As a result, the Company believes the carrying values of these instruments approximate fair value.
(3) The fair value of our Senior Second Lien Notes is based on observed available market trading metrics as of the dates presented.
(4) We estimated the fair value of these notes to approximate carrying value, as the applicable interest rates of the notes approximate those of our other current borrowings, which are based in part on observable market rates.
December 31, 2014 | ||||||||||||||||||||
Carrying Amounts | Estimated Fair Value | Level 1 | Level 2 | Level 3 | ||||||||||||||||
Purchased debt(1) | $ | 222,700 | $ | 563,674 | $ | — | $ | — | $ | 563,674 | ||||||||||
Line of credit(2) | $ | 138,702 | $ | 138,702 | $ | — | $ | 138,702 | $ | — | ||||||||||
Senior Second Lien Notes, net of $1,631 unamortized discount(3) | $ | 288,369 | $ | 288,157 | $ | 288,157 | $ | — | $ | — | ||||||||||
Other Notes Payable(4) | $ | 1,001 | $ | 1,001 | $ | — | $ | 1,001 | $ | — | ||||||||||
(1) The Company's estimated fair value of purchased debt at December 31, 2014 was determined using our consolidated ERP discounted at 9%, which was the Company's estimate of its weighted average cost of capital at the time. The fair value estimates provided prior to December 31, 2015 excluded an estimate of cost to collect due to the subjective nature and significant assumptions required in estimating an assumed market participant's perspective. If the company had followed the 2015 methodology, including a cost to collect assumption and an industry driven discount rate of 18%, the estimated fair value would have been $283.9 million.
(2) The Company has both a domestic and Canadian revolving credit facility. These instruments contain variable borrowing rates that are based in part on observed available market interest rates. As a result, the Company believes the carrying values of these instruments approximate fair value.
(3) The fair value of our Senior Second Lien Notes is based on observed available market trading metrics as of the dates presented.
(4) We estimated the fair value of these notes to approximate carrying value, as the applicable interest rates of the notes approximate those of our other current borrowings, which are based in part on observable market rates.
The carrying values of cash and cash equivalents, accounts receivable and payable, accrued expenses, and notes receivable are considered to approximate fair value due to the short-term nature of these instruments.
97
9. Income Taxes
For financial statement reporting purposes, the Company is treated as a stand-alone entity, and therefore all components of the provision for, or benefit from income taxes as well as the deferred tax assets and liabilities recognized herein reflect only the financial results and position of SquareTwo. For income tax purposes, the Company is included in the consolidated return of Parent. Parent files income tax returns in the U.S. federal jurisdiction, and various state and foreign jurisdictions. Parent's U.S. federal income tax returns were last examined for the tax year ended December 31, 2004, and Parent potentially remains subject to examination for all tax years ended on or after December 31, 2011.
The following table shows the (loss) income from operations before income taxes and noncontrolling interest by U.S. and Canadian jurisdictions for the periods presented:
Year Ended December 31, | ||||||||||||
2015 | 2014 | 2013 | ||||||||||
(Loss) income before taxes: | ||||||||||||
U.S. | $ | (140,632 | ) | $ | (47,010 | ) | $ | (3,500 | ) | |||
Canada | $ | 16,980 | $ | 15,020 | $ | 13,806 | ||||||
Total (loss) income before taxes | $ | (123,652 | ) | $ | (31,990 | ) | $ | 10,306 | ||||
The following table shows the components of the provision for income taxes for the Company for the periods presented:
Year Ended December 31, | ||||||||||||
2015 | 2014 | 2013 | ||||||||||
Current: | ||||||||||||
Federal | $ | — | $ | — | $ | — | ||||||
State | 739 | (492 | ) | (849 | ) | |||||||
Canada | (4,545 | ) | (3,986 | ) | (4,059 | ) | ||||||
Total current tax expense | (3,806 | ) | (4,478 | ) | (4,908 | ) | ||||||
Deferred: | ||||||||||||
Federal | 8,712 | — | — | |||||||||
State | 1,118 | 20 | (246 | ) | ||||||||
Canada | (73 | ) | (1,492 | ) | (89 | ) | ||||||
Total deferred tax benefit (expense) | 9,757 | (1,472 | ) | (335 | ) | |||||||
Total tax benefit (expense) | $ | 5,951 | $ | (5,950 | ) | $ | (5,243 | ) | ||||
For the year ended December 31, 2015, the combined state, federal and Canadian tax benefit from operations was $6.0 million. The net benefit was primarily comprised of a $9.3 million total benefit related to the impairment of the branch office intangible and its reclassification from indefinite to definite lived asset, which is partially offset by $4.5 million tax expense in Canada based on an effective tax rate of approximately 26.5%. Approximately $4.0 million of the $9.3 million benefit was related to the impairment of the branch office network intangible, as further described in Note 4, while the remainder of the benefit was due to the release of the valuation as a result of the change from indefinite life to definite life classification.
In addition. a U.S. state income tax benefit of $0.7 million was recognized due to a refund of previously paid taxes to the State of Colorado, as was a tax benefit of $0.6 million related to a reduction of future taxes that would have been paid to the State of Colorado resulting from a change in the apportionment method approved by the state.
Any tax benefits related to pretax losses generated by the Company’s ongoing U.S. operations during 2015 have been fully offset by a corresponding increase in the valuation allowance as the Company remains in full valuation allowance position at December 31, 2015. In addition to paying income taxes in Canada at an effective rate of approximately 26.5%, Canadian income is also subject to IRC Section 956 income tax calculation in the U.S.; however all of Section 956 income during 2015 was offset by the Company’s net operating losses in the U.S., except for an immaterial amount of withholding tax payable in Canada.
98
The following table shows the difference between total income tax expense and income tax expense computed using the statutory rate of 35% for the periods presented:
Year Ended December 31, | ||||||||||||
2015 | 2014 | 2013 | ||||||||||
Computed tax benefit (expense) at statutory federal rate | $ | 43,278 | $ | 11,197 | $ | (3,607 | ) | |||||
Increase in valuation allowance | (12,322 | ) | (14,718 | ) | (654 | ) | ||||||
State tax rate change | — | — | (1,089 | ) | ||||||||
State tax benefit (expense), net of federal benefit | 1,957 | 843 | (211 | ) | ||||||||
Foreign tax rate differential | — | — | 120 | |||||||||
US tax benefit (expense) on foreign source income | 572 | (2,535 | ) | — | ||||||||
Foreign withholding | (377 | ) | (1,492 | ) | — | |||||||
Goodwill impairment | (25,906 | ) | — | — | ||||||||
Other | (1,251 | ) | 755 | 198 | ||||||||
Total income tax benefit (expense) | $ | 5,951 | $ | (5,950 | ) | $ | (5,243 | ) | ||||
The following table shows the tax effects of temporary differences that give rise to significant portions of deferred tax assets and liabilities at the dates presented:
December 31, | ||||||||
2015 | 2014 | |||||||
Deferred tax assets: | ||||||||
Federal and state net operating loss | $ | 55,020 | $ | 52,879 | ||||
Valuation allowance on cost recovery assets | 1,977 | 5,321 | ||||||
Foreign tax credits | 16,431 | 12,600 | ||||||
Capitalized transaction costs | 728 | — | ||||||
Stock option expense | 201 | 917 | ||||||
Amortization of loan fees and debt discount | 507 | 656 | ||||||
Other | 4,384 | 2,245 | ||||||
Total deferred tax assets | 79,248 | 74,618 | ||||||
Deferred tax liabilities: | ||||||||
Level yield revenue | (4,029 | ) | (18,311 | ) | ||||
Property and equipment | (3,917 | ) | (4,571 | ) | ||||
Branch office intangible asset | (5,269 | ) | (9,832 | ) | ||||
Debt acquisition costs | (383 | ) | (500 | ) | ||||
Foreign earnings and withholding | (1,658 | ) | (1,583 | ) | ||||
Total deferred tax liabilities | (15,256 | ) | (34,797 | ) | ||||
Valuation allowance | (65,643 | ) | (51,229 | ) | ||||
Deferred tax liability, net | $ | (1,651 | ) | $ | (11,408 | ) | ||
At December 31, 2015, the Company had a federal net operating loss carryforward of $150.4 million that if not utilized will expire in the years ending December 31, 2025 through 2035. As of December 31, 2015, the Company had a state net operating loss carryforward of $58.2 million that if not utilized will expire in years ending December 31, 2016 through 2035. Due to a tax sharing agreement in place between SquareTwo and Parent, the Company can utilize Parent's federal and state net operating loss carryforwards (“NOLs”), which at December 31, 2015, were $234.4 million and $105.7 million, respectively, including net operating loss carryforwards attributable to the Company. If not utilized, the federal NOLs will expire in years 2025 through 2034 and the state NOLs will expire in years 2016 through 2035.
As of the year ended December 31, 2015, the Company recorded a valuation allowance of $65.6 million against certain deferred tax assets including federal and state net operating losses, which may not be utilized within their available carryforward periods. In accordance with the accounting guidance for income taxes under GAAP, a valuation allowance is
99
established to reduce the deferred tax assets to the extent the deferred tax asset does not meet the GAAP criteria for future realization. The remaining net deferred tax liability of $1.7 million at December 31, 2015 is attributable to the deferred tax liability associated with the aforementioned Canadian withholding tax. To the extent that a determination is made to establish or adjust a valuation allowance, the expense or benefit is recorded in the period in which the determination is made. The book-to-tax basis differences in Canada were minimal at December 31, 2015 and 2014.
The Company evaluates its uncertain tax positions in accordance with a two-step process. The first step is recognition: the Company determines whether it is more-likely-than-not that a tax position will be sustained upon examination, including resolution of any related appeals or litigation processes, based on the technical merits of the position. The second step is measurement: a tax position that meets the more-likely-than-not recognition threshold is measured to determine the amount of benefit to recognize in the consolidated financial statements. The tax position is measured as the largest amount of benefit that is greater than 50 percent likely of being realized upon ultimate settlement. Tax positions that previously failed to meet the more-likely-than-not recognition threshold are recognized in the first subsequent financial reporting period in which that threshold is met. Previously recognized tax positions that no longer meet the more-likely-than-not recognition threshold are derecognized in the first subsequent financial reporting period in which that threshold is no longer met. There were no unrecognized tax benefits as of December 31, 2015.
10. Commitments and Contingencies
Leases
Our office facilities are under various operating lease agreements, and the expense is included in general and administrative expenses. Rent expense on our office facilities totaled approximately $2,186, $1,670, and $1,525 for the years ended December 31, 2015, 2014, and 2013, respectively.
The Denver Headquarters and Call Center lease term expires October 31, 2016. We are actively working with advisors and potential lessors to satisfy our operational needs.
The Company also leases certain software and various types of equipment through a combination of capital and operating leases.
At December 31, 2015, the total future minimum lease payments were as follows:
Capital Lease Obligations | Operating Leases | |||||||
Year ended December 31, | ||||||||
2016 | $ | 1,446 | $ | 3,379 | ||||
2017 | 656 | 976 | ||||||
2018 | 256 | 435 | ||||||
2019 | — | 326 | ||||||
2020 | — | 325 | ||||||
Thereafter | — | 335 | ||||||
Total minimum lease payments | $ | 2,358 | $ | 5,776 | ||||
Less amount representing interest and maintenance fees | (240 | ) | ||||||
Total principal | $ | 2,118 | ||||||
401(k) Savings
The Company offers participation in Parent's 401(k) profit-sharing plan. Eligible employees may make voluntary contributions which are matched by the Company up to 4% of the employee's compensation up to eligible limits. The amount of employee contributions are limited as specified in the profit-sharing plan. The Company may, at its discretion, make additional contributions. For the years ended December 31, 2015, 2014, and 2013, the Company made contributions of approximately $1,111, $831, and $721, respectively.
100
Branch Office Asset Purchase Program
During the year ended December 31, 2001, the Company approved an offering to its branch offices that provided them with the opportunity to invest in the Company's purchased debt. Under the terms of the agreement, the participant had the opportunity to invest in 10% to 20% of the Company's monthly investment in purchased debt, with their return based on actual collections.
A similar program continued in 2006, effective for debt purchases in the fourth quarter of 2005. As of December 31, 2015 and 2014, the remaining investment by the branch office owners under these plans was approximately $875. This amount has been classified as a contra-asset to purchased debt in the accompanying consolidated balance sheets. While the program was discontinued prospectively during the year ended December 31, 2010, if the underlying purchases achieve the target returns under this program, the Company would be obligated to return the amount invested, plus an appropriate return, to certain branch office owners.
Litigation
From time to time the Company is a defendant in ordinary routine litigation alleging violations of applicable state and federal laws by the Company or the branch offices acting on its behalf that is incidental to our business. These suits may include actions which may purport to be on behalf of a class of consumers. While the litigation and regulatory environment is challenging and continually changing, for the Company, our branch offices and our industry, in our opinion, such matters will not individually, or in the aggregate, result in a materially adverse effect on the Company's financial position, results of operations or cash flows. Management believes the range of reasonably possible loss for outstanding claims beyond those previously accrued is between zero and $1.5 million. The Company accrues for loss contingencies as they become probable and estimable.
11. Related-Party Transactions
Notes Payable/Receivable to/from Related Parties
At December 31, 2015 and 2014, the Company had notes payable of $260 and $591, respectively, to individuals who are deemed related parties because of their relationship with a co-founder and member of our Board of Directors. The notes payable relate to a stock redemption plan that redeemed all of the shares formerly owned by these individuals, but left the promissory notes held by these individuals outstanding, and are included in the notes payable line item on the consolidated balance sheets.
At December 31, 2015 and 2014, the Company had notes receivable of $163 and $194, respectively, from employees, former employees, and branch offices owned by certain officers, directors, and stockholders.
Amounts Due To/From Related Parties
At December 31, 2015 and 2014, the Company had payables, included in the accrued interest and other liabilities line item on the Consolidated Balance Sheets, of $2,038 and $2,724, respectively, due to branch offices owned by certain officers, directors, and stockholders.
At December 31, 2015 and 2014, the Company had receivables, included in the trade receivables and the other assets line items on the Consolidated Balance Sheets, of $367 and $631, respectively, due from branch offices owned by certain officers, directors, and stockholders.
Revenues
Collections on our purchased debt are our primary source of revenues, as described in Note 2. Revenues are not accounted for on an individual branch office basis. Collections by director-owned branch offices totaled $17,889, $34,093, and $49,955 for the years ended December 31, 2015, 2014, and 2013, respectively.
Servicing Fees
We paid purchased debt servicing fees, net of royalties, to director-owned branch offices totaling $5,066, $9,591, and $13,547 for the years ended December 31, 2015, 2014, and 2013, respectively.
101
Management Fees
The Company pays a management fee to a private equity firm which manages both its own investment in Parent, and the investments of others in Parent. The fee is related to services provided for management and administrative oversight, and strategic and tactical planning and advice. The fees for each of the years ended December 31, 2015, 2014, and 2013 were $500.
12. Significant Concentrations and Significant Customers
Our branch offices provide a significant amount of our collections on purchased debt. Branch office owners may own one or more branch locations. However, during 2015 one branch owner accounted for more than 10% of total collections and no branch owner accounted for more than 15% of total collections.
We have developed longstanding relationships with a number of leading credit issuers including U.S. and Canadian credit card, consumer loan, student loan, and small business credit issuers. Historically, we have purchased assets from seven of the ten largest credit card issuers in the U.S. In aggregate, we have purchased from over 40 different issuers of credit over the last three years as of December 31, 2015.
During 2015, no debt issuer accounted for more than 15% of the Company's total purchases. The concentration of significant debt issuers from whom SquareTwo purchases assets varies from year to year and is generally dependent on how many of the previous issuers actively sell in the marketplace, the price at which they sell, and our ability to place successful bids.
13. Segment Information
In its operation of the business, the chief operating decision maker ("CODM"), our Chief Executive Officer, reviews certain financial information, including segment statements of profitability prepared on a basis not consistent with GAAP. The segment information within this note is reported on that basis. The CODM evaluates this information in deciding how to allocate resources and in assessing performance. The Company has two reportable operating segments: Canada operations and Domestic operations, which have been determined based on the way our Board of Directors, the CODM, and our Senior Leadership Team review the Company's strategy and performance.
The accounting policies of our two segments are the same as those described in the summary of significant accounting policies in Note 2. Canadian purchases made on or after January 1, 2012 are being accounted for under the level yield method unless we are unable to reasonably forecast the timing and amount of cash proceeds. Purchases eligible for the level yield method are accumulated into static pools on a quarterly basis separately from U.S. purchases.
The following tables present the Company's operating segment results for the periods presented:
Year Ended December 31, | ||||||||||||
Cash Proceeds on Purchased Debt | 2015 | 2014 | 2013 | |||||||||
Domestic | $ | 310,338 | $ | 376,563 | $ | 515,696 | ||||||
Canada | 42,810 | 43,569 | 48,013 | |||||||||
Consolidated | $ | 353,148 | $ | 420,132 | $ | 563,709 | ||||||
Year Ended December 31, | ||||||||||||
Total Revenues | 2015 | 2014 | 2013 | |||||||||
Domestic | $ | 174,312 | $ | 220,141 | $ | 309,570 | ||||||
Canada | 28,341 | 26,950 | 28,683 | |||||||||
Consolidated | $ | 202,653 | $ | 247,091 | $ | 338,253 | ||||||
102
Year Ended December 31, | ||||||||||||
Adjusted EBITDA(1) | 2015 | 2014 | 2013 | |||||||||
Domestic | $ | 134,715 | $ | 166,281 | $ | 273,475 | ||||||
Canada | 31,259 | 31,432 | 34,905 | |||||||||
Consolidated | $ | 165,974 | $ | 197,713 | $ | 308,380 | ||||||
(1) Segment Adjusted EBITDA is calculated consistently with the methodology used to report the Company's consolidated Adjusted EBITDA, except with regard to the costs of certain overhead items that may benefit both operating segments. The costs of these overhead items are included in the calculation of Domestic Adjusted EBITDA, but have not been allocated to Canada. This treatment of certain overhead costs is consistent with CODM review.
Segment net income or loss is not presented herein, which is consistent with the CODM's review of segment information. The table below reconciles consolidated net (loss) income to consolidated Adjusted EBITDA for the periods presented:
Year Ended | ||||||||||||
Reconciliation of Net (Loss) Income to Adjusted EBITDA | December 31, | |||||||||||
2015 | 2014 | 2013 | ||||||||||
Net (loss) income | $ | (117,701 | ) | $ | (37,940 | ) | $ | 5,063 | ||||
Interest expense | 44,609 | 44,217 | 45,984 | |||||||||
Interest income | (157 | ) | (163 | ) | (103 | ) | ||||||
Income tax (benefit) expense | (5,951 | ) | 5,950 | 5,243 | ||||||||
Depreciation and amortization | 6,753 | 6,883 | 7,986 | |||||||||
Impairments of goodwill and intangible assets | 84,606 | — | — | |||||||||
EBITDA | 12,159 | 18,947 | 64,173 | |||||||||
Adjustments related to purchased debt accounting | ||||||||||||
Proceeds applied to purchased debt principal(1) | 157,500 | 175,695 | 241,561 | |||||||||
Amortization of step-up of carrying value(2) | — | — | 107 | |||||||||
Purchased debt valuation allowance (reversals) charges(3) | (6,719 | ) | 1,784 | (6,648 | ) | |||||||
Certain other or non-cash expenses | ||||||||||||
Stock option expense(4) | 34 | 79 | 128 | |||||||||
Termination fees | — | — | 4,900 | |||||||||
Other(5) | 3,000 | 1,208 | 4,159 | |||||||||
Adjusted EBITDA | $ | 165,974 | $ | 197,713 | $ | 308,380 | ||||||
(1) Cash proceeds applied to purchased debt principal rather than recorded as revenue.
(2) Non-cash amortization of a step-up in the carrying value of certain purchased debt assets related to purchase accounting adjustments resulting from the 2005 acquisition of the Company by Parent.
(3) Represents non-cash valuation allowance charges (reversals) on purchased debt.
(4) Represents the non-cash expense related to option grants of Parent’s equity granted to certain employees, directors and branch office owners.
(5) Consistent with the covenant calculations within our revolving credit facility, other includes, as applicable, branch office note reserves, lease breakup costs, certain consulting fees, management fees paid to KRG Capital Management, L.P., certain transaction expenses, recruiting expense, severance expense, and certain non-recurring items.
103
The table below reconciles net cash (used in) provided by operating activities to Adjusted EBITDA for the periods presented:
Year Ended | ||||||||||||
Reconciliation of Net Cash (Used in) Provided by Operating Activities to Adjusted EBITDA | December 31, | |||||||||||
2015 | 2014 | 2013 | ||||||||||
Net cash (used in) provided by operating activities | $ | (39,684 | ) | $ | (26,703 | ) | $ | 15,045 | ||||
Proceeds applied to purchased debt principal(1) | 157,500 | 175,695 | 241,561 | |||||||||
Interest expense to be paid in cash(2) | 41,306 | 41,220 | 42,782 | |||||||||
Interest income | (157 | ) | (163 | ) | (103 | ) | ||||||
Amortization of prepaid and other non-cash expenses | (6,032 | ) | (4,532 | ) | (4,658 | ) | ||||||
Changes in operating assets and liabilities and deferred taxes: | ||||||||||||
Restricted cash(3) | (1,210 | ) | (2,347 | ) | (4,899 | ) | ||||||
Other operating assets and liabilities and deferred taxes(4) | 17,202 | 7,385 | 4,350 | |||||||||
Income tax (benefit) expense | (5,951 | ) | 5,950 | 5,243 | ||||||||
Termination fees | — | — | 4,900 | |||||||||
Other(5) | 3,000 | 1,208 | 4,159 | |||||||||
Adjusted EBITDA | $ | 165,974 | $ | 197,713 | $ | 308,380 | ||||||
(1) Cash proceeds applied to purchased debt principal are shown in the investing activities section of the consolidated statements of cash flows.
(2) Represents interest expense, excluding non-cash amortization of loan origination fees and debt discount.
(3) Represents the change in restricted cash balances for the period due to the timing of payments on our line of credit and semi-annual interest payments on our Senior Second Lien Notes.
(4) The amount represents timing differences due to the recognition of certain expenses and revenue items on a cash versus accrual basis.
(5) Consistent with the covenant calculations within our revolving credit facility, other includes, as applicable, branch office note reserves, lease breakup costs, certain consulting fees, management fees paid to KRG Capital Management, L.P., certain transaction expenses, recruiting expense, severance expense, and certain non-recurring items.
Segment assets were as follows as of the dates presented:
December 31, | ||||||||
Total Assets | 2015 | 2014 | ||||||
Domestic | $ | 266,586 | $ | 414,711 | ||||
Canada | 41,232 | 33,376 | ||||||
Consolidated | $ | 307,818 | $ | 448,087 | ||||
Long-lived assets, excluding financial instruments and deferred taxes, of our Canada segment were not material at December 31, 2015 or December 31, 2014.
104
14. Quarterly Information (Unaudited)
The following is a summary of the quarterly results of operations for the years ended December 31, 2015 and 2014:
Quarter Ended | March 31 | June 30 | September 30 | December 31 | Total | |||||||||||||||
2015 | ||||||||||||||||||||
Total revenues | $ | 52,409 | $ | 48,839 | $ | 50,532 | $ | 50,873 | $ | 202,653 | ||||||||||
Total operating expenses | 55,465 | 50,771 | 48,240 | 126,882 | 281,358 | |||||||||||||||
Operating (loss) income | (3,056 | ) | (1,932 | ) | 2,292 | (76,009 | ) | (78,705 | ) | |||||||||||
Total other expenses | 11,172 | 11,284 | 11,250 | 11,241 | 44,947 | |||||||||||||||
Loss before income taxes | (14,228 | ) | (13,216 | ) | (8,958 | ) | (87,250 | ) | (123,652 | ) | ||||||||||
Income tax expense | (1,160 | ) | (1,243 | ) | (766 | ) | 9,120 | 5,951 | ||||||||||||
Net loss | (15,388 | ) | (14,459 | ) | (9,724 | ) | (78,130 | ) | (117,701 | ) | ||||||||||
Less: Net income attributable to noncontrolling interest | 387 | 419 | 509 | 408 | 1,723 | |||||||||||||||
Net loss attributable to SquareTwo | $ | (15,775 | ) | $ | (14,878 | ) | $ | (10,233 | ) | $ | (78,538 | ) | $ | (119,424 | ) | |||||
2014 | ||||||||||||||||||||
Total revenues | $ | 71,509 | $ | 66,847 | $ | 56,999 | $ | 51,736 | $ | 247,091 | ||||||||||
Total operating expenses | 61,503 | 61,131 | 57,179 | 54,611 | 234,424 | |||||||||||||||
Operating income (loss) | 10,006 | 5,716 | (180 | ) | (2,875 | ) | 12,667 | |||||||||||||
Total other expenses | 11,115 | 11,162 | 11,129 | 11,251 | 44,657 | |||||||||||||||
Loss before income taxes | (1,109 | ) | (5,446 | ) | (11,309 | ) | (14,126 | ) | (31,990 | ) | ||||||||||
Income tax expense | (1,037 | ) | (2,071 | ) | (1,699 | ) | (1,143 | ) | (5,950 | ) | ||||||||||
Net loss | (2,146 | ) | (7,517 | ) | (13,008 | ) | (15,269 | ) | (37,940 | ) | ||||||||||
Less: Net income attributable to noncontrolling interest | 341 | 399 | 409 | 380 | 1,529 | |||||||||||||||
Net loss attributable to SquareTwo | $ | (2,487 | ) | $ | (7,916 | ) | $ | (13,417 | ) | $ | (15,649 | ) | $ | (39,469 | ) | |||||
15. Supplemental Guarantor Information
The payment obligations under the Senior Second Lien Notes (refer to Note 6) are fully and unconditionally guaranteed, jointly and severally, on a senior secured basis by substantially all of SquareTwo Financial Corporation’s (the “Borrower”) 100% owned existing and future domestic subsidiaries (“Guarantor Subsidiaries”). The Senior Second Lien Notes are not guaranteed by Parent.
The consolidating financial information presented below reflects information regarding the Borrower, the issuer of the Senior Second Lien Notes, the Guarantor Subsidiaries, and all other subsidiaries of the Borrower (“Non-Guarantor Subsidiaries”). This basis of presentation is not intended to present the financial condition, results of operations or cash flows of the Company, the Borrower, the Guarantor Subsidiaries or the Non-Guarantor Subsidiaries for any purpose other than to comply with the specific requirements for subsidiary guarantor reporting. The consolidating information is prepared in accordance with the same accounting policies as are applied to the Company’s consolidated financial statements except for accounting for income taxes of the Guarantor Subsidiaries, which is reflected entirely in the Borrower’s financial statements as all material Guarantor Subsidiaries are disregarded entities for tax purposes and are combined with the Borrower in the consolidated income tax return of Parent.
The presentation of the Borrower’s financial statements represents the equity method of accounting for the Guarantor and Non-Guarantor Subsidiaries. The results of operations of the Guarantor and Non-Guarantor Subsidiaries reflect certain expense allocations from the Borrower, which are made in relation to the intercompany balances and the intercompany usage of the Borrower’s assets.
105
Consolidating Balance Sheets
December 31, 2015 | ||||||||||||||||||||
Borrower | Guarantor Subsidiaries | Non-Guarantor Subsidiaries | Eliminations | Total | ||||||||||||||||
Assets | ||||||||||||||||||||
Cash and cash equivalents | $ | 280 | $ | 38 | $ | 19,266 | $ | — | $ | 19,584 | ||||||||||
Restricted cash | (152 | ) | 3,079 | — | — | 2,927 | ||||||||||||||
Trade receivables, net of allowance for doubtful accounts | 750 | 55 | 690 | — | 1,495 | |||||||||||||||
Notes receivable | — | — | 163 | — | 163 | |||||||||||||||
Purchased debt, net | — | 146,988 | 20,506 | — | 167,494 | |||||||||||||||
Property and equipment, net | 23,093 | 221 | 131 | — | 23,445 | |||||||||||||||
Goodwill and intangible assets | 85,994 | — | 463 | — | 86,457 | |||||||||||||||
Other assets | 5,158 | 1,082 | 13 | — | 6,253 | |||||||||||||||
Investment in subsidiaries | 191,220 | — | — | (191,220 | ) | — | ||||||||||||||
Total assets | $ | 306,343 | $ | 151,463 | $ | 41,232 | $ | (191,220 | ) | $ | 307,818 | |||||||||
Liabilities and equity (deficiency) | ||||||||||||||||||||
Liabilities: | ||||||||||||||||||||
Accounts payable, trade | $ | 1,733 | $ | 162 | $ | 44 | $ | — | $ | 1,939 | ||||||||||
Payable from trust accounts | 1,390 | 46 | 102 | — | 1,538 | |||||||||||||||
Payable to Borrower | — | 306,344 | 3,424 | (309,768 | ) | — | ||||||||||||||
Taxes (receivable) payable | (6 | ) | — | 1,040 | — | 1,034 | ||||||||||||||
Accrued interest and other liabilities | 20,292 | 1,107 | 753 | — | 22,152 | |||||||||||||||
Deferred tax liability (asset) | 1,659 | — | (8 | ) | — | 1,651 | ||||||||||||||
Line of credit | 134,831 | — | — | — | 134,831 | |||||||||||||||
Notes payable, net of discount | 289,348 | — | — | — | 289,348 | |||||||||||||||
Obligations under capital lease agreements | 2,118 | — | — | — | 2,118 | |||||||||||||||
Total liabilities | 451,365 | 307,659 | 5,355 | (309,768 | ) | 454,611 | ||||||||||||||
Equity (deficiency): | ||||||||||||||||||||
Common stock | — | — | — | — | — | |||||||||||||||
Additional paid-in capital | 190,225 | 6,581 | 1 | (6,582 | ) | 190,225 | ||||||||||||||
(Accumulated deficit) retained earnings | (335,247 | ) | (162,777 | ) | 37,647 | 125,130 | (335,247 | ) | ||||||||||||
Accumulated other comprehensive loss | — | — | (9,456 | ) | — | (9,456 | ) | |||||||||||||
Total (deficiency) equity before noncontrolling interest | (145,022 | ) | (156,196 | ) | 28,192 | 118,548 | (154,478 | ) | ||||||||||||
Noncontrolling interest | — | — | 7,685 | — | 7,685 | |||||||||||||||
Total (deficiency) equity | (145,022 | ) | (156,196 | ) | 35,877 | 118,548 | (146,793 | ) | ||||||||||||
Total liabilities and (deficiency) equity | $ | 306,343 | $ | 151,463 | $ | 41,232 | $ | (191,220 | ) | $ | 307,818 | |||||||||
106
December 31, 2014 | ||||||||||||||||||||
Borrower | Guarantor Subsidiaries | Non-Guarantor Subsidiaries | Eliminations | Total | ||||||||||||||||
Assets | ||||||||||||||||||||
Cash and cash equivalents | $ | — | $ | — | $ | 15,677 | $ | — | $ | 15,677 | ||||||||||
Restricted cash | (360 | ) | 4,497 | — | — | 4,137 | ||||||||||||||
Trade receivables, net of allowance for doubtful accounts | 1,221 | 22 | 608 | — | 1,851 | |||||||||||||||
Notes receivable | — | — | 194 | — | 194 | |||||||||||||||
Purchased debt, net | — | 206,542 | 16,158 | — | 222,700 | |||||||||||||||
Property and equipment, net | 22,783 | 254 | 152 | — | 23,189 | |||||||||||||||
Goodwill and intangible assets | 170,779 | — | 569 | — | 171,348 | |||||||||||||||
Other assets | 6,614 | 1,571 | 806 | — | 8,991 | |||||||||||||||
Investment in subsidiaries | 243,404 | — | — | (243,404 | ) | — | ||||||||||||||
Total assets | $ | 444,441 | $ | 212,886 | $ | 34,164 | $ | (243,404 | ) | $ | 448,087 | |||||||||
Liabilities and equity (deficiency) | ||||||||||||||||||||
Liabilities: | ||||||||||||||||||||
Accounts payable, trade | $ | 3,549 | $ | (227 | ) | $ | (97 | ) | $ | — | $ | 3,225 | ||||||||
Payable from trust accounts | 1,252 | 58 | 94 | — | 1,404 | |||||||||||||||
Payable to Borrower | — | 342,772 | 2,842 | (345,614 | ) | — | ||||||||||||||
Taxes payable | 138 | — | 337 | — | 475 | |||||||||||||||
Accrued interest and other liabilities | 23,336 | 385 | 778 | — | 24,499 | |||||||||||||||
Deferred tax liability (asset) | 11,416 | — | (8 | ) | — | 11,408 | ||||||||||||||
Line of credit | 138,702 | — | — | — | 138,702 | |||||||||||||||
Notes payable, net of discount | 289,370 | — | — | — | 289,370 | |||||||||||||||
Obligations under capital lease agreements | 2,310 | — | — | — | 2,310 | |||||||||||||||
Total liabilities | 470,073 | 342,988 | 3,946 | (345,614 | ) | 471,393 | ||||||||||||||
Equity (deficiency): | ||||||||||||||||||||
Common stock | — | — | — | — | — | |||||||||||||||
Additional paid-in capital | 190,191 | 2,922 | 1 | (2,923 | ) | 190,191 | ||||||||||||||
(Accumulated deficit) retained earnings | (215,823 | ) | (133,024 | ) | 27,891 | 105,133 | (215,823 | ) | ||||||||||||
Accumulated other comprehensive loss | — | — | (3,636 | ) | — | (3,636 | ) | |||||||||||||
Total (deficiency) equity before noncontrolling interest | (25,632 | ) | (130,102 | ) | 24,256 | 102,210 | (29,268 | ) | ||||||||||||
Noncontrolling interest | — | — | 5,962 | — | 5,962 | |||||||||||||||
Total (deficiency) equity | (25,632 | ) | (130,102 | ) | 30,218 | 102,210 | (23,306 | ) | ||||||||||||
Total liabilities and (deficiency) equity | $ | 444,441 | $ | 212,886 | $ | 34,164 | $ | (243,404 | ) | $ | 448,087 | |||||||||
107
Consolidating Statements of Operations
Year Ended December 31, 2015 | ||||||||||||||||||||
Borrower | Guarantor Subsidiaries | Non-Guarantor Subsidiaries | Eliminations | Total | ||||||||||||||||
Revenues | ||||||||||||||||||||
Purchased debt revenue, net | $ | 1,645 | $ | 172,656 | $ | 28,310 | $ | — | $ | 202,611 | ||||||||||
Other revenue | 9 | 2 | 31 | — | 42 | |||||||||||||||
Total revenues | 1,654 | 172,658 | 28,341 | — | 202,653 | |||||||||||||||
Expenses | ||||||||||||||||||||
Purchased debt expense | 2 | 105,499 | 9,386 | — | 114,887 | |||||||||||||||
Court costs, net | — | 26,422 | 435 | — | 26,857 | |||||||||||||||
Salaries and payroll taxes | 6,064 | 27,877 | 660 | — | 34,601 | |||||||||||||||
General and administrative | 4,786 | 7,441 | 1,427 | — | 13,654 | |||||||||||||||
Depreciation and amortization | 2,857 | 3,860 | 36 | — | 6,753 | |||||||||||||||
Impairments of goodwill and intangible assets | 84,606 | — | — | — | 84,606 | |||||||||||||||
Total operating expenses | 98,315 | 171,099 | 11,944 | — | 281,358 | |||||||||||||||
Operating (loss) income | (96,661 | ) | 1,559 | 16,397 | — | (78,705 | ) | |||||||||||||
Other expenses | ||||||||||||||||||||
Interest expense | 13,297 | 31,312 | — | — | 44,609 | |||||||||||||||
Other (income) expense | (35 | ) | — | 373 | — | 338 | ||||||||||||||
Total other expenses | 13,262 | 31,312 | 373 | — | 44,947 | |||||||||||||||
(Loss) income before income taxes | (109,923 | ) | (29,753 | ) | 16,024 | — | (123,652 | ) | ||||||||||||
Income tax benefit (expense) | 10,496 | — | (4,545 | ) | — | 5,951 | ||||||||||||||
Loss from subsidiaries | (19,997 | ) | — | — | 19,997 | — | ||||||||||||||
Net (loss) income | (119,424 | ) | (29,753 | ) | 11,479 | 19,997 | (117,701 | ) | ||||||||||||
Less: Net income attributable to the noncontrolling interest | — | — | 1,723 | — | 1,723 | |||||||||||||||
Net (loss) income attributable to SquareTwo | $ | (119,424 | ) | $ | (29,753 | ) | $ | 9,756 | $ | 19,997 | $ | (119,424 | ) | |||||||
108
Year Ended December 31, 2014 | ||||||||||||||||||||
Borrower | Guarantor Subsidiaries | Non-Guarantor Subsidiaries | Eliminations | Total | ||||||||||||||||
Revenues | ||||||||||||||||||||
Purchased debt revenue, net | $ | 6,143 | $ | 213,976 | $ | 26,916 | $ | — | $ | 247,035 | ||||||||||
Other revenue | 13 | 9 | 34 | — | 56 | |||||||||||||||
Total revenues | 6,156 | 213,985 | 26,950 | — | 247,091 | |||||||||||||||
Expenses | ||||||||||||||||||||
Purchased debt expense | 6 | 137,511 | 10,296 | — | 147,813 | |||||||||||||||
Court costs, net | — | 34,361 | 358 | — | 34,719 | |||||||||||||||
Salaries and payroll taxes | 5,075 | 24,719 | 758 | — | 30,552 | |||||||||||||||
General and administrative | 1,740 | 9,741 | 2,976 | — | 14,457 | |||||||||||||||
Depreciation and amortization | 2,246 | 4,593 | 44 | — | 6,883 | |||||||||||||||
Total operating expenses | 9,067 | 210,925 | 14,432 | — | 234,424 | |||||||||||||||
Operating (loss) income | (2,911 | ) | 3,060 | 12,518 | — | 12,667 | ||||||||||||||
Other expenses | ||||||||||||||||||||
Interest expense | 6,932 | 37,285 | — | — | 44,217 | |||||||||||||||
Other expense (income) | 444 | — | (4 | ) | — | 440 | ||||||||||||||
Total other expenses | 7,376 | 37,285 | (4 | ) | — | 44,657 | ||||||||||||||
(Loss) income before income taxes | (10,287 | ) | (34,225 | ) | 12,522 | — | (31,990 | ) | ||||||||||||
Income tax expense | (1,964 | ) | — | (3,986 | ) | — | (5,950 | ) | ||||||||||||
Loss from subsidiaries | (27,218 | ) | — | — | 27,218 | — | ||||||||||||||
Net (loss) income | (39,469 | ) | (34,225 | ) | 8,536 | 27,218 | (37,940 | ) | ||||||||||||
Less: Net income attributable to the noncontrolling interest | — | — | 1,529 | — | 1,529 | |||||||||||||||
Net (loss) income attributable to SquareTwo | $ | (39,469 | ) | $ | (34,225 | ) | $ | 7,007 | $ | 27,218 | $ | (39,469 | ) | |||||||
109
Year Ended December 31, 2013 | ||||||||||||||||||||
Borrower | Guarantor Subsidiaries | Non-Guarantor Subsidiaries | Eliminations | Total | ||||||||||||||||
Revenues | ||||||||||||||||||||
Purchased debt revenue, net | $ | 10,727 | $ | 298,753 | $ | 28,098 | $ | — | $ | 337,578 | ||||||||||
Other revenue | 84 | 6 | 585 | — | 675 | |||||||||||||||
Total revenues | 10,811 | 298,759 | 28,683 | — | 338,253 | |||||||||||||||
Expenses | ||||||||||||||||||||
Purchased debt expense | 5 | 178,315 | 10,864 | — | 189,184 | |||||||||||||||
Court costs, net | — | 39,552 | 603 | — | 40,155 | |||||||||||||||
Salaries and payroll taxes | 4,325 | 21,474 | 549 | — | 26,348 | |||||||||||||||
General and administrative | 3,663 | 7,138 | 3,617 | — | 14,418 | |||||||||||||||
Depreciation and amortization | 4,371 | 3,564 | 51 | — | 7,986 | |||||||||||||||
Total operating expenses | 12,364 | 250,043 | 15,684 | — | 278,091 | |||||||||||||||
Operating (loss) income | (1,553 | ) | 48,716 | 12,999 | — | 60,162 | ||||||||||||||
Other expenses | ||||||||||||||||||||
Interest expense | 5,165 | 40,819 | — | — | 45,984 | |||||||||||||||
Other expense | 401 | 1,228 | 2,243 | — | 3,872 | |||||||||||||||
Total other expenses | 5,566 | 42,047 | 2,243 | — | 49,856 | |||||||||||||||
(Loss) income before income taxes | (7,119 | ) | 6,669 | 10,756 | — | 10,306 | ||||||||||||||
Income tax expense | (1,551 | ) | — | (3,692 | ) | — | (5,243 | ) | ||||||||||||
Income from subsidiaries | 12,332 | — | — | (12,332 | ) | — | ||||||||||||||
Net income | 3,662 | 6,669 | 7,064 | (12,332 | ) | 5,063 | ||||||||||||||
Less: Net income attributable to the noncontrolling interest | — | — | 1,401 | — | 1,401 | |||||||||||||||
Net income attributable to SquareTwo | $ | 3,662 | $ | 6,669 | $ | 5,663 | $ | (12,332 | ) | $ | 3,662 | |||||||||
110
Consolidating Statements of Comprehensive (Loss) Income
Year Ended December 31, 2015 | ||||||||||||||||||||
Borrower | Guarantor Subsidiaries | Non-Guarantor Subsidiaries | Eliminations | Total | ||||||||||||||||
Net (loss) income | $ | (119,424 | ) | $ | (29,753 | ) | $ | 11,479 | $ | 19,997 | $ | (117,701 | ) | |||||||
Other comprehensive loss, net of tax: | ||||||||||||||||||||
Currency translation adjustment | — | — | (5,820 | ) | — | (5,820 | ) | |||||||||||||
Comprehensive (loss) income | (119,424 | ) | (29,753 | ) | 5,659 | 19,997 | (123,521 | ) | ||||||||||||
Less: Comprehensive income attributable to the noncontrolling interest | — | — | 1,723 | — | 1,723 | |||||||||||||||
Comprehensive (loss) income attributable to SquareTwo | $ | (119,424 | ) | $ | (29,753 | ) | $ | 3,936 | $ | 19,997 | $ | (125,244 | ) | |||||||
111
Year Ended December 31, 2014 | ||||||||||||||||||||
Borrower | Guarantor Subsidiaries | Non-Guarantor Subsidiaries | Eliminations | Total | ||||||||||||||||
Net (loss) income | $ | (39,469 | ) | $ | (34,225 | ) | $ | 8,536 | $ | 27,218 | $ | (37,940 | ) | |||||||
Other comprehensive loss, net of tax: | ||||||||||||||||||||
Currency translation adjustment | — | — | (2,289 | ) | — | (2,289 | ) | |||||||||||||
Comprehensive (loss) income | (39,469 | ) | (34,225 | ) | 6,247 | 27,218 | (40,229 | ) | ||||||||||||
Less: Comprehensive income attributable to the noncontrolling interest | — | — | 1,529 | — | 1,529 | |||||||||||||||
Comprehensive (loss) income attributable to SquareTwo | $ | (39,469 | ) | $ | (34,225 | ) | $ | 4,718 | $ | 27,218 | $ | (41,758 | ) | |||||||
112
Year Ended December 31, 2013 | ||||||||||||||||||||
Borrower | Guarantor Subsidiaries | Non-Guarantor Subsidiaries | Eliminations | Total | ||||||||||||||||
Net income | $ | 3,662 | $ | 6,669 | $ | 7,064 | $ | (12,332 | ) | $ | 5,063 | |||||||||
Other comprehensive income, net of tax: | ||||||||||||||||||||
Currency translation adjustment | — | — | (1,236 | ) | — | (1,236 | ) | |||||||||||||
Comprehensive income | 3,662 | 6,669 | 5,828 | (12,332 | ) | 3,827 | ||||||||||||||
Less: Comprehensive income attributable to the noncontrolling interest | — | — | 1,401 | — | 1,401 | |||||||||||||||
Comprehensive income attributable to SquareTwo | $ | 3,662 | $ | 6,669 | $ | 4,427 | $ | (12,332 | ) | $ | 2,426 | |||||||||
113
Consolidating Statements of Cash Flows
Year Ended December 31, 2015 | ||||||||||||||||||||
Borrower | Guarantor Subsidiaries | Non-Guarantor Subsidiaries | Eliminations | Total | ||||||||||||||||
Operating activities | ||||||||||||||||||||
Net (loss) income | $ | (119,424 | ) | $ | (29,753 | ) | $ | 11,479 | $ | 19,997 | $ | (117,701 | ) | |||||||
Adjustments to reconcile net (loss) income to net cash (used in) provided by operating activities: | ||||||||||||||||||||
Depreciation and amortization | 2,857 | 3,860 | 36 | — | 6,753 | |||||||||||||||
Impairments of goodwill and intangible assets | 84,606 | — | — | — | 84,606 | |||||||||||||||
Amortization of loan origination fees and debt discount | 3,303 | — | — | — | 3,303 | |||||||||||||||
Purchased debt valuation allowance | — | (6,857 | ) | 138 | — | (6,719 | ) | |||||||||||||
Stock option expense | 34 | — | — | — | 34 | |||||||||||||||
Amortization of prepaid and other non-cash expenses | 4,832 | 1,171 | 29 | — | 6,032 | |||||||||||||||
Deferred tax provision, net of valuation allowance | (9,757 | ) | — | — | — | (9,757 | ) | |||||||||||||
Loss from subsidiaries | 19,997 | — | — | (19,997 | ) | — | ||||||||||||||
Changes in operating assets and liabilities: | ||||||||||||||||||||
Income tax payable/receivable | (144 | ) | — | 721 | — | 577 | ||||||||||||||
Restricted cash | (208 | ) | 1,418 | — | — | 1,210 | ||||||||||||||
Other assets | (4,619 | ) | (2,056 | ) | 1,132 | — | (5,543 | ) | ||||||||||||
Accounts payable and accrued liabilities | (4,722 | ) | 1,358 | 885 | — | (2,479 | ) | |||||||||||||
Net cash (used in) provided by operating activities | (23,245 | ) | (30,859 | ) | 14,420 | — | (39,684 | ) | ||||||||||||
Investing activities | ||||||||||||||||||||
Investment in purchased debt | — | (76,835 | ) | (21,412 | ) | — | (98,247 | ) | ||||||||||||
Proceeds applied to purchased debt principal | — | 143,246 | 14,254 | — | 157,500 | |||||||||||||||
Payments to branch offices related to asset purchase program | — | (259 | ) | — | — | (259 | ) | |||||||||||||
Investment in subsidiaries | 35,191 | — | — | (35,191 | ) | — | ||||||||||||||
Investment in property and equipment, including internally developed software | (5,123 | ) | (64 | ) | (37 | ) | — | (5,224 | ) | |||||||||||
Net cash provided by (used in) investing activities | 30,068 | 66,088 | (7,195 | ) | (35,191 | ) | 53,770 | |||||||||||||
Financing activities | ||||||||||||||||||||
Repayments of investment by Parent, net | — | (35,191 | ) | — | 35,191 | — | ||||||||||||||
Payments on notes payable, net | (741 | ) | — | — | — | (741 | ) | |||||||||||||
Proceeds from line of credit | 341,668 | — | — | — | 341,668 | |||||||||||||||
Payments on line of credit | (345,539 | ) | — | — | — | (345,539 | ) | |||||||||||||
Origination fees on line of credit | (200 | ) | — | — | — | (200 | ) | |||||||||||||
Payments on capital lease obligations | (1,731 | ) | — | — | — | (1,731 | ) | |||||||||||||
Net cash used in financing activities | (6,543 | ) | (35,191 | ) | — | 35,191 | (6,543 | ) | ||||||||||||
Increase in cash and cash equivalents | 280 | 38 | 7,225 | — | 7,543 | |||||||||||||||
Impact of foreign currency translation on cash | — | — | (3,636 | ) | — | (3,636 | ) | |||||||||||||
Cash and cash equivalents at beginning of period | — | — | 15,677 | — | 15,677 | |||||||||||||||
Cash and cash equivalents at end of period | $ | 280 | $ | 38 | $ | 19,266 | $ | — | $ | 19,584 | ||||||||||
Supplemental cash flow information | ||||||||||||||||||||
Cash paid for interest | $ | 41,390 | $ | — | $ | — | $ | — | $ | 41,390 | ||||||||||
Cash paid for income taxes | (595 | ) | — | 3,791 | — | 3,196 | ||||||||||||||
Property and equipment financed with capital leases and notes payable | 1,539 | — | — | — | 1,539 | |||||||||||||||
114
Year Ended December 31, 2014 | ||||||||||||||||||||
Borrower | Guarantor Subsidiaries | Non-Guarantor Subsidiaries | Eliminations | Total | ||||||||||||||||
Operating activities | ||||||||||||||||||||
Net (loss) income | $ | (39,469 | ) | $ | (34,225 | ) | $ | 8,536 | $ | 27,218 | $ | (37,940 | ) | |||||||
Adjustments to reconcile net (loss) income to net cash (used in) provided by operating activities: | ||||||||||||||||||||
Depreciation and amortization | 2,246 | 4,593 | 44 | — | 6,883 | |||||||||||||||
Amortization of loan origination fees and debt discount | 2,997 | — | — | — | 2,997 | |||||||||||||||
Purchased debt valuation allowance | — | 1,784 | — | — | 1,784 | |||||||||||||||
Stock option expense | 52 | 27 | — | — | 79 | |||||||||||||||
Amortization of prepaid and other non-cash expenses | 3,729 | 748 | 55 | — | 4,532 | |||||||||||||||
Deferred tax provision, net of valuation allowance | 1,472 | — | — | — | 1,472 | |||||||||||||||
Loss from subsidiaries | 27,218 | — | — | (27,218 | ) | — | ||||||||||||||
Changes in operating assets and liabilities: | ||||||||||||||||||||
Income tax payable/receivable | (610 | ) | — | 602 | — | (8 | ) | |||||||||||||
Restricted cash | (287 | ) | 2,634 | — | — | 2,347 | ||||||||||||||
Other assets | (4,023 | ) | (3,717 | ) | 2,688 | — | (5,052 | ) | ||||||||||||
Accounts payable and accrued liabilities | (3,743 | ) | (354 | ) | 300 | — | (3,797 | ) | ||||||||||||
Net cash (used in) provided by operating activities | (10,418 | ) | (28,510 | ) | 12,225 | — | (26,703 | ) | ||||||||||||
Investing activities | ||||||||||||||||||||
Investment in purchased debt | — | (105,532 | ) | (21,215 | ) | — | (126,747 | ) | ||||||||||||
Proceeds applied to purchased debt principal | — | 159,180 | 16,515 | — | 175,695 | |||||||||||||||
Investment in subsidiaries | 24,902 | — | — | (24,902 | ) | — | ||||||||||||||
Investment in property and equipment, including internally developed software | (4,511 | ) | (236 | ) | — | — | (4,747 | ) | ||||||||||||
Net cash provided by (used in) investing activities | 20,391 | 53,412 | (4,700 | ) | (24,902 | ) | 44,201 | |||||||||||||
Financing activities | ||||||||||||||||||||
Proceeds from investment by Parent, net | (150 | ) | (24,902 | ) | — | 24,902 | (150 | ) | ||||||||||||
Payments on notes payable, net | (763 | ) | — | — | — | (763 | ) | |||||||||||||
Proceeds from line of credit | 421,308 | — | — | — | 421,308 | |||||||||||||||
Payments on line of credit | (427,875 | ) | — | — | — | (427,875 | ) | |||||||||||||
Origination fees on line of credit | (767 | ) | — | — | — | (767 | ) | |||||||||||||
Payments on capital lease obligations | (1,726 | ) | — | — | — | (1,726 | ) | |||||||||||||
Net cash used in financing activities | (9,973 | ) | (24,902 | ) | — | 24,902 | (9,973 | ) | ||||||||||||
Increase in cash and cash equivalents | — | — | 7,525 | — | 7,525 | |||||||||||||||
Impact of foreign currency translation on cash | — | — | (1,227 | ) | — | (1,227 | ) | |||||||||||||
Cash and cash equivalents at beginning of period | — | — | 9,379 | — | 9,379 | |||||||||||||||
Cash and cash equivalents at end of period | $ | — | $ | — | $ | 15,677 | $ | — | $ | 15,677 | ||||||||||
Supplemental cash flow information | ||||||||||||||||||||
Cash paid for interest | $ | 41,343 | $ | — | $ | — | $ | — | $ | 41,343 | ||||||||||
Cash paid for income taxes | 1,103 | — | 3,378 | — | 4,481 | |||||||||||||||
Property and equipment financed with capital leases and notes payable | 1,292 | — | — | — | 1,292 | |||||||||||||||
115
Year Ended December 31, 2013 | ||||||||||||||||||||
Borrower | Guarantor Subsidiaries | Non-Guarantor Subsidiaries | Eliminations | Total | ||||||||||||||||
Operating activities | ||||||||||||||||||||
Net income | $ | 3,662 | $ | 6,669 | $ | 7,064 | $ | (12,332 | ) | $ | 5,063 | |||||||||
Adjustments to reconcile net income to net cash provided by operating activities: | ||||||||||||||||||||
Depreciation and amortization | 4,371 | 3,564 | 51 | — | 7,986 | |||||||||||||||
Amortization of loan origination fees and debt discount | 3,202 | — | — | — | 3,202 | |||||||||||||||
Recovery of step-up in basis of purchased debt | 107 | — | — | — | 107 | |||||||||||||||
Purchased debt valuation allowance reversal | — | (6,630 | ) | (18 | ) | — | (6,648 | ) | ||||||||||||
Stock option expense | 82 | 46 | — | — | 128 | |||||||||||||||
Amortization of prepaid and other non-cash expenses | 3,811 | 555 | 292 | — | 4,658 | |||||||||||||||
Deferred tax provision, net of valuation allowance | 339 | — | (4 | ) | — | 335 | ||||||||||||||
Income from subsidiaries | (12,332 | ) | — | — | 12,332 | — | ||||||||||||||
Changes in operating assets and liabilities: | ||||||||||||||||||||
Income tax payable/receivable | 640 | — | (2,510 | ) | — | (1,870 | ) | |||||||||||||
Restricted cash | (315 | ) | 5,214 | — | — | 4,899 | ||||||||||||||
Other assets | (3,874 | ) | 3,773 | (4,587 | ) | — | (4,688 | ) | ||||||||||||
Accounts payable and accrued liabilities | 2,000 | (689 | ) | 562 | — | 1,873 | ||||||||||||||
Net cash provided by operating activities | 1,693 | 12,502 | 850 | — | 15,045 | |||||||||||||||
Investing activities | ||||||||||||||||||||
Investment in purchased debt | — | (240,595 | ) | (17,515 | ) | — | (258,110 | ) | ||||||||||||
Proceeds applied to purchased debt principal | — | 221,884 | 19,677 | — | 241,561 | |||||||||||||||
Payments to branch offices related to asset purchase program | — | (297 | ) | — | — | (297 | ) | |||||||||||||
Net proceeds from notes receivable | 77 | — | — | — | 77 | |||||||||||||||
Investment in subsidiaries | (6,506 | ) | — | — | 6,506 | — | ||||||||||||||
Investment in property and equipment, including internally developed software | (5,012 | ) | — | — | — | (5,012 | ) | |||||||||||||
Net cash (used in) provided by investing activities | (11,441 | ) | (19,008 | ) | 2,162 | 6,506 | (21,781 | ) | ||||||||||||
Financing activities | ||||||||||||||||||||
Proceeds from investment by Parent, net | — | 6,506 | — | (6,506 | ) | — | ||||||||||||||
Payments on notes payable, net | (596 | ) | — | — | — | (596 | ) | |||||||||||||
Proceeds from line of credit | 581,644 | — | — | — | 581,644 | |||||||||||||||
Payments on line of credit | (568,787 | ) | — | — | — | (568,787 | ) | |||||||||||||
Origination fees on line of credit | (1,035 | ) | — | — | — | (1,035 | ) | |||||||||||||
Payments on capital lease obligations | (1,478 | ) | — | — | — | (1,478 | ) | |||||||||||||
Net cash provided by financing activities | 9,748 | 6,506 | — | (6,506 | ) | 9,748 | ||||||||||||||
Increase in cash and cash equivalents | — | — | 3,012 | — | 3,012 | |||||||||||||||
Impact of foreign currency translation on cash | — | — | (1,171 | ) | — | (1,171 | ) | |||||||||||||
Cash and cash equivalents at beginning of period | — | — | 7,538 | — | 7,538 | |||||||||||||||
Cash and cash equivalents at end of period | $ | — | $ | — | $ | 9,379 | $ | — | $ | 9,379 | ||||||||||
Supplemental cash flow information | ||||||||||||||||||||
Cash paid for interest | $ | 42,420 | $ | 585 | $ | — | $ | — | $ | 43,005 | ||||||||||
Cash paid for income taxes | 572 | — | 6,207 | — | 6,779 | |||||||||||||||
Property and equipment financed with capital leases and notes payable | 2,407 | — | — | — | 2,407 | |||||||||||||||
116
16. Subsequent Events
Commitment Letter, Exchange Offer, and Consent Solicitation
On April 20, 2016, the Company and a certain financial institution entered into a commitment letter setting forth the terms of a $165 million senior secured financing facility (the “New Financing Facility”). Proceeds from the New Financing Facility will be used to refinance the Company’s existing senior revolving credit facility, provide working capital to the Company, and pay fees in connection with the financing facility and related transactions. The obligation of the financial institution to provide the New Financing Facility is subject to certain conditions, including without limitation (i) the consummation of an exchange offer (the " Exchange Offer") in which the holders of at least 70% of the Company’s Senior Second Lien Notes exchange their outstanding Notes for participation in a 1.5 lien term loan and preferred stock of the Company, and (ii) the Company’s entry into a $30 million 1.25 lien term loan, at least $15 million of which will be funded on the closing date of the New Financing Facility. The Company expects to enter into definitive documentation for the New Financing Facility and borrow the full amount available thereunder concurrently with the settlement of the Exchange Offer discussed below.
On April 25, 2016, the Company has prepared an offering memorandum for the Exchange Offer along with a consent solicitation (the “Consent Solicitation”) to holders of the Senior Second Lien Notes and plans to commence the Exchange Offer upon the filing of this report. Participating holders will receive $620 principal amount of a new 1.5 lien term loan and $350 initial liquidation amount of a new class of preferred stock of the Company for each $1,000 principal amount of Senior Second Lien Notes tendered. In addition, holders who provide consents by the consent expiration time on May 6, 2016 (which may be extended by the Company) will receive an additional $30 principal amount of the 1.5 lien term loan for each $1,000 principal amount of Senior Second Lien Notes. The Exchange Offer and Consent Solicitation will be made upon the terms and subject to the conditions set forth in the offering memorandum for the Exchange Offer and Consent Solicitation statement and related consent and letter of transmittal. The Exchange Offer and Consent Solicitation will be subject to certain conditions, including there being tendered at least 70% of the aggregate principal amount of the Senior Second Lien Notes. The Exchange Offer will expire on or around May 20, 2016, unless extended by the Company.
Concurrently with the commencement of the Exchange Offer, the Company plans to enter into a recapitalization support agreement with holders of more than 75% in aggregate principal amount of the Senior Second Lien Notes, which agreement sets forth the obligations and commitments of the parties with respect to the proposed restructuring of the Company.
Amendment No. 7 to the Senior Revolving Credit Facility
On April 5, 2016, the Company entered into Amendment No. 7 which, among other things, (i) decreased the maximum commitment amount of the revolving credit facility from $245 million to $140 million, (ii) extended the term of the senior revolving credit facility to April 29, 2016, and (iii) set certain progress requirements related to the refinancing of the senior revolving credit facility. On April 20, 2016, the administrative agent for the senior revolving credit facility notified the Company of the occurrence of an event of default related to the Company’s failure to deliver a loan commitment to the administrative agent by April 18, 2016 for a refinancing in full of all obligations under the senior revolving credit facility. The administrative agent also reserved the rights of the administrative agent and lenders under the senior revolving credit facility.
The Company continues to work towards a proposed restructuring of its capital structure as outlined above, which could result in the full refinancing of the Company’s senior revolving credit facility and retirement of a substantial portion of the Senior Second Lien Notes. Management has assessed the financial impacts of the proposed restructuring, including changes in commitment levels and covenants, and currently believes that if the Exchange Offer and the New Financing Facility are consummated, the proposed restructuring would provide the Company with adequate liquidity and capital to execute its business plan for the foreseeable future. However, no assurance can be made that the Company will be successful in implementing the proposed restructuring.
Item 9. Changes in and Disagreements with Accountants on Accounting and Financial Disclosure
None.
Item 9A. Controls and Procedures.
Evaluation of Disclosure Controls and Procedures
117
Our management, with the participation of our Chief Executive Officer (the principal executive officer) and our Chief Financial Officer (the principal financial officer), evaluated the effectiveness of our disclosure controls and procedures as of December 31, 2015. The term “disclosure controls and procedures,” as defined in Rules 13a-15(e) and 15d-15(e) under the Exchange Act, means controls and other procedures of a company that are designed to ensure that information required to be disclosed by a company in the reports that it files or submits under the Exchange Act is recorded, processed, summarized and reported, within the time periods specified in the SEC's rules and forms. Disclosure controls and procedures include, without limitation, controls and procedures designed to ensure that information required to be disclosed by a company in the reports that it files or submits under the Exchange Act is accumulated and communicated to the Company's management, including its principal executive and principal financial officers, as appropriate to allow timely decisions regarding required disclosure.
Management recognizes that any controls and procedures, no matter how well designed and operated, can provide only reasonable assurance of achieving their objectives and management necessarily applies its judgment in evaluating the cost-benefit relationship of possible controls and procedures. Based on the evaluation of our disclosure controls and procedures as of December 31, 2015, our Chief Executive Officer (the principal executive officer) and Chief Financial Officer (the principal financial officer) concluded that, as of such date, our disclosure controls and procedures were effective at the reasonable assurance level.
Management's Report on Internal Control over Financial Reporting
Our management is responsible for establishing and maintaining adequate internal control over financial reporting as defined in Rules 13a-15(f) and 15d-15(f) under the Securities Exchange Act of 1934. The Company’s internal control over financial reporting is designed to provide reasonable assurance regarding the reliability of financial reporting and the preparation of consolidated financial statements for external purposes in accordance with accounting principles generally accepted in the United States of America. Internal control over financial reporting includes maintaining records that in reasonable detail accurately and fairly reflect our transactions; providing reasonable assurance that transactions are recorded as necessary for preparation of our consolidated financial statements; providing reasonable assurance that receipts and expenditures of company assets are made in accordance with management authorization; and providing reasonable assurance that unauthorized acquisition, use or disposition of company assets that could have a material effect on our consolidated financial statements would be prevented or detected on a timely basis.
Because of its inherent limitations, internal control over financial reporting is not intended to provide absolute assurance that a misstatement of our consolidated financial statements would be prevented or detected. A control system, no matter how well conceived and operated, can provide only reasonable, not absolute, assurance that the objectives of the control system are met. Further, the design of a control system must reflect the fact that there are resource constraints and the benefits of controls must be considered relative to their costs. Because of the inherent limitations in all control systems, no evaluation of controls can provide absolute assurance that all control issues and instances of fraud, if any, within the Company have been detected.
Management assessed the effectiveness of the Company's internal control over financial reporting as of December 31, 2015. In making this assessment, management used the criteria set forth by the Committee of Sponsoring Organizations of the Treadway Commission (COSO) in its Internal Control - Integrated Framework issued in 2013. Based on management's assessment and those criteria, management concluded that as of December 31, 2015, the Company's internal control over financial reporting is effective.
There were no changes in our internal control over financial reporting during the year ended December 31, 2015 that have materially affected, or are reasonably likely to materially affect, our internal control over financial reporting.
Item 9B. Other Information.
Effective as of April 1, 2016, J.B. Richardson, Jr. has been appointed to the office of Senior Vice President and Chief Operating Officer of CA Holding, Inc., SquareTwo Financial Corporation and its subsidiaries. Mr. Richardson has been employed by SquareTwo Financial Corporation since August 2010 in a variety of capacities most recently as Senior Vice President of Operations. Prior to joining SquareTwo, Mr. Richardson was employed by KRG as an Associate from 2007 to 2009. From 2004 to 2007, Mr. Richardson was an Analyst at Wachovia Capital Markets, LLC, the investment banking subsidiary of Wachovia Corporation. Mr. Richardson earned his Bachelor of Arts in Economics and Commerce from Hampden-Sydney College.
118
PART III
Item 10. Directors, Executive Officers and Corporate Governance.
Board of Directors
Pursuant to the Third Amended and Restated Stockholders Agreement of CA Holding as amended, the stockholders of CA Holding that are party thereto and that collectively control a majority of the voting stock of CA Holding have agreed to vote such shares and to take all other action necessary to cause the CA Board to be comprised of no more than nine members, and to elect to the CA Board a maximum of five directors designated by affiliates of KRG Capital Management, L.P. ("KRG"), and as long as he holds at least 5% of the outstanding common stock of CA Holding, P. Scott Lowery and an additional member of the CA Board designated by Mr. Lowery. KRG has currently elected three members of the current Board of Directors of CA Holding. The remaining members of the CA Board will be selected by the CA Board. CA Holding, through its control of 100% of our outstanding voting stock, is able to elect all of our directors. It has been our past practice that our Board of Directors has the same composition as the CA Board; however, there is no contractual requirement that it do so.
Current Directors and Executive Officers
The following table sets forth certain information with respect to our current directors and executive officers as of April 25, 2016:
Name | Age | Position | ||
Paul A. Larkins | 55 | President, Chief Executive Officer and Director | ||
P. Scott Lowery | 57 | Special Senior Advisor to the President and Chief Executive Officer and Director | ||
John D. Lowe | 39 | Senior Vice President and Chief Financial Officer | ||
Brian W. Tuite | 46 | Executive Vice President and Chief Business Development Officer | ||
J.B. Richardson, Jr. | 33 | Senior Vice President and Chief Operating Officer | ||
William A. Weeks | 43 | Senior Vice President and Chief Information Officer | ||
Bethany S. Parker | 35 | Senior Vice President of Customer Experience Office | ||
Kristin A. Dickey | 46 | Senior Vice President of Human Resources and Organizational Development | ||
Mark D. Erickson | 50 | Senior Vice President of Commercial Business | ||
Alan Singer | 63 | General Counsel and Secretary | ||
Christopher J. Lane | 54 | Chairman of the Board of Directors | ||
Bennett R. Thompson | 37 | Director | ||
Kimberly S. Patmore | 59 | Director | ||
Thomas W. Bunn | 62 | Director | ||
Thomas R. Sandler | 69 | Director | ||
All of our directors hold office until the next annual meeting of our stockholders or until their successors are elected and qualified, unless his office is earlier vacated in accordance with the Bylaws of the Company, or with the applicable provisions of the General Corporation Law of the State of Delaware. Messrs. Lane, Thompson, and Sandler were appointed by KRG and Mr. Larkins was appointed by Mr. Lowery pursuant to the Third Amended and Restated Stockholders Agreement of CA Holding.
Our officers are appointed by the Board of Directors and hold office until the expiration of their employment agreement, if such officer has entered into an employment agreement with the Company, or their earlier death, retirement, resignation or removal.
Employment Agreement with Paul A. Larkins. Effective as of April 1, 2013, SquareTwo and Paul A. Larkins entered into an Executive Employment Agreement pursuant to which Mr. Larkins agreed to serve as the President and Chief Executive Officer ("CEO") of SquareTwo Financial Corporation. The Executive Employment Agreement has a term of three years together with a series of automatic one year extensions subject to the right of either party to deliver written notice of its intent to not renew at least thirty (30) days prior to the expiration of the term of employment. Pursuant to the Executive Employment Agreement, SquareTwo may discharge Mr. Larkins for cause in certain circumstances. Amendment No. 1 to the Executive Employment Agreement effective as of March 1, 2015, provides for a base salary of $700,000. The Executive Employment
119
Agreement also provides for an incentive compensation bonus in an amount with a targeted bonus of 100% if certain projected Adjusted EBITDA milestones are met, and/or other tangible financial metrics and management bonus objectives to be established periodically by the Compensation Committee are met.
The Executive Employment Agreement requires Mr. Larkins to, with certain minor exceptions, devote his full time to the Company. In addition, the Executive Employment Agreement provides for a confidentiality agreement and a non-compete and non-solicitation agreement, which expires one year following Mr. Larkins' termination as an employee. The Executive Employment Agreement contains certain severance provisions which are described in the “Compensation Discussion and Analysis” section under the heading “Severance and Change in Control Agreements”.
Employment Agreement with P. Scott Lowery. SquareTwo employs P. Scott Lowery as its Special Senior Advisor to the President and CEO pursuant to an Executive Employment Agreement dated August 5, 2005. The Executive Employment Agreement provided for an initial three-year term with automatic one year extensions subject to the right of either party to deliver written notice of its intent to not renew at least thirty (30) days prior to the expiration of the term of employment. Pursuant to the Executive Employment Agreement, SquareTwo may discharge Mr. Lowery for cause in certain circumstances. The Executive Employment Agreement provides Mr. Lowery with an annual base salary of $350,000, a discretionary bonus, benefits that are generally available to our other executive officers, and certain severance benefits if Mr. Lowery terminates his employment for good reason or if SquareTwo terminates his employment without cause. For a summary of Mr. Lowery's compensation and severance rights, refer to the “Compensation Discussion and Analysis” section under the heading “Severance and Change in Control Agreements”.
Employment Agreement with John D. Lowe. Effective as of August 1, 2014, SquareTwo Financial Corporation and John D. Lowe entered into an Executive Employment Agreement pursuant to which Mr. Lowe agreed to serve as the Senior Vice President and Chief Financial Officer of SquareTwo Financial Corporation. The Executive Employment Agreement has a term of three years together with a series of automatic one year extensions subject to the right of either party to deliver written notice of its intent to not renew at least thirty (30) days prior to the expiration of the term of employment. Pursuant to the Executive Employment Agreement, SquareTwo may discharge Mr. Lowe for cause in certain circumstances. The Executive Employment Agreement provides for a base salary of $350,000 with an incentive compensation bonus in an amount with a targeted bonus of 100% if certain projected Adjusted EBITDA milestones are met, and/or other tangible financial metrics and management bonus objectives to be established by the Compensation Committee are met.
The Executive Employment Agreement requires Mr. Lowe to, with certain minor exceptions, devote his full time to the Company. In addition, the Executive Employment Agreement provides for a confidentiality agreement and a non-compete and non-solicitation agreement, which expires one year following Mr. Lowe's termination as an employee. The Executive Employment Agreement contains certain severance provisions which are described in the “Compensation Discussion and Analysis” section under the heading “Severance and Change in Control Agreements”.
Employment Agreement with Brian W. Tuite. Effective as of April 1, 2013, SquareTwo Financial Corporation and Brian W. Tuite entered into an Executive Employment Agreement pursuant to which Mr. Tuite agreed to serve as the Executive Vice President and Chief Business Development Officer of SquareTwo Financial Corporation. The Executive Employment Agreement has a term of three years together with a series of automatic one year extensions subject to the right of either party to deliver written notice of its intent to not renew at least thirty (30) days prior to the expiration of the term of employment. Pursuant to the Executive Employment Agreement, SquareTwo may discharge Mr. Tuite for cause in certain circumstances. The Executive Employment Agreement provides for a base salary of $300,000 together with an incentive compensation bonus in an amount with a targeted bonus of 100% if certain projected Adjusted EBITDA milestones are met, and/or other tangible financial metrics and management bonus objectives to be established periodically by the Compensation Committee are met.
The Executive Employment Agreement requires Mr. Tuite to, with certain minor exceptions, devote his full time to the Company. In addition, the Executive Employment Agreement provides for a confidentiality agreement and a non-compete and non-solicitation agreement, which expires one year following Mr. Tuite's termination as an employee. The Executive Employment Agreement contains certain severance provisions which are described in the “Compensation Discussion and Analysis” section under the heading “Severance and Change in Control Agreements”.
Background of Directors and Officers. The following is a description of the business background of the directors and executive officers of the Company.
Paul A. Larkins has been our President and one of our directors since April 2009. Effective January 2010, he was appointed as our Chief Executive Officer. Mr. Larkins was the Chief Executive Officer and President of Key National Finance in Superior, Colorado from May 1998 until April 2009. Prior to this role Mr. Larkins served as a Senior Executive Vice
120
President with Key Bank USA and KeyCorp Leasing Ltd. Prior to KeyCorp, Mr. Larkins held regional and national roles with USL Capital and IBM. Mr. Larkins received his Bachelor of Science degree in Economics and Business Administration from St. Mary's College of California. Additionally, he is a graduate of the Institute of Lease Management at Columbia University and the Stonier Graduate School of Banking at the University of Delaware. The Board of Directors determined that Mr. Larkins should serve as a director due to his extensive experience in the finance industry, his knowledge of management techniques garnered through leading complex corporate organizations and his ability at developing and implementing strategic initiatives.
P. Scott Lowery, one of our co-founders, has served as the Special Senior Advisor to the President and CEO since April 1, 2013. Prior to this, Mr. Lowery served as the Chairman of our Board of Directors from our founding in 1994 until April 1, 2013. From 1994 through December 2009, Mr. Lowery was our Chief Executive Officer. He also served as our President from November 2002 until April 2009. Mr. Lowery also owns one of our branch offices. Mr. Lowery received his Bachelor of Science Degree in Business Administration from the University of Denver and his Juris Doctorate from the University of Denver College of Law. The Board of Directors determined that Mr. Lowery should serve as a director due to his experience as a co-founder of the Company and CEO during its formative stages, his extensive experience in the accounts receivable management industry and his alignment with the shareholders through his extensive shareholdings.
John D. Lowe has been our Senior Vice President and Chief Financial Officer since August 2014. Mr. Lowe has been employed by SquareTwo since August 2009 in a variety of capacities, including as Treasurer and Vice President of Finance and External Reporting from July 2010 until August 2014. Prior to joining SquareTwo, Mr. Lowe served as Director of Technical Accounting for Archstone from January 2008 until August 2009. From October 2002 to December 2007, Mr. Lowe was employed by Deloitte & Touche in varying capital markets and audit roles. Mr. Lowe is a CPA and graduated from Virginia Polytechnical Institute and University with a Bachelor of Science in Accounting and Finance.
Brian W. Tuite has been our Executive Vice President and Chief Business Development Officer since August 2009. Prior to joining us, Mr. Tuite was employed by Bank of America in its Credit Card division, where he served on the Credit Card Leadership Team as a sales and marketing executive in the Affinity Card and Latin America credit card businesses following Bank of America's acquisition of MBNA. Mr. Tuite received his Bachelor of Business Administration in Management Information Systems from the University of Oklahoma.
J.B. Richardson, Jr. has been our Senior Vice President and Chief Operating Officer since April 2016. Mr. Richardson has been employed by SquareTwo since August 2010 in a variety of capacities, including most recently as Senior Vice President of Operations. Prior to joining us, Mr. Richardson was employed by KRG as an Associate from 2007 to 2009. From 2004 to 2007, Mr. Richardson was an Analyst at Wachovia Capital Markets, LLC, the investment banking subsidiary of Wachovia Corporation. Mr. Richardson earned his Bachelor of Arts in Economics and Commerce from Hampden-Sydney College.
William A. Weeks has been our Senior Vice President and Chief Information Officer since April 2010. Prior to joining us, Mr. Weeks was the Senior Vice President and Chief Information Officer of Key Equipment Finance, Inc. from 2005 until 2010. Mr. Weeks earned his Sigma Six certification and a Certificate in Executive Management from the University of Colorado at Boulder. He currently serves as a member and mentor for the Chief Information Officer (CIO) Executive Council.
Bethany S. Parker has been our Senior Vice President of Customer Experience Office since April 2014, having served as Senior Vice President of Franchise Development since September 2010. Before assuming that role, Ms. Parker served in a variety of positions in the Operations arena, including senior management roles with us since joining Collect America, Ltd., SquareTwo's predecessor, in April 2001. Ms. Parker attended the University of New Hampshire Whittemore School Of Business and Economics as well as the University of Colorado at Denver.
Kristin A. Dickey has been our Senior Vice President of Human Resources and Organizational Development since March 2011. Previously, she was a Senior Director of Human Resources at Orbitz Worldwide from 1992 to 2011. Ms. Dickey received her Bachelor's Degree from the University of Wyoming.
Mark D. Erickson has been our Senior Vice President of Commercial Business since November 2010. Prior to joining us, Mr. Erickson held multiple executive level positions from 1994 to 2009 with Key Equipment Finance, Inc., a unit of KeyCorp, engaged in small and mid-ticket commercial equipment finance and leasing. His roles included management positions in credit underwriting, lease syndications, asset management, and sales and marketing. Mr. Erickson holds a Bachelor of Arts from the University of Denver, and a Master of Business Administration from Washington University.
121
Alan Singer has been our General Counsel and Secretary since August 2014. Mr. Singer joined the Company in April 2001 and has served in a variety of capacities including serving as Associate General Counsel for Regulatory Affairs from February 2011 until August 2014. Prior to joining SquareTwo, Mr. Singer was employed by ING from 1990 to 2000 in various positions of increasing responsibility, including Vice President of Regulatory Compliance and Customer Relations. Mr. Singer graduated from Queens College, CUNY with a B.A. in Psychology and graduated from the University of Denver, College of Law with a J.D.
Christopher J. Lane has been our Chairman of the Board of Directors since April 1, 2013 and one of our directors since August 2005. Mr. Lane is a Managing Director of KRG and has served on KRG's investment committee since 1997. Mr. Lane has over 25 years of diverse business experience as a principal and advisor in corporate strategy, business development, finance and operations, and has been involved with numerous corporate transactions, including mergers, acquisitions, recapitalizations, public offerings and going-private transactions. Prior to joining KRG, Mr. Lane was a partner in a certified public accounting and consulting firm. Mr. Lane graduated from the University of California, Irvine with a Bachelor of Arts in Economics and a Master of Business Administration in Management. The Board of Directors determined that Mr. Lane should serve as a director due to his financial and accounting background, and his extensive experience in strategic transactions.
Bennett R. Thompson has been one of our directors since August 2012. Since May 2007, Mr. Thompson has been employed at KRG, most recently serving as a Managing Director. Mr. Thompson graduated from Washington and Lee University with a B.A. in Economics. The Board of Directors determined that Mr. Thompson should serve as a director due to his knowledge of complex strategic and financial transactions.
Kimberly S. Patmore has been a director since September 2010. Ms. Patmore was the Chief Financial Officer and Executive Vice President of First Data Corporation, a leading provider of electronic commerce and payment solutions for merchant, financial institutions, and card issuers, from February 2000 to 2008. Ms. Patmore joined First Data Corporation as Controller in 1992 and held various divisional chief financial officer roles. Ms. Patmore graduated from the University of Toledo with a Bachelor of Arts in Accounting. She is a Certified Public Accountant and a member of the American Institute of Certified Public Accountants and the Colorado Society of Certified Public Accountants. The Board of Directors determined that Ms. Patmore should serve as a director due to her significant experience in accounting, finance and compliance matters.
Thomas W. Bunn has been a director since November 2010. Mr. Bunn was employed by KeyCorp from 2002 until 2008, serving as the President of Key Corporate and Investment Banking from 2002-2005 and serving as the Vice Chairman of KeyCorp and President of Key National Banking from 2005 to 2008. Prior to his tenure with KeyCorp, Mr. Bunn was employed by Bank of America from 1977 to 2000 in a number of management positions including Managing Director of Syndications and Leveraged Finance, Managing Director and Head of Global Debt Capital Markets and Managing Director and Head of Leveraged Finance and EMEA. Mr. Bunn graduated from Wake Forest University with a Bachelor of Science in Business Administration and from the University of North Carolina at Chapel Hill with a Master of Business Administration. Mr. Bunn is currently a member of the Wake Forest University Board of Trustees. The Board of Directors determined that Mr. Bunn should serve as a director due to his strong executive business experience, demonstrated capability for strategic thought and his expertise in corporate finance.
Thomas R. Sandler has been a director since December 2010. Mr. Sandler was the President of Thule Organization Solutions, Inc., a leading consumer product provider, from May 2004 until July 2009. Prior to that he was employed by Samsonite Corporation, where from May 1995 until February 1998 he was Worldwide Chief Financial Officer and from February 1998 until May 2004 he was the President of the Americas. Mr. Sandler graduated from Ithaca College with a Bachelor of Science Degree in Accounting and from State University of New York—Binghamton with a Master of Science Degree, Accounting with a Finance Emphasis. Mr. Sandler is a Certified Public Accountant. The Board of Directors determined that Mr. Sandler should serve as a director due to his many years of senior business management experience, dedication to assisting organizations achieve significant growth goals and his strong financial management experience.
Audit and Governance Committee
The Board of Directors' standing Audit Committee was renamed as the Audit and Governance Committee in 2015. The Audit and Governance Committee of our Board of Directors is comprised of Kimberly S. Patmore, Thomas R. Sandler and Bennett R. Thompson, all of whom are independent under the NASDAQ listing standards and Rule 10A-3(b)(1) of the Exchange Act. The Board of Directors has determined that each member of the Audit and Governance Committee is an "audit committee financial expert" as that term is defined in Item 407(d)(5) of Regulation S-K. The Audit and Governance Committee Charter is available on the Company's website at www.squaretwofinancial.com. Information contained on our website is not incorporated by reference in, or considered to be a part of, this Annual Report on Form 10-K.
122
The Audit and Governance Committee held four meetings during 2015 and met informally between meetings. Audit and Governance Committee meetings are typically held in conjunction with scheduled meetings of the Board of Directors; however, the Audit and Governance Committee also holds meetings between meetings of the Board of Directors as needed. The Audit and Governance Committee holds executive sessions, which may include the Ernst & Young audit team.
The Audit and Governance Committee is primarily concerned with the integrity of the Company's consolidated financial statements, the effectiveness of the Company's internal control over financial reporting, the Company's compliance with legal and regulatory requirements, the independence, qualifications and performance of the independent auditors and the objectivity and performance of the Company's internal audit function. The Audit and Governance Committee is not responsible for the planning or conduct of the audits, or the determination that the Company's consolidated financial statements are complete and accurate and in accordance with GAAP.
The Audit and Governance Committee reviews and takes appropriate action with respect to the Company's annual and quarterly consolidated financial statements, the internal audit program, the confidential hot line and related ethics program and disclosures made with respect to the Company's internal controls. To facilitate its risk oversight functions, the Committee has regular interaction and briefings from the Company's office of General Counsel relating to significant litigation and the regulatory environment. The Committee also regularly consults with the Vice President - Internal Audit regarding audits conducted by the internal audit team on corporate and branch office processes and compliance matters with Section 404 of the Sarbanes Oxley Act of 2002.
The Audit and Governance Committee adopted its charter in August 2010 and last amended it on February 26, 2015. As described in the charter, the Audit and Governance Committee's primary duties and responsibilities include:
• | Oversee the accounting and financial reporting processes of the Company and the audits of the Company's consolidated financial statements; |
• | Assist the Board of Directors in overseeing: (A) the quality and integrity of the Company's consolidated financial statements; (B) the Company's compliance with legal and regulatory requirements; (C) the independent Auditors qualifications and independence; (D) the performance of the Company's internal audit function and independent auditors; and (E) the effectiveness of the Company's internal controls; and |
• | Prepare any report required by the rules of the SEC to be included in any filing with the SEC. |
The Company has established a Compliance Oversight Committee consisting of certain members of the Company's management team. The Compliance Oversight Committee oversees the efforts of the Company in complying with regulatory requirements and in ensuring that the Company's customers have a positive customer experience within the context of a collections relationship. The Compliance Oversight Committee is responsible for reporting to the Board of Directors on the progress on achieving the Company's periodic compliance initiatives.
Code of Ethics
The Company has adopted a code of ethics entitled the “Code of Business Conduct” applicable to our directors, employees and officers, including our principal executive officer and our principal financial and accounting officer. A copy of this Code of Business Conduct is located on the investor relations page of our website which is www.squaretwofinancial.com. We will post amendments to or waivers of the provisions of the Code of Business Conduct, if any, made with respect to any of our directors and executive officers on that website unless otherwise required to disclose any waiver in a Current Report on Form 8-K. Please note that the information contained on our website is not incorporated by reference in, or considered to be a part of this Annual Report on Form 10-K.
123
Item 11. Executive Compensation.
Compensation Discussion and Analysis
Introduction
The purpose of this compensation discussion and analysis ("CD&A") is to provide information about each material element of compensation earned by our "Named Executive Officers" during our 2015 fiscal year. The following discussion and analysis should be read in conjunction with the "2015 Summary Compensation Table" and related tables and narrative that are presented herein.
For our 2015 fiscal year, our Named Executive Officers were:
• Paul A. Larkins, who is our President and Chief Executive Officer.
• P. Scott Lowery, who is our Special Senior Advisor to the President and Chief Executive Officer.
• John D. Lowe, who is our Chief Financial Officer.
• Brian W. Tuite, who is our Chief Business Development Officer.
• J.B. Richardson, Jr., who is our Senior Vice President and Chief Operating Officer.
This CD&A addresses and provides the context behind the numerical and related information contained in the "2015 Summary Compensation Table" and related tables and includes actions regarding executive compensation that occurred after the end of our 2015 fiscal year, including the award of bonuses related to 2015 performance, the establishment of salaries, and the adoption of any new, or the modification of any existing, compensation programs.
Processes and Procedures for Considering and Determining Executive and Director Compensation
Our executive compensation program is administered by the Compensation Committee of the Board of Directors. The Compensation Committee determines the compensation of our Chief Executive Officer and the Special Senior Advisor to the President and CEO and approves the compensation of the remaining Named Executive Officers. With the assistance of the CEO, the Compensation Committee administers CA Holding's 2005 Equity Incentive Plan ("Equity Plan"). Under the Compensation Committee Charter, the Compensation Committee has the authority to:
• Review and approve corporate goals and objectives relevant to the compensation of the CEO and other executive officers and evaluate the executive officers' performance in light of those goals and objectives;
• Develop the compensation levels of the CEO and review the compensation levels for the other executive officers in light of such evaluation;
• Make recommendations to the Board of Directors with respect to incentive compensation plans and equity-based plans; and
• Consider and authorize the compensation philosophy for the Company's personnel.
Overview
Our Compensation Philosophy and Purpose. The Compensation Committee is charged with establishing and reviewing the performance and compensation of our executive officers. Our compensation philosophy is to establish and maintain base salaries, bonus plans and equity-based compensation plans that attract and retain qualified executive officers and key employees necessary for our continued successful operation and growth. The underlying goal of our compensation plans is to ensure that management is rewarded appropriately for its contributions to our growth and profitability in alignment with our short and long term objectives and stockholder interests, while not rewarding those actions that expose us and our key stakeholders to undue risk.
124
Our compensation philosophy is generally focused on the following:
• Performance and Experience Based Pay. Base salaries are commensurate with the executive's or key employee's experience and expertise coupled with an assessment of: (i) the executive's contribution to the Company, (ii) the responsibilities and experience of the executive, (iii) the terms of any applicable employment agreements, and (iv) the recommendations of the Chief Executive Officer. Incentive compensation is likewise tied to performance and experience.
• Comparable Market Compensation. The Compensation Committee periodically analyzes market compensation data and other relevant information regarding total direct compensation structures, giving appropriate weight to the data from our publicly traded market competitors. We believe that our compensation programs must be competitive both with the direct competition within our industry and also with companies outside of our industry who also recruit outstanding senior talent. This is essential to attract and retain highly talented senior executives both from within and outside our industry, which provides the Company with essential diversity of thought and experience necessary to drive performance. The Compensation Committee has the authority, when it deems it necessary, to retain outside consultants to assist the committee in evaluating the overall appropriateness of the compensation levels of the executive officers of the Company.
• Stockholder Alignment. In general, the payment of our incentive compensation is dependent upon the achievement of targeted corporate operating measures, including those relating to the Company's financial, operational and compliance objectives, together with an evaluation of departmental and individual contributions to the Company in meeting these objectives. We believe that basing a significant component of employee compensation on corporate results and performance aligns employee interests with long term stockholder interests without encouraging unduly risky behavior. We also believe that (i) granting options to our executives to purchase substantial equity interests or (ii) allowing our executives to purchase Series B-2 Contingent Convertible Preferred Stock in CA Holding, the company that owns 100% of our issued and outstanding stock, provides significant incentive to the executive officers to perform in a manner that best balances the need for growth and risk management in a fashion that aligns management incentives with the goals of the other stockholders.
• Retention of Key Individuals. We believe that our compensation program is designed to attract and retain highly talented individuals critical to our success by providing competitive total compensation with significant retention features. The Company is highly dependent on attracting and retaining individuals with significant management experience and therefore, the Compensation Committee believes that the compensation packages granted to executive officers must provide them appropriate incentives to remain with the Company. Our compensation philosophy is designed to retain our executives and other key employees, while also strongly aligning their incentives with the long term goals of the stockholders of our parent company.
• Severance. To provide sufficient assurances to our executives, the Compensation Committee approved severance protection arrangements contained within their executive employment agreements for certain of our current executive officers that provide for payments if the executive's employment is terminated without cause or if the executive resigns for good reason. The Company believes that this is essential both to attract key talent and also to provide these executives with a requisite level of security that allows them to focus solely on the long term well-being of the Company.
Outside Consultants. Our Compensation Committee has the authority, in the exercise of its sole discretion, and at our expense, to hire outside advisors and consultants to assist it with developing appropriate compensation plans and policies. If the Compensation Committee determines that the existing compensation plans and policies are inappropriate to meet the above described goals, the Compensation Committee may decide to retain outside consultants to assist with the discharge of its duties. In setting compensation packages, the Compensation Committee compares Company compensation with publicly traded companies in our industry and other similarly sized companies. These publicly traded companies are Portfolio Recovery Associates (NASDAQ: PRAA) and Encore Capital Group (NASDAQ: ECPG).
Role of Executives in the Compensation Setting Process. The Compensation Committee generally solicits management's assistance to determine executive compensation as it deems appropriate. However, when reviewing and setting the compensation, benefits, and perquisites of the CEO, neither the CEO nor any employee of the Company is present. When the Compensation Committee reviews the compensation, benefits, and perquisites of all other executives, the CEO may be present during deliberations at the Compensation Committee's discretion, but the CEO may not be present for voting on executive officer compensation, benefits or perquisites. Although the CEO generally makes recommendations to the Compensation Committee with respect to executive compensation decisions, including base salaries, cash incentive bonuses
125
and equity-based awards, the Compensation Committee has, at times, established compensation, benefits or perquisites that were different from that recommended by the CEO.
The Compensation Committee approves all material grants of equity-based awards. The Compensation Committee has delegated to the CEO the right to make certain immaterial equity grants. Equity award grants to executives are determined based on a periodic review by the Compensation Committee regarding appropriate incentives, with recommendations typically originating from management, consistent with the criteria established in the long-term incentive program adopted by the Compensation Committee.
Elements of our Compensation Program
Our compensation plans are designed to provide a competitive total compensation package consistent with our performance in the marketplace. The compensation program for each of our executive officers may include:
• base salary;
• annual cash incentive bonus;
• equity-based compensation incentive, which includes stock options and the right to acquire contingent convertible preferred stock;
• severance protection and/or change of control arrangements for certain of the executive officers; and
• participation in other benefit plans and programs.
While executives have more of their total compensation at risk than other employees, the principles that serve as the basis for executive officer compensation practices apply to the compensation plans for all employees who are eligible for incentive compensation; namely, corporate, departmental and individual performance drive incentive compensation in a manner that holds the individual accountable for performance while also aligning employee interests with the long range interests of our stockholders.
Base Salary. The first component of our executive compensation package is base salary. Our philosophy is to pay base salaries that are commensurate with the executive's experience and expertise, taking into account competitive market data for executives with similar backgrounds, experience and expertise. The factors considered by the Compensation Committee in making its evaluation and determination regarding the appropriateness of base salary include:
• an assessment of each executive's contribution to the Company;
• the responsibilities and experience of each executive;
• competitive market data, individual performance, and other relevant information regarding base salary structures;
• the terms of any applicable employment agreements;
• the detriment to our stockholders should the executive leave our employ including following a change in control of CA Holding or the Company; and
• recommendations of the Chief Executive Officer.
The Compensation Committee generally reviews each executive's base salary and benefits on an annual basis and from time to time as it deems appropriate.
With respect to its periodic review of salaries for our Named Executive Officers and other executive officers for 2015, the Compensation Committee considered data provided by our management which included an assessment of corporate performance, as well as individual performance of each executive. In 2015, the Compensation Committee maintained the 2014 salaries for each of the Named Executive Officers with the exception of Mr. Larkins and Mr. Richardson. Based on Mr. Larkins' performance and the Compensation Committee's view of current market rates, his annual salary was increased from $650,000 to $700,000 during 2015. Based on Mr. Richardson's performance and the Compensation Committee's view of current market rates, his annual salary was increased from $265,000 to $300,000 during 2015. The salaries for the Named Executive Officers
126
are believed to be an appropriate reflection of our compensation philosophy which seeks to find an appropriate balance between "pay at risk" and market competitiveness.
We disclose the base salary earned in 2015 by our Named Executive Officers in the "Salary" column of the "2015 Summary Compensation Table."
Annual Cash Incentive Bonus. The second component of our executive compensation package is an annual cash incentive bonus. Each executive's target bonus is a stated percentage of his or her annual salary. Actual bonuses paid to executives under our annual performance-based cash incentive plan are computed based upon achievement of our corporate performance against targeted operating measures, together with the executive's departmental and individual performance against its annual goals, taking into account the recommendation of the CEO. We believe that variable bonus opportunities should be used to provide significant rewards for outstanding performance and drive the successful achievement of short-term critical business objectives.
The primary metric which the Company currently uses to evaluate its executives' performance is the attainment of annual Adjusted EBITDA goals. The Company believes that this metric captures the need of the Company to grow its business intelligently and maintain an appropriate focus on the cost structure of the Company. Additionally, the Company expects its Named Executive Officers to focus on and achieve significant improvement in key components of its future growth, including, without limitation, the expansion of the Company's purchasing efforts into new product lines and with new creditors, the accuracy of underwriting in relation to actual returns, the hiring, retention and development of individuals who are viewed as being excellent performers and emerging leaders by the Company and the improvement of our operational focus through leveraging innovative business practices and technologies. The use of the department and individual goals to impact the amount of the bonus is designed to ensure that the performance of the individual executive is aligned both with the short term and long range interests of the Company, including financial, operational and compliance objectives, while not rewarding excessively risky behavior.
The bonus is calculated based on a percentage of the Named Executive Officers salary. The following table describes the minimum and target percentages which the executives may receive:
Executive | Minimum | Target | ||||
Paul A. Larkins | 0 | % | 100 | % | ||
P. Scott Lowery | 0 | % | 100 | % | ||
John D. Lowe | 0 | % | 100 | % | ||
Brian W. Tuite | 0 | % | 100 | % | ||
J.B. Richardson, Jr. | 0 | % | 50 | % | ||
For performance which significantly exceeds the targeted expectation, the Compensation Committee may in the exercise of its discretion, provide bonuses that exceed the targeted percentage.
The Compensation Committee exercises its discretion in awarding cash bonuses to our executives. The Compensation Committee may determine not to approve an award for any or all executives or to reduce the amount of any such award, even if the targets are met. The Compensation Committee periodically reviews the bonus component of executive incentive compensation and, in addition to bonuses paid under our plan, the Compensation Committee may approve payment of discretionary bonuses for performance or other reasons for certain executives.
For 2015, the Compensation Committee established goals and parameters for the annual cash incentive program based on corporate financial and strategic objectives reflected in our 2015 operating plan approved by the Board of Directors, as well as a stated bonus target for each individual. The initial goal for Adjusted EBITDA was $177.3 million for 2015. In 2015, the Company earned $166.0 million in Adjusted EBITDA which was approximately 93.6% of the target. Based on this performance, together with the Company's performance in achieving its strategic and tactical initiatives, the Compensation Committee agreed to fund the management bonus pool in an amount equal to 90.6% of the targeted bonus for the management discretionary bonus pool. For an explanation of the Adjusted EBITDA metric, refer to the "Adjusted EBITDA" heading in the "Management's Discussion and Analysis of Financial Condition and Results of Operations" section.
127
Based on the Compensation Committee's corporate, departmental and individual performance for 2015, actual bonus payouts for our Named Executive Officers, paid in March 2016 and reported in the "2015 Summary Compensation Table" below, were $775,000 for Mr. Larkins which represented 111% of his base salary, $100,000 for Mr. Lowery which represented 29% of his base salary, $330,000 for Mr. Lowe which represented 94% of his base salary, $240,000 for Mr. Tuite which represented 80% of his base salary, and $170,000 for Mr. Richardson which represented 57% of his base salary.
Equity-Based Compensation. The third component of our executive compensation package is equity-based compensation incentive, which has traditionally taken the form of qualified stock options to purchase common stock of CA Holding or the sale of contingent convertible preferred stock of CA Holding. The Compensation Committee grants equity-based compensation options to our executive officers and key employees to more closely align the interests of our executive officers and key employees with the long-term interests of SquareTwo and our direct and indirect stockholders.
The equity-based compensation incentive and the contingent preferred stock purchase program incentive are made through the Equity Plan.
2005 Equity Incentive Plan. On August 5, 2005, CA Holding, our sole stockholder, promulgated the Equity Plan which was amended and restated on November 21, 2006 and was further amended pursuant to a First Amendment to Amended and Restated 2005 Equity Incentive Plan. The Equity Plan was promulgated for the purpose of promoting the success of the Company's business through providing options and stock to those individuals who are important in promoting the business interests of the Company and its stockholders.
Under the terms of the Equity Plan, CA Holding has reserved 160,000 shares of non-voting common stock, 60,000 shares of Series A-2 Preferred Stock, 450,000 shares of Series B-1 Contingent Convertible Preferred Stock, 200,000 shares of Series B-2 Contingent Convertible Preferred Stock and 50,000 shares of Series C-1 Contingent Convertible Preferred Stock for issuance to employees and directors of CA Holding or its subsidiaries. The following is a general description of the various classes of stock of CA Holding available for issuance under the Equity Plan:
1. | Non-Voting Common Stock is common stock of CA Holding without the right to vote on affairs of CA Holding. |
2. | Series A-2 Non-Convertible Preferred Stock is preferred stock of CA Holding that has a preference over all shares of capital stock other than the Series PL Preferred Stock, Series A Preferred Stock, Series AA Preferred Stock and Series A-1 Preferred Stock. The terms of the Series A-2 Non-Convertible Preferred Stock provide for a mandatory cumulative dividend of 9% per annum. Upon the occurrence of a Liquidity Event, holders of the Series A-2 Non-Convertible Preferred Stock are entitled to receive $99.90 per share plus all accrued but unpaid dividends. Holders of the Series A-2 Non-Convertible Preferred Stock have limited voting rights relating to amendments to the Seventh Amended and Restated Certificate of Incorporation of CA Holding (the "CA Holding Certificate of Incorporation") that adversely impact their rights. |
3. | Series B-1 Contingent Convertible Preferred Stock is non-dividend bearing preferred stock of CA Holding that is convertible into common stock upon the occurrence of a Liquidity Event. The conversion rate is based upon the achievement of certain IRR thresholds by KRG Capital Fund II, L.P., which is described in more detail in Section 4 of the CA Holding Certificate of Incorporation. The Series B-1 Contingent Convertible Preferred Stock is non-voting. |
4. | Series B-2 Contingent Convertible Preferred Stock is non-dividend bearing preferred stock that is convertible to common stock upon the occurrence of a Liquidity Event. The conversion rate is based upon the achievement of certain IRR and ROI thresholds by KRG Capital Fund II, L.P., which is described in more detail in Section 4 of the CA Holding Certificate of Incorporation. The Series B-2 Contingent Convertible Preferred Stock is non-voting. In addition to the conversion rights of the B-2 Contingent Convertible Preferred Stock, the owners of the stock share in a liquidation preference ranging from an aggregate of $0 to $40,000,000 based upon the “Adjusted Total Equity Value” (as defined in the CA Holding Certificate of Incorporation) upon the sale or other liquidation of CA Holding. The Series B-2 Liquidation Value is described in more detail in Section 3(f) of the CA Holding Certificate of Incorporation. |
5. | Series C-1 Contingent Convertible Preferred Stock is non-dividend bearing preferred stock that is convertible to common stock upon the occurrence of a Liquidity Event. The conversion rate is based upon the achievement of certain IRR thresholds by KRG Capital Fund II, L.P., which conversion rights are described in more detail in Section 4 of the CA Holding Certificate of Incorporation. The Series C-1 Contingent Convertible Preferred Stock is non-voting. The Series C-1 Contingent Convertible Preferred Stock was issued solely to employees of Impulse Marketing Group, an entity that was formerly affiliated with the Company and that was sold in December 2008. |
128
All Series B-1 Contingent Convertible Preferred Stock, Series B-2 Contingent Convertible Preferred Stock and Series C-1 Contingent Convertible Preferred Stock are subject to the right of CA Holding to reacquire the stock upon the executive leaving the employ of CA Holding or its subsidiaries. For Series B-1 Contingent Convertible Preferred Stock and Series C-1 Contingent Convertible Preferred Stock, the repurchase period runs for either three years or five years from the date of purchase with the right expiring as to one-third or one-fifth, respectively, of the stock each year. For the Series B-2 Contingent Convertible Preferred Stock, the repurchase period runs for five years from the date of purchase with the right expiring as to one-fifth of the stock each year.
For the purposes of the classes of contingent convertible preferred stock or the Series PL Preferred Stock, a "Liquidity Event" is either a Qualified IPO (as defined in the CA Holding Certificate of Incorporation) by CA Holding the sale of 50% or more of the combined voting power of the outstanding securities of CA Holding, or a sale of all or substantially all of the assets of CA Holding.
The Compensation Committee, acting as the Administrator of the Equity Plan, has the authority to issue stock pursuant to the Equity Plan at any time. The Chief Executive Officer has been granted the authority to approve, without Compensation Committee approval, de minimus amounts of stock. It is our belief and practice that using a grant or purchase at the time of employment or upon a serious change in corporate role or as a non-repeated onetime event, focuses the executive officer on the long term goals of the Company without any competing pressure to focus on short term goals to increase equity grants or purchases.
In weighing the determination of which long term incentive to provide, there is a strong bias towards aligning the interests of the stockholder with the executive officers through the use of stock or stock options. It is the view of the Compensation Committee that alternative methods of long term compensation which might involve the payment of cash are less effective in focusing the attention of the executive officers on the same long term interests as our other stockholders-namely, long term, sustainable and profitable growth of the business.
In choosing between contingent convertible preferred stock and options to purchase common stock, the Compensation Committee has historically favored the contingent convertible preferred stock because the initial investment exposes the holder to downside market risk. This is true because (i) the contingent convertible preferred stock involves the purchase of the stock and requires the recipient to make a cash payment as opposed to a granting of the option and (ii) the conversion being tied to the attainment of certain return thresholds for KRG provides the owner of the stock with a significant incentive to maximize the return because each increment of return leads to an increase in the amount of common stock into which the stock will be converted.
Series PL Preferred Stock. In addition to the stock acquired under the Equity Plan, CA Holding has established a separate class of stock, Series PL Preferred Stock. All 250 authorized shares of Series PL Preferred Stock were purchased by Mr. Larkins in 2009. Series PL Preferred Stock is non-dividend bearing preferred stock. The Series PL Preferred Stock has a variable liquidation preference over all other classes of CA Holding stock payable upon a Liquidity Event. The amount of the liquidation preference ranges from $0 to $248,000 per share, and is based upon the enterprise value of the Company at the time of the Liquidity Event. The purpose of offering Mr. Larkins the ability to purchase this stock at fair market value was to incentivize him to maximize the enterprise value of the Company at the time of a corporate transaction that will benefit the stockholders and other stakeholders of our parent company.
The Company determined the total purchase price for the Series PL Preferred Stock of $280,800 through the consultation of a third party valuation firm and the use of all available data at the time. Mr. Larkins paid $50,000 of the purchase price in cash and the remaining $230,800 was financed by CA Holding pursuant to a Promissory Note that is secured by the Series PL Preferred Stock. This note matures upon the earliest of January 1, 2018, the occurrence of a “Qualified IPO” or a “Change of Control Event” (each as defined in the CA Holding Certificate of Incorporation). The principal amount of the Note bears interest at the lower of 1) the mid-term applicable published federal rate, or 2) the highest rate per annum from time to time permitted by applicable law. Payments of interest only on the note are made on an annual basis.
Severance and Change in Control Agreements. Pursuant to the terms of their employment agreements, the Compensation Committee has approved certain severance arrangements for Messrs. Larkins, Lowery, Lowe and Tuite.
Mr. Larkins' employment agreement dated April 1, 2013 provides for certain severance arrangements including in situations involving a change in control of the Company or CA Holding. Pursuant to the terms of the agreement, if Mr. Larkins' employment is terminated without Cause or he terminates the agreement for Good Reason (as such terms are defined in the agreement) at any time during the term of the agreement, upon execution and delivery of a release and waiver of claims, he is entitled to continuation of his then-current salary for twelve months immediately following his date of termination. In addition,
129
if he is terminated without Cause or resigns for Good Reason, he will receive a bonus payment in an amount equal to the bonus that would have been paid by us for the then current twelve month bonus period multiplied by the number of days that have elapsed in such period as of the termination divided by 365. The terms of the agreement also provide that if Mr. Larkins is eligible under and elects to continue his medical and dental coverage under COBRA, we will continue to pay his COBRA for a twelve month period, unless Mr. Larkins earlier becomes eligible to receive health care pursuant to a subsequent employer's group healthcare plan. The agreement contains a one year non-compete and non-solicitation provision.
Mr. Lowery's employment agreement dated August 5, 2005 provides for certain severance arrangements including in situations involving a change in control of the Company or CA Holding. Pursuant to the terms of the agreement, if Mr. Lowery's employment is terminated without Cause or if he terminates the agreement for Good Reason (as such terms are defined in the agreement) at any time during the term of the agreement, upon execution and delivery of a release and waiver of claims, he is entitled to continuation of his then-current salary for twelve months immediately following his date of termination. In addition, if he is terminated without Cause or resigns for Good Reason, he will receive a bonus payment in the amount equal to the bonus which would have been paid by us if our Adjusted EBITDA continued at the same rate per month as experienced from the beginning of the current period through the date of termination multiplied by a fraction equal to the number of calendar days in the then current bonus period that have elapsed in such period as of the termination divided by 365. The terms of the agreement include a provision to provide Mr. Lowery with medical, dental, life and disability benefits until the later to occur of one year following termination or the expiration of the non-compete and non-solicitation provision. The agreement contains a one year non-compete and non-solicitation provision.
Mr. Lowe's employment agreement dated August 1, 2014 provides for certain severance arrangements including in situations involving a change in control of the Company or CA Holding. Pursuant to the terms of the agreement, if Mr. Lowe's employment is terminated without Cause or he terminates the agreement for Good Reason (as such terms are defined in the agreement) at any time during the agreement, upon execution and delivery of a release and waiver of claims, he is entitled to continuation of his then-current salary for twelve months immediately following his date of termination. In addition, if he is terminated without Cause or resigns for Good Reason, he will receive a bonus payment in an amount equal to the bonus that would have been paid by us for the then current twelve month bonus period multiplied by the number of days that have elapsed in such period as of the termination divided by 365. The terms of the agreement also provide that if Mr. Lowe is eligible under and elects to continue his medical and dental coverage under COBRA, we will continue to pay his COBRA for a twelve month period, unless Mr. Lowe earlier becomes eligible to receive health care pursuant to a subsequent employer's group healthcare plan. The agreement contains a one year non-compete and non-solicitation provision.
Mr. Tuite's employment agreement dated April 1, 2013 provides for certain severance arrangements including in situations involving a change in control of the Company or CA Holding. Pursuant to the terms of the agreement, if Mr. Tuite's employment is terminated without Cause or if he terminates the agreement for Good Reason (as such terms are defined in the agreement) at any time during the term of the agreement, upon execution and delivery of a release and waiver of claims, he is entitled to continuation of his then-current salary for six months immediately following his date of termination. In addition, if he is terminated without Cause or resigns for Good Reason, he will receive a bonus payment in an amount equal to the bonus that would have been paid by us for the then current twelve month bonus period multiplied by the number of days that have elapsed in such period as of the termination divided by 365. The terms of the agreement also provide that if Mr. Tuite is eligible under and elects to continue his medical and dental coverage under COBRA, we will continue to pay his COBRA for a six month period, unless Mr. Tuite earlier becomes eligible to receive health care pursuant to a subsequent employer's group healthcare plan. The agreement contains a one year non-compete and non-solicitation provision.
We believe that the provisions of our severance and change in control arrangements with Messrs. Lowery, Larkins, Lowe and Tuite are consistent with the principal objectives of our compensation programs. We believe that the compensation elements that would be triggered upon termination are (i) consistent with the market in which we operate, (ii) at appropriate levels when viewed in relation to the benefits the executives provide us and our stockholders and the overall value of SquareTwo, (iii) designed to compensate the executives for playing a significant role in managing our affairs, (iv) will provide an important "safety net" that allows these executives to focus on our business and pursue the course of action that is in the best interests of our stockholders by alleviating some concerns regarding their personal financial well-being in the event of a termination or change of control transaction, and (v) provides compensation to the executives for the non-compete provisions contained in their employment agreements.
Other Benefits and Programs. For Messrs. Larkins and Lowery, the Company has provided health insurance without these individuals making an employee contribution for the insurance. Under the terms of this arrangement, these individuals are provided family coverage at the lowest level of coverage provided for any of our employees. On any enhanced coverage, these individuals will pay the differential employee contribution.
130
For all employees of the Company, the Company pays for life insurance in an amount equal to one times the annual salary of the employee not to exceed $150,000. For the Named Executive Officers and certain other executive officers, the Company pays for life insurance with a benefit in an amount equal to the lesser of (i) the annual salary of the executive officer or (ii) $250,000.
As with all other full time employees of the Company, all of the Named Executive Officers are beneficiaries of the Company's short and long term disability programs. For executives who meet the eligibility requirements for short term disability, the Company will pay an amount equal to 66.66% of the executives' salary up to an amount equal to $2,000 per week. For executives who meet the eligibility requirements for long term disability, the Company will pay an amount equal to 60% of the executives' salary up to an amount equal to $10,000 per month.
As with all other employees of the Company, the Named Executive Officers may participate in the SquareTwo Financial 401(k) Plan. Under the terms of the 401(k) Plan, the Company will contribute to the 401(k) Plan in an amount based upon the contributions of the employee. Pursuant to the 401(k) Plan, the Company matches on a dollar for dollar basis, employee contributions in an amount up to 3% of the employee's gross wages excluding bonuses, subject to the annual compensation IRS Code limitation of $265,000 in 2015. For the next 2% that the employee contributes to the 401(k) Plan, the Company matches 50% of the employee contribution.
In 2015, the Company contributed $10,600 to match Mr. Larkins' contributions to the 401(k) Plan; $10,600 to match Mr. Lowery's contributions to the 401(k) Plan; $10,600 to match Mr. Lowe's contributions to the 401(k) Plan; $10,400 to match Mr. Tuite's contributions to the 401(k) Plan and $10,600 to match Mr. Richardson's contributions to the 401(k) Plan.
Perquisites. The Company believes in substantially limiting significant perquisites provided to the executive officers to those deemed essential to recruit and retain highly qualified executive officers.
Other Matters Relating to Executive Compensation
Option Strike Price. Our Board of Directors periodically sets an estimated valuation of the common stock. Options granted by the Company will have exercise prices based upon the then current estimated valuation of the common stock. We believe that this approach effectively aligns the option recipients with the long term objectives of the stockholders and causes the employees to focus on the goal of increasing stockholder value.
131
Summary Compensation Table
The following table sets forth information concerning compensation earned by, or paid to, each of our Named Executive Officers for services provided to us and our subsidiaries for the years ended December 31, 2015, 2014, and 2013:
Name and Principal Position | Year | Salary | Bonus | Stock Awards | Option Awards(1) | All Other Compensation(2) | Total | |||||||||||||||||||
Paul A. Larkins, | 2015 | $ | 690,385 | $ | 775,000 | $ | — | $ | — | $ | 27,940 | $ | 1,493,325 | |||||||||||||
President and Chief Executive Officer | 2014 | 675,000 | 750,000 | — | — | 26,545 | 1,451,545 | |||||||||||||||||||
2013 | 609,615 | 500,000 | — | — | 29,928 | 1,139,543 | ||||||||||||||||||||
P. Scott Lowery, | 2015 | 350,010 | 100,000 | — | — | 66,215 | 516,225 | |||||||||||||||||||
Co-Founder and Special Senior Advisor to the President and Chief Executive Officer | 2014 | 363,462 | 200,000 | — | — | 83,486 | 646,948 | |||||||||||||||||||
2013 | 350,000 | 150,000 | — | — | 100,196 | 600,196 | ||||||||||||||||||||
John D. Lowe, | 2015 | 350,010 | 330,000 | — | — | 10,708 | 690,718 | |||||||||||||||||||
Senior Vice President and Chief Financial Officer | 2014 | 246,577 | 275,000 | — | — | 8,390 | 529,967 | |||||||||||||||||||
Brian W. Tuite, | 2015 | 299,990 | 240,000 | — | — | 10,684 | 550,674 | |||||||||||||||||||
Executive Vice President and Chief Business Development Officer | 2014 | 311,539 | 250,000 | — | — | 19,302 | 580,841 | |||||||||||||||||||
2013 | 286,539 | 165,000 | — | — | 19,030 | 470,569 | ||||||||||||||||||||
J.B. Richardson, Jr. | 2015 | 294,605 | 170,000 | — | — | 10,708 | 475,313 | |||||||||||||||||||
Senior Vice President and Chief Operating Officer | 2014 | 253,269 | 185,000 | — | — | 3,699 | 441,968 | |||||||||||||||||||
2013 | 229,616 | 85,000 | — | — | 3,834 | 318,450 | ||||||||||||||||||||
(1) Amount represents the grant date fair value of option awards. Refer to Note 2 to the consolidated financial statements for discussion of valuation methodology and assumptions.
(2) Amounts set forth in the All Other Compensation column consist of the following:
Perquisites | Total Perquisites & Other Compensation | |||||||||||||||||||
Name | Company Airplane(1) | All Other Perquisites(2) | Total Perquisites | 401k Match | ||||||||||||||||
Paul A. Larkins | $ | 9,244 | $ | 8,096 | $ | 17,340 | $ | 10,600 | $ | 27,940 | ||||||||||
P. Scott Lowery | 22,047 | 33,568 | 55,615 | 10,600 | 66,215 | |||||||||||||||
John D. Lowe | — | 108 | 108 | 10,600 | 10,708 | |||||||||||||||
Brian W. Tuite | — | 284 | 284 | 10,400 | 10,684 | |||||||||||||||
J.B. Richardson, Jr. | — | 108 | 108 | 10,600 | 10,708 | |||||||||||||||
(1) The cost to the Company for use of the Company plane for personal travel for Messrs. Larkins and Lowery.
(2) For 2015, All Other Perquisites primarily include cost of insurance benefits not offered to other employees for Messrs. Larkins and Lowery. None of these perquisites by type are greater than $25,000 for any Named Executive Officer.
The Compensation Committee provided a bonus of $775,000 to Mr. Larkins based upon his significant leadership of the Company and his substantial progress toward achieving corporate and individual objectives across a number of strategic areas.
In setting the bonus for Mr. Lowery, the Compensation Committee determined that a bonus of $100,000 would establish a total compensation level commensurate with the significant value which he provides to the Company through his deep knowledge of the industry and his substantial interactions with the branch offices.
The Compensation Committee provided a bonus of $330,000 to Mr. Lowe based upon corporate performance and his progress toward departmental and individual objectives.
132
The Compensation Committee provided a bonus of $240,000 to Mr. Tuite based upon corporate performance and his progress toward achieving departmental and individual objectives, including his continued development of additional client relationships.
The Compensation Committee provided a bonus of $170,000 to Mr. Richardson based upon corporate performance and his progress toward achieving departmental and individual objectives.
2015 Grants of Plan-Based Awards
There were no grants of plan-based awards to our Named Executive Officers or purchases of stock under the terms of the Equity Plan by our Named Executive Officers during the year ended December 31, 2015.
Option Exercises and Stock Vested
During the year ended December 31, 2015 there were no exercises of common stock options by our Named Executive Officers. The Named Executive Officer option award that vested during 2015 was 200 common stock options to Mr. Lowe.
As previously mentioned, the B-1 and B-2 Contingent Convertible Preferred shares purchased by certain executives are subject to a three and five year repurchase period, respectively, from the date of purchase. The following table sets forth summary information relating to the lapsing of the Company's repurchase right relating to the B-1 and B-2 Contingent Convertible Preferred shares as of December 31, 2015:
Repurchase Lapsed | Subject to Repurchase | Repurchase Lapsed | Subject to Repurchase | |||||||||
Name | B-1 Preferred | B-1 Preferred | B-2 Preferred | B-2 Preferred | ||||||||
Paul A. Larkins(1) | — | — | 72,500 | 7,500 | ||||||||
P. Scott Lowery | 106,224 | — | 25,000 | 2,500 | ||||||||
Brian W. Tuite | — | — | 14,100 | 400 | ||||||||
J.B. Richardson, Jr. | — | — | 3,200 | 300 | ||||||||
(1) Subsequent to his purchase of stock, in a series of permitted transactions, Mr. Larkins made gifts of 30,200 shares of the B-2 stock to various family trusts and a limited partnership.
2015 Outstanding Equity Awards at Fiscal Year-End
The following table sets forth information concerning option awards to purchase shares of common stock of CA Holding that were outstanding (vested or unvested) as of December 31, 2015 with respect to the Named Executive Officers. Vesting of each award accelerates upon death, disability or a change of control:
Option Awards(1) | ||||||||||||
Name | Number of Securities Underlying Unexercised Options (#) Exercisable | Number of Securities Underlying Unexercised Options (#) Unexercisable | Option Exercise Price ($) | Option Expiration Date | ||||||||
John D. Lowe | 1,000 | — | $ | 20.00 | 12/28/2020 | |||||||
Brian W. Tuite | 1,250 | — | $ | 20.00 | 9/18/2019 | |||||||
(1) Refer to Note 2 to the consolidated financial statements for further discussion of option awards and vesting period.
133
Potential Payments upon a Termination or Change of Control
The following table sets forth the possible compensation for our Named Executive Officers in certain instances of a termination without cause, including in situations involving a change in control:
Name | Severance Salary Payments (1) | Severance Bonus Payments (1)(2) | COBRA or Individual Insurance Premiums(1) | Total | ||||||||||||
Paul A. Larkins | $ | 700,000 | $ | 700,000 | $ | 17,290 | $ | 1,417,290 | ||||||||
P. Scott Lowery | 350,000 | 350,000 | 24,914 | 724,914 | ||||||||||||
John D. Lowe | 350,000 | 350,000 | 21,786 | 721,786 | ||||||||||||
Brian W. Tuite | 150,000 | 300,000 | 12,141 | 462,141 | ||||||||||||
(1) Severance salary payments, severance bonus payments, and COBRA or individual insurance premiums are calculated based upon each Named Executive Officer's salary and benefits in effect as of December 31, 2015. Refer to the Severance and Change in Control Agreements section herein for discussion of severance arrangements for Named Executive Officers.
(2) The stated severance bonus payment amounts are based on the Company achieving 100% of the Adjusted EBITDA target and assume a full year of service. The plan is a performance-based incentive plan and therefore the payment amount at the time of separation could be higher or lower than the amounts noted above. Per the executive employment agreements, the amount paid out would be equal to the bonus that would have been paid for the then current twelve month bonus period multiplied by the number of days that have elapsed in such period as of the termination divided by 365.
2015 Director Compensation
Compensation Arrangements with Directors
The Board of Directors has established the following compensation arrangements for our independent directors who are neither employed by the Company nor affiliated with KRG:
• An annual retainer of $50,000 for service on the Board of Directors and attendance at meetings of the Board of Directors or any committees of the Board of Directors;
• An annual retainer of $50,000 for service as the Chairperson of the Audit and Governance Committee of the Company;
• An annual payment of $10,000 per committee for service as a member of the Audit and Governance Committee or Compensation Committee;
• An initial grant of an unvested option to purchase 1,000 shares of CA Holding, Inc. common stock at an exercise price determined by the Board of Directors;
• An initial grant of an unvested option to purchase 1,000 shares of CA Holding, Inc. common stock at an exercise price determined by the Board of Directors for service as chairperson of the Audit and Governance Committee;
• On each anniversary date of the director's election to the Board of Directors, a grant of unvested options to purchase 500 shares of CA Holding, Inc. for common stock at a price equal to a price determined by the Board of Directors at the time of grant; and
• All out of pocket expenditures incurred by the individual director in attending the meeting will be reimbursed by the Company.
The Company has agreed with Mr. Bunn that any cash compensation may, at his election, be paid to a charitable foundation of his choosing. To date, all cash compensation paid to Mr. Bunn has been paid to Foundation for the Carolinas.
All stock options granted or required to be granted to directors will have a one to three year vesting period. The options will expire upon the earlier to occur of a date which is ten years from the date of granting or sixty days from the date that the director leaves the Company's Board of Directors. For all options granted to directors in 2015 and 2014, the exercise price is $20.00 per share. Through the significant equity component of the directors' compensation, the Company believes that it has properly aligned the interests of the independent director with the long term goals of the shareholders of the Company.
134
Directors who are Company employees or who are employed by KRG receive no incremental compensation for their membership on the Board of Directors.
The following table sets forth the compensation received by our non-employee directors or their designees for the fiscal year ended December 31, 2015:
Name | Fees Earned or Paid in Cash | Option Awards(1)(2) | Total | |||||||||
Kimberly S. Patmore | $ | 100,000 | $ | 5,434 | $ | 105,434 | ||||||
Thomas W. Bunn | 60,000 | (3) | 5,451 | 65,451 | ||||||||
Thomas R. Sandler | 60,000 | 5,404 | 65,404 | |||||||||
(1) Represents the total fair value of the option awards at the time of issuance. Our methodology for estimating share-based compensation cost is disclosed in Note 2 of the consolidated financial statements.
(2) As of December 31, 2015, Ms. Patmore, Mr. Bunn and Mr. Sandler had outstanding option awards to purchase common stock of CA Holding of 4,500, 3,500, and 3,500, respectively.
(3) Paid to Foundation for the Carolinas.
Compensation Committee Interlocks and Insider Participation
The members of our Compensation Committee during the fiscal year ended December 31, 2015 were directors Christopher J. Lane, Bennett R. Thompson, and Thomas W. Bunn. None of these individuals has been an officer or employee of the Company during the most recent completed fiscal year and no executive officer of the Company served on the compensation committee (or equivalent committee) or board of any company that employed any member of our Compensation Committee or our Board of Directors.
Compensation Committee Report
The Compensation Committee has reviewed and discussed with management the Compensation Discussion and Analysis provided herein. Based on its review and discussions, the Compensation Committee recommended to the Board of Directors that the Compensation Discussion and Analysis be included in this Annual Report on Form 10-K.
Respectfully submitted,
Christopher J. Lane
Bennett R. Thompson
Thomas W. Bunn
135
Item 12. Security Ownership of Certain Beneficial Owners and Management and Related Stockholder Matters.
Equity Compensation Plan Information
CA Holding, our sole stockholder, promulgated the Equity Plan which was amended and restated on November 21, 2006 and was further amended pursuant to a First Amendment to Amended and Restated 2005 Equity Incentive Plan. The following table contains certain information regarding options and warrants under the Equity Plan as of December 31, 2015:
Plan Category | Number of securities to be issued upon exercise of outstanding options, warrants and rights(1) | Weighted average exercise price of outstanding options, warrants and rights | Number of securities remaining available for future issuance under equity compensation plans(2) (excluding securities reflected in column (1)) | |||||||
Equity compensation plans approved by security holders | 40,597 | $ | 31.72 | 113,993 | ||||||
Equity compensation plan not approved by security holders | N/A | N/A | N/A | |||||||
Total | 40,597 | $ | 31.72 | 113,993 | ||||||
(1) This balance is comprised of 40,597 outstanding options to purchase Common Non-Voting stock.
(2) This balance is comprised of 77,760 shares of Common Non-Voting stock and 36,233 shares of Series A-2 Non-Convertible Preferred Stock.
Beneficial Ownership
The following table sets forth as of April 25, 2016, the beneficial ownership of voting common stock of SquareTwo and its subsidiaries:
Name and Address | Voting Common Stock Beneficially Owned | Percentage of Voting Common Stock | ||||
CA Holding, Inc. | ||||||
4340 South Monaco Street, Second Floor | ||||||
Denver, CO 80237 | 1,000 | 100.00 | % | |||
136
The following tables contain information regarding the shares of common stock, nonconvertible preferred stock, and contingent convertible preferred stock of Parent as of April 25, 2016 held by (i) each director and director nominee; (ii) each Named Executive Officer; and (iii) all directors and executive officers as a group.
Common Stock:
Name | Voting Common Stock Beneficially Owned | Percentage of Voting Common Stock | Non-Voting Common Stock Beneficially Owned(3) | Percentage of Non-Voting Common Stock(3) | ||||||||
Paul A. Larkins | ||||||||||||
P. Scott Lowery | 605,000 | (1) | 35.76 | % | 1,035 | 2.49 | % | |||||
John D. Lowe | 1,000 | 2.35 | % | |||||||||
Brian W. Tuite | 1,250 | 2.91 | % | |||||||||
J.B. Richardson, Jr. | ||||||||||||
Christopher J. Lane(2) | 991,000 | 58.58 | % | |||||||||
Bennett R. Thompson | ||||||||||||
Kimberly S. Patmore | 4,000 | 8.76 | % | |||||||||
Thomas W. Bunn | 3,000 | 6.72 | % | |||||||||
Thomas R. Sandler | 3,000 | 6.72 | % | |||||||||
All Executive Officers & Directors as a Group | 1,596,000 | 94.34 | % | 19,013 | 32.84 | % | ||||||
(1) P. Scott Lowery's voting common shares are held (1) 396,514 by Mr. Lowery, (2) 19,012 by his spouse, Texie Robins Lowery, (3) 28,517 by the Lowery Family Trust of which Ms. Lowery is the trustee, (4) 2,728 by a Grantor Retained Annuity Trust of which Mr. Lowery is the trustee, (5) 28,517 by the Lowery Dynasty Trust of which Mr. Lowery is the trustee and (6) 129,712 held by the Scott Lowery Family Limited Partnership, R.L.L.L.P.
(2) Mr. Lane is deemed to beneficially own the 400,000 shares held by KRG plus the 591,000 shares that are effectively controlled by KRG pursuant to the Voting Trust Agreement discussed in "Certain Relationships and Related Transactions, and Director Independence". Mr. Lane serves as a Managing Director of KRG and has shared voting and investment power with respect to the shares held by KRG. Mr. Lane disclaims beneficial ownership of these shares except to the extent of their pecuniary interest therein.
(3) The numbers and percentages shown include the shares of non-voting common stock owned as of April 25, 2016, as well as the shares of our non-voting common stock that the person or group had the right to acquire within 60 days of such date upon the exercise of options. In calculating the percentage of ownership, shares of non-voting common stock that the identified person or group had the right to acquire within 60 days of April 25, 2016 are deemed to be outstanding for the purpose of computing the percentage of the shares of non-voting common stock owned by such person or group, but are not deemed to be outstanding for the purpose of computing the percentage of the shares of non-voting common stock owned by any other person. The non-voting common stock beneficially owned includes the following number of options for non-voting common stock: for Mr. Lowe, 1,000; for Mr. Tuite, 1,250; for Ms. Patmore, 4,000; for Mr. Bunn, 3,000; for Mr. Sandler, 3,000 and for all executive officers and directors as a group, 19,013.
Nonconvertible Preferred Stock:
Name | Series PL | Percentage of Series PL | Series A | Percentage of Series A | Series AA | Percentage of Series AA | Series A-1 | Percentage of Series A-1 | Series A-2 | Percentage of Series A-2 | |||||||||||||||||||||
Paul A. Larkins | 250 | 100.00 | % | ||||||||||||||||||||||||||||
P. Scott Lowery | 10,000 | 2.03 | % | 551,035 | (1 | ) | 82.83 | % | |||||||||||||||||||||||
John D. Lowe | |||||||||||||||||||||||||||||||
Brian W. Tuite | |||||||||||||||||||||||||||||||
J.B. Richardson, Jr. | |||||||||||||||||||||||||||||||
Christopher J. Lane(2) | 481,939 | 97.95 | % | 138,172 | 94.18 | % | 991,000 | 99.84 | % | ||||||||||||||||||||||
Bennett R. Thompson | |||||||||||||||||||||||||||||||
Kimberly S. Patmore | |||||||||||||||||||||||||||||||
Thomas W. Bunn | |||||||||||||||||||||||||||||||
Thomas R. Sandler | |||||||||||||||||||||||||||||||
All Executive Officers & Directors as a Group | 250 | 100.00 | % | 491,939 | 99.98 | % | 138,172 | 94.18 | % | 991,000 | 99.84 | % | 551,035 | 82.83 | % | ||||||||||||||||
(1) P. Scott Lowery's Series A-2 nonconvertible preferred shares are held (1) 361,575 by Mr. Lowery; (2) 17,283 by Mr. Lowery's spouse, Texie Robins Lowery, (3) 25,925 by the Lowery Family Trust of which Ms. Lowery is the trustee, (4) 2,407 by a Grantor Retained Annuity Trust of which Mr. Lowery
137
is the trustee, (5) 25,925 by the Lowery Dynasty Trust of which Mr. Lowery is the trustee and (6) 117,920 held by Scott Lowery Family Limited Partnership, R.L.L.L.P.
(2) Shares of Series A (295,000), Series AA (68,686), and Series A-1 (400,000) nonconvertible preferred stock beneficially owned by Mr. Lane are shares held in trust by KRG. Additionally, shares of Series A (186,939), Series AA (69,486), and Series A-1 (591,000) are effectively controlled by KRG pursuant to the Voting Trust Agreement discussed in "Certain Relationships and Related Transactions, and Director Independence". Mr. Lane serves as a Managing Director of KRG and has shared voting and investment power with respect to the shares held by KRG. Mr. Lane disclaims beneficial ownership of these shares except to the extent of their pecuniary interest therein.
Contingent Preferred Stock:
Name | Series B-1 | Percentage of Series B-1 | Series B-2 | Percentage of Series B-2 | Series C-1 | Percentage of Series C-1 | ||||||||||
Paul A. Larkins(1) | 80,000 | 40.31 | % | |||||||||||||
P. Scott Lowery | 106,224 | 30.49 | % | 27,500 | 13.86 | % | ||||||||||
John D. Lowe | ||||||||||||||||
Brian W. Tuite | 14,500 | 7.31 | % | |||||||||||||
J.B. Richardson, Jr. | 3,500 | 1.76 | % | |||||||||||||
Christopher J. Lane | ||||||||||||||||
Bennett R. Thompson | ||||||||||||||||
Kimberly S. Patmore | 1,000 | 0.50 | % | |||||||||||||
Thomas W. Bunn | 1,000 | 0.50 | % | |||||||||||||
Thomas R. Sandler | 1,000 | 0.50 | % | |||||||||||||
All Executive Officers & Directors as a Group | 106,224 | 30.49 | % | 148,050 | 74.59 | % | ||||||||||
(1) Subsequent to his purchase of stock, in a series of permitted transactions, Mr. Larkins made gifts of 30,200 shares of the B-2 stock to various family trusts and a limited liability company, which is included in the 80,000 in this table.
Item 13. Certain Relationships and Related Transactions, and Director Independence.
Policies Regarding the Approval of Transactions with Related Parties
Under the Company's Code of Business Conduct, which is applicable to all directors, officers and employees of the Company, each of the aforementioned must report to the Company's General Counsel upon learning of any prospective transaction or relationship in which the director will have a financial or personal interest (direct or indirect) that is with the Company, involves the use of Company assets, or involves competition against the Company (consistent with any confidentiality obligation the director may have). The General Counsel must then advise the Board of Directors of any such transaction or relationship and the Board of Directors must pre-approve any material transaction or relationship.
Under the Company's Code of Conduct, executive officers may not use their personal influence to get the Company to do business with a company in which they, their family members or their friends have an interest. In situations where an executive officer is in a position of influence or where a conflict of interest would arise, the prior approval of the General Counsel is required.
Certain Relationships and Related Transactions
Relationships with KRG
As of December 31, 2015, a series of entities affiliated with KRG owned approximately 23.6% of the outstanding voting stock of CA Holding and CA Holding owned 100% of our issued and outstanding voting stock. KRG is a private equity firm that focuses on a broad range of investments and has extensive experience in equity investments, corporate financing activities and mergers and acquisitions. KRG effectively controls CA Holding pursuant to CA Holding's Third Amended and Restated Stockholders Agreement and a Voting Trust Agreement among an affiliate of KRG and certain other stockholders of CA Holding, pursuant to which KRG has the power to vote a majority of the outstanding voting stock of CA Holding. Representatives of KRG currently hold three of the seven positions on the CA Board. CA Holding, through its control of 100% of our outstanding voting stock, is able to elect all of our directors.
138
On August 5, 2005, SquareTwo entered into a Management Agreement with KRG and CA Holding, pursuant to which KRG provides transaction advisory, financial and management consulting services to CA Holding and its subsidiaries. For the services provided under the Management Agreement, KRG receives an annual fee of $500,000 and certain transaction fees for services rendered with respect to the consummation of acquisitions and business combinations by CA Holding or its subsidiaries or in the event of certain liquidity events, sale transactions or an initial public offering by CA Holding or its subsidiaries. KRG is also entitled to reimbursement for certain costs and expenses related to services it provides under the Management Agreement. During 2015, 2014, and 2013, the management fees earned by KRG were $500,000 for each year.
Messrs. Lane and Thompson are Managing Directors of KRG. As such, Messrs. Lane and Thompson have an indirect financial interest in fees paid to KRG.
Relationships with P. Scott Lowery and the Lowery Family
Equity Ownership. As of December 31, 2015, P. Scott Lowery, a co-founder and a member of our Board of Directors, owned approximately 35.8% of the outstanding voting common stock of CA Holding, either individually through a series of trusts, through his spouse, or through the Scott Lowery Family Limited Partnership. Pursuant to the terms of CA Holding's Third Amended and Restated Stockholders Agreement, Mr. Lowery has the right to be elected as one of the members of the CA Board so long as he holds at least five percent (5%) of the outstanding common stock of CA Holding. Refer to the "Directors, Executive Officers and Corporate Governance" section under the "Board of Directors" heading for further discussion of the composition of our Board of Directors.
Branch Office Ownership. Through the Law Offices of Scott Lowery, Mr. Lowery is the owner of one branch office. We paid purchased debt servicing fees, net of royalties, to these offices totaling $5.1 million, $9.6 million, and $13.5 million for the years ended December 31, 2015, 2014, and 2013, respectively.
Promissory Notes. On September 13, 2001, Collect America, Ltd., n/k/a SquareTwo repurchased from Erma Lowery and Arthur Lowery, Mr. Lowery's mother and brother, respectively, all of their ownership interests in SquareTwo in exchange for promissory notes in the aggregate principal amount of $3.2 million. These promissory notes bear interest at 8.0% per annum, call for an aggregate monthly payment of less than $0.1 million, and matured on January 15, 2016, and will mature on August 15, 2021, respectively. In 2015, we paid an aggregate of $14,000 and $21,000 of interest and $297,000 and $34,000 of principal on these notes, respectively. The largest aggregate amount of principal outstanding in 2015 was $308,000 and $283,000, respectively, and the aggregate amount of principal outstanding at April 25, 2016 was zero due to the note maturity and $238,000, respectively.
Relationships with Other Executive Officers
Promissory Note. Pursuant to a Promissory Note dated August 5, 2009, Paul A. Larkins borrowed $230,800 from CA Holding for the purpose of funding a portion of the purchase of 250 shares of Series PL Preferred Stock of CA Holding. This note is secured by a pledge of the stock purchased with the proceeds of the note. This note bears interest at the lower of (i) the mid-term applicable published federal rate, or (ii) the highest rate per annum from time to time permitted by applicable law, and calls for an interest only payment to be made on the earlier of the payment of annual bonuses to Mr. Larkins or March 31 of each year. The principal amount outstanding under this note has been $230,800 since August 5, 2009. The note matures upon the earliest to occur of a Qualified IPO, a Change in Control (each term as defined in the CA Holding Certificate of Incorporation) or January 1, 2018.
Independence of Directors
The Board of Directors has determined that Ms. Patmore and Messrs. Bunn, Lane, Thompson, and Sandler, who constitute a majority of the Board of Directors, are independent under NASDAQ listing standards. The Board of Directors has determined that the directors designated as "independent" have no relationship with the Company which would interfere with the exercise of their independent judgment in carrying out the responsibilities of a director. During its independence review, the Board of Directors considered transactions and relationships between each director or any member of his/her immediate family and the Company and its subsidiaries and affiliates. Messrs. Lane, Thompson, and Sandler are designees of KRG which owns approximately 23.6% of the voting common stock of the CA Holding, Inc. The Board of Directors concluded this relationship with a stockholder of the Company in and of itself does not impair a director's independent judgment in connection with his duties and responsibilities as a director of the Company. The Board of Directors has determined that each member of the Board of Directors' Compensation and Audit and Governance Committees is independent based on the Board of Directors' applications of the standards of NASDAQ, the SEC and/or the Internal Revenue Service as appropriate for such committee membership.
139
Item 14. Principal Accounting Fees and Services.
Ernst & Young, LLP served as the Company's Independent Registered Accounting Firm with respect to the audits of the Company's consolidated financial statements as of and for the years ended December 31, 2015 and 2014. In connection with the preparation of its 2015 and 2014 corporate income tax returns, the Company retained Ernst & Young, LLP for those permitted non-audit services.
Audit and Non-Audit Fees
The following table presents the fees billed or expected to be billed by Ernst & Young, LLP for the audit of the Company's consolidated financial statements for the years ended December 31, 2015 and 2014, and fees billed for other services rendered during those periods. All the services performed by and fees paid to Ernst & Young, LLP were pre-approved by the Audit and Governance Committee:
2015 | 2014 | |||||||
Audit fees(1) | $ | 549,000 | $ | 408,000 | ||||
Tax fees(2) | 185,500 | 210,378 | ||||||
Other fees(3) | 2,000 | 2,000 | ||||||
Total | $ | 736,500 | $ | 620,378 | ||||
(1) Audit fees primarily related to the audits of the Company's annual consolidated financial statements and reviews of the quarterly condensed consolidated financial statements.
(2) Tax fees primarily relate to the preparation of tax returns and for tax consultation services.
(3) Other fees relate to annual subscription for Ernst & Young, LLP's proprietary research tool.
Approval of Independent Registered Public Accounting Firm Services and Fees
The Audit and Governance Committee's policy is to pre-approve all audit and permissible non-audit services provided by the Company's independent auditors. These services may include audit services, audit-related services, tax services, services related to internal controls and other services. The independent auditors and the Company's Chief Financial Officer periodically report to the Audit and Governance Committee regarding the services provided by the independent auditor in accordance with this pre-approval. The Audit and Governance Committee pre-approved all of the services described above for the Company's 2015 fiscal year.
140
PART IV
Item 15. Exhibits, Financial Statement Schedules.
(a) Financial Statements.
The following consolidated financial statements of SquareTwo and its subsidiaries are filed as part of this Annual Report on Form 10-K under the heading "Financial Statements and Supplementary Data."
Index to Financial Statements | Page |
(b) Exhibits.
Incorporated by Reference | ||||||||||
Exhibit No. | Description | Filed or Furnished Herewith | Form | Exhibit | Filing Date | |||||
3.1.1 | Amended and Restated Certificate of Incorporation of SquareTwo Financial Corporation | S-4 | 3.1.1 | 11/19/2010 | ||||||
3.1.2 | Amended and Restated Bylaws of SquareTwo Financial Corporation | S-4 | 3.1.2 | 11/19/2010 | ||||||
3.2.1 | Certificate of Incorporation of SquareTwo Financial Services Corporation, as amended. | S-4 | 3.2.1 | 11/19/2010 | ||||||
3.2.2 | Bylaws of SquareTwo Financial Services Corporation. | S-4 | 3.2.2 | 11/19/2010 | ||||||
3.3.1 | Articles of Organization of Autus, LLC. | S-4 | 3.3.1 | 11/19/2010 | ||||||
3.3.2 | Operating Agreement of Autus, LLC, as amended. | S-4 | 3.3.2 | 11/19/2010 | ||||||
3.4.1 | Articles of Organization of CACH of NJ, LLC. | S-4 | 3.4.1 | 11/19/2010 | ||||||
3.4.2 | Operating Agreement of CACH of NJ, LLC, as amended. | S-4 | 3.4.2 | 11/19/2010 | ||||||
3.5.1 | Articles of Organization of CACH, LLC. | S-4 | 3.5.1 | 11/19/2010 | ||||||
3.5.2 | Operating Agreement of CACH, LLC, as amended. | S-4 | 3.5.2 | 11/19/2010 | ||||||
3.6.1 | Articles of Organization of CACV of Colorado, LLC. | S-4 | 3.6.1 | 11/19/2010 | ||||||
3.6.2 | Operating Agreement of CACV of Colorado, LLC, as amended. | S-4 | 3.6.2 | 11/19/2010 | ||||||
3.7.1 | Articles of Organization of CACV of New Jersey, LLC. | S-4 | 3.7.1 | 11/19/2010 | ||||||
3.7.2 | Operating Agreement of CACV of New Jersey, LLC, as amended. | S-4 | 3.7.2 | 11/19/2010 | ||||||
141
3.8.1 | Articles of Organization of Candeo, LLC. | S-4 | 3.8.1 | 11/19/2010 | ||||||
3.8.2 | Operating Agreement of Candeo, LLC, as amended. | S-4 | 3.8.2 | 11/19/2010 | ||||||
3.9.1 | Articles of Organization of Collect America of Canada, LLC. | S-4 | 3.9.1 | 11/19/2010 | ||||||
3.9.2 | Operating Agreement of Collect America of Canada, LLC, as amended. | S-4 | 3.9.2 | 11/19/2010 | ||||||
3.10.1 | Articles of Organization of Healthcare Funding Solutions, LLC. | S-4 | 3.10.1 | 11/19/2010 | ||||||
3.10.2 | Operating Agreement of Healthcare Funding Solutions, LLC, as amended. | S-4 | 3.10.2 | 11/19/2010 | ||||||
3.11.1 | Articles of Organization of Orsa, LLC. | S-4 | 3.11.1 | 11/19/2010 | ||||||
3.11.2 | Operating Agreement of Orsa, LLC, as amended. | S-4 | 3.11.2 | 11/19/2010 | ||||||
3.12.1 | Articles of Incorporation of ReFinance America, LTD. | S-4 | 3.12.1 | 11/19/2010 | ||||||
3.12.2 | Bylaws of ReFinance America, LTD. | S-4 | 3.12.2 | 11/19/2010 | ||||||
4.1 | Indenture, dated April 7, 2010, among SquareTwo Financial Corporation, the guarantors named therein and U.S. Bank National Association, as trustee, including the Form of 11.625% Senior Second Lien Note due 2017. | S-4 | 4.1 | 11/19/2010 | ||||||
4.2 | Registration Rights Agreement, dated April 7, 2010, by and among SquareTwo Financial Corporation, the guarantors party thereto, and Banc of America Securities LLC. | S-4 | 4.2 | 11/19/2010 | ||||||
4.3.1 | 11.625% Senior Second Lien Note due 2017 No. A-1 in aggregate principal amount of $288,560,000. | S-4 | 4.3.1 | 11/19/2010 | ||||||
4.3.2 | 11.625% Senior Second Lien Note due 2017 No. S-1 in aggregate principal amount of $1,440,000. | S-4 | 4.3.2 | 11/19/2010 | ||||||
10.1 | Loan Agreement, dated as of April 7, 2010, between SquareTwo Financial Corporation, as US Borrower, Preferred Credit Resources Limited, as Canadian Borrower, the other persons party thereto that are designated as loan parties, GMAC Commercial Finance LLC, as Agent and Lender, and the other financial institution(s) listed on the signature pages thereof, as Lenders. | S-4 | 10.1 | 11/19/2010 | ||||||
10.2 | Amendment No. 1 to Loan Agreement | 8-K | 10.01 | 5/17/2011 | ||||||
10.3 | Consent and Amendment No. 2 to Loan Agreement | 10-K | 10.3 | 3/1/2013 | ||||||
10.4 | Amendment No. 3 to Loan Agreement | 8-K | 10.01 | 5/1/2013 | ||||||
10.5 | Amendment No. 4 to Loan Agreement | 8-K | 10.01 | 10/31/2013 | ||||||
10.6 | Amendment No. 5 to Loan Agreement | 8-K | 10.01 | 5/21/2014 | ||||||
10.7 | Amendment No. 6 to Loan Agreement | 8-K | 10.01 | 11/13/2014 | ||||||
10.8 | Security Agreement, dated April 7, 2010, among SquareTwo Financial Corporation, the US loan parties signatory thereto, and GMAC Commercial Finance LLC, in its individual capacity and as administrative and collateral agent. | S-4 | 10.2 | 11/19/2010 | ||||||
10.9 | Pledge Agreement, dated April 7, 2010, by and among the pledgors party thereto and GMAC Commercial Finance LLC as agent. | S-4 | 10.3 | 11/19/2010 | ||||||
142
10.10 | Second Lien Pledge Agreement, dated April 7, 2010, by and among the pledgors party thereto and U.S. Bank National Association as collateral agent. | S-4 | 10.4 | 11/19/2010 | ||||||
10.11 | Second Lien Security Agreement, dated April 7, 2010, among SquareTwo Financial Corporation, the guarantors signatory thereto, and U.S. Bank National Association, as collateral agent. | S-4 | 10.5 | 11/19/2010 | ||||||
10.12 | Intercreditor Agreement, dated April 7, 2010, by and among GMAC Commercial Finance LLC, as Senior Agent and U.S. Bank National Association, as Junior Agent. | S-4 | 10.6 | 11/19/2010 | ||||||
10.13.1 | Purchase Agreement, dated April 1, 2010, among SquareTwo Financial Corporation, the guarantors party thereto, and Banc of America Securities LLC, acting on behalf of itself and as the representative of the several initial purchasers named therein. | S-4 | 10.7 | 11/19/2010 | ||||||
10.13.2 | Note Guarantee to 11.625% Senior Second Lien Notes due 2017 No. A-1. | S-4 | 10.8.1 | 11/19/2010 | ||||||
10.14 | Note Guarantee to 11.625% Senior Second Lien Notes due 2017 No. S-1. | S-4 | 10.8.2 | 11/19/2010 | ||||||
10.15 | Copyright Assignment of Security, dated April 7, 2010, between SquareTwo Financial Corporation and GMAC Commercial Finance LLC, as agent. | S-4 | 10.9 | 11/19/2010 | ||||||
10.16 | Trademark Assignment of Security, dated April 7, 2010, between SquareTwo Financial Corporation and GMAC Commercial Finance LLC, as agent. | S-4 | 10.10 | 11/19/2010 | ||||||
10.17 | Tax Sharing Agreement, dated March 22, 2010, among CA Holding, Inc. and the Subsidiaries party thereto. | S-4 | 10.11 | 11/19/2010 | ||||||
10.18* | Executive Employment Agreement, dated August 5, 2005, between SquareTwo Financial Corporation and P. Scott Lowery. | S-4 | 10.12 | 11/19/2010 | ||||||
10.19* | Executive Employment Agreement, dated April 1, 2013, between SquareTwo Financial Corporation and Paul A. Larkins. | 8-K | 10.1 | 4/1/2013 | ||||||
10.20* | Executive Employment Agreement, dated August 1, 2014, between SquareTwo Financial Corporation and John Lowe. | 8-K | 10.1 | 8/6/2014 | ||||||
10.21* | Executive Employment Agreement, dated April 1, 2013, between SquareTwo Financial Corporation and Brian W. Tuite. | 8-K | 10.3 | 4/1/2013 | ||||||
10.22* | Amended and Restated 2005 Equity Incentive Plan of CA Holding, Inc. | S-4 | 10.17 | 11/19/2010 | ||||||
10.23* | Form of CA Holding, Inc. 2005 Equity Incentive Plan Restricted Stock Purchase Agreement. | S-4 | 10.18 | 11/19/2010 | ||||||
10.24* | Form of CA Holding, Inc. 2005 Equity Incentive Plan Notice of Stock Option Award. | S-4 | 10.19 | 11/19/2010 | ||||||
10.25 | Amendment No. 7 to Loan Agreement | X | ||||||||
21 | Subsidiaries of SquareTwo Financial Corporation | S-4 | 21.1 | 11/19/2010 | ||||||
31.1 | Certification of Principal Executive Officer pursuant to Section 302 of the Sarbanes Oxley Act of 2002 | X | ||||||||
31.2 | Certification of Principal Financial Officer pursuant to Section 302 of the Sarbanes Oxley Act of 2002 | X | ||||||||
143
32.1 | Certification of Principal Executive Officer and Principal Financial Officer pursuant to Section 906 of the Sarbanes Oxley Act of 2002 | X | ||||||||
99.1 | Seventh Amended and Restated Certificate of Incorporation of CA Holding, Inc. | 8-K | 99.1 | 7/6/2011 | ||||||
99.2 | Amended and Restated Bylaws of CA Holding, Inc. | S-4 | 3.13.2 | 11/19/2010 | ||||||
101.INS | XBRL Instance Document | X | ||||||||
101.SCH | XBRL Taxonomy Extension Schema Document | X | ||||||||
101.CAL | XBRL Taxonomy Extension Calculation Linkbase Document | X | ||||||||
101.DEF | XBRL Taxonomy Extension Definition Linkbase Document | X | ||||||||
101.LAB | XBRL Taxonomy Extension Label Linkbase Document | X | ||||||||
101.PRE | XBRL Taxonomy Extension Presentation Linkbase Document | X | ||||||||
* Indicates management compensatory plan, contract or arrangement.
144
SIGNATURES
Pursuant to the requirements of Section 13 or 15(d) of the Securities Exchange Act of 1934, the registrant has duly caused this report to be signed on its behalf by the undersigned, thereunto duly authorized.
SQUARETWO FINANCIAL CORPORATION | ||
April 25, 2016 | By: | /s/ Paul A. Larkins |
Name: | Paul A. Larkins | |
Title: | Chief Executive Officer | |
(Principal Executive Officer) | ||
Pursuant to the requirements of the Securities Exchange Act of 1934, this report has been signed below by the following persons on behalf of the registrant and in the capacities and on the dates indicated.
April 25, 2016 | By: | /s/ Paul A. Larkins |
Name: | Paul A. Larkins | |
Title: | Chief Executive Officer | |
(Principal Executive Officer) | ||
April 25, 2016 | By: | /s/ John D. Lowe |
Name: | John D. Lowe | |
Title: | Senior Vice President and Chief Financial Officer | |
(Principal Financial and Accounting Officer) | ||
April 25, 2016 | By: | /s/ P. Scott Lowery |
Name: | P. Scott Lowery | |
Title: | Special Senior Advisor to the President and Chief Executive Officer and Director | |
April 25, 2016 | By: | /s/ Christopher J. Lane |
Name: | Christopher J. Lane | |
Title | Chairman of the Board of Directors | |
April 25, 2016 | By: | /s/ Bennett R. Thompson |
Name: | Bennett R. Thompson | |
Title: | Director | |
April 25, 2016 | By: | /s/ Kimberly S. Patmore |
Name: | Kimberly S. Patmore | |
Title: | Director | |
April 25, 2016 | By: | /s/ Thomas W. Bunn |
Name: | Thomas W. Bunn | |
Title: | Director | |
April 25, 2016 | By: | /s/ Thomas R. Sandler |
Name: | Thomas R. Sandler | |
Title: | Director | |
145