Attached files
| file | filename |
|---|---|
| 8-K - 8-K - AVIENT CORP | pol-20160331xnewsreleaseco.htm |

NEWS RELEASE
FOR IMMEDIATE RELEASE
PolyOne Announces Record First Quarter 2016 Results
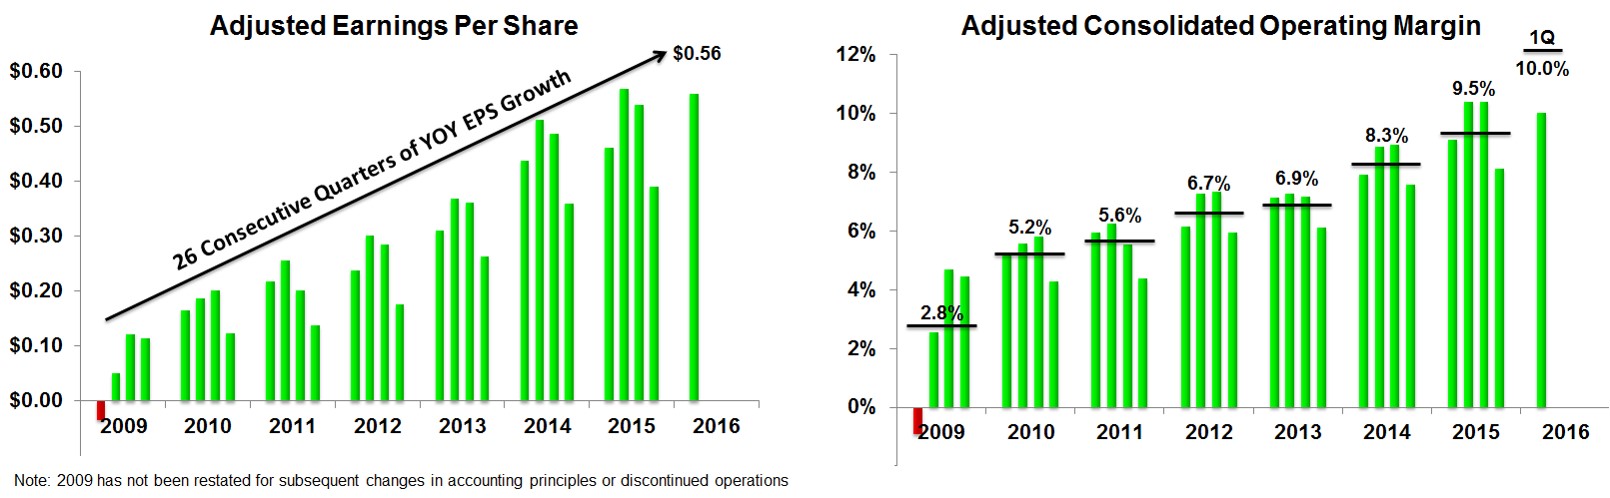
• | Adjusted earnings per share increases 22% to $0.56; GAAP EPS improves 35% to $0.46 versus $0.34 in the prior year |
• | Achieves 26th consecutive quarter of adjusted EPS growth |
• | Investment in commercial resources and innovation drives strong organic results |
• | Customer-focused integration of Magenta Colorants and TPE assets acquired from Kraton well underway; contributes $0.01 to EPS in the first quarter |
CLEVELAND - April 26, 2016 - PolyOne Corporation (NYSE: POL) today reported its first quarter results for 2016. Adjusted earnings per share increased 22% to $0.56 from $0.46 in the first quarter of 2015. GAAP earnings per share of $0.46 in the first quarter of 2016 increased from $0.34 in the first quarter of 2015. Special items for the first quarter of 2016, which primarily included restructuring costs, resulted in a net after-tax charge of $9.1 million, or $0.10 per share (see Attachment 1). In the prior year quarter, special items were $11.4 million, or $0.12 per share.
“I’m extremely pleased to report we delivered very strong double-digit EPS growth of 22% to $0.56 for the first quarter,” said Robert M. Patterson, president and chief executive officer, PolyOne Corporation. “Last year, we increased our sales force by nearly 10% and further invested in technology to better serve our customers. These investments, and our unwavering commitment to specialization, have made it possible to win new business and expand margins on a consolidated basis.”
Mr. Patterson added, “We achieved the most significant growth in North America driven by gains in our Distribution and Performance Products and Solutions segments. We believe that these two segments benefited almost immediately from our additional commercial resources, as they have the shortest sales cycles. In addition, they were also the most heavily impacted by destocking in the prior year which did not reoccur in 2016.”
Revenue for the first quarter of 2016 was $847 million, compared to $873 million in the first quarter of 2015. Underlying growth of 4% plus the acquired revenue from Magenta and Kraton’s TPE business led to a sales increase of 5%. This was more than offset, however, by lower selling prices in Distribution, Performance Products and Solutions, and Designed Structures and Solutions (DSS), due to lower hydro-carbon based raw material costs. In addition, a weaker euro impacted Color, Additives and Inks and Engineered Materials.
Mr. Patterson added, “Our established businesses clearly drove our outstanding results, and I’m also pleased with our ongoing progress to improve DSS, as its transformation to specialty continues. DSS improved on-time delivery and other key operational metrics, which we view as prerequisites to long-term sustainable growth. Our facility upgrades and LSS activities continue at an aggressive pace, and our recently upgraded commercial team has been fully deployed in pursuit of new business.”
Bradley C. Richardson, executive vice president and chief financial officer, PolyOne Corporation said, “Our balance sheet remains strong, and it provides us with important flexibility to invest in our growth strategy through strategic innovation, commercial resources and bolt-on acquisitions. At the same time, we continue to allocate capital to provide additional value to shareholders, through dividends and share buybacks, repurchasing 1.5 million shares in the first quarter.”
Commenting on the company’s outlook, Mr. Patterson said, “We’ve had a strong start to the year, driven by gains in Distribution and PP&S. I expect Color and Engineered Materials to show momentum throughout the year as the increased commercial resources added last year gain traction. We should also see continued progress at DSS as we execute our operational and commercial improvement initiatives.”
Mr. Patterson added, “Our ability to innovate across our business segments and execute our strategy is what differentiates PolyOne. We plan to use our strengths to deliver double digit adjusted earnings per share growth for the year in pursuit of our 2020 Platinum Vision.”
1
About PolyOne
PolyOne Corporation, with 2015 revenues of $3.4 billion, is a premier provider of specialized polymer materials, services and solutions. The company is dedicated to serving customers in diverse industries around the globe, by creating value through collaboration, innovation and an unwavering commitment to excellence. Guided by its Core Values, Sustainability Promise and No Surprises Pledge(SM), PolyOne is committed to its customers, employees, communities and shareholders through ethical, sustainable and fiscally responsible principles. For more information, visit www.polyone.com.
To access PolyOne’s news library online, please visit www.polyone.com/news.
# # #
Investor Relations Contact:
Eric R. Swanson
Director, Investor Relations
PolyOne Corporation
+1 440-930-1018
eric.swanson@polyone.com
Media Contact:
Kyle G. Rose
Vice President, Corporate Communications
PolyOne Corporation
+1 440-930-3162
kyle.rose@polyone.com
2
Forward-looking Statements
In this press release, statements that are not reported financial results or other historical information are “forward-looking statements” within the meaning of the Private Securities Litigation Reform Act of 1995. Forward-looking statements give current expectations or forecasts of future events and are not guarantees of future performance. They are based on management’s expectations that involve a number of business risks and uncertainties, any of which could cause actual results to differ materially from those expressed in or implied by the forward-looking statements. They use words such as “will,” “anticipate,” “estimate,” “expect,” “project,” “intend,” “plan,” “believe,” and other words and terms of similar meaning in connection with any discussion of future operating or financial condition, performance and/or sales. Factors that could cause actual results to differ materially from those implied by these forward-looking statements include, but are not limited to: our ability to realize anticipated savings and operational benefits from the realignment of assets, including the closure of manufacturing facilities; the timing of closings and shifts of production to new facilities related to asset realignments and any unforeseen loss of customers and/or disruptions of service or quality caused by such closings and/or production shifts; separation and severance amounts that differ from original estimates; amounts for non-cash charges related to asset write-offs and accelerated depreciation realignments of property, plant and equipment, that differ from original estimates; our ability to identify and evaluate acquisition targets and consummate acquisitions; the ability to successfully integrate acquired businesses into our operations, including whether such businesses will be accretive, retain the management teams of acquired businesses, and retain relationships with customers of acquired businesses; disruptions, uncertainty or volatility in the credit markets that could adversely impact the availability of credit already arranged and the availability and cost of credit in the future; the financial condition of our customers, including the ability of customers (especially those that may be highly leveraged and those with inadequate liquidity) to maintain their credit availability; the speed and extent of an economic recovery, including the recovery of the housing market; our ability to achieve new business gains; the effect on foreign operations of currency fluctuations, tariffs and other political, economic and regulatory risks; changes in polymer consumption growth rates and laws and regulations regarding the disposal of plastic in jurisdictions where we conduct business; changes in global industry capacity or in the rate at which anticipated changes in industry capacity come online; fluctuations in raw material prices, quality and supply and in energy prices and supply; production outages or material costs associated with scheduled or unscheduled maintenance programs; unanticipated developments that could occur with respect to contingencies such as litigation and environmental matters; an inability to achieve or delays in achieving or achievement of less than the anticipated financial benefit from initiatives related to working capital reductions, cost reductions and employee productivity goals; an inability to raise or sustain prices for products or services; an inability to maintain appropriate relations with unions and employees; our ability to continue to pay cash dividends; the amount and timing of repurchases of our common shares, if any; and other factors affecting our business beyond our control, including, without limitation, changes in the general economy, changes in interest rates and changes in the rate of inflation. The above list of factors is not exhaustive.
We undertake no obligation to publicly update forward-looking statements, whether as a result of new information, future events or otherwise. You are advised to consult any further disclosures we make on related subjects in our reports on Form 10-Q, 8-K and 10-K that we provide to the Securities and Exchange Commission.
3
Attachment 1
PolyOne Corporation
Summary of Condensed Consolidated Statements of Income (Unaudited)
(In millions, except per share data)
Three Months Ended March 31, | |||||||
2016 | 2015 | ||||||
Sales | $ | 847.0 | $ | 873.1 | |||
Operating income | 71.3 | 70.1 | |||||
Net income attributable to PolyOne shareholders | 39.1 | 30.2 | |||||
Basic earnings per share attributable to PolyOne shareholders | $ | 0.46 | $ | 0.34 | |||
Diluted earnings per share attributable to PolyOne shareholders | $ | 0.46 | $ | 0.34 | |||
Senior management uses comparisons of adjusted net income attributable to PolyOne shareholders and diluted earnings per share (EPS) attributable to PolyOne shareholders, excluding special items, to assess performance and facilitate comparability of results. Below is a reconciliation of these non-GAAP financial measures to their most directly comparable measures calculated and presented in accordance with U.S. GAAP (GAAP).
Three Months Ended March 31, 2016 | Three Months Ended March 31, 2015 | ||||||||||||||
Reconciliation to Condensed Consolidated Statements of Income | $ | EPS | $ | EPS | |||||||||||
Net income attributable to PolyOne shareholders | $ | 39.1 | $ | 0.46 | $ | 30.2 | $ | 0.34 | |||||||
Special items, after tax (Attachment 3) | 9.1 | 0.10 | 11.4 | 0.12 | |||||||||||
Adjusted net income / EPS - excluding special items | $ | 48.2 | $ | 0.56 | $ | 41.6 | $ | 0.46 | |||||||
4
Attachment 2
PolyOne Corporation
Condensed Consolidated Statements of Income (Unaudited)
(In millions, except per share data)
Three Months Ended March 31, | |||||||
2016 | 2015 | ||||||
Sales | $ | 847.0 | $ | 873.1 | |||
Cost of sales | 661.5 | 703.3 | |||||
Gross margin | 185.5 | 169.8 | |||||
Selling and administrative expense | 114.2 | 99.7 | |||||
Operating income | 71.3 | 70.1 | |||||
Interest expense, net | (14.6 | ) | (16.1 | ) | |||
Other income (expense), net | 0.3 | (0.7 | ) | ||||
Income before income taxes | 57.0 | 53.3 | |||||
Income tax expense | (18.0 | ) | (23.1 | ) | |||
Net income | 39.0 | 30.2 | |||||
Net loss attributable to noncontrolling interests | 0.1 | — | |||||
Net income attributable to PolyOne common shareholders | $ | 39.1 | $ | 30.2 | |||
Earnings per common share attributable to PolyOne common shareholders - Basic: | $ | 0.46 | $ | 0.34 | |||
Earnings per common share attributable to PolyOne common shareholders - Diluted: | $ | 0.46 | $ | 0.34 | |||
Cash dividends declared per share of common stock | $ | 0.12 | $ | 0.10 | |||
Weighted-average shares used to compute earnings per common share: | |||||||
Basic | 84.7 | 89.2 | |||||
Diluted | 85.5 | 90.1 | |||||
5
Attachment 3
PolyOne Corporation
Summary of Special Items (Unaudited)
(In millions, except per share data)
Special items (1) | Three Months Ended March 31, | ||||||
2016 | 2015 | ||||||
Cost of sales: | |||||||
Restructuring Costs | $ | (2.7 | ) | $ | (7.9 | ) | |
Environmental remediation costs | (1.7 | ) | (1.5 | ) | |||
Reimbursement of previously incurred environmental costs | — | 0.5 | |||||
Acquisition related adjustments | (2.5 | ) | — | ||||
Impact on cost of sales | (6.9 | ) | (8.9 | ) | |||
Selling and administrative expense: | |||||||
Employee separation and restructuring costs | (4.7 | ) | (2.7 | ) | |||
Legal related and other | (1.9 | ) | 2.8 | ||||
Acquisition/divestiture related costs | (0.3 | ) | (0.5 | ) | |||
Impact on selling and administrative expense | (6.9 | ) | (0.4 | ) | |||
Impact on operating income | (13.8 | ) | (9.3 | ) | |||
Other income, net | 0.2 | — | |||||
Impact on income before income taxes | (13.6 | ) | (9.3 | ) | |||
Income tax benefit on above special items | 4.9 | 3.8 | |||||
Tax adjustments(2) | (0.4 | ) | (5.9 | ) | |||
Impact of special items on net income attributable to PolyOne Shareholders | $ | (9.1 | ) | $ | (11.4 | ) | |
Diluted earnings per common share impact | $ | (0.10 | ) | $ | (0.12 | ) | |
Weighted average shares used to compute adjusted earnings per share: | |||||||
Diluted | 85.5 | 90.1 | |||||
(1) Special items are a non-GAAP financial measure and are used to determine adjusted earnings. Special items include charges related to specific strategic initiatives or financial restructuring such as: consolidation of operations; debt extinguishment costs; costs incurred directly in relation to acquisitions or divestitures; employee separation costs resulting from personnel reduction programs, plant phase-in costs, executive separation agreements; asset impairments; mark-to-market adjustments associated with actuarial gains and losses on pension and other post-retirement benefit plans; environmental remediation costs, fines, penalties and related insurance recoveries related to facilities no longer owned or closed in prior years; gains and losses on the divestiture of operating businesses, joint ventures and equity investments; gains and losses on facility or property sales or disposals; results of litigation, fines or penalties, where such litigation (or action relating to the fines or penalties) arose prior to the commencement of the performance period; one-time, non-recurring items; and the effect of changes in accounting principles or other such laws or provisions affecting reported results.
(2) Tax adjustments include the net tax expense/benefit from one-time income tax items, the set-up or reversal of uncertain tax position reserves and deferred income tax valuation allowance adjustments.
6
Attachment 4
PolyOne Corporation
Condensed Consolidated Balance Sheets
(In millions)
(Unaudited) March 31, 2016 | December 31, 2015 | ||||||
Assets | |||||||
Current assets: | |||||||
Cash and cash equivalents | $ | 155.4 | $ | 279.8 | |||
Accounts receivable, net | 429.2 | 347.0 | |||||
Inventories, net | 323.5 | 287.0 | |||||
Other current assets | 40.8 | 47.0 | |||||
Total current assets | 948.9 | 960.8 | |||||
Property, net | 579.9 | 583.5 | |||||
Goodwill | 634.8 | 597.7 | |||||
Intangible assets, net | 353.1 | 344.6 | |||||
Other non-current assets | 107.7 | 108.5 | |||||
Total assets | $ | 2,624.4 | $ | 2,595.1 | |||
Liabilities and Shareholders’ Equity | |||||||
Current liabilities: | |||||||
Short-term and current portion of long-term debt | $ | 18.6 | $ | 18.6 | |||
Accounts payable | 383.4 | 351.6 | |||||
Accrued expenses and other current liabilities | 116.4 | 127.9 | |||||
Total current liabilities | 518.4 | 498.1 | |||||
Non-current liabilities: | |||||||
Long-term debt | 1,174.3 | 1,128.0 | |||||
Pension and other post-retirement benefits | 55.6 | 77.5 | |||||
Deferred income taxes | 34.1 | 33.8 | |||||
Other non-current liabilities | 148.5 | 152.5 | |||||
Total non-current liabilities | 1,412.5 | 1,391.8 | |||||
Shareholders’ equity: | |||||||
PolyOne shareholders’ equity | 692.6 | 704.2 | |||||
Noncontrolling interests | 0.9 | 1.0 | |||||
Total equity | 693.5 | 705.2 | |||||
Total liabilities and shareholders’ equity | $ | 2,624.4 | $ | 2,595.1 | |||
7
Attachment 5
PolyOne Corporation
Condensed Consolidated Statements of Cash Flows (Unaudited)
(In millions)
Three Months Ended March 31, | |||||||
2016 | 2015 | ||||||
Operating Activities | |||||||
Net income | $ | 39.0 | $ | 30.2 | |||
Adjustments to reconcile net income to net cash used by operating activities: | |||||||
Depreciation and amortization | 24.3 | 25.0 | |||||
Accelerated depreciation and fixed asset charges associated with restructuring activities | 2.8 | 5.4 | |||||
Provision for doubtful accounts | 0.1 | — | |||||
Share-based compensation expense | 2.2 | 1.9 | |||||
Change in assets and liabilities, net of the effect of acquisitions: | |||||||
Increase in accounts receivable | (79.5 | ) | (55.8 | ) | |||
(Increase) decrease in inventories | (13.3 | ) | 7.4 | ||||
Increase in accounts payable | 29.9 | 22.2 | |||||
Decrease in pension and other post-retirement benefits | (23.7 | ) | (24.0 | ) | |||
Decrease in accrued expenses and other assets and liabilities - net | (11.0 | ) | (70.1 | ) | |||
Net cash used by operating activities | (29.2 | ) | (57.8 | ) | |||
Investing Activities | |||||||
Capital expenditures | (19.6 | ) | (15.1 | ) | |||
Business acquisitions | (72.8 | ) | — | ||||
Proceeds from sale of businesses and other assets | — | 1.1 | |||||
Net cash used by investing activities | (92.4 | ) | (14.0 | ) | |||
Financing Activities | |||||||
Repayment of long-term debt | (1.4 | ) | — | ||||
Borrowings under credit facilities | 221.9 | 274.7 | |||||
Repayments under credit facilities | (174.6 | ) | (187.4 | ) | |||
Purchase of common shares for treasury | (39.6 | ) | (19.6 | ) | |||
Exercise of share awards | 0.6 | 3.8 | |||||
Cash dividends paid | (10.4 | ) | (9.0 | ) | |||
Net cash (used) provided by financing activities | (3.5 | ) | 62.5 | ||||
Effect of exchange rate changes on cash | 0.7 | (2.9 | ) | ||||
Decrease in cash and cash equivalents | (124.4 | ) | (12.2 | ) | |||
Cash and cash equivalents at beginning of period | 279.8 | 238.6 | |||||
Cash and cash equivalents at end of period | $ | 155.4 | $ | 226.4 | |||
8
Attachment 6
PolyOne Corporation
Business Segment and Platform Operations (Unaudited)
(In millions)
Operating income at the segment level does not include: special items as defined on Attachment 3; corporate general and administration costs that are not allocated to segments; intersegment sales and profit eliminations; share-based compensation costs; and certain other items that are not included in the measure of segment profit and loss that is reported to and reviewed by the chief operating decision maker. These costs are included in Corporate and eliminations.
Three Months Ended March 31, | |||||||
2016 | 2015 | ||||||
Sales: | |||||||
Color, Additives and Inks | $ | 204.9 | $ | 208.5 | |||
Specialty Engineered Materials | 141.0 | 141.9 | |||||
Designed Structures and Solutions | 108.5 | 119.1 | |||||
Specialty Platform | 454.4 | 469.5 | |||||
Performance Products and Solutions | 166.2 | 175.9 | |||||
PolyOne Distribution | 268.8 | 265.7 | |||||
Corporate and eliminations | (42.4 | ) | (38.0 | ) | |||
Sales | $ | 847.0 | $ | 873.1 | |||
Gross margin: | |||||||
Color, Additives and Inks | $ | 75.3 | $ | 73.4 | |||
Specialty Engineered Materials | 44.2 | 43.0 | |||||
Designed Structures and Solutions | 10.7 | 13.8 | |||||
Specialty Platform | 130.2 | 130.2 | |||||
Performance Products and Solutions | 32.4 | 22.5 | |||||
PolyOne Distribution | 30.7 | 27.8 | |||||
Corporate and eliminations | (7.8 | ) | (10.7 | ) | |||
Gross margin | $ | 185.5 | $ | 169.8 | |||
Selling and administrative expense: | |||||||
Color, Additives and Inks | $ | 40.4 | $ | 39.6 | |||
Specialty Engineered Materials | 20.8 | 19.9 | |||||
Designed Structures and Solutions | 10.3 | 10.6 | |||||
Specialty Platform | 71.5 | 70.1 | |||||
Performance Products and Solutions | 12.7 | 11.0 | |||||
PolyOne Distribution | 13.2 | 12.1 | |||||
Corporate and eliminations | 16.8 | 6.5 | |||||
Selling and administrative expense | $ | 114.2 | $ | 99.7 | |||
Operating income: | |||||||
Color, Additives and Inks | $ | 34.9 | $ | 33.8 | |||
Specialty Engineered Materials | 23.4 | 23.1 | |||||
Designed Structures and Solutions | 0.4 | 3.2 | |||||
Specialty Platform | 58.7 | 60.1 | |||||
Performance Products and Solutions | 19.7 | 11.5 | |||||
PolyOne Distribution | 17.5 | 15.7 | |||||
Corporate and eliminations | (24.6 | ) | (17.2 | ) | |||
Operating income | $ | 71.3 | $ | 70.1 | |||
The Specialty Platform consists of our three specialty segments: Color, Additives and Inks; Specialty Engineered Materials; and Designed Structures and Solutions. We present Specialty Platform sales, gross margin, selling and administrative expense, and operating income because management believes that this is useful information to investors by highlighting our collective progress in advancing our specialization strategy.
9
Attachment 7
PolyOne Corporation
Reconciliation of Non-GAAP Financial Measures (Unaudited)
(In millions, except per share data)
Senior management uses gross margin before special items and operating income before special items to assess performance and allocate resources because senior management believes that these measures are useful in understanding current profitability levels and that current levels may serve as a basis for future performance. In addition, operating income before the effect of special items is a component of PolyOne annual and long-term employee incentive plans and is used in debt covenant computations. Below is a reconciliation of non-GAAP financial measures to the most directly comparable measures calculated and presented in accordance with GAAP. See Attachment 3 for a definition of special items.
Three Months Ended March 31, | |||||||
Reconciliation to Consolidated Statements of Income | 2016 | 2015 | |||||
Sales | $ | 847.0 | $ | 873.1 | |||
Gross margin before special items | 192.4 | 178.7 | |||||
Special items in gross margin (Attachment 3) | (6.9 | ) | (8.9 | ) | |||
Gross margin - GAAP | $ | 185.5 | $ | 169.8 | |||
Gross margin, before special items, as a percent of sales | 22.7 | % | 20.5 | % | |||
Operating income adjusted | 85.1 | 79.4 | |||||
Special items in operating income (Attachment 3) | (13.8 | ) | (9.3 | ) | |||
Operating income - GAAP | $ | 71.3 | $ | 70.1 | |||
Operating income, before special items, as a percent of sales | 10.0 | % | 9.1 | % | |||
The table below reconciles pre-special income tax expense and the pre-special effective tax rate to their most comparable US GAAP figures.
Three Months Ended March 31, 2016 | Three Months Ended March 31, 2015 | ||||||||||||||||||||||
GAAP Results | Special Items | Pre-special Results | GAAP Results | Special Items | Pre-special Results | ||||||||||||||||||
Income before income taxes | $ | 57.0 | $ | 13.6 | $ | 70.6 | $ | 53.3 | $ | 9.3 | $ | 62.6 | |||||||||||
Income tax expense - GAAP | (18.0 | ) | — | (18.0 | ) | (23.1 | ) | — | (23.1 | ) | |||||||||||||
Income tax impact of special items (Attachment 3) | — | (4.9 | ) | (4.9 | ) | — | (3.8 | ) | (3.8 | ) | |||||||||||||
Tax adjustments (Attachment 3) | — | 0.4 | 0.4 | — | 5.9 | 5.9 | |||||||||||||||||
Income tax (expense) benefit | $ | (18.0 | ) | $ | (4.5 | ) | $ | (22.5 | ) | $ | (23.1 | ) | $ | 2.1 | $ | (21.0 | ) | ||||||
Effective Tax Rate | 31.6 | % | 31.9 | % | 43.3 | % | 33.5 | % | |||||||||||||||
10