Attached files
| file | filename |
|---|---|
| 8-K - 8-K - PEAPACK GLADSTONE FINANCIAL CORP | form8k-15913_pgfc.htm |
Exhibit 99.1

Executing Our Strategy “Expanding Our Reach” Annual Meeting April 26, 2016 P EAPACK - G LADSTONE B ANK

The foregoing contains forward - looking statements within the meaning of the Private Securities Litigation Reform Act of 1995. Such statements are not historical facts and include expressions about Management’s view of future interest income and net loans, Man agement’s confidence and strategies and Management’s expectations about new and existing programs and products, relationships, opportun iti es and market conditions. These statements may be identified by such forward - looking terminology as “expect”, “look”, “believe”, “antic ipate”, “may”, “will”, or similar statements or variations of such terms. Actual results may differ materially from such forward - looking statements. Factors that may cause actual results to differ materially from those contemplated by such forward - looking statements include, a mong others, those risk factors identified in the Company’s Form 10 - K for the year ended December 31, 2015, in addition to/which include the following: a) inability to successfully grow our business in line with our strategic plan; b) inability to grow deposits to fund loan growt h; c) inability to generate revenues to offset the increased personnel and other costs related to the strategic plan; d) inability to realize ex pec ted revenue synergies from the acquisition of a wealth management company in the amounts or the timeframe anticipated; e) inability to re tai n clients and employees of acquired wealth management company; f) inability to manage our growth; g) inability to successfully integrat e o ur expanded employee base; h) a further or unexpected decline in the economy, in particular in our New Jersey and New York marke t a reas; i ) declines in value in our investment portfolio; j) higher than expected increases in our allowance for loan losses; k) higher tha n expected increases in loan losses or in the level of non - performing loans ; unexpected changes in interest rates; l) a continued or unexpected decline in real estate values within our market areas; m) legislative and regulatory actions (including the impact of the Dodd - Frank Wall S treet Reform and Consumer Protection Act, Basel III and related regulations) subject us to additional regulatory oversight which may resul t i n increased compliance costs; n) successful cyber - attacks against our IT infrastructure or that of our IT providers; o) higher than expected FDIC premiums; p) adverse weather conditions ; inability to successfully generate new business in new geographic areas; q) inability to execute upon new business initiatives ; lack of liquidity to fund our various cash obligations; r) reduction in our lower - cost funding sources; s) our inability to adapt to technological changes; t) claims and litigation pertaining to fiduciary responsibility, environmental laws and other ma tters; and other unexpected material adverse changes in our operations or earnings. The Company assumes no responsibility to update such forward - looking statements in the future even if experience shows that the indicated results or events will not be realized. Although we believe that the expectations reflected in the forward - looking statements ar e reasonable, the Company cannot guarantee future results, levels of activity, performance, or achievements. Statement Regarding Forward - Looking Information 2

• Wealth led, relationship - based commercial bank headquartered in the “wealth belt” of New Jersey delivering private bank level service. • 94 years in business. • Strong leadership team. • Growth Strategy – “Expanding Our Reach” – launched in Q1 2013. • Four Private Banking locations: Bedminster, Morristown, Princeton, Teaneck. • 21 Branches in five affluent New Jersey counties: Somerset, Morris, Hunterdon, Union, Middlesex. • Douglas L. Kennedy, President & CEO, 38 years experience, previously with Capital One Bank/North Fork, Bank of America/Fleet, Summit Bank. • John P. Babcock, President of Private Wealth Management, 35 years experience, previously with HSBC Private Bank, US Trust/Bank of America. • Jeffrey J. Carfora, CPA, CFO, 36 years experience, previously with Penn Fed Financial Services, Carteret Bank, Marine Midland Bank, PricewaterhouseCoopers. • Finn M. W. Caspersen, Jr., COO & General Counsel, 21 years experience, previously with Hale and Dorr, Merrill Lynch, Bencas Capital. Company Profile 3

1. Address continued spread compression brought about through a flat yield curve and persistent low rate environment. 2. Mitigate the elevated costs associated with compliance and increased regulatory requirements . 3. Enable us to effectively adapt to migrating consumer preferences away from brick and mortar to technology based solutions. We had to decide… Do we compete on the basis of cost or value? 4 Our Growth Strategy “Expanding Our Reach” Was Designed to…

A high - performing boutique bank, leaders in wealth, lending and deposit solutions, known nationally for our unparalleled client service, integrity and trust. 5 Our Value Centered Vision Statement

• Professionalism • Clients First • Compete to Win • Invested in Our Community • One Team 6 Our Core Principles “Tried and True Since 1921”

• Full service banking with every conversation aimed at helping clients create , grow , protect & eventually t ransition their wealth. • Deep understanding of our clients needs , goals, and aspirations. » It’s about the client; not a bout us. » Risk management tolerance , time horizon, and other traditional variables are all considered. • A Senior P rivate B anker leads a team to develop and deliver customized solutions. • As One Team , everyone in the Bank helps deliver an exceptional client experience. • Employees are empowered to spend up to $500 to solve any client service issue. 7 The Peapack - Gladstone Private Banking Model

8 Our Private Banking Brand Premier Elite

9 Three Year Comparative Stock Price Performance Historical PGC Stock Price Performance vs. KBW Bank Index Peers (10%) 0% 10% 20% 30% 40% 50% 60% 70% 80% 04/22/13 08/22/13 12/22/13 04/22/14 08/22/14 12/22/14 04/22/15 08/22/15 12/22/15 04/22/16 PGC +31.9% KBW Nasdaq Bank +28.0% Note: Market data as of April 22, 2016 Source: SNL Financial

10 Three Year Comparative Stock Price Performance Historical PGC Stock Price Performance vs. NJ Peers (10%) 0% 10% 20% 30% 40% 50% 60% 70% 80% 04/22/13 08/22/13 12/22/13 04/22/14 08/22/14 12/22/14 04/22/15 08/22/15 12/22/15 04/22/16 PGC +31.9% NJ Banks¹ +12.3% 1. NJ Peers defined as commercial banks publicly traded on NASDAQ, NYSE or NYSE MKT that are headquartered in New Jersey Note : Market data as of April 22, 2016 Source: SNL Financial

11 Note: Market data as of April 22, 2016 Source: SNL Financial Three Year Comparative Stock Price Performance Historical PGC Stock Price Performance vs. Nasdaq Bank Index Peers (10%) 0% 10% 20% 30% 40% 50% 60% 70% 80% 04/22/13 08/22/13 12/22/13 04/22/14 08/22/14 12/22/14 04/22/15 08/22/15 12/22/15 04/22/16 PGC +31.9% NASDAQ Bank +40.3%

12 $0 $5,000 $10,000 $15,000 $20,000 $25,000 Yr 2013 Yr 2014 Yr 2015 Adj* (In Thousands) 9,261 14,890 21,525 *Yr 2015 Adj as shown excludes $2.5MM of non - recurring charges related to the closure of two branch offices. Including these ch arges, net income and EPS would have been $19,972 and $1.29 for the year. See non - GAAP Financial Measures Reconciliation at end of document. Annual Net Income Year Over Year +45%

13 *Yr 2013: $42MM in common issued 12/2013. **Yr 2014: $50MM in common issued 12/2014. ***Yr 2015 Adj as shown excludes $2.5MM of non - recurring charges related to the closure of two branch offices. Including these charges, net income and EPS would have been $19,972 and $1.29 for the year. See non - GAAP Financial Measures Reconciliation at end of document. $0.60 $0.80 $1.00 $1.20 $1.40 $1.60 Yr 2013* Yr 2014** Yr 2015 Adj*** 1.01 1.22 1.39 Annual EPS Year Over Year +14%

14 $0 $500 $1,000 $1,500 $2,000 $2,500 $3,000 $3,500 $4,000 Yr 2012 Yr 2013 Yr 2014 Yr 2015 (In Millions) 1,668 1,967 2,702 3,365 Total Assets Year Over Year +25%

15 Total Loans 1,133 1,574 2,250 2,913 Year Over Year +33% $0 $500 $1,000 $1,500 $2,000 $2,500 $3,000 $3,500 Yr 2012 Yr 2013 Yr 2014 Yr 2015 (In Millions) 1,133 1,574 2,250 2,995* *Includes Multifamily Loans Held for Sale

16 0.00% 0.05% 0.10% 0.15% 0.20% 0.25% 0.30% 0.35% Yr 2012 Yr 2013 Yr 2014 Yr 2015 (% of Total Loans) 0.33 0.19 0.08 0.07 Loans 30 - 89 Days Past Due

17 0.00% 0.10% 0.20% 0.30% 0.40% 0.50% 0.60% 0.70% 0.80% 0.90% 1.00% Yr 2012 Yr 2013 Yr 2014 Yr 2015 (NPAs as a % of Assets) 0.91 0.44 0.30 0.22 Non Performing Assets *Does not include TDR loans that are performing in accordance with their terms.

18 $0 $500 $1,000 $1,500 $2,000 $2,500 $3,000 $3,500 Yr 2012 Yr 2013 Yr 2014 Yr 2015 (In Millions) 1,516 1,647 2,299 2,935 Total Deposits Year Over Year +28%
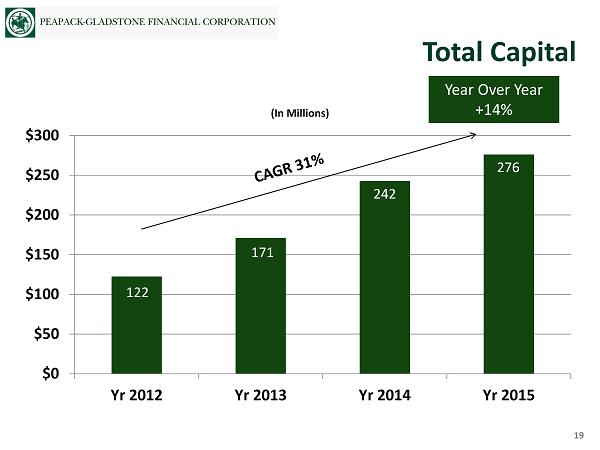
19 $0 $50 $100 $150 $200 $250 $300 Yr 2012 Yr 2013 Yr 2014 Yr 2015 (In Millions) 122 171 242 276 Total Capital Year Over Year +14%

20 Tangible Book Value Per Share $10.00 $12.00 $14.00 $16.00 $18.00 $20.00 Yr 2012 Yr 2013 Yr 2014 Yr 2015 13.81 14.75 16.32 17.40 Year Over Year +7%

21 Our Team is More Productive… 0 50 100 150 200 250 300 350 12/31/12 12/31/13 12/31/14 12/31/15 Existing New 10% 90% 74% 26% 45% 296 322 311 319 100% 55% (Full Time Equivalent Employees)

22 0 50 100 150 200 250 300 350 400 Yr 2013 Yr 2014 Yr 2015 0 10 20 30 40 50 60 70 80 Yr 2013 Yr 2014 Yr 2015 228 339 285 48 67 Revenue/Average FTE (In Thousands ) Net Income*/Average FTE (In Thousands ) 29 *Net income for the 2015 year as shown excludes $2.5MM of charges related to the closure of two branch offices. Including th ese charges, net income would have been $19,972 for 2015. See non - GAAP Financial Measures Reconciliation at end of document. …Our Strategy is Delivering Positive Operating Leverage and Improved Profitability Year Over Year +41% Year Over Year +19%

23 We are Learning More About Our Clients through CRM • In years past, we had limited visibility into relationships or profitability . • Our new Customer Relationship Management (CRM) platform launched in 2014 and expanded in 2015, enables us to view client relationships holistically. • Wealth, deposit, loan, and other bank services are now depicted on a single screen by relationship and assigned to a lead Private Banker. • CRM has enabled us to gain insight to our client base; we can now segment clients by location, size, number of products, length of relationship, age, PGB Experience Rating, etc. » We have approximately 36,000 clients and 21,000 relationships. » We can identify our most and least profitable relationships. » We have identified “PGB Elite Clients”, our most profitable relationships. » W e often know our clients’ outside professional advisors.

24 Our Strategy Has Attracted Higher Value Clients Account Type New Accounts Three Years or Less % of Total Outstandings 03/31/2016 Legacy Accounts Three Years or More % of Total Outstandings 03/31/2016 % Increase in Average Account Size Average Deposit $103,000 53% $31,000 47% 232% Average Loan $1,365,000 58% $282,000 42% 384% Average Wealth $2,565, 996 35% $1,264,000 65% 103%* Total Products 51% Total Products 49% *Average annual yield up approximately 20% over the same period.

25 Despite Transformational Change, We Score High on Client Engagement Our PGB Experience Score… • 5,000 Households surveyed. • Approximately 1,000 Responses. • Overall score 48. • Elite clients score 73. • Benchmark score 23.* • Tells us why clients like us and why they don’t. • Head of Client Experience hired in 2015. • “Voice of the Client” employee committee established. Our objective is to… • Make it easy to do business with us through a singular, responsive, and accountable Private Banker. • Provide unbiased solutions with our clients’ best interest in mind. • Earn our clients trust – we build, maintain, and manage their financial well - being through a multi - generational approach. • Help clients define and realize their legacy. * Tempkin Group NPS Benchmark Study (October 2015).

26 Our Employees Are Engaged Some Highlights Overall Survey Score 91% Bank Strategy will succeed 94% Senior Management is working hard 96% Private Banking culture 91% Teamwork is important 99% My manager/respect 94% Engagement/values 95% Work satisfaction/like people at the bank 97% Work environment is pleasant 92%

27 • Successful integration of Wealth Management Consultants (NJ), LLC in May 2015 with excellent client retention; slightly accretive to earnings in 2015 and expect realization of more synergies in 2016 and 2017. • Stage set for continued strategic acquisitions. • Over $400MM of new AUA inflows in 2015, not including WMC . • Total inflows were partially offset by negative market action in the second half of the year and normal closed/disbursed outflows. • New institutional focus started in 2015 – expect positive contribution to AUA and revenues in 2016 and beyond. • Approximately $175MM of wealth - related new business in deposits, mortgages, and secured lending in 2015. 2015 Accomplishments: Wealth Management

28 $10,000 $12,000 $14,000 $16,000 $18,000 Yr 2013 Yr 2014 Yr 2015 (In Thousands) 13,838 15,242 17,039 Wealth Management Fee Income Year Over Year +12%

29 $2,000 $2,500 $3,000 $3,500 Yr 2012 Yr 2013 Yr 2014 Yr 2015 (In Millions) 2,304 2,691 2,987 3,322 Wealth Management Assets Under Admin Year Over Year +11%
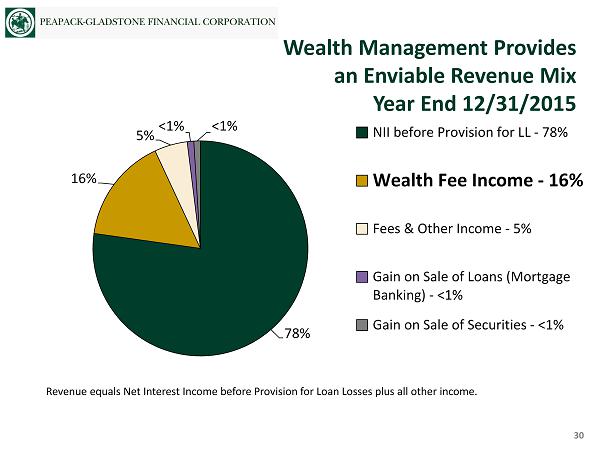
78% 16% 5% <1% <1% NII before Provision for LL - 78% Wealth Fee Income - 16% Fees & Other Income - 5% Gain on Sale of Loans (Mortgage Banking) - <1% Gain on Sale of Securities - <1% Revenue equals Net Interest Income before Provision for Loan Losses plus all other income. 30 Wealth Management Provides an Enviable Revenue Mix Year End 12/31/2015

31 • First full year since repositioning. • Relationship based offering positioned as a lead product for wealth, deposits, and commercial lending. » Portfolio up to 7/1 ARMS; longer duration loans typically sold . » Separate lending criteria, pricing sheet and relationship economics required. » Excellent 3 - 4 week execution. » PGB Experience Score was a perfect “10 ” in 2015 . • Since the product launch in Q3 2014, Private Wealth Mortgage of $104MM have closed. These relationships generated $211MM in other bank business. • This relationship approach is providing superior returns. • $12MM in affordable housing loans closed in 2015. Residential Lending

32 • Highly customized strategy developed and implemented. » Advice led strategy engages all clients in wealth oriented discussions. » Industry product verticals have been identified, established, and are growing . • Our focus is yielding good results. » C&I loan portfolio grew $204MM (66%). » New client deposits of $72MM. » C&I has grown to 8%, 14%, and 18% of total loans over the last three years. • High performing private bankers have embraced our strategy. » Three experienced C&I private bankers , with strong subject matter expertise, were added during 2015; two additional hired in 2016. 2015 Accomplishments: Commercial & Industrial Lending

33 $0 $100 $200 $300 $400 $500 $600 Yr 2012 Yr 2013 Yr 2014 Yr 2015 (In Millions) 115 132 309 513 Total Commercial & Industrial Loans Year Over Year +66%

34 • We continue to grow at a disciplined and healthy pace. » CRE portfolio (excluding Multifamily) increased by $105MM (34%) with 20 new relationships. » Multifamily increased by $419MM (39%); MFL loan participations totaled $201MM. • Our strategic focus has shifted to creating full banking relationships that generated $59MM in deposits during the year, an all time high. • Our credit discipline continues to deliver best - in - class asset quality. • Our Private Banking Strategy has gained momentum . » Seasoned banking team is focused on serving clients with a high - touch relationship based approach. » Advice - led strategy has resulted in numerous new wealth opportunities. » Focus on relationships vs transactions has increased the number of Treasury Management relationships. • In 2015, we launched a project to greatly enhance portfolio analytics and CRE risk management. 2015 Accomplishments: Commercial Real Estate Lending

35 $0 $200 $400 $600 $800 $1,000 $1,200 $1,400 $1,600 Yr 2012 Yr 2013 Yr 2014 Yr 2015 (In Millions) 162 542 1,080 1,499* Total Multifamily Loans Year Over Year +39% *Includes Multifamily Loans Held for Sale

Our Multifamily Portfolio At A Glance As of 12/31/2015: • Current Balance: $1.5B • To date, Participations Sold: 101 loans for $257MM • # Loans in Portfolio: 545 • Average Net Loan Size: $ 2.75MM • Weighted Average LTV: 65% • Weighted Average DSCR (after underwriting stress): 1.5x • Geographically Diversified Portfolio » New York – 45%; Top Markets – Bronx and Brooklyn » New Jersey – 45%; Top Markets – Hudson , Essex, & Morris/Somerset/Union Counties » Pennsylvania – 10%; Top Markets – Suburban Philadelphia and Bucks County • No 30 day delinquencies. • New data warehouse captures 63 data points per loan. 36

37 • Over one third of total new client deposits generated in 2015 came from Retail and Community Private Banking. • Financial Needs Assessment Process (FINAP) has yielded positive results with approximately $42MM in closed wealth business in 2015. • FINAP process being employed this year to improve the client experience. • Additionally, Community Private Bankers are focused on financing local businesses in our footprint, which now incorporates our recently announced SBA initiative. 2015 Accomplishments: Retail & Community Private Banking

38 Total Customer Deposits* $0 $500 $1,000 $1,500 $2,000 $2,500 $3,000 $3,500 Yr 2012 Yr 2013 Yr 2014 Yr 2015 (In Millions) *“Customer” Deposits are defined as deposits excluding brokered CDs and brokered overnight interest - bearing demand deposits. 1,511 1,632 1,979 2,642 Year Over Year +33%

Enhanced CRE Risk Management • As previously announced, we will invest $2MM in 2016 ($675M invested in Q1) to enhance CRE Risk Management practices. • 65,000+ data points collected and loaded to a data warehouse; we now have considerable insights to our portfolio and are have a better understanding of the risks associated with it. • Greatly enhanced Board and Management oversight, including quarterly reporting on exposure versus self - imposed limits and triggers that are revalidated quarterly through rigorous analytics. • Quarterly market analysis for various property types and geographies, including presentations to Management and the Board by a third party real estate expert to ensure there is an understanding of the macro economic factors that may affect future asset quality in the areas that the Bank lends. • Portfolio stress testing performed (top down/bottom up) by an independent third party to estimate potential impact of changing market conditions on asset quality, earnings, and capital . • Quarterly stress testing through eleven different stress scenarios. • Third party credit review firm used to monitor and evaluate overall asset quality measures to ensure an effective risk rating system and adequate reserve for loan losses maintained . • Ongoing third party participations/sales to validate underwriting guidelines and pricing . 39

Balance sheet risk management includes stress testing: • Capital – Stressed semi - annually using multiple scenarios, including some with DFST assumptions. Quarterly testing going forward. • Liquidity – $1.1 billion available in the first quarter. The Bank had $926MM of secured borrowing capacity available at the FHLB plus $177MM of unencumbered securities • Interest Rate – In an immediate and sustained 100 basis point increase in market rates at 12/31/2015, anticipated that net interest income for year 1 would increase approximately 2%, when compared to a flat interest rate scenario. In year 2, this sensitivity improves to an expected increase of approximately 4%. 40 Capital, Liquidity, and Interest Rate Risk Management

People Market Growth and Profitability • Very talented team with ties to the market place • High levels of motivation and engagement • Act as a single team • We operate in three of the top ten most affluent counties nationwide • New York MSA offers considerable growth opportunity • Large and small banks underserving the wealth related needs in this market • Improved operating leverage is delivering positive earnings momentum • People , products, market - depth and superior delivery ensure future growth • Ample market opportunities • Nimble and flexible 41 Unique Business Model • Holistic, advice - led approach • Private Banker acts as a lead point of contact • “Brand of One” • Serious approach to Enterprise Risk, CRE, and balance sheet management • Excellent leadership team • Superior governance • Will lead to long term value creation Serious Approach to Risk Management Valuation • Trading slightly above book value • Valuation does not reflect market value of the wealth business • Additional FDIC premiums in 2016 viewed as transitory by Management • Proven ability to grow revenue and maintain superior asset quality What Is Compelling About Our Company

Select Financial Highlights Q1 2016 Annual Meeting April 26, 2016 P EAPACK - G LADSTONE B ANK

43 Pretax Income (as reported) $0.00 $1.00 $2.00 $3.00 $4.00 $5.00 $6.00 $7.00 $8.00 $9.00 $10.00 Q1 2015 Q4 2015 Q1 2016 (in millions) $8.35 $6.60 $8.77

44 Pretax Income (as adjusted) $0.00 $2.00 $4.00 $6.00 $8.00 $10.00 $12.00 Q1 2015 Q4 2015 Q1 2016 (in millions) $8.35 $9.10 $10.07 (A) – the quarter ended 12/31/2015 included $2.5MM of charges related to the closure of two branch offices. Excluding these $2.5MM of charges, pretax income would have been $9.10MM. (B) – the quarter ended 03/31/2016 included $1.30MM of charges related to increased FDIC premiums and increased investment in ri sk management related analytics and practices. Excluding these $1.30MM of charges, pretax income would have been $10.07MM. See non - GAAP Financial Measures Reconciliation at end of document. As Adjusted (A) As Adjusted (B)

45 Net Income (as reported) $0.00 $1.00 $2.00 $3.00 $4.00 $5.00 $6.00 Q1 2015 Q4 2015 Q1 2016 (in millions) $5.01 $4.34 $5.49

46 Net Income (as adjusted) $0.00 $1.00 $2.00 $3.00 $4.00 $5.00 $6.00 $7.00 Q1 2015 Q4 2015 Q1 2016 (in millions) $5.01 $5.90 $6.30 (A) – the quarter ended 12/31/2015 included $2.5MM of charges related to the closure of two branch offices. Excluding these $2.5MM of charges, net income would have been $5.9MM. (B) – the quarter ended 03/31/2016 included $1.30MM of charges related to increased FDIC premiums and increased investment in ri sk management related analytics and practices. Excluding these $1.30MM of charges, net income would have been $6.30MM. See non - GAAP Financial Measures Reconciliation at end of document. As Adjusted (A) As Adjusted (B)

47 Diluted Earnings Per Share (as reported) $0.00 $0.05 $0.10 $0.15 $0.20 $0.25 $0.30 $0.35 $0.40 Q1 2015 Q4 2015 Q1 2016 $0.33 $0.28 $0.34 Shares Outstanding for Diluted EPS Q1 2016 16,016,972 Q4 2015 15,721,876 Q1 2015 15,070,352

48 Diluted Earnings Per Share (as adjusted) $0.30 $0.31 $0.32 $0.33 $0.34 $0.35 $0.36 $0.37 $0.38 $0.39 $0.40 Q1 2015 Q4 2015 Q1 2016 $0.33 $0.39 $0.38 Shares Outstanding for Diluted EPS Q1 2016 16,016,972 Q4 2015 15,721,876 Q1 2015 15,070,352 (A) – the quarter ended 12/31/2015 included $2.5MM of charges related to the closure of two branch offices. Excluding these $2.5MM of charges, diluted EPS would have been $0.38 per share. (B) – the quarter ended 03/31/2016 included $1.30MM of charges related to increased FDIC premiums and increased investment in ri sk management related analytics and practices. Excluding these $1.30MM of charges, diluted EPS would have been $0.39 per share. See non - GAAP Financial Measures Reconciliation at end of document. As Adjusted (A) As Adjusted (B)

49 Return on Average Common Equity (as reported) 0.00% 1.00% 2.00% 3.00% 4.00% 5.00% 6.00% 7.00% 8.00% 9.00% Q1 2015 Q4 2015 Q1 2016 8.13% 7.83% 6.37%

50 Return on Average Common Equity (as adjusted) 7.60% 7.80% 8.00% 8.20% 8.40% 8.60% 8.80% 9.00% 9.20% Q1 2015 Q4 2015 Q1 2016 8.13% 8.65% 8.99% ( A) – the quarter ended 12/31/2015 included $2.5MM of charges related to the closure of two branch offices. Excluding these $2.5MM of charges, ROAE would have been 8.65%. (B) – the quarter ended 03/31/2016 included $1.30MM of charges related to increased FDIC premiums and increased investment in ri sk management related analytics and practices. Excluding these $1.30MM of charges, ROAE would have been 8.99%. See non - GAAP Financial Measures Reconciliation at end of document. As Adjusted (A) As Adjusted (B)

51 Total Revenue Diversified Revenue Mix $23.00 $24.00 $25.00 $26.00 $27.00 $28.00 $29.00 $30.00 Q1 2015 Q4 2015 Q1 2016 $25.47 $28.54 $29.67 (in millions)

52 Net Interest Income $17.00 $18.00 $19.00 $20.00 $21.00 $22.00 $23.00 $24.00 Q1 2015 Q4 2015 Q1 2016 (in millions) $19.58 $22.82 $23.41

53 Wealth Division Fee Income $3.85 $3.90 $3.95 $4.00 $4.05 $4.10 $4.15 $4.20 $4.25 $4.30 $4.35 Q1 2015 Q4 2015 Q1 2016 (in millions) $4.03 $4.31 $4.30

54 Efficiency Ratio* (as reported) 58.00% 60.00% 62.00% 64.00% 66.00% 68.00% 70.00% 72.00% Q1 2015 Q4 2015 Q1 2016 62.58% *Calculated as (total operating expenses) as a percentage of (total revenue less gain on sale of securities). 70.05% 65.22%

55 Efficiency Ratio* (as adjusted) 59.50% 60.00% 60.50% 61.00% 61.50% 62.00% 62.50% 63.00% Q1 2015 Q4 2015 Q1 2016 62.58% *Calculated as (total operating expenses) as a percentage of (total revenue less gain on sale of securities). (A ) – the quarter ended 12/31/2015 included $2.5MM of charges related to the closure of two branch offices. Excluding these $2.5MM of charges, the efficiency ratio would have been 61.30%. (B ) – the quarter ended 03/31/2016 included $1.30MM of charges related to increased FDIC premiums and increased investment in risk management related analytics and practices. Excluding these $1.30MM of charges, the efficiency ratio would have been 60.81 %. See non - GAAP Financial Measures Reconciliation at end of document. 61.30% 60.81% As Adjusted (A) As Adjusted (B)

56 Total Loans $0.00 $0.50 $1.00 $1.50 $2.00 $2.50 $3.00 $3.50 Q1 2015 Q4 2015 Q1 2016 (in billions) $2.44 *Includes Multifamily Loans Held for Sale $3.00* $3.07*

57 Customer Deposits* $0.00 $0.50 $1.00 $1.50 $2.00 $2.50 $3.00 Q1 2015 Q4 2015 Q1 2016 (in billions) $2.15 * Excludes brokered CDs and brokered overnight interest bearing checking deposits. $2.64 $2.75

58 Wealth Division Assets Under Admin $2.90 $2.95 $3.00 $3.05 $3.10 $3.15 $3.20 $3.25 $3.30 $3.35 Q1 2015 Q4 2015 Q1 2016 (in billions) $3.05 $3.32 $3.31

59 Non - Performing Assets Ratio 0.20% 0.21% 0.22% 0.23% 0.24% 0.25% 0.26% 0.27% Q1 2015 Q4 2015 Q1 2016 0.26% 0.22% 0.23% ( NPAs as a % of Assets )

60 Regulatory Tier I Leverage Ratio (Regulatory Tangible Capital) 7.00% 7.50% 8.00% 8.50% 9.00% 9.50% 10.00% Q1 2015 Q4 2015 Q1 2016 8.80% 8.10% 8.19% Regulatory Well Capitalized Standard 5.00% Regulatory Adequately Capitalized Standard 4.00%

61 Regulatory Tier I and II Capital to RWA (Regulatory Total Capital to Risk Weighted Assets) 10.00% 10.50% 11.00% 11.50% 12.00% 12.50% 13.00% 13.50% 14.00% Q1 2015 Q4 2015 Q1 2016 12.50% 11.40% 11.58% Regulatory Well Capitalized Standard 10.00% Regulatory Adequately Capitalized Standard 8 .00%
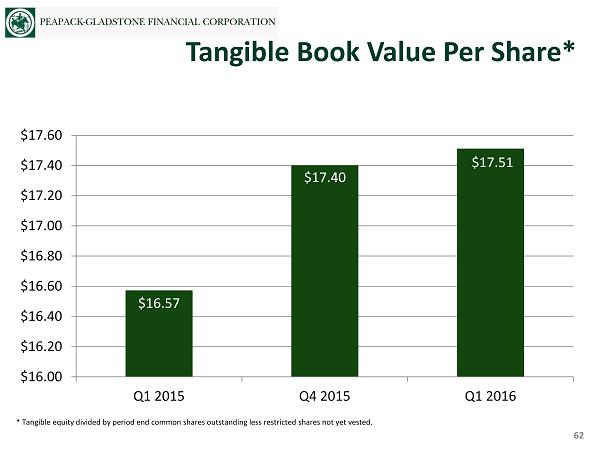
62 Tangible Book Value Per Share* $16.00 $16.20 $16.40 $16.60 $16.80 $17.00 $17.20 $17.40 $17.60 Q1 2015 Q4 2015 Q1 2016 $16.57 $17.40 $17.51 * Tangible equity divided by period end common shares outstanding less restricted shares not yet vested.

• EPS Growth – revised from slightly down/flat to flat/slightly up for 2016. Anticipate high single digit to low double digit “normalized” EPS growth thereafter . • Return on Equity – 10 %+ target run rate by 2017 may be delayed due to accelerated risk management investments and “transitory” increased FDIC premiums. • Efficiency Ratio – Added risk monitoring and FDIC costs will temporarily reverse 2015 gains. • Asset Growth / Loan Growth – 10% to 15% asset growth and 12% to 18% loan growth in 2016 and beyond. • Loan Mix – Continued migration of loan production into Commercial & Industrial and Wealth relationship based residential lending. Near term portfolio targets: » C&I: 25% - 30% » CRE: 15 % - 20% » Multifamily: 35% - 45% » Residential/Consumer: 15% - 25% • Funding – Continued funding from diversified funding sources. A large portion of asset growth to be funded by core customer deposits . • Dividends – to remain unchanged to support ongoing balance sheet growth. • Capital – sufficient common equity to support planned growth for the foreseeable future. Continue to assess other potential sources of capital to support growth, such as subordinated debt. 63 Financial Targets: 2016 and Beyond
PEAPACK-GLADSTONE FINANCIAL CORPORATION
SELECTED CONSOLIDATED FINANCIAL DATA
NON-GAAP FINANCIAL MEASURES RECONCILIATION
(Dollars in thousands, except share data)
For the Year Ended
We believe that these non-GAAP financial measures provide information that is important to investors and that is useful in understanding our financial position, results and ratios. Our management internally assesses our performance based, in part, on these measures. However, these non-GAAP financial measures are supplemental and are not a substitute for an analysis based on GAAP measures.
| Year | Year | Year | ||||||||||||||
| December 31, | December 31, | December 31, | ||||||||||||||
| 2015 | 2015 | 2014 | ||||||||||||||
| As | As | As | ||||||||||||||
| Reported | Adjustments (A) | Adjusted | Reported | |||||||||||||
| Net Interest Income Before Provision | $ | 84,452 | $ | 84,452 | $ | 67,894 | ||||||||||
| Provision for Loan Losses | 7,100 | 7,100 | 4,875 | |||||||||||||
| Net Interest Income After Provision | 77,352 | 77,352 | 63,019 | |||||||||||||
| OTHER INCOME | ||||||||||||||||
| Wealth Management Fee Income | 17,039 | 17,039 | 15,242 | |||||||||||||
| Service Charges and Fees | 3,323 | 3,323 | 3,111 | |||||||||||||
| Bank Owned Life Insurance | 1,297 | 1,297 | 1,092 | |||||||||||||
| Gain on Loans Held for Sale at Fair Value | ||||||||||||||||
| (Mortgage Banking) | 528 | 528 | 439 | |||||||||||||
| Gain/(Loss) on Loans Held for Sale, at | ||||||||||||||||
| Lower Cost or Fair Value | 0 | 0 | 166 | |||||||||||||
| Other Income | 1,000 | 1,000 | 497 | |||||||||||||
| Securites Gains, Net | 527 | 527 | 260 | |||||||||||||
| Total Other Income | 23,714 | 0 | 23,714 | 20,807 | ||||||||||||
| OTHER EXPENSES | ||||||||||||||||
| Salaries and Employee Benefits | 40,278 | (40 | ) | 40,238 | 36,241 | |||||||||||
| Premises and Equipment | 11,569 | (723 | ) | 10,846 | 9,963 | |||||||||||
| FDIC Insurance Expense | 2,154 | 2,154 | 1,381 | |||||||||||||
| Other Expenses | 14,925 | (1,734 | ) | 13,191 | 11,955 | |||||||||||
| Total Operating Expenses | 68,926 | (2,497 | ) | 66,429 | 59,540 | |||||||||||
| INCOME BEFORE TAXES | 32,140 | (1,734 | ) | 34,639 | 24,286 | |||||||||||
| Income Tax Expense/(Benefit) | 12,168 | (946 | ) | 13,114 | 9,396 | |||||||||||
| NET INCOME | $ | 19,972 | ($ | 788 | ) | $ | 21,525 | $ | 14,890 | |||||||
| Diluted Weighted Average Number of | ||||||||||||||||
| Common Shares Outstanding | 15,435 | 15,435 | 12,172 | |||||||||||||
| Earnings Per Share (Diluted) | $ | 1.29 | 1.39 | $ | 1.22 | |||||||||||
| Total Revenue (NII+Other Income) | $ | 108,166 | $ | 108,166 | $ | 88,701 | ||||||||||
| Return on Average Assets Annualized (ROAA) | 0.64% | 0.69% | 0.63% | |||||||||||||
| Return on Average Common Equity Annualized (ROAE) | 7.71% | 8.31% | 7.96% | |||||||||||||
| Net Interest Margin (Taxable Equivalent Basis) | 2.80% | 2.80% | 3.01% | |||||||||||||
| Operating Expenses/Average Assets Annualized | 2.21% | 2.13% | 2.53% | |||||||||||||
| Efficiency Ratio | 63.80% | 61.48% | 67.45% | |||||||||||||
(A) The quarter ended December 31, 2015 included $2.5 million of charges related to the closure of two branch offices.
PEAPACK-GLADSTONE FINANCIAL CORPORATION
SELECTED CONSOLIDATED FINANCIAL DATA
NON-GAAP FINANCIAL MEASURES RECONCILIATION
(Dollars in thousands, except share data)
For the Quarter Ended
We believe that these non-GAAP financial measures provide information that is important to investors and that is useful in understanding our financial position, results and ratios. Our management internally assesses our performance based, in part, on these measures. However, these non-GAAP financial measures are supplemental and are not a substitute for an analysis based on GAAP measures.
| Quarter | Quarter | Quarter | ||||||||||||||
| March 31, | March 31, | March 31, | ||||||||||||||
| 2016 | 2016 | 2015 | ||||||||||||||
| As | As | As | ||||||||||||||
| Reported | Adjustments (A) | Adjusted | Reported | |||||||||||||
| Net Interest Income Before Provision | $ | 23,410 | $ | 23,410 | $ | 19,583 | ||||||||||
| Provision for Loan Losses | 1,700 | 1,700 | 1,350 | |||||||||||||
| Net Interest Income After Provision | 21,710 | 21,710 | 18,233 | |||||||||||||
| OTHER INCOME | ||||||||||||||||
| Wealth Management Fee Income | 4,295 | 4,295 | 4,031 | |||||||||||||
| Service Charges and Fees | 807 | 807 | 805 | |||||||||||||
| Bank Owned Life Insurance | 342 | 342 | 537 | |||||||||||||
| Gain on Loans Held for Sale at Fair Value | ||||||||||||||||
| (Mortgage Banking) | 121 | 121 | 148 | |||||||||||||
| Gain/(Loss) on Loans Held for Sale, at | ||||||||||||||||
| Lower Cost or Fair Value | 124 | 124 | 0 | |||||||||||||
| Other Income | 473 | 473 | 93 | |||||||||||||
| Securites Gains, Net | 101 | 101 | 268 | |||||||||||||
| Total Other Income | 6,263 | 0 | 6,263 | 5,882 | ||||||||||||
| OTHER EXPENSES | ||||||||||||||||
| Salaries and Employee Benefits | 10,908 | 10,908 | 9,425 | |||||||||||||
| Premises and Equipment | 2,864 | 2,864 | 2,616 | |||||||||||||
| FDIC Insurance Expense | 1,559 | 1,559 | 482 | |||||||||||||
| Other Expenses | 3,875 | (1,300 | ) | 2,575 | 3,245 | |||||||||||
| Total Operating Expenses | 19,206 | (1,300 | ) | 17,906 | 15,768 | |||||||||||
| INCOME BEFORE TAXES | 8,767 | (1,300 | ) | 10,067 | 8,347 | |||||||||||
| Income Tax Expense/(Benefit) | 3,278 | (486 | ) | 3,764 | 3,339 | |||||||||||
| NET INCOME | $ | 5,489 | ($ | 814 | ) | $ | 6,303 | $ | 5,008 | |||||||
| Diluted Weighted Average Number of | ||||||||||||||||
| Common Shares Outstanding | 16,017 | 16,017 | 15,070 | |||||||||||||
| Earnings Per Share (Diluted) | $ | 0.34 | 0.39 | $ | 0.33 | |||||||||||
| Total Revenue (NII+Other Income) | $ | 29,673 | $ | 29,673 | $ | 25,465 | ||||||||||
| Return on Average Assets Annualized (ROAA) | 0.64% | 0.73% | 0.71% | |||||||||||||
| Return on Average Common Equity Annualized (ROAE) | 7.83% | 8.99% | 8.13% | |||||||||||||
| Net Interest Margin (Taxable Equivalent Basis) | 2.82% | 2.82% | 2.88% | |||||||||||||
| Operating Expenses/Average Assets Annualized | 2.22% | 2.07% | 2.24% | |||||||||||||
| Efficiency Ratio | 65.22% | 60.81% | 62.58% | |||||||||||||
(A) The quarter ended March 31, 2016 included $1.3 million of charges related to increased FDIC premiums and increased risk management related expenses.