Attached files
| file | filename |
|---|---|
| 8-K - NMI HOLDINGS, INC. FORM 8-K - NMI Holdings, Inc. | nmih8-kq12016earnings.htm |
| EX-99.1 - EXHIBIT 99.1 - NMI Holdings, Inc. | exhibit991q12016earnings.htm |

© 2016 NMI Holdings, Inc. First Quarter 2016 Information Supplement April 26, 2016 NMI Holdings, Inc. (NMIH)

1© 2016 NMI Holdings, Inc. NIW, Market Share, Application Mix $919 $1,461 $1,582 $2,030 $2,492 $777 $1,088 $2,051 $2,517 $1,762 $0 $1,000 $2,000 $3,000 1Q15 2Q15 3Q15 4Q15 1Q16 New Insurance Written $Millions Monthly Single $32 $43 $44 $35 $34 $12 $17 $17 $15 $14 2.9% 3.4% 3.6% 5.7% 7.4%6.3% 6.5% 11.9% 16.6% 12.2% 0% 2% 4% 6% 8% 10% 12% 14% 16% 18% $- $10 $20 $30 $40 $50 1Q15 2Q15 3Q15 4Q15 1Q16 Ma rk et S iz e $ B Market Size and Share by Product Market - Monthly Market - Single NMI Share - Monthly NMI Share - Single Based on company estimates and competitor results 44% 47% 50% 63% 62% 60% 68% 0% 10% 20% 30% 40% 50% 60% 70% 80% Oct -15 Nov-15 Dec-15 Jan-16 Feb-16 Mar-16 MTD Apr- 16 % Monthly Product - Applications

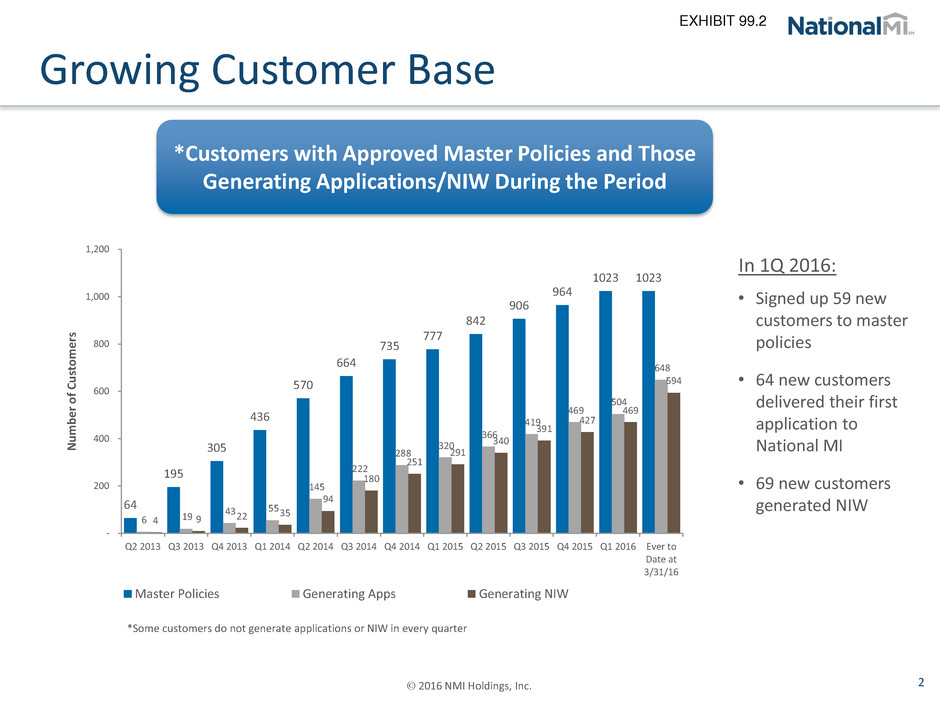
2© 2016 NMI Holdings, Inc. Growing Customer Base *Customers with Approved Master Policies and Those Generating Applications/NIW During the Period • Signed up 59 new customers to master policies • 64 new customers delivered their first application to National MI • 69 new customers generated NIW In 1Q 2016: 64 195 305 436 570 664 735 777 842 906 964 1023 1023 6 19 43 55 145 222 288 320 366 419 469 504 648 4 9 22 35 94 180 251 291 340 391 427 469 594 - 200 400 600 800 1,000 1,200 Q2 2013 Q3 2013 Q4 2013 Q1 2014 Q2 2014 Q3 2014 Q4 2014 Q1 2015 Q2 2015 Q3 2015 Q4 2015 Q1 2016 Ever to Date at 3/31/16 N u m b e r o f C u st o m e rs Master Policies Generating Apps Generating NIW *Some customers do not generate applications or NIW in every quarter

3© 2016 NMI Holdings, Inc. Financial Highlights 4.8 7.2 10.6 14.8 18.6 $5.7 $7.6 $11.6 $15.7 $18.7 0 5 10 15 20 25 30 0 5 10 15 20 25 1Q15 2Q15 3Q15 4Q15 1Q16 In suran ce in F o rc e $B ill io n s P re m iu m Ea rn e d $ M ill io n s Insurance-in-Force & Premiums Earned Primary Insurance in Force Premium Earned - Primary $18.4 $20.9 $19.7 $21.7 $22.7 $2.1 $3.6 $(7.8) $(10.4) $(4.8) $(4.8) $(3.9) $(12.0) $(10.0) $(8.0) $(6.0) $(4.0) $(2.0) $- $- $5 $10 $15 $20 $25 $30 1Q15 2Q15 3Q15 4Q15 1Q16 N et L o ss Ex p en se s $mi lli o n s Expenses & Net Loss Operating Expenses Interest Expense Net Loss 276 271 286 517 546 158 163 161 100 84 $0 $100 $200 $300 $400 $500 $600 $700 1Q15 2Q15 3Q15 4Q15 1Q16 Cash & Investments $millions Insurance Companies Holding Company 248 234 229 431 434 $0 $100 $200 $300 $400 $500 1Q15 2Q15 3Q15 4Q15 1Q16 PMIERs Available Assets $millions

4© 2016 NMI Holdings, Inc. Rethinking the MI Pricing Model Illustrative Loan-Level Example* Pre-Crisis Post-PMIERs Legacy1 Steady State Private MI Market Size $265B (2004) $220B (2016E) Weighted Average FICO 685 750 Weighted Average Premium 62 bps 50 bps Default Frequency 3.5% 2% Loss Ratio 31% 22% Expense Ratio 16% 20% Combined Ratio 47% 42% Underwriting Margin 53% 58% Required Assets (as % of risk)2 8.0% 5.78% After-Tax Investment Yield3 3% 2% Return-on-Required Assets 14.87% 14.95% 1. Legacy operating ratios 1990-2006 2. Initial post-PMIERs asset charge is 6.5%, however under PMIERs, capital charges are relieved over time by seasoning credit, which makes the effective asset charge lower 3. 35% effective tax rate * For illustration purposes only; this is not formal guidance or a forecast Total return on required assets may be less than loan-level pricing model depending upon expense and capital efficiency Return on equity (ROE) for the enterprise can be enhanced through use of debt, reinsurance, or offshore tax structure Acquisition and servicing expenses are fixed on a per-unit basis and are the same regardless of premium rate or loan size; as premium rate decreases, expense ratio increases
