Attached files
| file | filename |
|---|---|
| 8-K - 8-K - ENTEGRIS INC | d185912d8k.htm |
| EX-99.1 - EX-99.1 - ENTEGRIS INC | d185912dex991.htm |
 First Quarter FY 2016
Earnings Summary
April 26, 2016
R 4.0 Exhibit 99.2 |
 1Q-2016 Financial Results| 2
Forward-Looking Statements and Non-GAAP Disclosures
Certain information contained in this press release may constitute
forward-looking statements within the meaning of the Private
Securities Litigation Reform Act of 1995. These forward-looking statements are based on current management expectations only as of the date of this press release, and involve substantial risks and uncertainties
that could cause actual results to differ materially from the results expressed
in, or implied by, these forward- looking statements.
Statements that include such words as “anticipate,” “believe,” “estimate,” “expect,” “forecast,” “may,” “will,” “should” or the negative thereof and similar expressions as they
relate to Entegris or our
management are intended to identify such forward-looking statements.
These statements are not guarantees of future performance and
involve risks, uncertainties and assumptions that are difficult to predict. These risks include, but are not limited to, fluctuations in the market price of Entegris’ stock, Entegris’ future operating results,
other acquisition and investment opportunities available to
Entegris, general business and market conditions and other
factors. Additional information concerning these and other risk factors may be found in previous financial press releases issued by Entegris and Entegris’ periodic public filings with the Securities and Exchange Commission,
including discussions appearing under the headings “Risks Relating to our
Business and Industry,” “Risks Relating to Our
Indebtedness,” “Manufacturing Risks,” “International Risks,” and “Risks Related to Owning Our Common Stock” in Item 1A of our Annual Report on Form 10–K for the fiscal year ended December 31, 2015, filed with the U.S
Securities and Exchange Commission on February 29, 2016, as well as other
matters and important factors disclosed previously and from time
to time in the filings of Entegris with the U.S. Securities and
Exchange Commission. Except as required under the federal
securities laws and the rules and regulations of the Securities
and Exchange Commission, we undertake no obligation to update publicly any
forward-looking statements contained herein.
Safe Harbor Non-GAAP Measures Management uses certain non-GAAP measurements to assess the Company’s current and future financial performance. The non-GAAP measurements do not replace the presentation of the Company’s GAAP financial
results. These measurements provide supplemental information to assist
management in analyzing the Company’s financial position and
results of operations. Reconciliations of the non-GAAP financial measures used throughout this presentation to comparable GAAP measures can be found in Appendix and on the Entegris
website: www.entegris.com. |
 1Q-2016 Financial Results| 3
($ Millions) 1Q16 1Q16 Guidance 4Q15 1Q15 1Q16 over 4Q15 1Q16 over 1Q15 Net Revenue $267.0 $250 to $265 $266.8 $263.4 0.1% 1.4% Gross Margin 43.0% 42% to 43% 41.0% 44.2% 4.9% (2.7%) Non-GAAP Operating Expenses $73.9 $72.2 $74.1 2.4% (0.3%) Adjusted EBITA (1) $40.8 $37.1 $42.5 10.0% (4.0%) Adjusted EBITA Margin (1) 15.3% 13.9% 16.1% 10.1% (5.0%) Non-GAAP Tax Rate 26.8% 28% (3.5%) 27.5% NM (2.5%) Non-GAAP Net Income $23.6 $28.8 $25.4 (18.1%) (7.1%) Non-GAAP EPS $0.17 $0.13 to $0.17 $0.20 $0.18 (15.0%) (5.6%) Summary – Consolidated Statement of Operations Summary – Consolidated Statement of Operations 1. See GAAP to Non-GAAP statements in the Company’s press release |
 1Q-2016 Financial Results| 4
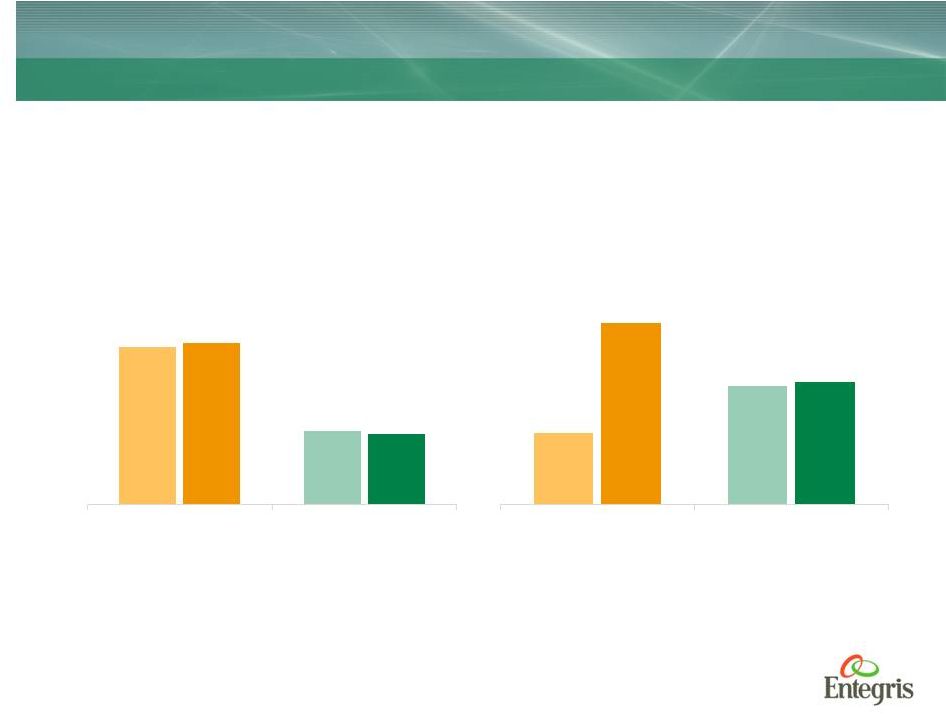
Results By Segment
Results By Segment
Sales by Segment
4Q15 1Q16 4Q15 1Q16 $ in Millions Profit Margin by Segment (1) 4Q15 1Q16 4Q15 1Q16 % Sales 1. Excludes amortization of intangibles and unallocated expenses. 20.2% 21.3% 22.8% 21.4% Critical Materials Handling Electronic Materials $163.6 $103.2 $166.2 $100.8 Critical Materials Handling Electronic Materials |
 1Q-2016 Financial Results| 5
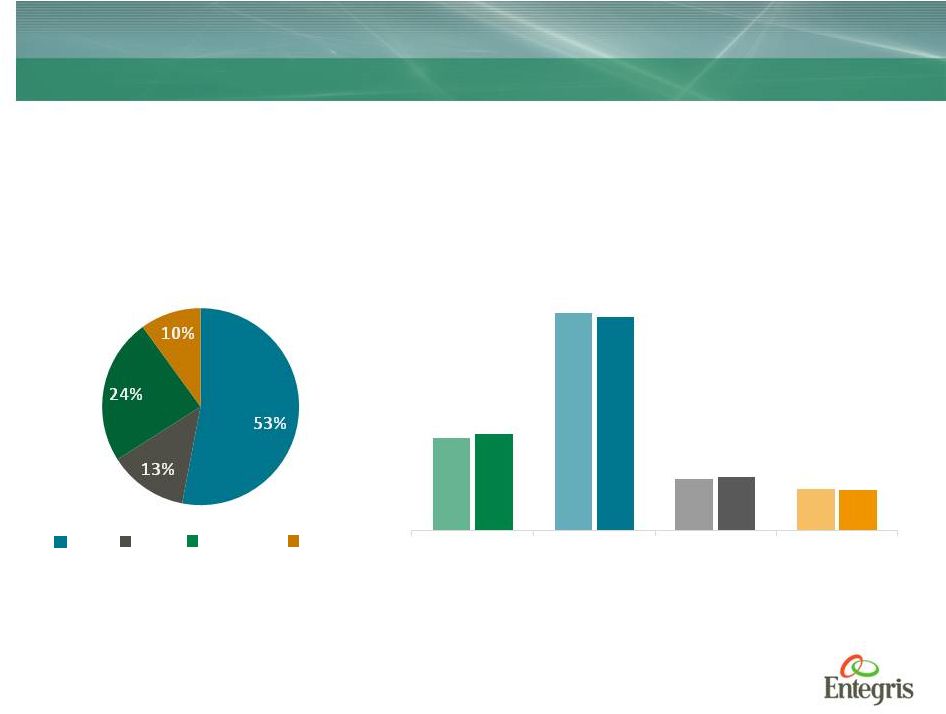
Revenue by Geography
Revenue by Geography
Revenue By Geography
Asia Japan Europe N. America 4Q15 1Q16 Revenue by Geography Sequential Trends $ in Millions 4Q15 1Q16 4Q15 1Q16 4Q15 1Q16 Q1-2016 $61.1 $143.6 $34.3 $27.8 $64.0 $141.2 $35.2 $26.7 US Asia Japan Europe |
 1Q-2016 Financial Results| 6
1Q16 4Q15 1Q15 ($ Millions) $ Amount % Total $ Amount % Total $ Amount % Total Cash & Cash Equivalents $344.4 20.8% $349.8 21.2% $341.4 19.9% Accounts Receivable, net $149.8 9.1% $141.4 8.6% $184.7 10.7% Inventories $184.0 11.1% $173.2 10.5% $166.2 9.7% Net PP&E $322.7 19.5% $321.3 19.5% $313.1 18.2% Total Assets $1,653.8 $1,646.7 $1,719.8 Current Liabilities (1) $161.7 9.8% $175.6 10.7% $228.0 13.3% Long-term debt, excluding current maturities $606.6 36.7% $606.0 36.8% $653.9 38.0% Total Liabilities $832.0 50.3% $843.8 51.2% $965.3 56.1% Total Shareholders’ Equity $821.8 49.7% $802.9 48.8% $754.5 43.9% AR Turnover Days 51.2 48.4 64.0 Inventory Turns 3.4 3.5 3.6 Summary – Balance Sheet Items Summary – Balance Sheet Items 1. Current Liabilities in 1Q15, 4Q15, 1Q16 includes $75 million, $50 million, and $50 million of current maturities of long
term debt |
 1Q-2016 Financial Results| 7
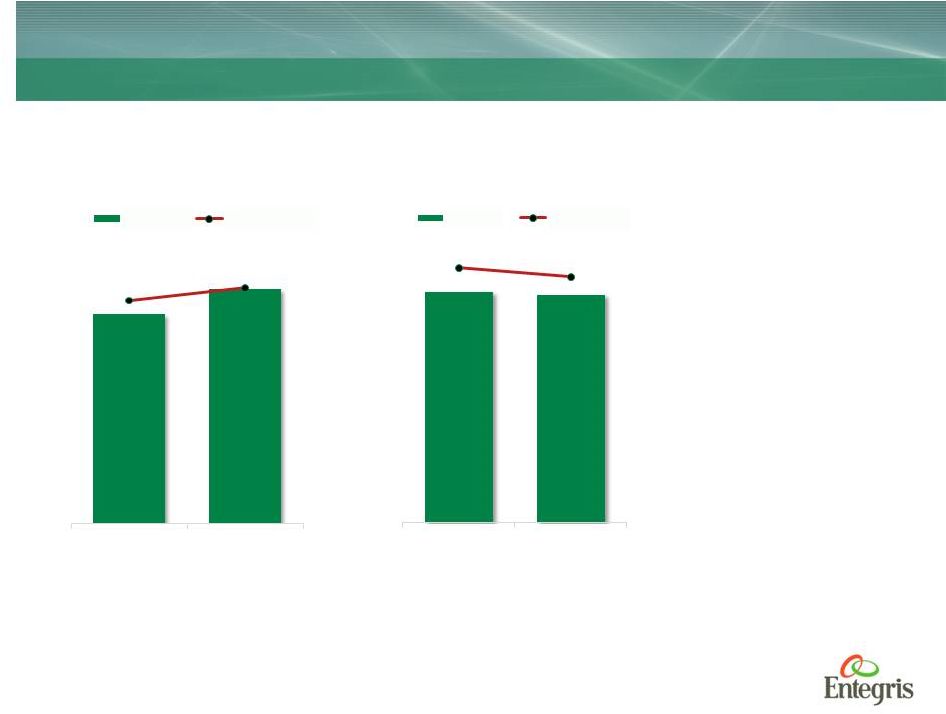
EBITDA EBITDA ($ in Millions) $51 $55 19.3% 0 0.05 0.1 0.15 0.2 25 30 35 40 45 50 55 60 4Q15 1Q16 Adjusted EBITDA Adj. EBITDA EBITDA margin $234 $231 22.1% 0 0.05 0.1 0.15 0.2 25 75 125 175 225 275 TTM - 1Q15(1) TTM - 1Q16 Adjusted EBITDA Adj. EBITDA EBITDA margin 20.4% 21.3% |
 1Q-2016 Financial Results| 8
($ Millions) 1Q16 4Q15 1Q15 Beginning Cash Balance $349.8 $301.1 $389.7 Cash from operating activities $17.3 $52.2 $(0.1) Capital expenditures $(17.8) $(16.3) $(20.5) Payments on long-term debt - - $(25) Other investing activities $(2.5) $(5.9) $1.1 Other financing activities $(5.6) $6.4 $(1.4) Effect of exchange rates $3.2 $0.5 $(2.4) Ending Cash Balance $344.4 $349.8 $341.4 Free Cash Flow $(0.5) $35.9 $(20.6) Adjusted EBITDA $54.5 $55.8 $51.4 Cash Flows Cash Flows |
 1Q-2016 Financial Results| 9
Outlook Outlook ($ Millions, except per share data) 2Q16 Guidance 1Q16 2Q15 Net Revenue $270 to $285 $267.0 $280.7 Gross Margin 43.5% to 44.5% 43.0% 45.6% Non-GAAP Operating Expenses $74 to $77 $73.9 $74.4 Non-GAAP Tax Rate 28% 26.8% 25% Non-GAAP Net Income $26 to $31 $23.6 $33.9 Non-GAAP EPS $0.18 to $0.22 $0.17 $0.24 |
 1Q-2016 Financial Results| 10
Appendix and Non-GAAP Reconciliation Table
Appendix and Non-GAAP Reconciliation Table
|
 1Q-2016 Financial Results| 11
Non GAAP Reconciliation Table
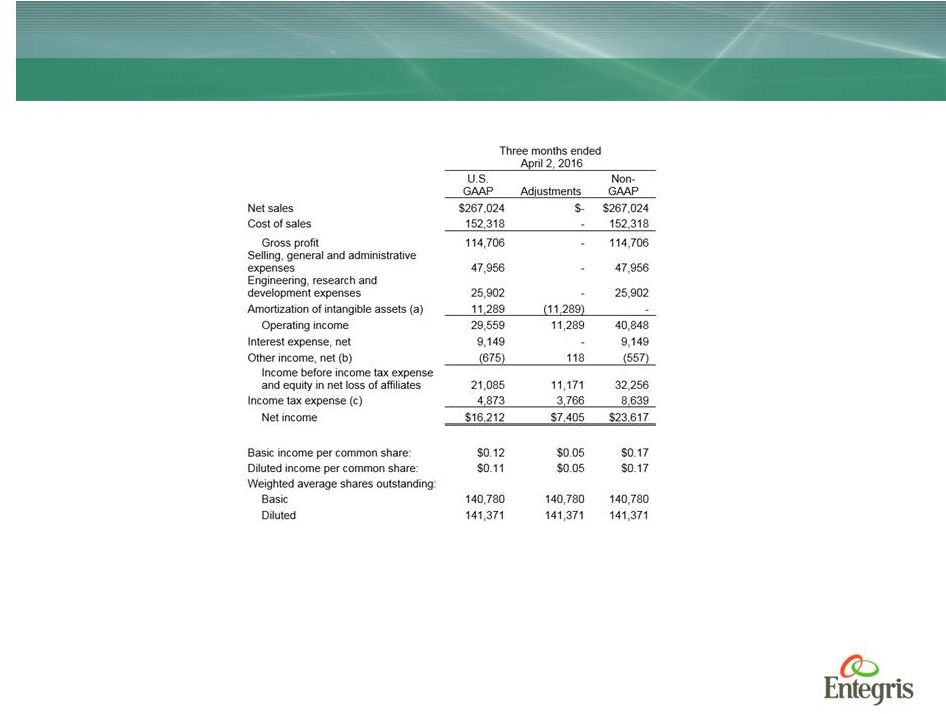
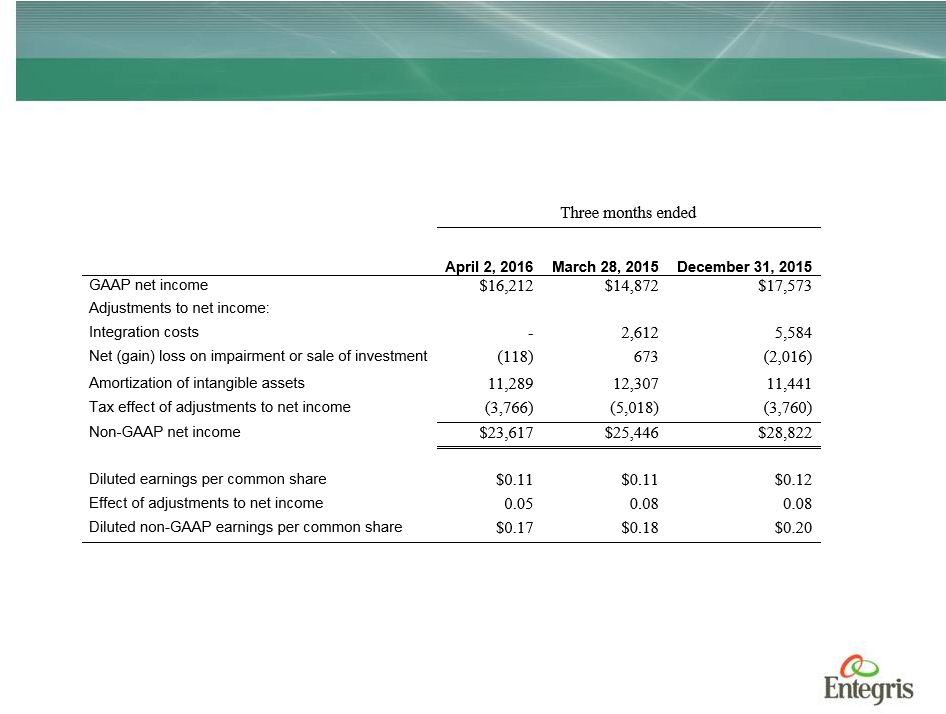
GAAP to Non-GAAP Reconciliation of Statement of Operations
Non GAAP Reconciliation Table
GAAP to Non-GAAP Reconciliation of Statement of Operations
(In thousands, except per share data)
(Unaudited) a) Amortization expense for the three months ended April 2, 2016 is adjusted for $11.3 million for amortization expense related to
acquisitions. b)
Other income, net for the three months ended April 2, 2016 is adjusted for a
$0.1 million gain on the sale of an equity investment.
c) Income tax expense for the three months ended April 2, 2016 is adjusted for $3.8 million related to the adjustments noted
above. The above GAAP to Non-GAAP Reconciliation of Statement
of Operations is provided as a complement to and should be read in conjunction with the Condensed Consolidated Statements of Operations. The above GAAP to Non-GAAP Reconciliation of Statement of Operations is provided to better facilitate the
assessment and measurement of the Company’s operating
performance.
|
 1Q-2016 Financial Results| 12
Non GAAP Reconciliation Table
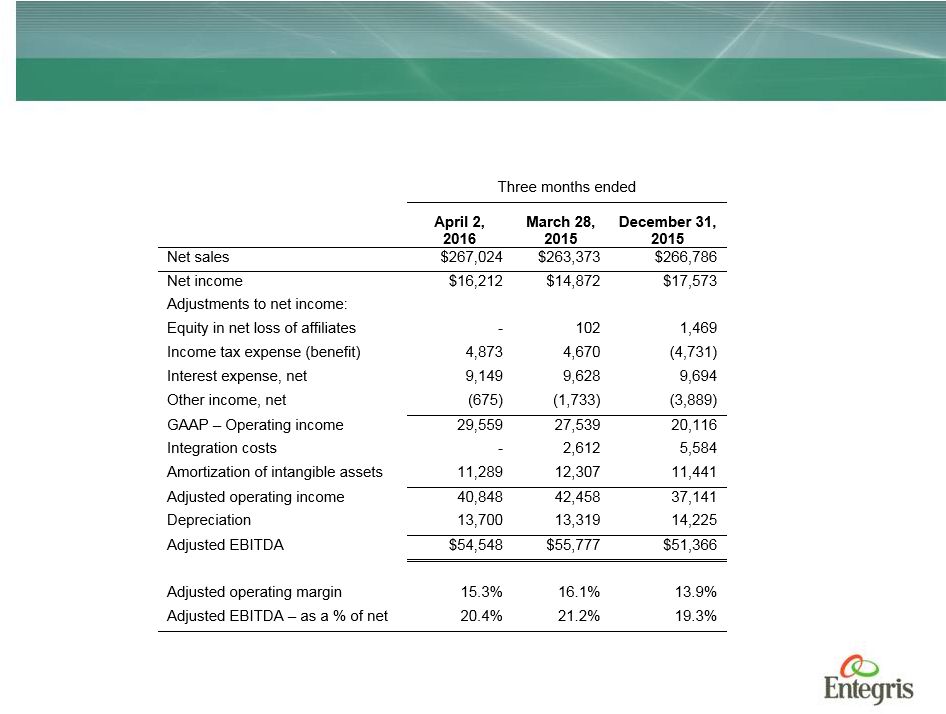
Reconciliation of GAAP to Adjusted Operating Income and Adjusted
EBITDA Non GAAP Reconciliation Table
Reconciliation of GAAP to Adjusted Operating Income and Adjusted
EBITDA (In thousands, except per share data)
(Unaudited) |
 1Q-2016 Financial Results| 13
Non GAAP Reconciliation Table
Reconciliation of GAAP to Non-GAAP Earnings Per Share
Non GAAP Reconciliation Table
Reconciliation of GAAP to Non-GAAP Earnings Per Share
(In thousands, except per share data)
(Unaudited) |
 Entegris®,
the Entegris Rings Design® and Creating a Material Advantage SM are trademarks of Entegris, Inc. ©2013 Entegris, Inc. All rights reserved. |