Attached files
| file | filename |
|---|---|
| 8-K - CIRRUS LOGIC, INC. 8-K - CIRRUS LOGIC, INC. | a51328155.htm |
| EX-99.1 - EXHIBIT 99.1 - CIRRUS LOGIC, INC. | a51328155ex99_1.htm |
Exhibit 99.2
April 26, 2016 Letter
to Shareholders Q4 FY16 FYFY13 CIRRUS LOGIC, INC. 800 WEST SIXTH STREET,
AUSTIN, TEXAS 78701
April 26, 2016 Dear
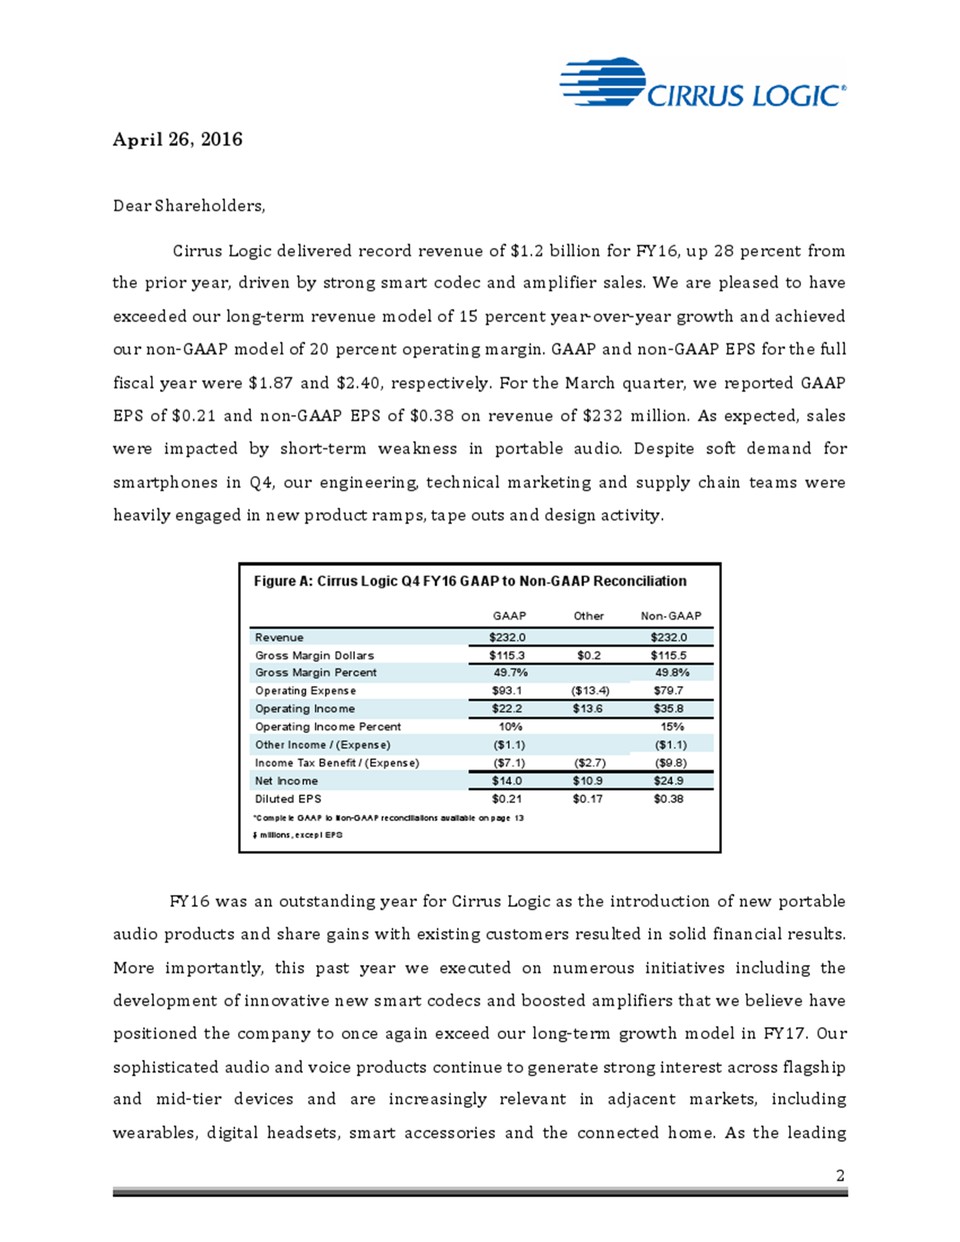
Shareholders, Cirrus Logic delivered record revenue of $1.2 billion for
FY16, up 28 percent from the prior year, driven by strong smart codec
and amplifier sales. We are pleased to have exceeded our long-term
revenue model of 15 percent year-over-year growth and achieved our
non-GAAP model of 20 percent operating margin. GAAP and non-GAAP EPS for
the full fiscal year were $1.87 and $2.40, respectively. For the March
quarter, we reported GAAP EPS of $0.21 and non-GAAP EPS of $0.38 on
revenue of $232 million. As expected, sales were impacted by short-term
weakness in portable audio. Despite soft demand for smartphones in Q4,
our engineering, technical marketing and supply chain teams were heavily
engaged in new product ramps, tape outs and design activity. GAAP Other
Non-GAAP Revenue $232.0 $232.0 Gross Margin Dollars $115.3 $0.2
$115.5 Gross Margin Percent 49.7% 49.8% Operating Expense $93.1
($13.4) $79.7 Operating Income $22.2 $13.6 $35.8 Operating Income
Percent 10% 15% Other Income / (Expense) ($1.1) ($1.1) Income
Tax Benefit / (Expense) ($7.1) ($2.7) ($9.8) Net Income $14.0 $10.9
$24.9 Diluted EPS $0.21 $0.17 $0.38 FY16 was an outstanding year for
Cirrus Logic as the introduction of new portable audio products and
share gains with existing customers resulted in solid financial results.
More importantly, this past year we executed on numerous initiatives
including the development of innovative new smart codecs and boosted
amplifiers that we believe have positioned the company to once again
exceed our long-term growth model in FY17. Our sophisticated audio and
voice products continue to generate strong interest across flagship and
mid-tier devices and are increasingly relevant in adjacent markets,
including wearables, digital headsets, smart accessories and the
connected home. As the leading 2
Revenue and Gross
Margins We
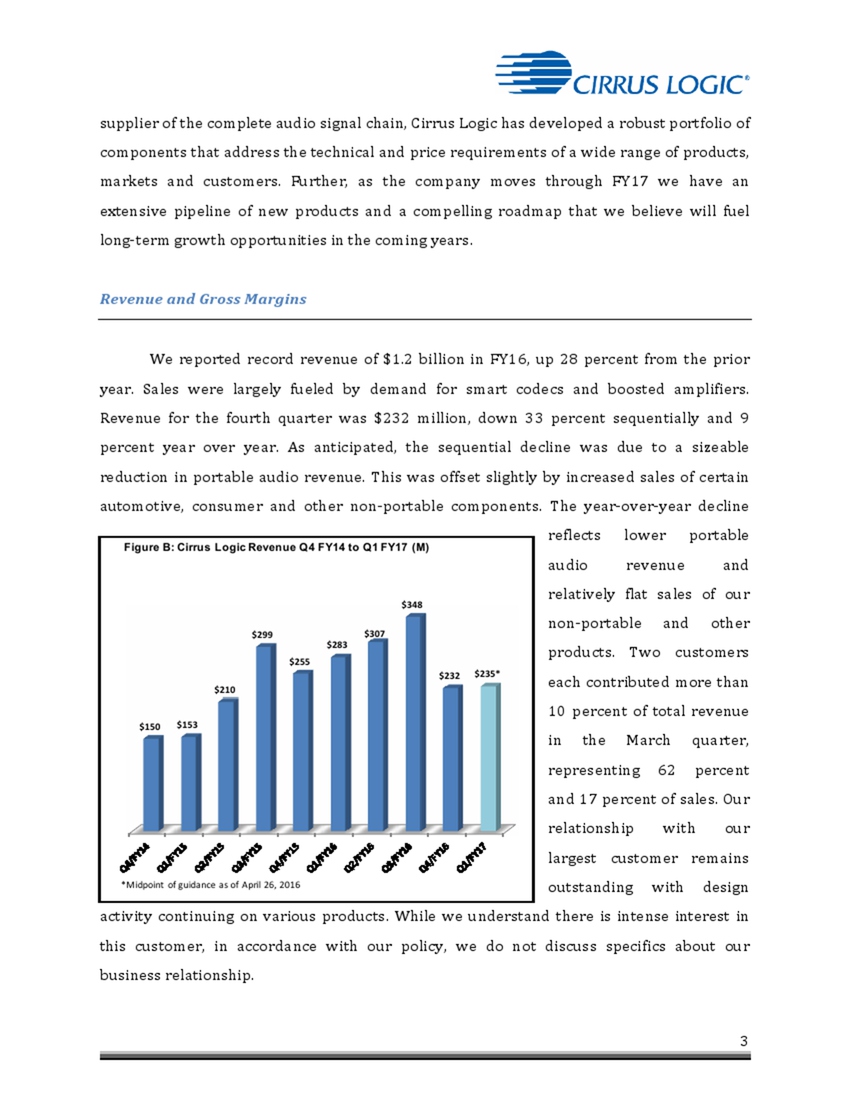
reported record revenue of $1.2 billion in FY16, up 28 percent from the
prior year. Sales were largely fueled by demand for smart codecs and
boosted amplifiers. Revenue for the fourth quarter was $232 million,
down 33 percent sequentially and 9 percent year over year. As
anticipated, the sequential decline was due to a sizeable reduction in
portable audio revenue. This was offset slightly by increased sales of
certain automotive, consumer and other non-portable components. The
year-over-year decline reflects lower portable audio revenue and
relatively flat sales of our non-portable and other products. Two
customers each contributed more than 10 percent of total revenue in the
March quarter, representing 62 percent and 17 percent of sales. Our
relationship with our largest customer remains outstanding with design
activity continuing on various products. While we understand there is
intense interest in this customer, in accordance with our policy, we do
not discuss specifics about our business relationship.
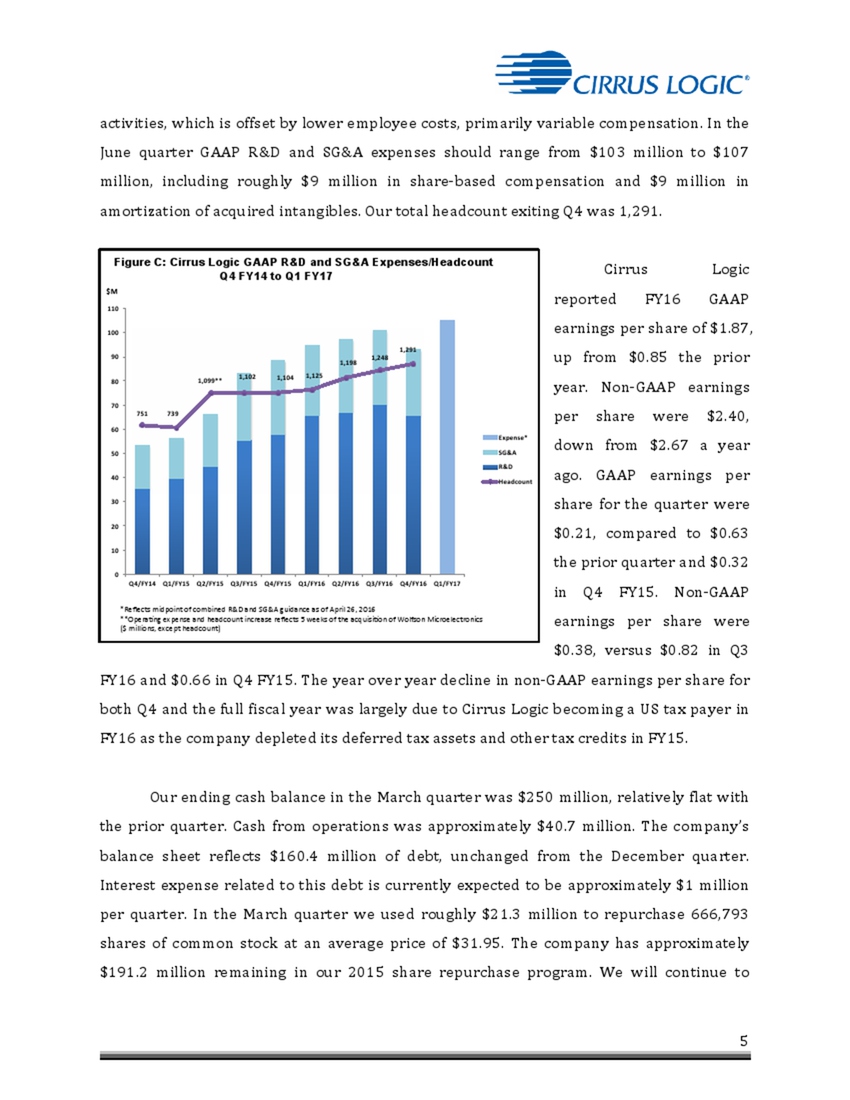
In the June quarter, we anticipate revenue will range from $220 million to $250 million, representing a one percent increase sequentially and a 17 percent decline year over year at the midpoint. Guidance for the quarter reflects continued short-term weakness in portable audio. As we look to FY17 overall, we continue to foresee strong growth, particularly in the second half of the year, driven by new product introductions and share expansion with existing and new customers. FY16 gross margins were 47.5 percent GAAP and 47.6 percent non-GAAP. For the March quarter, GAAP and non-GAAP gross margin were 49.7 percent and 49.8 percent, respectively. We exceeded Q4 gross margin guidance largely due to a lower contribution of revenue derived from portable audio products. In the June quarter, gross margin should range from 47 percent to 49 percent, as the product mix remains relatively consistent with the prior quarter. Operating Profit, Earnings and Cash Cirrus Logic delivered GAAP operating margin of 15 percent in FY16, up from 12 percent the previous year. On a non-GAAP basis, operating margin was 20 percent, which is consistent with FY15 and our long-term model. GAAP and non-GAAP operating expenses for the fiscal year were $374.6 million and $325.3 million, respectively. Operating expenses in FY15 were $317 million GAAP and $253.2 million non-GAAP. Some of the main factors of the year-over-year increase include a substantial uptick in headcount, higher product development costs and a full year of expenses associated with the acquisition of Wolfson Microelectronics in FY15. Operating margin in the March quarter was approximately 10 percent GAAP and 15 percent on a non-GAAP basis. GAAP operating expenses were $93.1 million and non-GAAP operating expenses were $79.7 million. GAAP operating expenses include approximately $8.6 million in share-based compensation and $8.4 million in amortization of acquired intangibles, which was partially offset by a $3.7 million benefit associated with the write-off of a long-term contractual obligation. The sequential decline is primarily due to lower employee costs. The uptick in operating expenses on a year-over-year basis is largely associated with increased headcount and product development activities, which is offset by lower employee costs, primarily variable compensation. In the June quarter GAAP R&D and SG&A expenses should range from $103 million to $107 million, including roughly $9 million in share-based compensation and $9 million in amortization of acquired intangibles. Our total headcount exiting Q4 was 1,291.
Cirrus Logic reported FY16
GAAP earnings per share of $1.87, up from $0.85 the prior year. Non-GAAP
earnings per share were $2.40, down from $2.67 a year ago. GAAP earnings
per share for the quarter were $0.21, compared to $0.63 the prior
quarter and $0.32 in Q4 FY15. Non-GAAP earnings per share were $0.38,
versus $0.82 in Q3 FY16 and $0.66 in Q4 FY15. The year over year decline
in non-GAAP earnings per share for both Q4 and the full fiscal year was
largely due to Cirrus Logic becoming a US tax payer in FY16 as the
company depleted its deferred tax assets and other tax credits in FY15.
Our ending cash balance in the March quarter was $250 million,
relatively flat with the prior quarter. Cash from operations was
approximately $40.7 million. The company’s balance sheet reflects $160.4
million of debt, unchanged from the December quarter. Interest expense
related to this debt is currently expected to be approximately $1
million per quarter. In the March quarter we used roughly $21.3 million
to repurchase 666,793 shares of common stock at an average price of
$31.95. The company has approximately $191.2 million remaining in our
2015 share repurchase program. We will continue to evaluate potential
uses of cash including acquisitions, the repurchase of shares and
repayment of debt.
Taxes and Inventory The
FY16 GAAP tax expense was $52.4 million, resulting in an effective tax
rate of 29.8 percent. GAAP tax expense for the March quarter was $7.1
million, resulting in an effective tax rate of 33.6 percent. Non-GAAP
tax expense for the fiscal year and quarter were $68.4 million and $9.8
million, respectively. Non-GAAP effective tax rates for the fiscal year
and quarter were 30.2 percent and 28.2 percent, respectively. Non-GAAP
tax expense reflects the effect of higher non-GAAP income in various
jurisdictions. Moving forward, we expect a growing portion of our income
will be generated offshore; accordingly, our worldwide effective tax
rate in FY17 should range from 27 percent to 29 percent. Q4 inventory
was $142 million, up slightly from the prior quarter. Inventory is
expected to increase in the first half of the fiscal year as we ramp new
products ahead of anticipated customer demand in the back half of the
year. Company
Strategy FY16
was a tremendous year for Cirrus Logic. We delivered record revenue,
exceeded our long-term model of 15 percent growth and achieved our
non-GAAP operating margin model of 20 percent. We significantly enhanced
our product portfolio with new smart codecs, amplifiers and MEMS
microphones and diversified our customer base. Despite weaker than
anticipated demand for smartphones in the second half of the year, the
desire by OEMs to bring to market products with compelling audio and
voice technology that enables a differentiated user experience gained
momentum across flagship and mid-tier devices. We are pleased with our
accomplishments in FY16 as we increased our share with existing
customers and OEMs three through ten, made progress driving key flagship
features into mid-tier devices and introduced innovative products,
including those targeting the wearable and smart accessory market. We
remain keenly focused on a wide range of strategic initiatives in FY17,
that we believe are essential for future growth and will strengthen our
position as a market leader. As we move into FY17 the company
anticipates strong revenue growth fueled by share gains with existing
customers, progress in digital headsets and a substantial increase in
amplifier sales. We have a robust pipeline of smart codec, amplifier and
MEMS microphone products in advanced process nodes that we expect will
be launched over the next several quarters, which we believe will
generate meaningful revenue opportunities with both existing and new
customers.
range of strategic
initiatives in FY17, that we believe are essential for future growth and
will strengthen our position as a market leader. As we move into FY17
the company anticipates strong revenue growth fueled by share gains with
existing customers, progress in digital headsets and a substantial
increase in amplifier sales. We have a robust pipeline of smart codec,
amplifier and MEMS microphone products in advanced process nodes that we
expect to launch over the next several quarters and we believe will
generate meaningful revenue opportunities with both existing and new
customers. Cirrus Logic’s strategy of providing a comprehensive
portfolio of the very best hardware, software and associated signal
processing algorithms has enabled the company to increase content and
share with key customers in both flagship and mid-tier devices. We have
experienced success with this approach across numerous OEMs, including
our third largest handset customer, where we have greatly expanded our
presence. As an early adopter of cutting edge audio and voice technology
in the Android ecosystem, this customer’s desire for a differentiated
user experience is expected to drive new opportunities for content
expansion going forward. Further, we expect to continue to gain traction
in the broader Android market over the next several years as OEMs strive
to bring to market devices with advanced audio and voice features in
this increasingly competitive environment. During the quarter, we ramped
a new flagship multi-core smart codec with a key customer. Additionally,
we began shipping our first complete signal chain win with microphones,
a new mid-tier smart codec and a new boosted amplifier at another
tier-one smartphone customer. Chip design activity was also robust in Q4
as we taped out a new flagship high performance codec, a HiFi headphone
DAC, a boosted amplifier and worked to finalize the design of a next
generation mid-tier smart codec. With a wide range of products in the
market and an extensive roadmap that includes smart codecs, amplifiers
and microphones, Cirrus Logic is uniquely positioned to address the
technical and cost needs of the various tiers and geographies across the
complete audio signal chain, providing us numerous opportunities to
increase total content with our customers. Amplifiers continue to be one
of our most successful product lines with units increasing 32 percent
year over year in FY16. In FY17, we expect this business to
meaningfully contribute to
our growth as we gain share at several customers. Demand continues to
accelerate across flagship and mid-tier devices as OEMs push for louder,
higher quality sound in thinner industrial designs with limited physical
space allocated to speakers. We are pleased with our progress in the
March quarter as we began shipments of a new boosted amplifier with a
key smartphone customer. Based on our design momentum, we are optimistic
about our ability to continue to grow this business with both new and
existing customers over the next several years, particularly in Android
applications where we have experienced limited penetration historically.
Going forward, we plan to continue to invest heavily in best in class
hardware at advanced process nodes and the associated software,
including speaker protection and linearization, that we believe will
provide a competitive advantage and drive long-term success of this
product line. The digital headset market is in the early stages of
development as OEMs increasingly look to introduce new compelling
accessories targeting mobile phones. This is fueling a transition from
the traditional analog interface to digitally connected products within
the one billion-unit global headset and headphone market. With a
platform of ultra-low power, high performance products optimized for a
full range of digital headsets, Cirrus Logic is poised to capitalize on
this rapidly growing segment. At the high end, our disruptive headphone
smart codec provides high-fidelity audio playback and advanced features
such as adaptive active noise cancelling (ANC) across all form factors,
including non-sealed earbuds. While unit volumes at the high end are
relatively small and dominated by non-adaptive ANC headsets, we believe
our adaptive solution will increase the size of the addressable market.
Our technology enables OEMs to provide a user experience across all form
factors similar to that of a $200 to $300 ANC headset available today
but at a significantly lower price for the consumer. While we are
pleased with our design activity and customer feedback regarding our ANC
headsets, we are also excited with the momentum we are experiencing in
the substantially larger mainstream digital headset market. As the
analog technology shifts toward digital solutions over the next few
years even the most basic headset will require an interface device and
conversion circuitry. Our mainstream components are designed for this
type of application where we deliver a cost-effective high-fidelity
audio experience. Cirrus Logic has a diverse platform of products that
will enable customers to
develop digital headsets across a broad spectrum of specifications and
price points, dramatically increasing our served available market.
During the quarter, we remained heavily engaged in design activity with
several leading Android and aftermarket accessory OEMs. We also launched
our MFi Headset Development Kit, a reference design platform that helps
OEMs quickly develop Lightning-based digital headsets. More
importantly, while digital headsets are expected to contribute
meaningfully to revenue in FY17, we believe our long-term opportunities
in this market are extensive as more and more analog headsets transition
to digital over the next five years. We are extremely proud of our
progress this past year and are delighted as we move into FY17 as
content expansion and new product introductions are expected to fuel
strong year-over-year growth. We believe the company is well positioned
to expand share with new and existing mobile customers and continue to
leverage the audio and voice solutions we developed for mobile into
emerging markets such as wearables, virtual reality headsets, the
connected home and voice biometrics. With a robust portfolio of
compelling components and a solid pipeline of new products launching
over the next several years, we are extremely excited about our outlook
for the future. Summary and Guidance For the June quarter we expect the
following results:•Revenue to range between $220 million and $250
million; • GAAP gross margin to be between 47 percent and 49 percent;
and • Combined GAAP R&D and SG&A expenses to range between $103 million
and $107 million, including approximately $9 million in share-based
compensation expense and $9 million in amortization of acquired
intangibles.In summary, FY16 was a fantastic year for Cirrus Logic as
sales of our smart codecs and amplifiers drove revenue up 28 percent
year over year. Building on the market trends of this past year, demand
for innovative audio and voice products across the signal chain
continues to gain momentum. With a diverse product portfolio and extensive roadmap that addresses the technology and price requirements of flagship and mid-tier devices in the mobile, smart accessory, wearable and connected home markets, Cirrus Logic is poised to deliver strong annual revenue growth above our long-term model in FY17. Sincerely, Jason Rhode Thurman Case President and Chief Executive Officer Chief Financial Officer Conference Call Q&A Session Cirrus Logic will host a live Q&A session at 5 p.m. EST today to answer questions related to its financial results and business outlook. Participants may listen to the conference call on the Cirrus Logic website. Participants who would like to submit a question to be addressed during the call are requested to email investor.relations@cirrus.com. A replay of the webcast can be accessed on the Cirrus Logic website approximately two hours following its completion, or by calling (404) 537-3406, or toll-free at (855) 859-2056 (Access Code: 77072356). Use of Non-GAAP Financial Information To supplement Cirrus Logic's financial statements presented on a GAAP basis, Cirrus has provided non-GAAP financial information, including gross margins, operating expenses, net income, operating profit and income, tax expenses, effective tax rate and diluted earnings per share. A reconciliation of the adjustments to GAAP results is included in the tables below. Non-GAAP financial information is not
meant as a substitute for
GAAP results, but is included because management believes such
information is useful to our investors for informational and comparative
purposes. In addition, certain non-GAAP financial information is used
internally by management to evaluate and manage the company. The
non-GAAP financial information used by Cirrus Logic may differ from that
used by other companies. These non-GAAP measures should be considered in
addition to, and not as a substitute for, the results prepared in
accordance with GAAP. Safe Harbor Statement Except for historical
information contained herein, the matters set forth in this news release
contain forward-looking statements, including expectations for growth
and product ramps in the first quarter 2017 and beyond, our estimates of
effective tax rates, fiscal year 2017 revenue, gross margin, combined
research and development and selling, general and administrative expense
levels, share-based compensation expense and amortization of acquired
intangibles. In some cases, forward-looking statements are identified by
words such as “expect,” “anticipate,” “foresee,” “target,” “project,”
“believe,” “goals,” “opportunity,” “estimates,” “intend,” and variations
of these types of words and similar expressions. In addition, any
statements that refer to our plans, expectations, strategies or other
characterizations of future events or circumstances are forward-looking
statements. These forward-looking statements are based on our current
expectations, estimates and assumptions and are subject to certain risks
and uncertainties that could cause actual results to differ materially.
These risks and uncertainties include, but are not limited to, the
following: the level of orders and shipments during the first quarter of
fiscal year 2017, customer cancellations of orders, or the failure to
place orders consistent with forecasts, along with the timing and
success of future product ramps; and the risk factors listed in our Form
10-K for the year ended March 28, 2015, and in our other filings with
the Securities and Exchange Commission, which are available at
www.sec.gov. The foregoing information concerning our business outlook
represents our outlook as of the date of this news release, and we
undertake no obligation to update or revise any forward-looking
statements, whether as a result of new developments or otherwise. Cirrus
Logic and Cirrus are registered trademarks of Cirrus Logic, Inc.,
Android is a registered trademark of Google, Inc. and Lightning is a
registered trademark of Apple Inc. All other company or product names
noted herein may be trademarks of their respective holders. Summary
financial data follows:
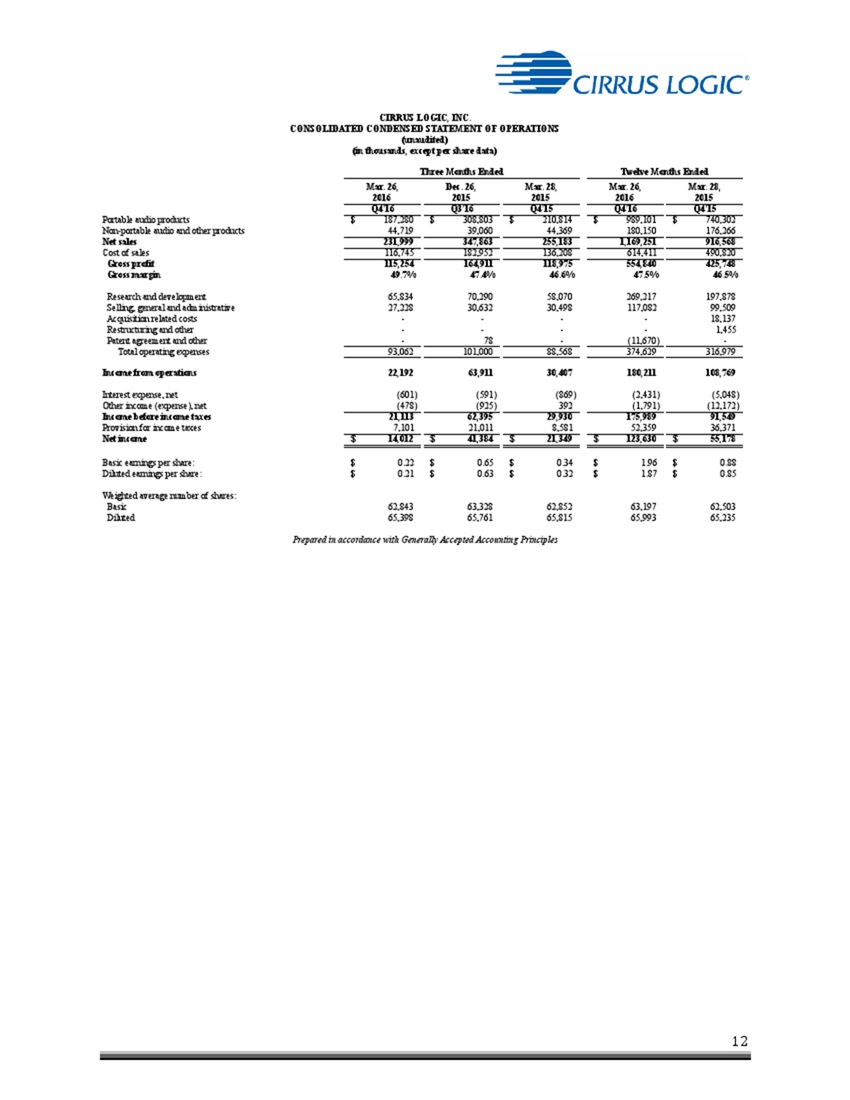
CIRRUS LOGIC, INC. CONSOLIDATED CONDENSED STATEMENT OF OPERATIONS (unaudited) (in thousands, except per share data) Three Months Ended Twelve Months Ended Mar. 26, Dec. 26, Mar. 28, Mar. 26, Mar. 28, 2016 2015 2015 2016 2015 Q4'16 Q3'16 Q4'15 Q4'16 Q4'15 Portable audio products $ 187,280 $ 308,803 $ 210,814 $ 989,101 $ 740,302 Non-portable audio and other products 44,719 39,060 44,369 180,150 176,266 Net sales 231,999 347,863 255,183 1,169,251 916,568 Cost of sales 116,745 182,952 136,208 614,411 490,820 Gross profit 115,254 164,911 118,975 554,840 425,748 Gross margin 49.7% 47.4% 46.6% 47.5% 46.5% Research and development 65,834 70,290 58,070 269,217 197,878 Selling, general and administrative 27,228 30,632 30,498 117,082 99,509 Acquisition related costs - - - - 18,137 Restructuring and other - - - - 1,455 Patent agreement and other - 78 - (11,670) - Total operating expenses 93,062 101,000 88,568 374,629 316,979 Income from operations 22,192 63,911 30,407 180,211 108,769 Interest expense, net (601) (591) (869)(2,431) (5,048) Other income (expense), net (478) (925) 392 (1,791)(12,172) Income before income taxes 21,113 62,39 29,930 175,989 91,549 Provision for income taxes 7,101 21,011 8,581 52,359 36,371 Net income $ 14,012 $ 41,384 $ 21,349 $ 123,630 $ 55,178 Basic earnings per share: $ 0.22 $ 0.65 $ 0.34 $ 1.96 $ 0.88 Diluted earnings per share: $ 0.21 $ 0.63 $ 0.32 $ 1.87 $ 0.85 Weighted average number of shares: Basic 62,843 63,328 62,852 63,197 62,503 Diluted 65,398 65,761 65,815 65,993 65,235 Prepared in accordance with Generally Accepted Accounting Principles
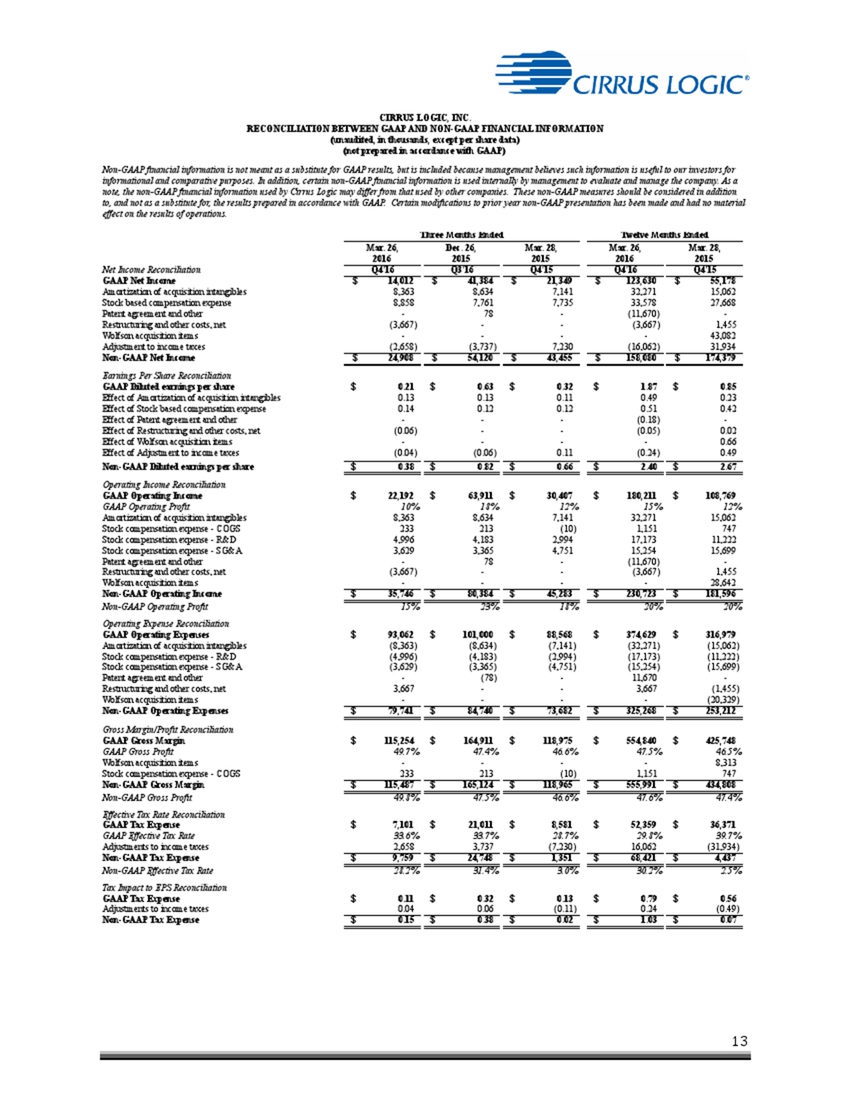
CIRRUS LOGIC, INC.
RECONCILIATION BETWEEN GAAP AND NON-GAAP FINANCIAL INFORMATION
(unaudited, in thousands, except per share data) (not prepared in
accordance with GAAP) Non-GAAP financial information is not meant as a
substitute for GAAP results, but is included because management believes
such information is useful to our investors for informational and
comparative purposes. In addition, certain non-GAAP financial
information is used internally by management to evaluate and manage the
company. As a note, the non-GAAP financial information used by Cirrus
Logic may differ from that used by other companies. These non-GAAP
measures should be considered in addition to, and not as a substitute
for, the results prepared in accordance with GAAP. Certain
modifications to prior year non-GAAP presentation has been made and had
no material effect on the results of operations. Three Months Ended
Twelve Months Ended Mar. 26, Dec. 26, Mar. 28, Mar. 26, Mar. 28, 2016
2015 2015 2016 2015 Net Income Reconciliation Q4'16 Q3'16 Q4'15 Q4'16
Q4'15 GAAP Net Income $ 14,012 $ 41,384 $ 21,349 $ 123,630 $ 55,178
Amortization of acquisition intangibles 8,363 8,634 7,141 32,271 15,062
Stock based compensation expense 8,858 7,761 7,735 33,578 27,668 Patent
agreement and other - 78 - (11,670) - Restructuring and other costs,
net (3,667) - - (3,667) 1,455 Wolfson acquisition items - - - -
43,082 Adjustment to income
taxes (2,658) (3,737) 7,230 (16,062) 31,934 Non-GAAP Net Income
Earnings Per Share Reconciliation $ 24,908 $ 54,120 $ 43,455 $ 158,080 $
174,379 GAAP Diluted earnings per share $ 0.21 $ 0.63 $ 0.32 $ 1.87 $
0.85 Effect of Amortization of acquisition intangibles 0.13 0.13 0.11
0.49 0.23 Effect of Stock based compensation expense 0.14 0.12 0.12 0.51
0.42 Effect of Patent agreement and other - - - (0.18) -
Effect of Restructuring and other costs, net (0.06) - - (0.05) 0.02
Effect of Wolfson acquisition items - - - - 0.66 Effect of
Adjustment to income taxes (0.04) (0.06) 0.11 (0.24) 0.49 Non-GAAP
Diluted earnings per share Operating Income Reconciliation GAAP
Operating Income $ 0.38 $ $ 22,192 $ 0.82 $ 63,911 $ 0.66 $ 30,407 $
2.40 $ 180,211 $ 2.67 108,769 GAAP Operating Profit 10% 18% 12% 15%
12% Amortization of acquisition intangibles 8,363 8,634 7,141 32,271
15,062 Stock compensation expense – COGS 233 213 (10) 1,151 747 Stock
compensation expense - R&D 4,996 4,183 2,994 17,173 11,222 Stock
compensation expense - SG&A 3,629 3,365 4,751 15,254 15,699 Patent
agreement and other - 78 - (11,670) - Restructuring and other costs, net
(3,667) - - (3,667) 1,455 Wolfson acquisition items - - - - 28,642
Non-GAAP Operating Income $ 35,746 $ 80,384 $ 45,283 $ 230,723 $ 181,596
Non-GAAP Operating Profit 15% 23% 18% 20% 20% Operating Expense
Reconciliation GAAP Operating Expenses $ 93,062 $ 101,000 $ 88,568 $
374,629 $ 316,979 Amortization of acquisition intangibles (8,363)
(8,634) (7,141) (32,271) (15,062) Stock compensation expense -
R&D (4,996) (4,183) (2,994) (17,173) (11,222) Stock compensation expense
- SG&A (3,629) (3,365) (4,751) (15,254) (15,699) Patent agreement and
other - (78) - 11,670 - Restructuring and other costs, net 3,667 - -
3,667 (1,455) Wolfson acquisition items - - - - (20,329) Non-GAAP
Operating Expenses $ 79,741 $ 84,740 $ 73,682 $ 325,268 $ 253,212 Gross
Margin/Profit Reconciliation GAAP Gross Margin $ 115,254 $ 164,911 $
118,975 $ 554,840 $ 425,748 GAAP Gross Profit 49.7% 47.4% 46.6% 47.5%
46.5% Wolfson acquisition items - - - - 8,313 Stock compensation expense
- COGS 233 213 (10) 1,151 747 Non-GAAP Gross Margin $ 115,487 $ 165,124
$ 118,965 $ 555,991 $ 434,808 Non-GAAP Gross Profit Effective Tax Rate
Reconciliation 49.8% 47.5% 46.6% 47.6% 47.4% GAAP Tax Expense $
7,101 $ 21,011 $ 8,581 $ 52,359 $ 36,371 GAAP Effective Tax Rate 33.6%
33.7% 28.7% 29.8% 39.7% Adjustments to income taxes 2,658 3,737 (7,230)
16,062 (31,934) Non-GAAP Tax Expense $ 9,759 $ 24,748 $ 1,351 $ 68,421 $
4,437 Non-GAAP Effective Tax Rate 28.2% 31.4% 3.0% 30.2% 2.5% Tax Impact
to EPS Reconciliation GAAP Tax Expense $ 0.11 $ 0.32 $ 0.13 $ 0.79 $
0.56 Adjustments to income taxes 0.04 0.06 (0.11) 0.24 (0.49)
Non-GAAP Tax Expense $ 0.15 $ 0.38 $ 0.02 $ 1.03 $ 0.07
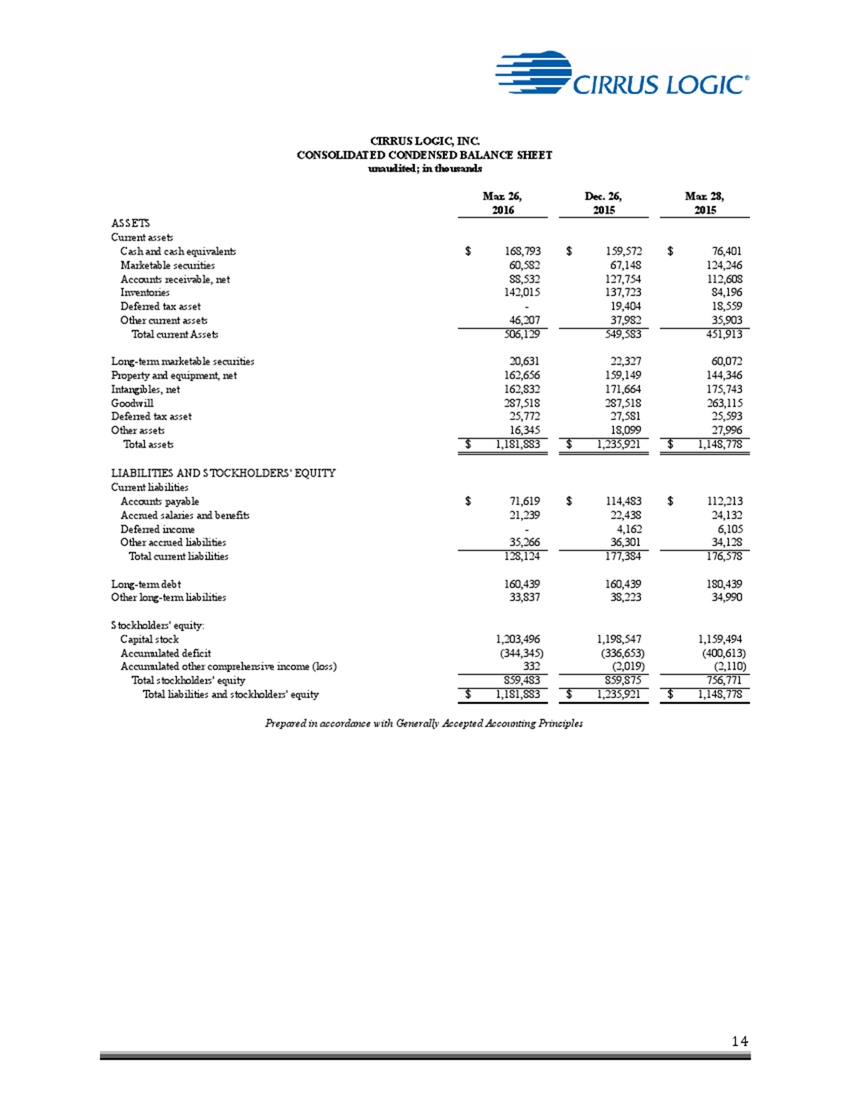
CIRRUS LOGIC, INC. CONSOLIDATED CONDENSED BALANCE SHEET unaudited; in thousands Mar. 26, 2016 Dec. 26, 2015 Mar. 28, 2015 ASSETS Current assets Cash and cash equivalents $ 168,793 $ 159,572 $ 76,401 Marketable securities 60,582 67,148 124,246 Accounts receivable, net 88,532 127,754 12,608 Inventories 142,015 137,723 84,196 Deferred tax asset - 19,404 18,559 Other current assets 46,207 37,982 35,903 Total current Assets 506,129 549,583 451,913 Long-term marketable securities 20,631 22,327 60,072 Property and equipment, net 162,656 159,149 144,346 Intangibles, net 162,832 71,664 175,743 Goodwill 287,518 287,518 263,115 Deferred tax asset 25,772 27,581 25,593 Other assets 16,345 18,099 27,996 Total assets $ 1,181,883 $ 1,235,921 $ 1,148,778 LIABILITIES AND STOCKHOLDERS' EQUITY Current liabilities Accounts payable $ 71,619 $ 114,483 $ 112,213 Accrued salaries and benefits 21,239 22,438 24,132 Deferred income - 4,162 6,105 Other accrued liabilities 35,266 36,301 34,128 Total current liabilities 128,124 177,384 176,578 Long-term debt 160,439 160,439 180,439 Other long-term liabilities 33,837 38,223 34,990 Stockholders' equity: Capital stock 1,203,496 1,198,547 1,159,494 Accumulated deficit (344,345) (336,653) (400,613) Accumulated other comprehensive income (loss) 332 (2,019) (2,110) Total stockholders' equity 859,483 859,875 756,771 Total liabilities and stockholders' equity $ 1,181,883 $ 1,235,921 $ 1,148,778 Prepared in accordance with Generally Accepted Accounting Principles