Attached files
| file | filename |
|---|---|
| 8-K - 8-K - POPULAR, INC. | d185355d8k.htm |
| Exhibit 99.1
|

Investor
Presentation
First Quarter 2016
|
|

Forward Looking Statements
The information contained in this presentation contains forward-looking statements within the meaning of the Private Securities Litigation Reform Act of 1995. These forward-looking statements are based on managements current expectations and are subject to risks and uncertainties that may cause the Corporation’s actual results to differ materially from any future results expressed or implied by such forward-looking statements. Please refer to our Annual Report on Form 10-K for the year ended December 31, 2015 and our other filings with the SEC for a discussion of factors that could impact our future results. Other than to the extent required by applicable law, the Corporation undertakes no obligation to publicly update or revise any forward-looking statement to reflect events or circumstances after the date of such statements.
|
|
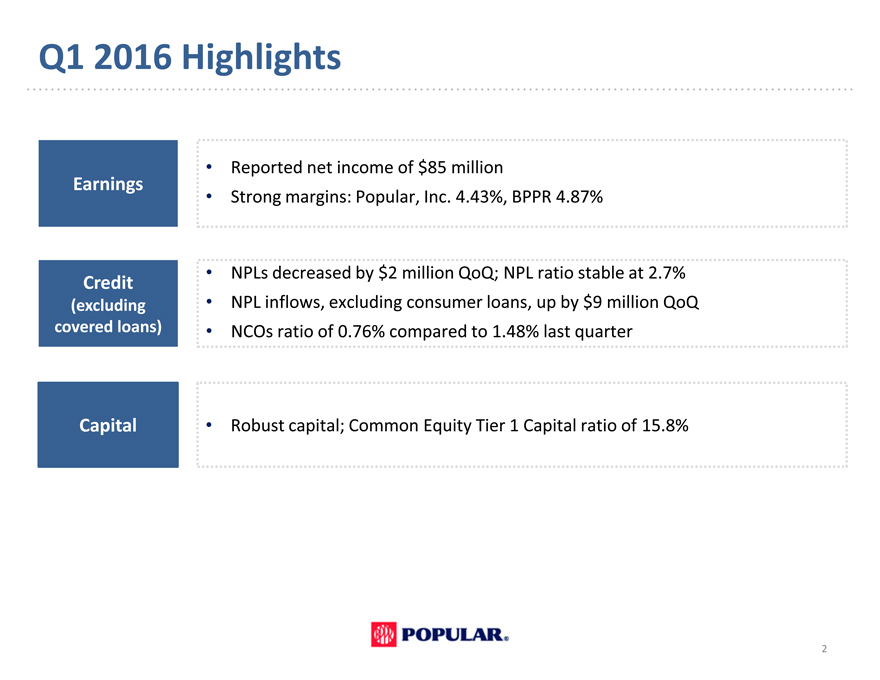
Q1 2016 Highlights
Reported net income of $85 million
Earnings
Strong margins: Popular, Inc. 4.43%, BPPR 4.87%
Credit NPLs decreased by $2 million QoQ; NPL ratio stable at 2.7%
(excluding NPL inflows, excluding consumer loans, up by $9 million QoQ
covered loans) NCOs ratio of 0.76% compared to 1.48% last quarter
Capital Robust capital; Common Equity Tier 1 Capital ratio of 15.8%
2
|
|
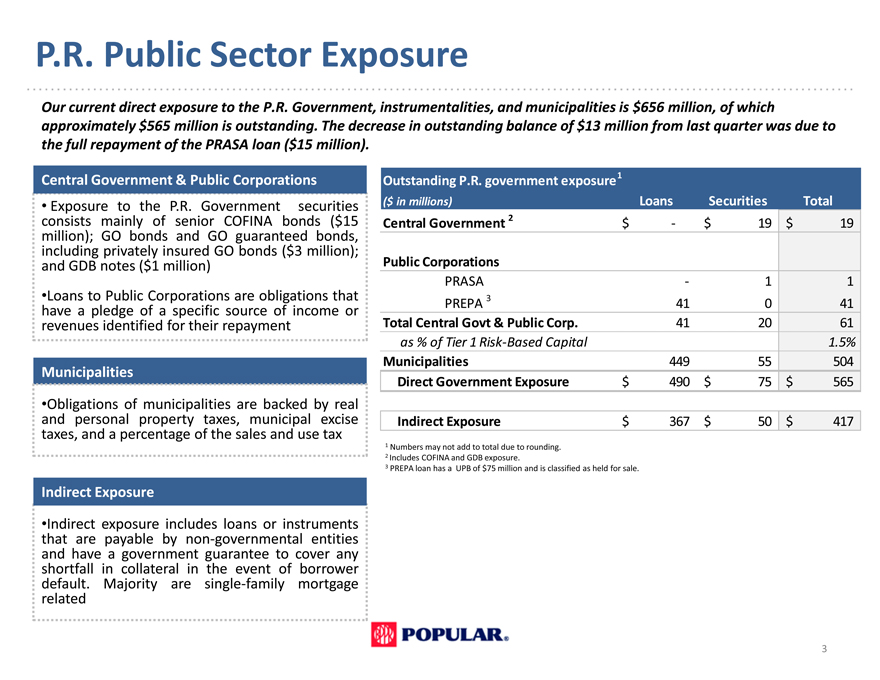
P.R. Public Sector Exposure
Our current direct exposure to the P.R. Government, instrumentalities, and municipalities is $656 million, of which approximately $565 million is outstanding. The decrease in outstanding balance of $13 million from last quarter was due to
the full repayment of the PRASA loan ($15 million).
Central Government & Public Corporations
Exposure to the P.R. Government securities consists mainly of senior COFINA bonds ($15 million); GO bonds and GO guaranteed bonds, including privately insured GO bonds ($3 million); and GDB notes ($1 million)
Loans to Public Corporations are obligations that have a pledge of a specific source of income or revenues identified for their repayment
Municipalities
Obligations of municipalities are backed by real and personal property taxes, municipal excise taxes, and a percentage of the sales and use tax
Indirect Exposure
Indirect exposure includes loans or instruments that are payable by non-governmental entities and have a government guarantee to cover any shortfall in collateral in the event of borrower default. Majority are single-family mortgage related
Outstanding P.R. government exposure 1
($ in millions) Loans Securities Total
Central Government 2 $—$ 19 $ 19
Public Corporations
PRASA—1 1
PREPA 3 41 0 41
Total Central Govt & Public Corp. 41 20 61
as % of Tier 1 Risk-Based Capital 1.5%
Municipalities 449 55 504
Direct Government Exposure $ 490 $ 75 $ 565
Indirect Exposure $ 367 $ 50 $ 417
1 Numbers may not add to total due to rounding. 2 Includes COFINA and GDB exposure.
3 PREPA loan has a UPB of $75 million and is classified as held for sale.
3
|
|
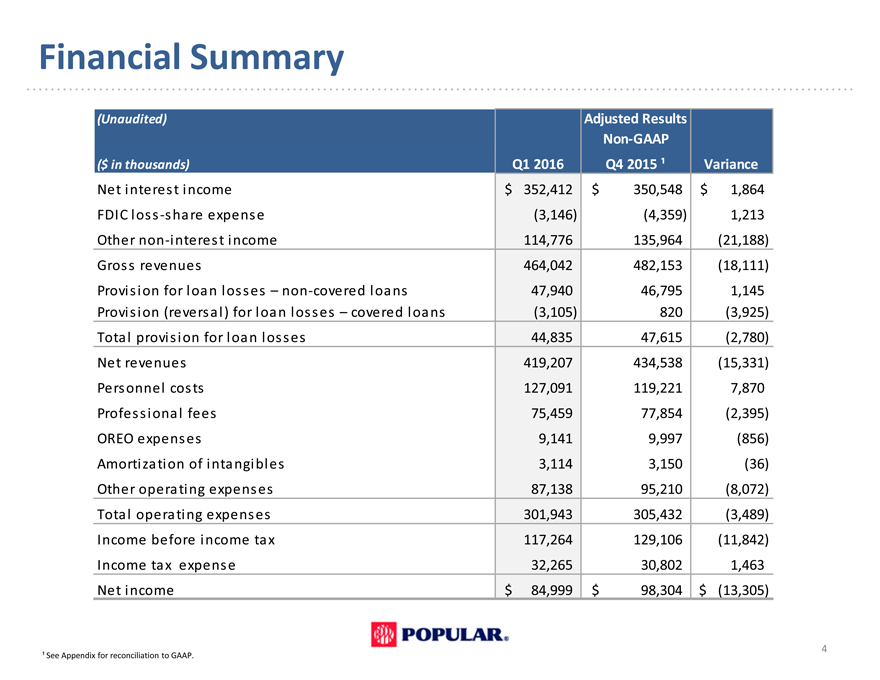
Financial Summary
(Unaudited) Adjusted Results
Non-GAAP
($ in thousands) Q1 2016 Q4 2015 Variance
Net interest income $ 352,412 $ 350,548 $ 1,864
FDIC loss -share expense(3,146)(4,359) 1,213
Other non -interest income 114,776 135,964(21,188)
Gross revenues 464,042 482,153(18,111)
Provision for loan losses non -covered loans 47,940 46,795 1,145
Provision (reversal) for loan losses covered loans(3,105) 820(3,925)
Total provision for loan losses 44,835 47,615(2,780)
Net revenues 419,207 434,538(15,331)
Personnel costs 127,091 119,221 7,870
Professional fees 75,459 77,854(2,395)
OREO expenses 9,141 9,997(856)
Amortization of intangibles 3,114 3,150(36)
Other operating expenses 87,138 95,210(8,072)
Total operating expenses 301,943 305,432(3,489)
Income before income tax 117,264 129,106(11,842)
Income tax expense 32,265 30,802 1,463
Net income $ 84,999 $ 98,304 $(13,305)
See Appendix for reconciliation to GAAP.
4
|
|
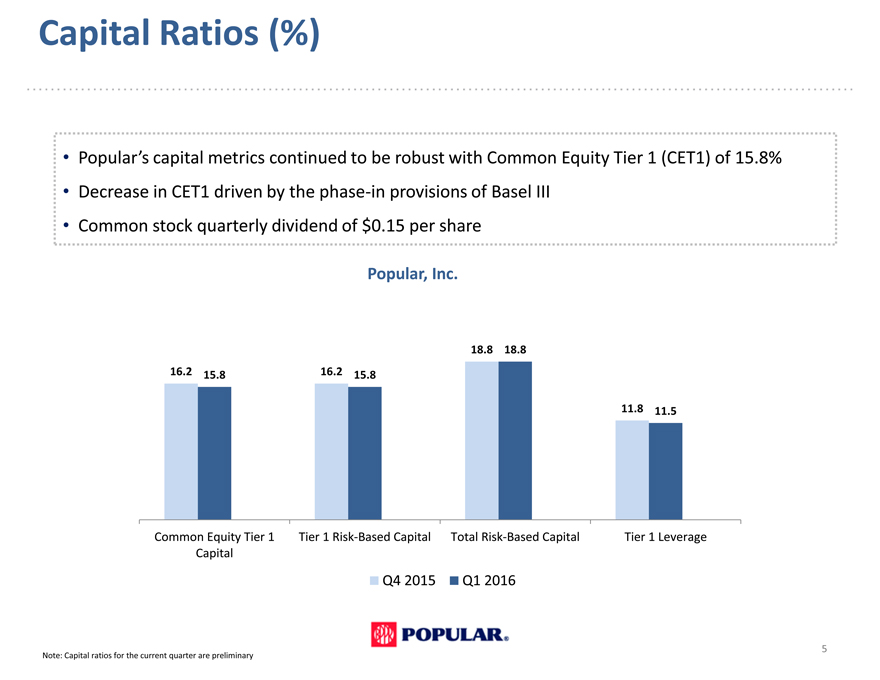
Capital Ratios (%)
Populars capital metrics continued to be robust with Common Equity Tier 1 (CET1) of 15.8%
Decrease in CET1 driven by the phase-in provisions of Basel III
Common stock quarterly dividend of $0.15 per share
Popular, Inc.
18.8 18.8
16.2 15.8 16.2 15.8
11.8 11.5
Common Equity Tier 1 Tier 1 Risk-Based Capital Total Risk-Based Capital Tier 1 Leverage
Capital
Q4 2015 Q1 2016
Note: Capital ratios for the current quarter are preliminary
5
|
|
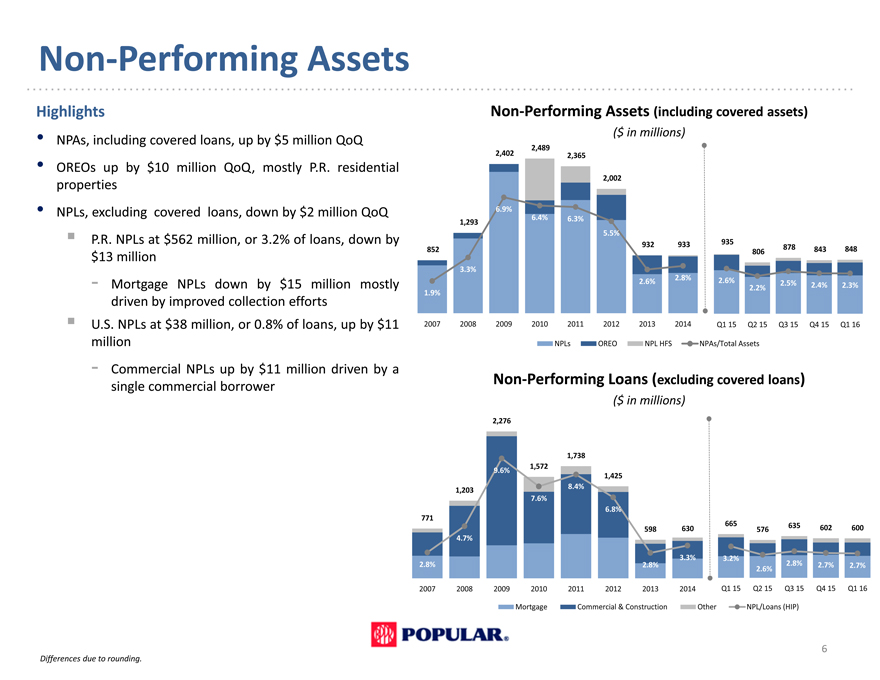
Non-Performing Assets
Highlights
NPAs, including covered loans, up by $5 million QoQ
OREOs up by $10 million QoQ, mostly P.R. residential
properties
NPLs, excluding covered loans, down by $2 million QoQ
P.R. NPLs at $562 million, or 3.2% of loans, down by
$13 million
- Mortgage NPLs down by $15 million mostly
driven by improved collection efforts
U.S. NPLs at $38 million, or 0.8% of loans, up by $11
million
- Commercial NPLs up by $11 million driven by a
single commercial borrower
Non-Performing Assets (including covered assets)
($ in millions)
2,489
2,402 2,365
2,002
6.9%
1,293 6.4% 6.3%
5.5%
935
852 932 933 806 878 843 848
3.3%
2.6% 2.8% 2.6% 2.5% 2.4% 2.3%
2.2%
1.9%
2007 2008 2009 2010 2011 2012 2013 2014 Q1 15 Q2 15 Q3 15 Q4 15 Q1 16
NPLs OREO NPL HFS NPAs/Total Assets
Non-Performing Loans (excluding covered loans)
($ in millions) 14.0%
2,276 12.0%
1,738 10.0%
9.6% 1,572
1,425 8.0%
1,203 8.4%
7.6%
6.8% 6.0%
771
598 630 665 576 635 602 600
4.7% 4.0%
3.3% 3.2%
2.8% 2.8% 2.8% 2.7% 2.7% 2.0%
2.6%
2007 2008 2009 2010 2011 2012 2013 2014 Q1 15 Q2 15 Q3 15 Q4 15 Q1 16 0.0%
Mortgage Commercial & Construction Other NPL/Loans (HIP)
6
Differences due to rounding.
|
|
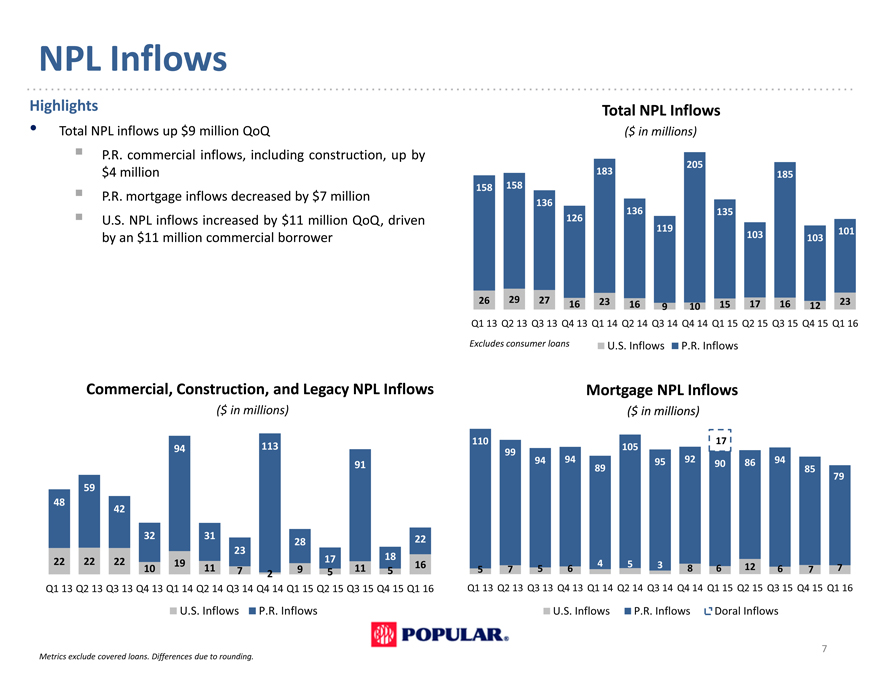
NPL Inflows
Highlights
Total NPL inflows up $9 million QoQ
P.R. commercial inflows, including construction, up by
$4 million
P.R. mortgage inflows decreased by $7 million
U.S. NPL inflows increased by $11 million QoQ
driven by an $11 million commercial borrower
Commercial, Construction, and Legacy NPL Inflows
($ in millions)
94 113
91
59
48
42
32 31 28 22
23
22 22 22 19 17 18 16
10 11 7 2 9 5 11 5
Q1 13 Q2 13 Q3 13 Q4 13 Q1 14 Q2 14 Q3 14 Q4 14 Q1 15 Q2 15 Q3 15 Q4 15 Q1 16 U.S. Inflows P.R. Inflows
Total NPL Inflows
($ in millions)
205
183 185
158 158
136
136 135
126
119 101
103 103
26 29 27 16 23 16 9 10 15 17 16 12 23
Q1 13 Q2 13 Q3 13 Q4 13 Q1 14 Q2 14 Q3 14 Q4 14 Q1 15 Q2 15 Q3 15 Q4 15 Q1 16
Excludes consumer loans U.S. Inflows P.R. Inflows
Mortgage NPL Inflows
($ in millions)
110 17
99 105
94 94 95 92 90 86 94
89 85
79
5 7 5 6 4 5 3 8 6 12 6 7 7
Q1 13 Q2 13 Q3 13 Q4 13 Q1 14 Q2 14 Q3 14 Q4 14 Q1 15 Q2 15 Q3 15 Q4 15 Q1 16
U.S. Inflows P.R. Inflows Doral Inflows
7
Metrics exclude covered loans. Differences due to rounding.
|
|
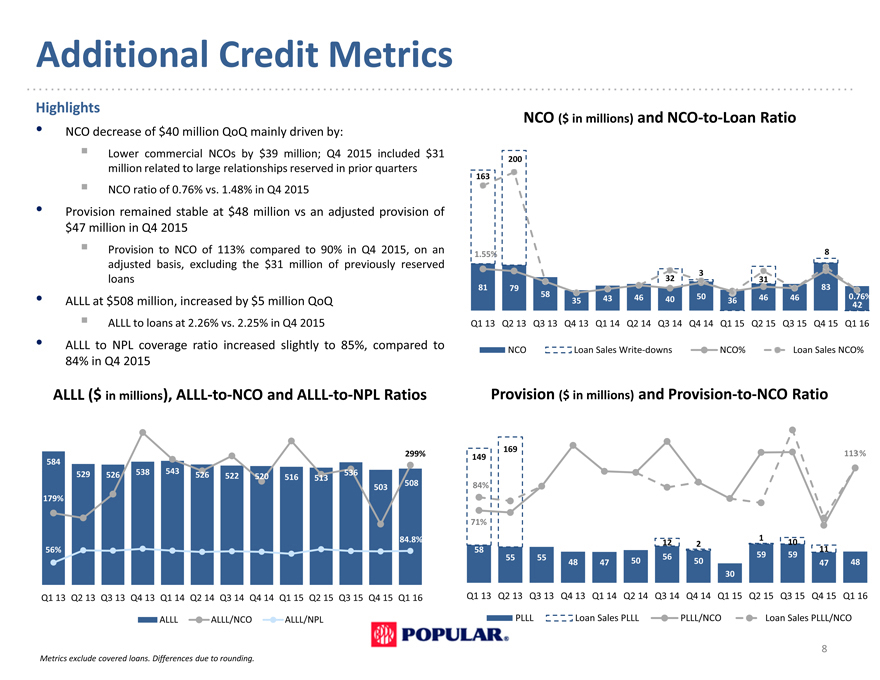
Additional Credit Metrics
Highlights
NCO decrease of $40 million QoQ mainly driven by:
Lower commercial NCOs by $39 million; Q4 2015 included $31
million related to large relationships reserved in prior quarters
NCO ratio of 0.76% vs. 1.48% in Q4 2015
Provision remained stable at $48 million vs an adjusted provision of
$47 million in Q4 2015
Provision to NCO of 113% compared to 90% in Q4 2015, on an
adjusted basis, excluding the $31 million of previously reserved
loans
ALLL at $508 million, increased by $5 million QoQ
ALLL to loans at 2.26% vs. 2.25% in Q4 2015
ALLL to NPL coverage ratio increased slightly to 85%, compared to
84% in Q4 2015
ALLL ($ in millions), ALLL-to-NCO and ALLL-to-NPL Ratios
299%
584
529 526 538 543 526 522 520 516 513 536
503 508
179%
84.8%
56%
Q1 13 Q2 13 Q3 13 Q4 13 Q1 14 Q2 14 Q3 14 Q4 14 Q1 15 Q2 15 Q3 15 Q4 15 Q1 16
ALLL ALLL/NCO ALLL/NPL
NCO ($ in millions) and NCO-to-Loan Ratio
200
163
1.55% 8
3
32 31
81 79 83
58 35 43 46 40 50 36 46 46 0.76%
42
Q1 13 Q2 13 Q3 13 Q4 13 Q1 14 Q2 14 Q3 14 Q4 14 Q1 15 Q2 15 Q3 15 Q4 15 Q1 16
NCO Loan Sales Write-downs NCO% Loan Sales NCO%
Provision ($ in millions) and Provision-to-NCO Ratio
169
149 113%
84%
71%
1
12 2 10
58 11
55 55 56 59 59
48 47 50 50 47 48
30
Q1 13 Q2 13 Q3 13 Q4 13 Q1 14 Q2 14 Q3 14 Q4 14 Q1 15 Q2 15 Q3 15 Q4 15 Q1 16
PLLL Loan Sales PLLL PLLL/NCO Loan Sales PLLL/NCO
8
Metrics exclude covered loans. Differences due to rounding.
|
|
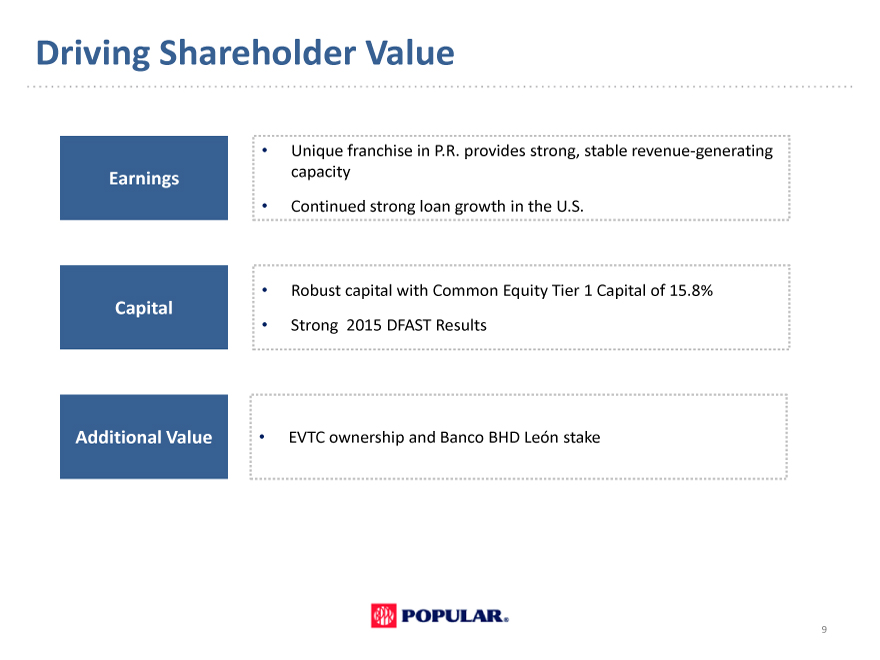
Driving Shareholder Value
Unique franchise in P.R. provides strong, stable revenue-generating
Earnings capacity
Continued strong loan growth in the U.S.
Robust capital with Common Equity Tier 1 Capital of 15.8%
Capital
Strong 2015 DFAST Results
Additional Value EVTC ownership and Banco BHD León stake
9
|
|

Investor
Presentation
First Quarter
2016
APPENDIX
|
|
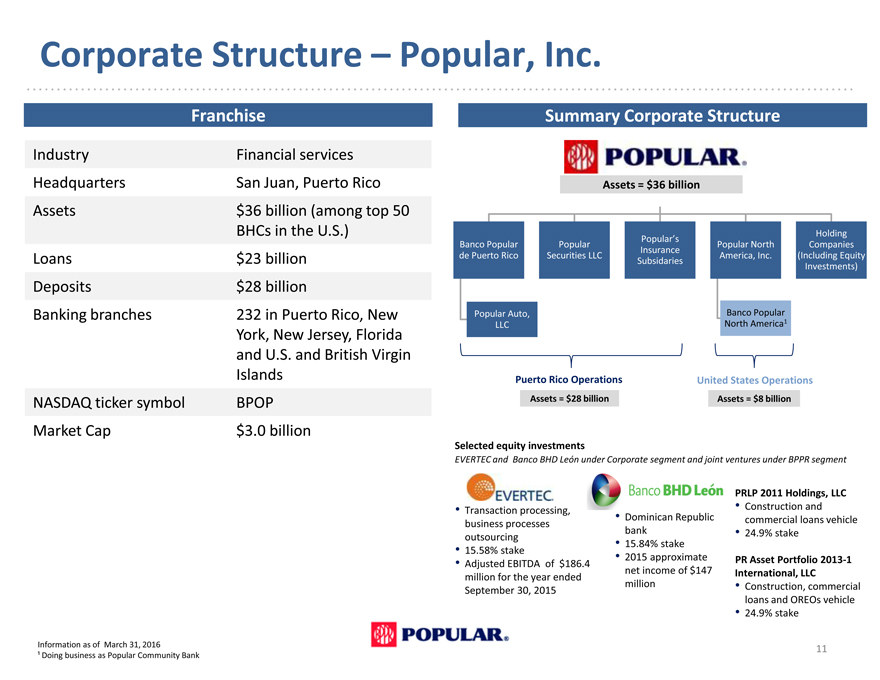
Who We Are Popular, Inc.
Corporate Structure Popular, Inc.
Franchise
Industry Financial services
Headquarters San Juan, Puerto Rico
Assets $36 billion (among top 50
BHCs in the U.S.)
Loans $23 billion
Deposits $28 billion
Banking branches 232 in Puerto Rico, New
York, New Jersey, Florida
and U.S. and British Virgin
Islands
NASDAQ ticker symbol BPOP
Market Cap $3.0 billion
Information as of March 31, 2016
Doing business as Popular Community Bank
Summary Corporate Structure
Assets = $36 billion
Populars Holding
Banco Popular Popular Popular North Companies
Insurance
de Puerto Rico Securities LLC America, Inc.(Including Equity
Subsidaries Investments)
Popular Auto, Banco Popular
LLC North America1
Puerto Rico Operations
Assets = $28 billion
United States Operations
Assets = $8 billion
Selected equity investments
EVERTEC and Banco BHD Len under Corporate segment and joint ventures under BPPR segment
[Graphic Appears Here]
Transaction processing,
business processes
outsourcing
15.58% stake
Adjusted EBITDA of $186.4
million for the year ended
September 30, 2015
[Graphic Appears Here]
Dominican Republic
bank
15.84% stake
2015 approximate
net income of $147
million
PRLP 2011 Holdings, LLC
Construction and
commercial loans vehicle
24.9% stake
PR Asset Portfolio 2013-1 International, LLC
Construction, commercial
loans and OREOs vehicle
24.9% stake
11
|
|
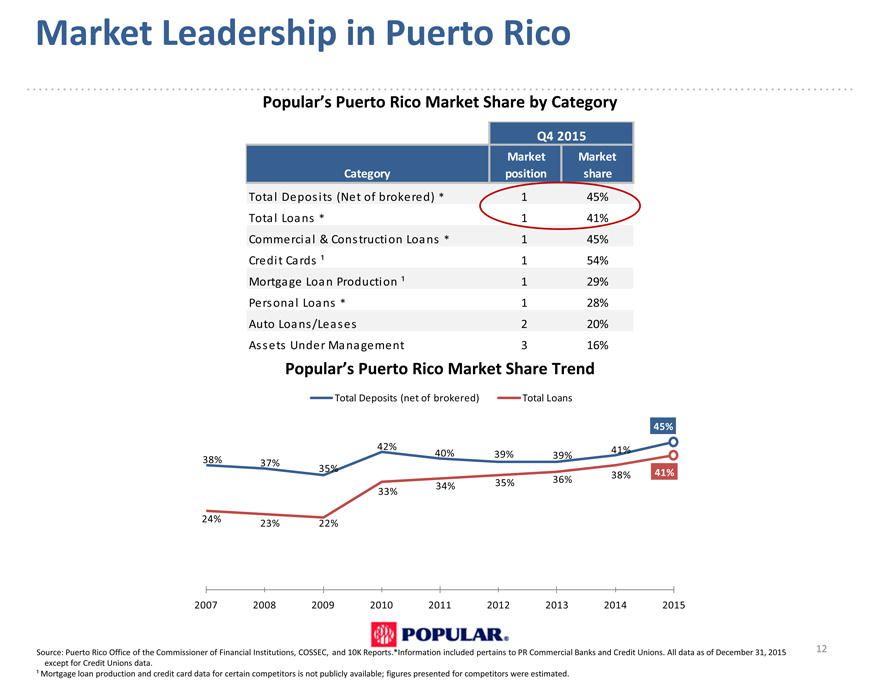
Market Leadership in Puerto Rico
Populars Puerto Rico Market Share by Category
Q4 2015
Market Market
Category position share
Total Deposits (Net of brokered) * 1 45%
Total Loans * 1 41%
Commercial & Construction Loans * 1 45%
Credit Cards 1 54%
Mortgage Loan Production 1 29%
Personal Loans * 1 28%
Auto Loans/Leases 2 20%
Assets Under Management 3 16%
Populars Puerto Rico Market Share Trend
Total Deposits (net of brokered) Total Loans
45%
42% 41%
40% 39% 39%
38% 37%
35% 38% 41%
36%
33% 34% 35%
24% 23% 22%
2007 2008 2009 2010 2011 2012 2013 2014 2015
Source: Puerto Rico Office of the Commissioner of Financial Institutions, COSSEC, and 10K Reports.*Information included pertains to PR Commercial Banks and Credit Unions. All data as of December 31, 2015 12
except for Credit Unions data.
Mortgage loan production and credit card data for certain competitors is not publicly available; figures presented for competitors were estimated.
|
|
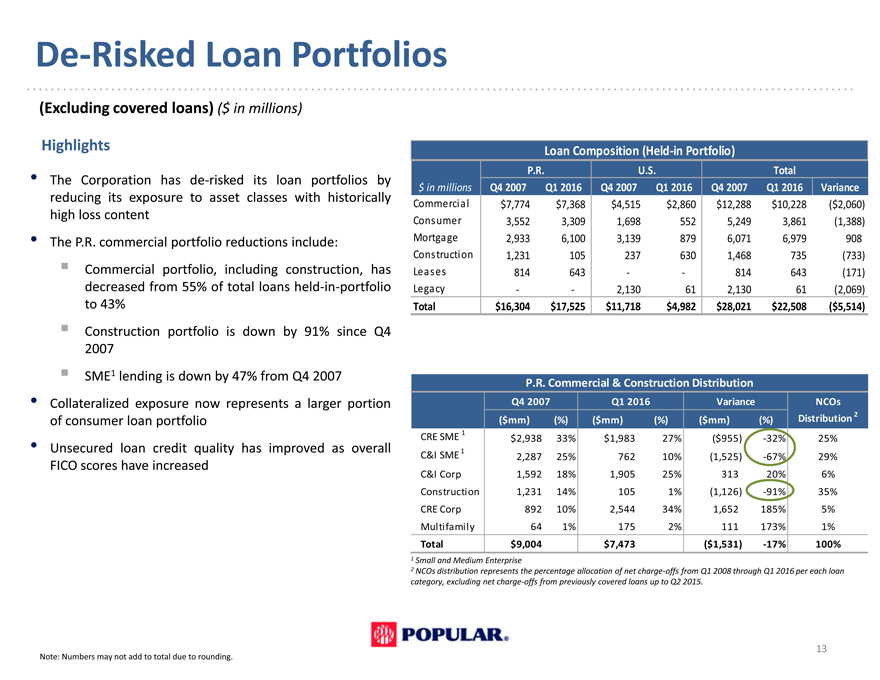
De-Risked Loan Portfolios
(Excluding covered loans) ($ in millions)
Highlights
The Corporation has de-risked its loan portfolios by
reducing its exposure to asset classes with historically
high loss content
The P.R. commercial portfolio reductions include:
Commercial portfolio, including construction, has
decreased from 55% of total loans held-in-portfolio
to 43%
Construction portfolio is down by 91% since Q4
2007
SME1 lending is down by 47% from Q4 2007
Collateralized exposure now represents a larger portion
of consumer loan portfolio
Unsecured loan credit quality has improved as overall
FICO scores have increased
Note: Numbers may not add to total due to rounding.
Loan Composition (Held-in Portfolio)
P.R. U.S. Total
$ in millions Q4 2007 Q1 2016 Q4 2007 Q1 2016 Q4 2007 Q1 2016 Variance
Commercial $7,774 $7,368 $4,515 $2,860 $ 12,288 $ 10,228($2,060)
Consumer 3,552 3,309 1,698 552 5,249 3,861(1,388)
Mortgage 2,933 6,100 3,139 879 6,071 6,979 908
Construction 1,231 105 237 630 1,468 735(733)
Leases 814 643 — 814 643(171)
Legacy — 2,130 61 2,130 61(2,069)
Total $16,304 $17,525 $11,718 $4,982 $ 28,021 $ 22,508($5,514)
P.R. Commercial & Construction Distribution
Q4 2007 Q1 2016 Variance NCOs
($mm)(%)($mm)(%)($mm)(%) Distribution 2
CRE SME 1 $2,938 33% $1,983 27%($955) -32% 25%
C&I SME 1 2,287 25% 762 10%(1,525) -67% 29%
C&I Corp 1,592 18% 1,905 25% 313 20% 6%
Construction 1,231 14% 105 1%(1,126) -91% 35%
CRE Corp 892 10% 2,544 34% 1,652 185% 5%
Multifamily 64 1% 175 2% 111 173% 1%
Total $9,004 $7,473($1,531) -17% 100%
1 Small and Medium Enterprise
2 NCOs distribution represents the percentage allocation of net charge-offs from Q1 2008 through Q1 2016 per each loan category, excluding net charge-offs from previously covered loans up to Q2 2015.
13
|
|
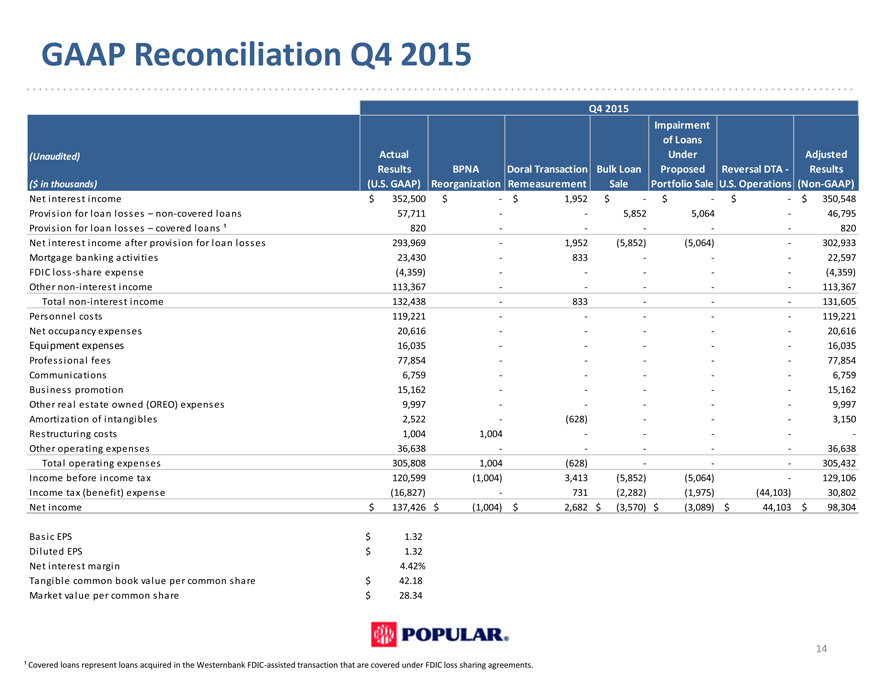
GAAP Reconciliation Q4 2015
Q4 2015
Impairment
of Loans
(Unaudited) Actual Under Adjusted
Results BPNA Doral Transaction Bulk Loan Proposed Reversal DTA—Results
($ in thousands)(U.S. GAAP) Reorganization Remeasurement Sale Portfolio Sale U.S. Operations (Non-GAAP)
Net interest income $ 352,500 $—$ 1,952 $—$—$—$ 350,548
Provision for loan losses non-covered loans 57,711 — 5,852 5,064—46,795
Provision for loan losses covered loans 820 — ——820
Net interest income after provision for loan losses 293,969—1,952(5,852)(5,064)—302,933
Mortgage banking activities 23,430—833 ——22,597
FDIC loss -share expense(4,359) — — -(4,359)
Other non-interest income 113,367 — ——113,367
Total non-interest income 132,438—833 ——131,605
Personnel costs 119,221 — ——119,221
Net occupancy expenses 20,616 — ——20,616
Equipment expenses 16,035 — ——16,035
Professional fees 77,854 — ——77,854
Communications 6,759 — ——6,759
Business promotion 15,162 — ——15,162
Other real estate owned (OREO) expenses 9,997 — ——9,997
Amortization of intangibles 2,522 -(628) ——3,150
Restructuring costs 1,004 1,004 — — -
Other operating expenses 36,638 — ——36,638
Total operating expenses 305,808 1,004(628) ——305,432
Income before income tax 120,599(1,004) 3,413(5,852)(5,064)—129,106
Income tax (benefit) expense(16,827)—731(2,282)(1,975)(44,103) 30,802
Net income $ 137,426 $(1,004) $ 2,682 $(3,570) $(3,089) $ 44,103 $ 98,304
Basic EPS $ 1.32
Diluted EPS $ 1.32
Net interest margin 4.42%
Tangible common book value per common share $ 42.18
Market value per common share $ 28.34
14
Covered loans represent loans acquired in the Westernbank FDIC-assisted transaction that are covered under FDIC loss sharing agreements.
|
|
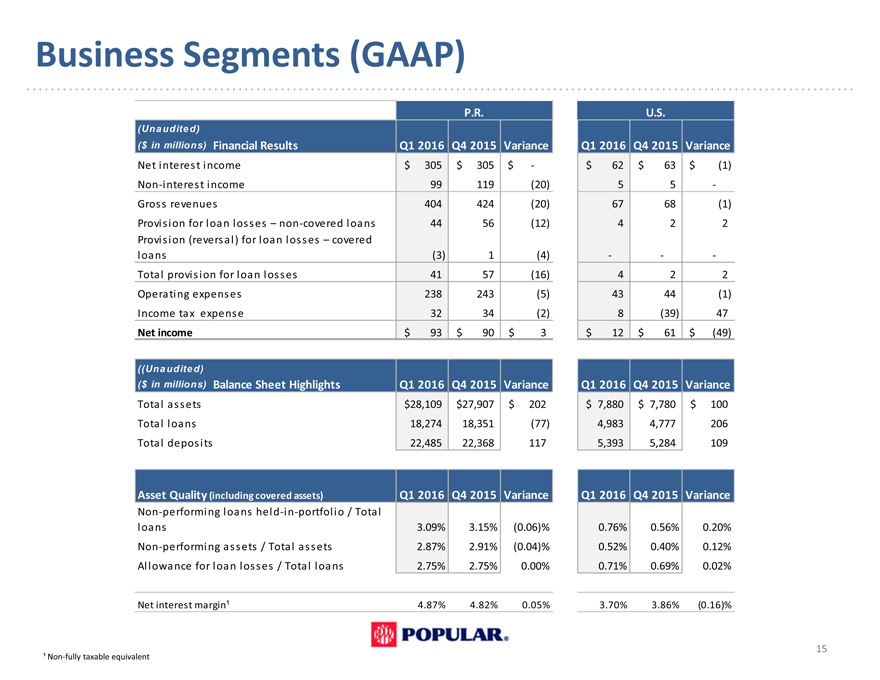
Business Segments (GAAP)
P.R. U.S.
(Una udite d)
($ in millions) Financial Results Q1 2016 Q4 2015 Variance Q1 2016 Q4 2015 Variance
Net interest income $ 305 $ 305 $—$ 62 $ 63 $(1)
Non-interest income 99 119(20) 5 5 -
Gross revenues 404 424(20) 67 68(1)
Provision for loan losses non-covered loans 44 56(12) 4 2 2
Provision (reversal) for loan losses covered
loans(3) 1(4) — -
Total provision for loan losses 41 57(16) 4 2 2
Operating expenses 238 243(5) 43 44(1)
Income tax expense 32 34(2) 8(39) 47
Net income $ 93 $ 90 $ 3 $ 12 $ 61 $(49)
((Una udite d)
($ in millions) Balance Sheet Highlights Q1 2016 Q4 2015 Variance Q1 2016 Q4 2015 Variance
Total assets $28,109 $27,907 $ 202 $ 7,880 $ 7,780 $ 100
Total loans 18,274 18,351(77) 4,983 4,777 206
Total deposits 22,485 22,368 117 5,393 5,284 109
Asset Quality (including covered assets) Q1 2016 Q4 2015 Variance Q1 2016 Q4 2015 Variance
Non-performing loans held-in-portfolio / Total
loans 3.09% 3.15%(0.06)% 0.76% 0.56% 0.20%
Non-performing assets / Total assets 2.87% 2.91%(0.04)% 0.52% 0.40% 0.12%
Allowance for loan losses / Total loans 2.75% 2.75% 0.00% 0.71% 0.69% 0.02%
Net interest margin 4.87% 4.82% 0.05% 3.70% 3.86%(0.16)%
15
Non-fully taxable equivalent
|
|
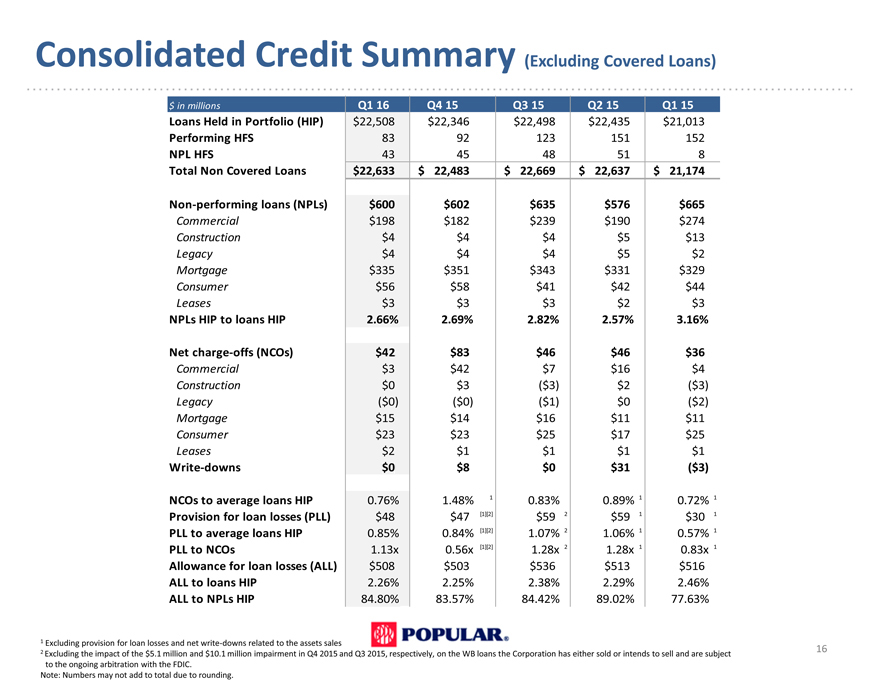
Consolidated Credit Summary (Excluding Covered Loans)
$ in millions Q1 16 Q4 15 Q3 15 Q2 15 Q1 15
Loans Held in Portfolio (HIP) $22,508 $22,346 $22,498 $22,435 $21,013
Performing HFS 83 92 123 151 152
NPL HFS 43 45 48 51 8
Total Non Covered Loans $22,633 $ 22,483 $ 22,669 $ 22,637 $ 21,174
Non-performing loans (NPLs) $600 $602 $635 $576 $665
Commercial $198 $182 $239 $190 $274
Construction $4 $4 $4 $5 $13
Legacy $4 $4 $4 $5 $2
Mortgage $335 $351 $343 $331 $329
Consumer $56 $58 $41 $42 $44
Leases $3 $3 $3 $2 $3
NPLs HIP to loans HIP 2.66% 2.69% 2.82% 2.57% 3.16%
Net charge-offs (NCOs) $42 $83 $46 $46 $36
Commercial $3 $42 $7 $16 $4
Construction $0 $3($3) $2($3)
Legacy($0)($0)($1) $0($2)
Mortgage $15 $14 $16 $11 $11
Consumer $23 $23 $25 $17 $25
Leases $2 $1 $1 $1 $1
Write-downs $0 $8 $0 $31($3)
NCOs to average loans HIP 0.76% 1.48% 1 0.83% 0.89% 1 0.72% 1
Provision for loan losses (PLL) $48 $47 [1][2] $59 2 $59 1 $30 1
PLL to average loans HIP 0.85% 0.84% [1][2] 1.07% 2 1.06% 1 0.57% 1
PLL to NCOs 1.13x 0.56x [1][2] 1.28x 2 1.28x 1 0.83x 1
Allowance for loan losses (ALL) $508 $503 $536 $513 $516
ALL to loans HIP 2.26% 2.25% 2.38% 2.29% 2.46%
ALL to NPLs HIP 84.80% 83.57% 84.42% 89.02% 77.63%
1 Excluding provision for loan losses and net write-downs related to the assets sales
2 Excluding the impact of the $5.1 million and $10.1 million impairment in Q4 2015 and Q3 2015, respectively, on the WB loans the Corporation has either sold or intends to sell and are subject 16
to the ongoing arbitration with the FDIC.
Note: Numbers may not add to total due to rounding.
|
|
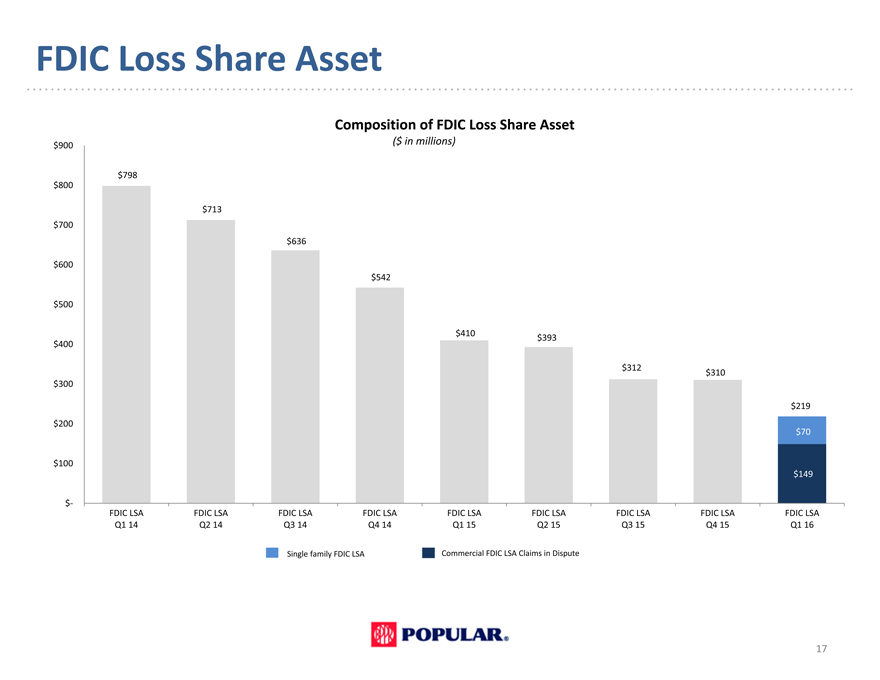
FDIC Loss Share Asset
Composition of FDIC Loss Share Asset
$900($ in millions)
$798
$800
$713
$700
$636
$600
$542
$500
$410 $393
$400
$312 $310
$300
$219
$200
$70
$100
$149
$-
FDIC LSA FDIC LSA FDIC LSA FDIC LSA FDIC LSA FDIC LSA FDIC LSA FDIC LSA FDIC LSA
Q1 14 Q2 14 Q3 14 Q4 14 Q1 15 Q2 15 Q3 15 Q4 15 Q1 16
Single family FDIC LSA Commercial FDIC LSA Claims in Dispute
17
|
|
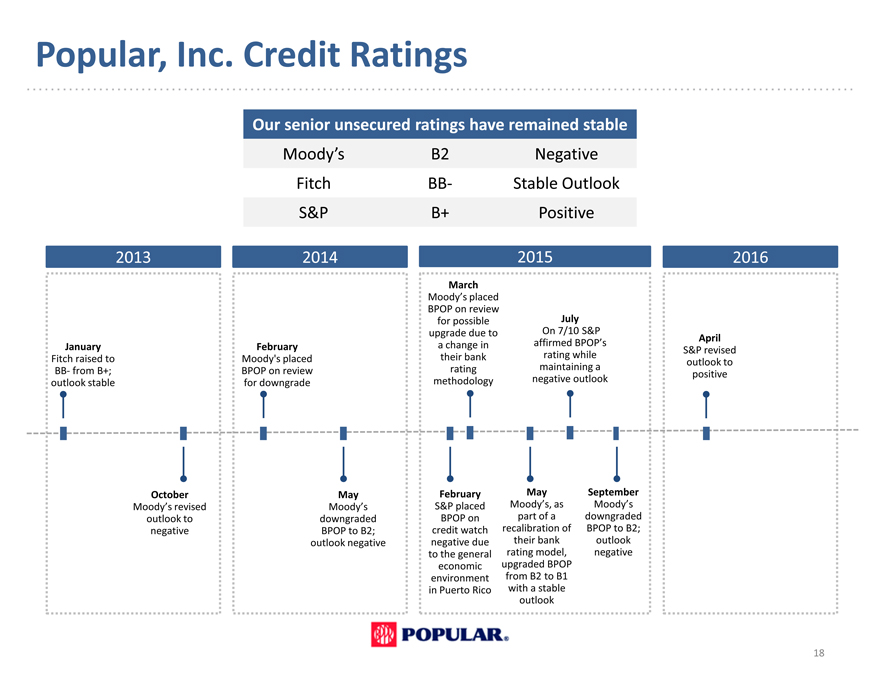
Popular, Inc. Credit Ratings
Our senior unsecured ratings have remained stable
Moodys B2 Negative
Fitch BB- Stable Outlook
S&P B+ Positive
2013 2014 2015 2016
March
Moodys placed
BPOP on review
for possible July
upgrade due to On 7/10 S&P
January February a change in affirmed BPOPs April
S&P revised
Fitch raised to Moody’s placed their bank rating while outlook to
BB- from B+; BPOP on review rating maintaining a
positive
outlook stable for downgrade methodology negative outlook
October May February May September
Moodys revised Moodys S&P placed Moodys, as Moodys
outlook to downgraded BPOP on part of a downgraded
negative BPOP to B2; credit watch recalibration of BPOP to B2;
outlook negative negative due their bank outlook
to the general rating model, negative
economic upgraded BPOP
environment from B2 to B1
in Puerto Rico with a stable
outlook
18
|
|

Investor
Presentation
First Quarter 2016