Attached files
| file | filename |
|---|---|
| 8-K - 8-K - PARK NATIONAL CORP /OH/ | prk2016-04x258xkslideprese.htm |

ANNUAL MEETING OF SHAREHOLDERS April 25, 2016 1

Safe Harbor Statement Park cautions that any forward-looking statements contained in this presentation or made by management of Park are provided to assist in the understanding of anticipated future financial performance. Forward-looking statements provide current expectations or forecasts of future events and are not guarantees of future performance. The forward-looking statements are based on management’s expectations and are subject to a number of risks and uncertainties. Although management believes that the expectations reflected in such forward-looking statements are reasonable, actual results may differ materially from those expressed or implied in such statements. Risks and uncertainties that could cause actual results to differ materially include, without limitation: Park's ability to execute our business plan successfully and within the expected timeframe; general economic and financial market conditions, specifically in the real estate markets and the credit markets, either nationally or in the states in which Park and our subsidiaries do business, may experience a slowing or reversal of the recent economic expansion in addition to continuing residual effects of recessionary conditions and an uneven spread of positive impacts of recovery on the economy and our counterparties, including adverse impacts on the demand for loan, deposit and other financial services, delinquencies, defaults and counterparties’ ability to meet credit and other obligations; changes in interest rates and prices may adversely impact the value of securities, loans, deposits and other financial instruments and the interest rate sensitivity of our consolidated balance sheet as well as reduce interest margins; changes in consumer spending, borrowing and saving habits, whether due to changing business and economic conditions, legislative and regulatory initiatives, or other factors; changes in unemployment; changes in customers', suppliers' and other counterparties' performance and creditworthiness; asset/liability repricing risks and liquidity risks; our liquidity requirements could be adversely affected by changes to regulations governing bank and bank holding company capital and liquidity standards as well as by changes in our assets and liabilities; competitive factors among financial services organizations could increase significantly, including product and pricing pressures, changes to third- party relationships and our ability to attract, develop and retain qualified bank professionals; clients could pursue alternatives to bank deposits, causing us to lose a relatively inexpensive source of funding; the nature, timing and effect of changes in banking regulations or other regulatory or legislative requirements affecting the respective businesses of Park and our subsidiaries, including major reform of the regulatory oversight structure of the financial services industry and changes in laws and regulations concerning taxes, pensions, bankruptcy, consumer protection, accounting, banking, securities and other aspects of the financial services industry, specifically the reforms provided for in the Dodd-Frank Wall Street Reform and Consumer Protection Act of 2010 (the “Dodd-Frank Act”), as well as regulations already adopted and which may be adopted in the future by the relevant regulatory agencies, including the Consumer Financial Protection Bureau, to implement the Dodd-Frank Act's provisions, the Budget Control Act of 2011, the American Taxpayer Relief Act of 2012 and the Basel III regulatory capital reforms; the effect of changes in accounting policies and practices, as may be adopted by the Financial Accounting Standards Board, the SEC, the Public Company Accounting Oversight Board and other regulatory agencies, and the accuracy of our assumptions and estimates used to prepare our financial statements; the effect of trade, monetary, fiscal and other governmental policies of the U.S. federal government, including money supply and interest rate policies of the Federal Reserve; disruption in the liquidity and other functioning of U.S. financial markets; the impact on financial markets and the economy of any changes in the credit ratings of the U.S. Treasury obligations and other U.S. government-backed debt, as well as issues surrounding the levels of U.S., European and Asian government debt and concerns regarding the creditworthiness of certain sovereign governments, supranationals and financial institutions in Europe and Asia; our litigation and regulatory compliance exposure, including any adverse developments in legal proceedings or other claims and unfavorable resolution of regulatory and other governmental examinations or other inquiries; the adequacy of our risk management program; the ability to secure confidential information and deliver products and services through the use of computer systems and telecommunications networks; a failure in or breach of our operational or security systems or infrastructure, or those of our third-party vendors and other service providers, including as a result of cyber attacks; demand for loans in the respective market areas served by Park and our subsidiaries; and other risk factors relating to the banking industry as detailed from time to time in Park's reports filed with the SEC including those described in "Item 1A. Risk Factors" of Part I of Park's Annual Report on Form 10-K for the fiscal year ended December 31, 2015. Park does not undertake, and specifically disclaims any obligation, to publicly release the results of any revisions that may be made to update any forward-looking statement to reflect the events or circumstances after the date on which the forward-looking statement was made, or reflect the occurrence of unanticipated events, except to the extent required by law. 2
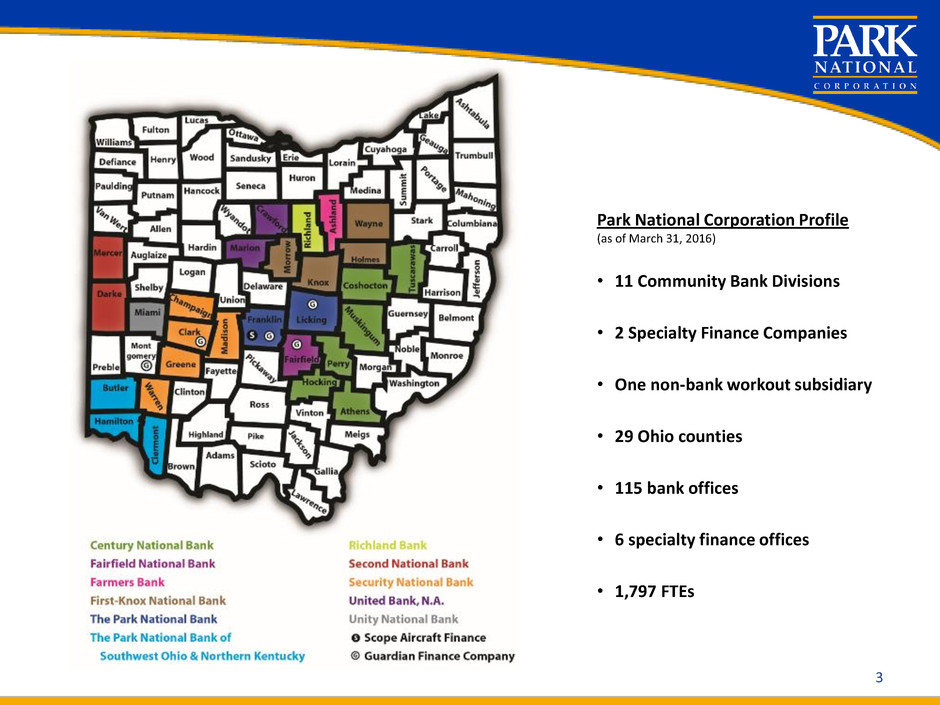
Park National Corporation Profile (as of March 31, 2016) • 11 Community Bank Divisions • 2 Specialty Finance Companies • One non-bank workout subsidiary • 29 Ohio counties • 115 bank offices • 6 specialty finance offices • 1,797 FTEs 3
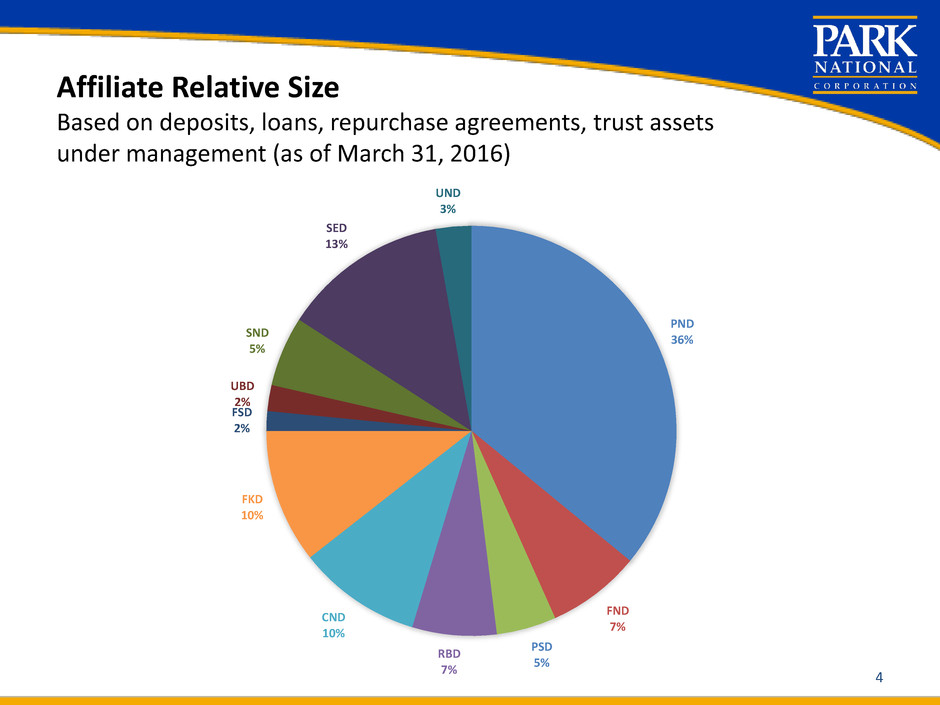
Affiliate Relative Size Based on deposits, loans, repurchase agreements, trust assets under management (as of March 31, 2016) PND 36% FND 7% PSD 5% RBD 7% CND 10% FKD 10% FSD 2% UBD 2% SND 5% SED 13% UND 3% 4

Park National Corporation Consolidated Statements of Income Source: Company Filings 5 (in thousands) Dec. 31, 2014 Dec. 31, 2015 Mar. 31, 2015 Mar. 31, 2016 Net interest income $ 225,044 $ 227,632 $ 55,535 $ 59,819 Provision for (recovery of) loan losses (7,333) 4,990 1,632 910 Net interest income after provision for (recovery of) loan losses $ 232,377 $ 222,642 $ 53,903 $ 58,909 Other income 75,549 77,551 18,873 17,389 Other expense 187,510 186,614 45,720 49,899 Income before income taxes $ 120,416 $ 113,579 $ 27,056 $ 26,399 Income taxes 36,459 32,567 8,012 7,713 Net income $ 83,957 $ 81,012 $ 19,044 $ 18,686 Note: Prior period results were updated to reflect the January 1, 2015 adoption of Accounting Standards Update (ASU) 2014-01, Accounting for Investments in Qualified Affordable Housing Projects. The adoption of this ASU required retrospective application.

Park National Corporation Consolidated Balance Sheets Source: Company Filings 6 (in millions) Dec. 31, 2014 Dec. 31, 2015 Mar. 31, 2016 Cash & cash equivalents $ 238 $ 149 $ 318 Investment securities 1,501 1,644 1,602 Loans 4,829 5,068 5,062 Allowance for loan losses (54) (56) (57) Other assets 487 506 503 Total assets $ 7,001 $ 7,311 $ 7,428 Noninterest bearing deposits 1,269 1,404 1,361 Interest bearing deposits 3,859 3,944 4,246 Total deposits 5,128 5,348 5,607 Total borrowings 1,108 1,177 1,004 Other liabilities 68 73 87 Total shareholders’ equity 697 713 730 Total liabilities & shareholders’ equity $ 7,001 $ 7,311 $ 7,428

The Park National Bank Consolidated Statements of Income Source: Company Filings 7 (in thousands) Dec. 31, 2014 Dec. 31, 2015 Mar. 31, 2015 Mar. 31, 2016 Net interest income $ 218,641 $ 220,879 $ 53,821 $ 57,155 Provision for loan losses 3,517 7,665 2,022 1,533 Net interest income after provision for loan losses $ 215,124 $ 213,214 $ 51,799 $ 55,622 Other income 69,384 75,188 18,012 17,223 Other expense 163,641 167,476 41,932 41,360 Income before income taxes $ 120,867 $ 120,926 $ 27,879 $ 31,485 Income taxes 37,960 36,581 8,720 9,741 Net income $ 82,907 $ 84,345 $ 19,159 $ 21,744 Note: Prior period results were updated to reflect the January 1, 2015 adoption of Accounting Standards Update (ASU) 2014-01, Accounting for Investments in Qualified Affordable Housing Projects. The adoption of this ASU required retrospective application.

The Park National Bank Consolidated Balance Sheets Source: Company Filings 8 (in millions) Dec. 31, 2014 Dec. 31, 2015 Mar. 31, 2016 Cash & cash equivalents $ 237 $ 148 $ 316 Investment securities 1,498 1,642 1,600 Loans 4,782 5,029 5,024 Allowance for loan losses (52) (55) (55) Other assets 445 466 462 Total assets $ 6,910 $ 7,230 $ 7,347 Noninterest bearing deposits 1,370 1,508 1,464 Interest bearing deposits 3,853 3,939 4,242 Total deposits 5,223 5,447 5,706 Total borrowings 1,089 1,157 984 Other liabilities 56 61 74 Total shareholders’ equity 542 565 583 Total liabilities & shareholders’ equity $ 6,910 $ 7,230 $ 7,347

PRK Comparison to Peers Ratios at December 31 for each year Source: SNL data of $3 billion to $10 billion bank holding companies (“Peer Group”) PRK Price to Book Value % Peer Group Price to Book Value % PRK Price to Tangible Book Value % Peer Group Price to Tangible Book Value % PRK Price to Earnings Peer Group Price to Earnings PRK Dividend Yield % Peer Group Dividend Yield % 2015 195% 138% 216% 174% 17.2 15.9 4.2% 2.2% 2014 196% 133% 218% 169% 16.2 16.3 4.3% 2.0% 2013 202% 136% 227% 178% 17.1 17.9 4.4% 1.8% 2012 154% 118% 173% 146% 13.3 13.8 5.8% 2.8% 2011 156% 109% 176% 135% 13.1 14.7 5.8% 2.4% 2010 177% 127% 202% 155% 21.1 17.8 5.2% 2.1% 2009 141% 105% 163% 140% 12.2 16.9 6.4% 2.5% 2008 183% 135% 217% 211% 14.6 15.7 5.3% 2.9% 2007 155% 138% 207% 206% 11.9 13.2 5.8% 3.3% 2006 242% 206% 280% 291% 14.7 17.1 3.8% 2.3% 9

10 50 55 60 65 70 75 12/31/2011 12/31/2012 12/31/2013 12/31/2014 12/31/2015 Pe rce n t (% ) Efficiency Ratio PRK Peer Group PRK vs. Peers Source: BHCPR; $3 billion to $10 billion bank holding companies peer group.

Total Return Performance Park National Corporation The total return performance graph depicts the yearly change in Park’s cumulative total shareholder return over the five-year period from December 31, 2010 to December 31, 2015. Calculations include the reinvestment of dividends and are indexed to the base year’s measurement point (closing price on last trading day before the beginning of Parks’ fifth preceding fiscal year). Source: SNL 11 70 85 100 115 130 145 160 175 12/31/10 12/31/11 12/31/12 12/31/13 12/31/14 12/31/15 In d e x V a lu e Total Return Performance Park National Corporation NYSE MKT Composite NASDAQ Bank Stocks SNL Financial Bank and Thrift
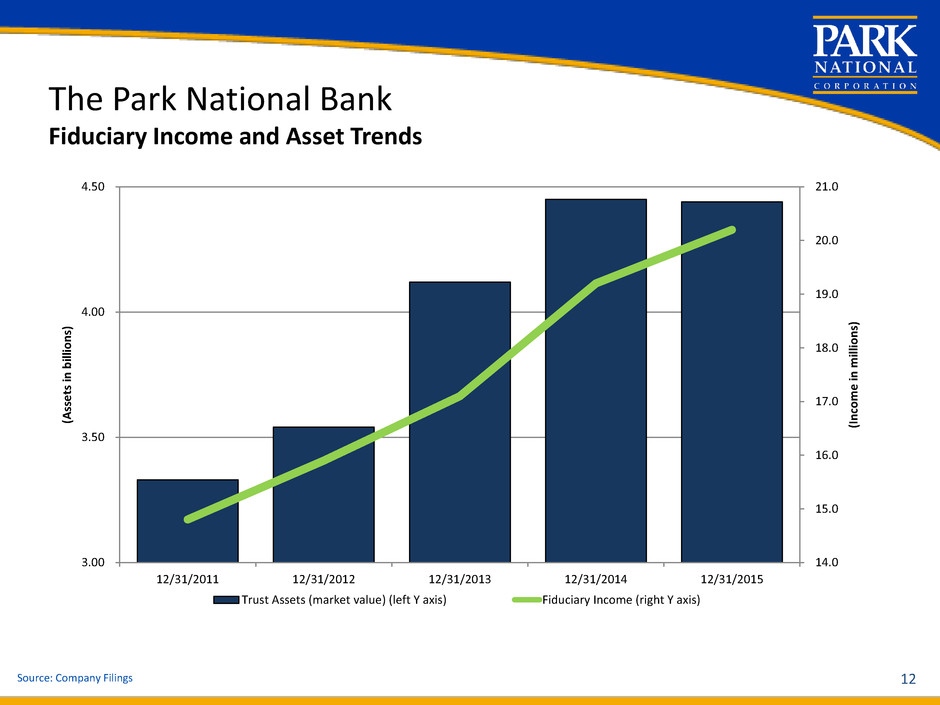
The Park National Bank Fiduciary Income and Asset Trends Source: Company Filings 12 14.0 15.0 16.0 17.0 18.0 19.0 20.0 21.0 3.00 3.50 4.00 4.50 12/31/2011 12/31/2012 12/31/2013 12/31/2014 12/31/2015 (I n co m e in m ill io n s) (A sse ts in b ill io n s) Trust Assets (market value) (left Y axis) Fiduciary Income (right Y axis)

13 The Park National Bank Loan Totals Source: Company Filings $4,650 $4,700 $4,750 $4,800 $4,850 $4,900 $4,950 $5,000 $5,050 Dec. 31, 2014 Mar. 31, 2015 Jun. 30, 2015 Sept. 30, 2015 Dec. 31, 2015 Mar. 31, 2016 To ta l L o an s (i n mi lli o n s)
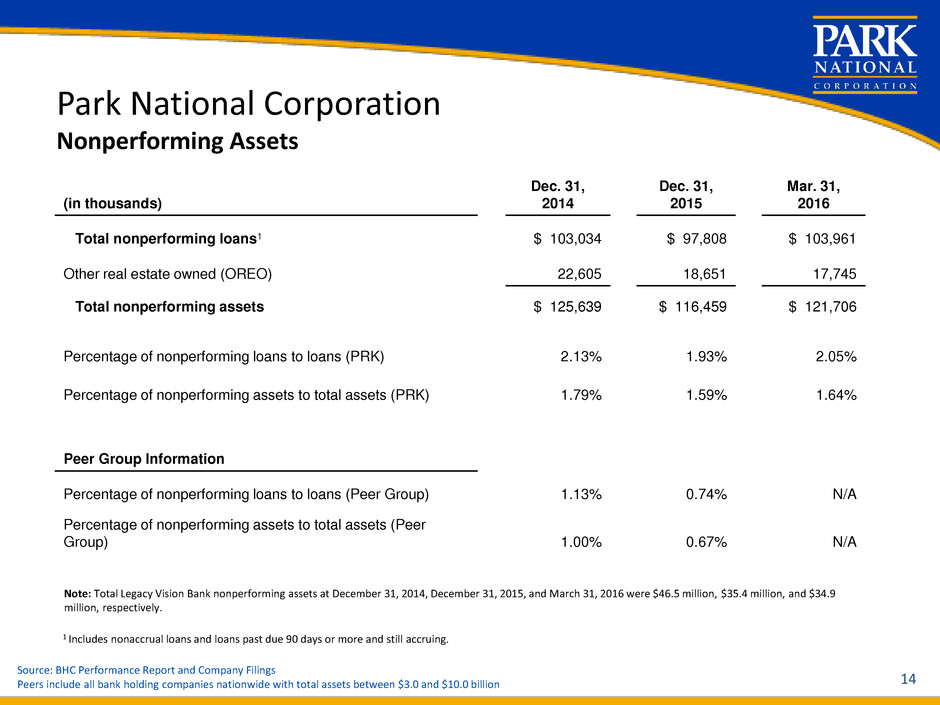
Park National Corporation Nonperforming Assets Source: BHC Performance Report and Company Filings Peers include all bank holding companies nationwide with total assets between $3.0 and $10.0 billion 14 (in thousands) Dec. 31, 2014 Dec. 31, 2015 Mar. 31, 2016 Total nonperforming loans1 $ 103,034 $ 97,808 $ 103,961 Other real estate owned (OREO) 22,605 18,651 17,745 Total nonperforming assets $ 125,639 $ 116,459 $ 121,706 Percentage of nonperforming loans to loans (PRK) 2.13% 1.93% 2.05% Percentage of nonperforming assets to total assets (PRK) 1.79% 1.59% 1.64% Peer Group Information Percentage of nonperforming loans to loans (Peer Group) 1.13% 0.74% N/A Percentage of nonperforming assets to total assets (Peer Group) 1.00% 0.67% N/A Note: Total Legacy Vision Bank nonperforming assets at December 31, 2014, December 31, 2015, and March 31, 2016 were $46.5 million, $35.4 million, and $34.9 million, respectively. 1 Includes nonaccrual loans and loans past due 90 days or more and still accruing.

Dividends & Taxes Paid Note: The table above presents the amount of dividends that have been paid to shareholders known to be residing in the counties in which our divisions operate. 15 Dividends paid by Bank Division (counties in italics) 2011-2015 (5 years) 2006-2015 (10 years) Park National Bank (Licking & Franklin) $ 35,747,786 $ 83,569,546 First-Knox National Bank (Knox, Holmes, Morrow & Wayne) 20,446,385 44,842,795 Security National Bank (Clark, Champaign, Fayette, Greene, Madison, & Warren) 10,619,308 24,126,945 Second National Bank (Darke & Mercer) 2,981,746 6,530,794 Century National Bank (Muskingum, Perry, Athens, Hocking, Coshocton & Tuscarawas) 2,360,843 5,217,865 Richland Bank (Richland) 1,265,375 2,658,018 United Bank, N.A. (Marion & Crawford) 1,019,118 2,681,630 Unity National Bank (Miami) 1,093,180 2,153,421 Fairfield National Bank (Fairfield) 878,526 1,710,029 The Park National Bank of SW Ohio & Northern Kentucky (Hamilton, Butler & Clermont) 499,674 1,198,922 Farmers Bank (Ashland) 273,882 607,370 Other (Counties outside of PRK footprint) 212,709,177 411,259,665 Total dividends paid $ 289,895,000 $ 586,557,000 Taxes paid (federal, state & real estate) 178,637,000 298,674,000 Total dividends and taxes paid $ 468,532,000 $ 885,231,000

16 1,800,000 1,900,000 2,000,000 2,100,000 2,200,000 2,300,000 2,400,000 2,500,000 2,600,000 2Q13 3Q13 4Q13 1Q14 2Q14 3Q14 4Q14 1Q15 2Q15 3Q15 4Q15 1Q16 In-Person Transactions

0 2,000,000 4,000,000 6,000,000 8,000,000 2Q13 3Q13 4Q13 1Q14 2Q14 3Q14 4Q14 1Q15 2Q15 3Q15 4Q15 1Q16 17 Mobile Banking Transactions

18

19

20

21

22

Net Promoter Score Comparison of Results Financial Industry Includes direct banks, credit unions, community banks, regional banks and national banks. 35 77 0 10 20 30 40 50 60 70 80 90 Financial Industry Average PRK Affiliate Average World Class Companies 23 Source: 2015 Satmetrix, Net Promoter Industry Benchmarks PRK data as of 12/31/15
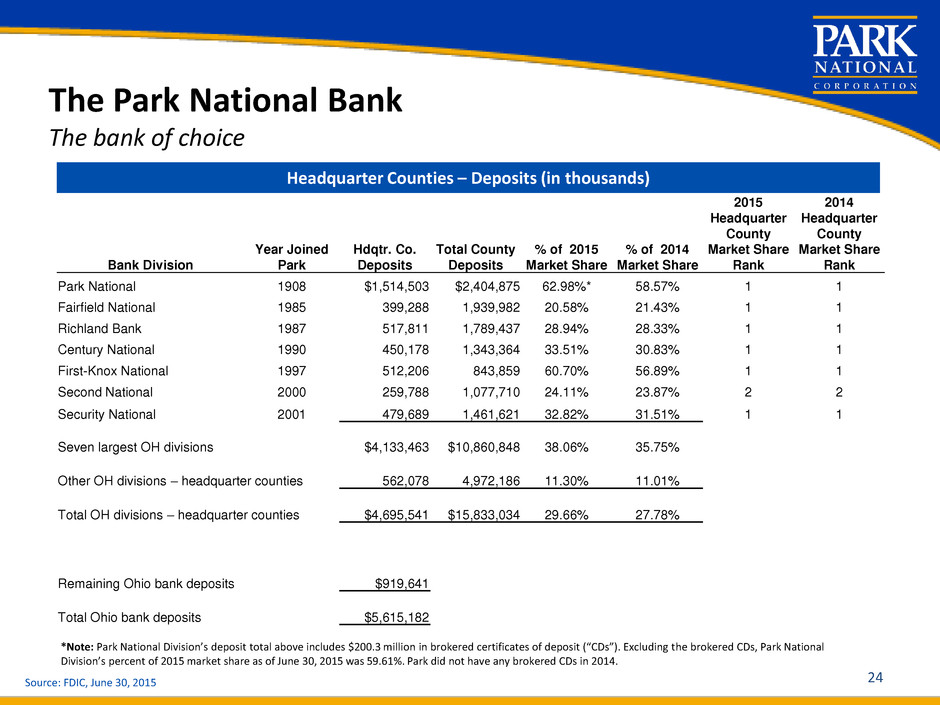
The Park National Bank The bank of choice Headquarter Counties – Deposits (in thousands) Source: FDIC, June 30, 2015 24 Bank Division Year Joined Park Hdqtr. Co. Deposits Total County Deposits % of 2015 Market Share % of 2014 Market Share 2015 Headquarter County Market Share Rank 2014 Headquarter County Market Share Rank Park National 1908 $1,514,503 $2,404,875 62.98%* 58.57% 1 1 Fairfield National 1985 399,288 1,939,982 20.58% 21.43% 1 1 Richland Bank 1987 517,811 1,789,437 28.94% 28.33% 1 1 Century National 1990 450,178 1,343,364 33.51% 30.83% 1 1 First-Knox National 1997 512,206 843,859 60.70% 56.89% 1 1 Second National 2000 259,788 1,077,710 24.11% 23.87% 2 2 Security National 2001 479,689 1,461,621 32.82% 31.51% 1 1 Seven largest OH divisions $4,133,463 $10,860,848 38.06% 35.75% Other OH divisions – headquarter counties 562,078 4,972,186 11.30% 11.01% Total OH divisions – headquarter counties $4,695,541 $15,833,034 29.66% 27.78% Remaining Ohio bank deposits $919,641 Total Ohio bank deposits $5,615,182 *Note: Park National Division’s deposit total above includes $200.3 million in brokered certificates of deposit (“CDs”). Excluding the brokered CDs, Park National Division’s percent of 2015 market share as of June 30, 2015 was 59.61%. Park did not have any brokered CDs in 2014.

2015 PRK Agenda A. Consolidated Net Income => $85 million B. Maintain common dividend at historic rate C. Perform in upper quintile of $3-$10 billion bank holding company peer group D. Reduce SEPH troubled assets to $20 million by 12/31/2015 E. Maintain or improve all regulatory ratings F. Maintain => 85% of key risk indicators in green condition G. Establish and/or maintain contact with M&A prospects; review M&A possibilities as they emerge 25

2016 PRK Agenda A. Consolidated Net Income => $85 million B. Maintain common dividend at historic rate C. Perform in upper quintile of $3-$10 billion bank holding company peer group D. Reduce NPA’s to peer levels E. At least maintain => 85% of key risk indicators in green/yellow condition F. Cultivate and respond promptly to M & A possibilities 26

ANNUAL MEETING OF SHAREHOLDERS April 25, 2016 27
