Attached files
| file | filename |
|---|---|
| 8-K - TAIWAN FUND INC | fp0019175_8k.htm |

Investment objective
The Fund's investment objective is to seek long-term capital appreciation primarily through investments in equity securities listed in Taiwan.
|
Fund facts
|
(as at 03/31/16)
|
|
Net asset value per share
|
$17.86
|
|
Market price
|
$15.54
|
|
Premium/discount
|
-12.99%
|
|
Total net assets
|
$ 146.85 m
|
|
Market cap
|
$ 127.81 m
|
|
Fund statistics
|
|
|
Investment adviser (date of appointment)
|
JF International Management, Inc. (07/22/14)
|
|
Fund manager
|
Shumin Huang
|
|
Listed
|
NYSE
|
|
Launch date
|
12/23/86
|
|
Shares outstanding
|
8,224,330
|
|
Last dividend (Ex-dividend date)
|
$2.6332 (December 26, 2014)
|
|
Benchmark
|
TAIEX Total Return Index
|
|
Fund codes
|
|
|
Bloomberg
|
TWN
|
|
Sedol
|
286987895
|
|
CUSIP
|
874036106
|
|
ISIN
|
US8740361063
|
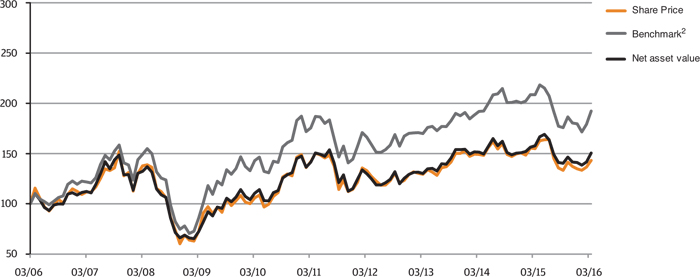
| 10 year performance data |
(as at 03/31/16)
|
|
Cumulative Performance1
|
(as at 03/31/16)
|
|
%
|
1m
|
3m
|
YTD
|
1Y
|
3Y
|
5Y
|
10Y
|
|
The Taiwan Fund, Inc.
|
6.3
|
6.7
|
6.7
|
-4.6
|
15.6
|
6.4
|
50.6
|
|
Market Price
|
4.9
|
6.2
|
6.2
|
-7.6
|
10.7
|
0.8
|
43.3
|
|
TSE Index
|
7.4
|
7.0
|
7.0
|
-11.3
|
2.6
|
-8.0
|
33.3
|
|
TAIEX Total Return Index2
|
7.4
|
7.0
|
7.0
|
-7.8
|
13.2
|
9.6
|
92.3
|
|
MSCI Taiwan Index
|
8.5
|
7.7
|
7.7
|
-8.5
|
13.7
|
9.3
|
55.1
|
|
Rolling 12 month performance1
|
(as at 03/31/16)
|
|
%
|
2016/2015
|
2015/2014
|
2014/2013
|
2013/2012
|
2012/2011
|
|
The Taiwan Fund, Inc.
|
-4.6
|
4.2
|
16.3
|
0.3
|
-8.2
|
|
Market Price
|
-7.6
|
3.9
|
15.3
|
-2.7
|
-6.4
|
|
TSE Index
|
-11.3
|
5.4
|
9.7
|
-1.5
|
-9.0
|
|
TAIEX Total Return Index2
|
-7.8
|
8.7
|
13.0
|
2.2
|
-5.3
|
|
MSCI Taiwan Index
|
-8.5
|
12.4
|
10.5
|
1.7
|
-5.4
|
|
Top 10 holdings
|
(as at 03/31/16)
|
| Holding | Fund % |
|
Taiwan Semiconductor Manufacturing Co., Ltd.
|
10.0
|
|
Tung Thih Electronic Co., Ltd.
|
4.1
|
|
Hota Industrial Manufacturing Co., Ltd.
|
4.1
|
|
Eclat Textile Co., Ltd.
|
4.0
|
|
Largan Precision Co., Ltd.
|
3.9
|
|
Yeong Guan Energy Technology Group Co., Ltd.
|
3.5
|
|
Ennoconn Corp.
|
3.4
|
|
Hon Hai Precision Industry Co., Ltd.
|
3.3
|
|
Advanced Semiconductor Engineering, Inc.
|
3.1
|
|
Catcher Technology Co., Ltd.
|
3.0
|
|
1
|
In US Dollar terms
|
|
2
|
TAIEX Total Return Index (prior to January 1, 2003, TAIEX Index)
|

|
Sector breakdown
|
(as at 03/31/16)
|
|
Sector Allocation
|
Fund %
|
BenchmarkA
|
Deviation
|
|
Automobile
|
0.0%
|
1.5%
|
-1.5%
|
|
Biotechnology & Medical Care
|
0.3%
|
1.0%
|
-0.7%
|
|
Building Material & Construction
|
0.0%
|
1.6%
|
-1.6%
|
|
Cement
|
0.3%
|
1.0%
|
-0.7%
|
|
Chemical
|
0.0%
|
1.0%
|
-1.0%
|
|
Communications & Internet
|
1.8%
|
6.9%
|
-5.1%
|
|
Computer & Peripheral Equipment
|
6.4%
|
6.0%
|
0.4%
|
|
Electric & Machinery
|
13.6%
|
1.8%
|
11.8%
|
|
Electrical & Cable
|
0.0%
|
0.3%
|
-0.3%
|
|
Electronic Parts & Components
|
2.5%
|
4.4%
|
-1.9%
|
|
Electronic Products Distribution
|
0.0%
|
0.8%
|
-0.8%
|
|
Financial & Insurance
|
5.2%
|
12.7%
|
-7.5%
|
|
Foods
|
2.3%
|
2.0%
|
0.3%
|
|
Glass & Ceramic
|
0.0%
|
0.2%
|
-0.2%
|
|
Information Service
|
0.0%
|
0.2%
|
-0.2%
|
|
Iron & Steel
|
0.0%
|
2.0%
|
-2.0%
|
|
Oil, Gas & Electricity
|
1.8%
|
3.6%
|
-1.8%
|
|
Optoelectronic
|
4.6%
|
3.8%
|
0.8%
|
|
Other
|
6.4%
|
3.6%
|
2.8%
|
|
Other Electronic
|
12.5%
|
7.3%
|
5.2%
|
|
Paper & Pulp
|
0.0%
|
0.3%
|
-0.3%
|
|
Plastics
|
4.3%
|
6.6%
|
-2.3%
|
|
Rubber
|
0.0%
|
1.4%
|
-1.4%
|
|
Semiconductor
|
23.6%
|
24.3%
|
-0.7%
|
|
Shipping & Transportation
|
1.0%
|
1.6%
|
-0.6%
|
|
Textiles
|
7.3%
|
2.0%
|
5.3%
|
|
Tourism
|
0.0%
|
0.5%
|
-0.5%
|
|
Trading & Consumers’ Goods
|
2.9%
|
1.6%
|
1.3%
|
|
Cash
|
3.2%
|
0.0%
|
3.2%
|
|
Overal Total
|
100.0%
|
100.0%
|
0.0%
|
Review
The TAIEX total return index (TAIEX) rose 7.4% in March and closed at a four-month high, mainly thanks to net buying from foreign institutional investors. Despite weak export numbers from technology products, the Taiwan equity market rose as China macro data showed more signs of stabilization, comments from Federal Open Market Committee (FOMC) were less hawkish, and commodity prices continued to recover. Sectors that had previously oversold, such as construction, rubber, paper, steel and cement, led performance in March, posting middle-single-digit to low-teen percentage rises. The technology sector was in-line with the benchmark but lagged the sectors mentioned above due to concerns over inventory overbuild together with tepid order flows in the Apple supply chain. The Fund underperformed the TAIEX by 1.1% in March.
Positioning and Contributors
Key holdings of auto parts companies in the electric & machinery and other electronic sectors were the major contributors in March, while our holdings in the renewable energy and Internet of Things (IoT) / server-related names were hit by profit-taking. Given the improving macro outlook in China and the relatively weak US Dollar, the Fund took the opportunity to reduce its underweight positions in the commodities and financials sectors. Overall, the Fund continues to focus on quality companies with stronger growth profiles, especially auto parts and textile names.
Outlook
The Taiwan market could face some near-term headwinds on both lackluster economic and corporate earnings growth. There will also be a policy vacuum in the Taiwan government from the change in the Presidency, as the new Democratic Progressive Party (DPP) will not assume power until end May 2016. However, concerns over the change in the ruling party should have already been priced in. Market sentiment will likely improve in the coming months should crude oil prices continue to rally and macro numbers continue to stabilize in China. The Fund expects that 2016 earnings for companies in Taiwan will reach a trough in the first quarter of 2016.
|
Full portfolio holdings
|
(as at 03/31/16)
|
|
Holding
|
Market Value USD
|
Fund
|
|
Semiconductor
|
34,722,449
|
23.6%
|
|
Taiwan Semiconductor Manufacturing Co., Ltd.
|
14,617,450
|
9.9%
|
|
Advanced Semiconductor Engineering, Inc.
|
4,518,343
|
3.1%
|
|
Realtek Semiconductor Corp.
|
2,958,799
|
2.0%
|
|
Win Semiconductors Corp.
|
2,743,575
|
1.9%
|
|
ASPEED Technology, Inc.
|
2,243,913
|
1.5%
|
|
Silergy Corp.
|
2,018,767
|
1.4%
|
|
MediaTek, Inc.
|
1,473,527
|
1.0%
|
|
United Microelectronics Corp.
|
1,468,273
|
1.0%
|
|
Silicon Motion Technology Corp.
|
1,125,490
|
0.8%
|
|
Siliconware Precision Industries Co.
|
1,038,901
|
0.7%
|
|
CHIPBOND Technology Corp.
|
515,411
|
0.3%
|
|
Electric & Machinery
|
19,912,901
|
13.6%
|
|
Hota Industrial Manufacturing Co., Ltd.
|
6,024,733
|
4.1%
|
|
Yeong Guan Energy Technology Group Co., Ltd.
|
5,103,238
|
3.5%
|
|
Airtac International Group
|
2,839,610
|
1.9%
|
|
Iron Force Industrial Co., Ltd.
|
2,466,080
|
1.7%
|
|
Macauto Industrial Co., Ltd.
|
2,152,933
|
1.5%
|
|
Hiwin Technologies Corp.
|
783,697
|
0.5%
|
|
Sumeeko Industries Co., Ltd.
|
542,610
|
0.4%
|
|
Other Electronic
|
18,392,677
|
12.5%
|
|
Tung Thih Electronic Co., Ltd.
|
6,043,686
|
4.1%
|
|
Hon Hai Precision Industry Co., Ltd.
|
4,829,342
|
3.3%
|
|
Catcher Technology Co., Ltd.
|
4,347,502
|
3.0%
|
|
Voltronic Power Technology Corp.
|
1,848,634
|
1.2%
|
|
Bizlink Holding, Inc.
|
1,323,513
|
0.9%
|
|
Textiles
|
10,713,881
|
7.3%
|
|
Eclat Textile Co., Ltd.
|
5,926,105
|
4.0%
|
|
Toung Loong Textile Manufacturing Co., Ltd.
|
2,422,073
|
1.7%
|
|
Makalot Industrial Co., Ltd.
|
2,365,703
|
1.6%
|
|
Computer & Peripheral Equipment
|
9,340,224
|
6.4%
|
|
Ennoconn Corp.
|
4,942,114
|
3.4%
|
|
Inventec Co., Ltd.
|
1,836,279
|
1.3%
|
|
Pegatron Corp.
|
1,243,733
|
0.8%
|
|
Advantech Co., Ltd.
|
1,175,739
|
0.8%
|
|
Posiflex Technology, Inc.
|
142,359
|
0.1%
|
|
Other
|
9,327,236
|
6.4%
|
|
Taiwan Paiho Ltd.
|
2,396,222
|
1.7%
|
|
Pou Chen Corp.
|
1,742,729
|
1.2%
|
|
Nan Liu Enterprise Co., Ltd.
|
1,582,774
|
1.1%
|
|
KMC Kuei Meng International, Inc.
|
1,061,467
|
0.7%
|
|
Feng TAY Enterprise Co., Ltd.
|
1,057,327
|
0.7%
|
|
Sunspring Metal Corp.
|
920,349
|
0.6%
|
|
Giant Manufacturing Co., Ltd.
|
566,368
|
0.4%
|
|
Financial & Insurance
|
7,590,854
|
5.2%
|
|
Cathay Financial Holding Co., Ltd.
|
2,554,429
|
1.8%
|
|
E. Sun Financial Holding Co., Ltd.
|
1,338,367
|
0.9%
|
|
Mega Financial Holding Co., Ltd.
|
1,314,203
|
0.9%
|
|
CTBC Financial Holding Co., Ltd.
|
1,229,679
|
0.8%
|
|
Fubon Financial Holding Co., Ltd.
|
1,154,176
|
0.8%
|
Full portfolio holdings (cont'd)
|
Holding
|
Market Value USD
|
Fund
|
|
Optoelectronic
|
6,764,386
|
4.6%
|
|
Largan Precision Co., Ltd.
|
5,736,701
|
3.9%
|
|
Innolux Corp.
|
1,027,685
|
0.7%
|
|
Plastics
|
6,369,767
|
4.3%
|
|
Formosa Plastics Corp.
|
2,551,398
|
1.7%
|
|
Formosa Chemicals & Fibre Corp.
|
2,177,939
|
1.5%
|
|
Nan Ya Plastics Corp.
|
1,640,430
|
1.1%
|
|
Trading & Consumers' Goods
|
4,332,411
|
2.9%
|
|
President Chain Store Corp.
|
1,872,561
|
1.2%
|
|
Poya Co., Ltd.
|
1,740,859
|
1.2%
|
|
Taiwan FamilyMart Co., Ltd.
|
718,991
|
0.5%
|
|
Electronic Parts & Components
|
3,691,260
|
2.5%
|
|
King Slide Works Co., Ltd.
|
2,181,628
|
1.5%
|
|
Delta Electronics, Inc.
|
1,509,632
|
1.0%
|
|
Foods
|
3,430,298
|
2.3%
|
|
Uni-President Enterprises Corp.
|
3,430,298
|
2.3%
|
|
Oil, Gas & Electricity
|
2,684,408
|
1.8%
|
|
Formosa Petrochemical Corp.
|
2,684,408
|
1.8%
|
|
Communications & Internet
|
2,571,774
|
1.8%
|
|
Wistron NeWeb Corp.
|
2,133,761
|
1.5%
|
|
Visual Photonics Epitaxy Co., Ltd.
|
438,013
|
0.3%
|
|
Shipping & Transportation
|
1,464,246
|
1.0%
|
|
Eva Airways Corp.
|
741,030
|
0.5%
|
|
China Airlines Ltd.
|
723,216
|
0.5%
|
|
Cement
|
441,415
|
0.3%
|
|
Taiwan Cement Corp.
|
441,415
|
0.3%
|
|
Biotechnology & Medical Care
|
435,683
|
0.3%
|
|
Grape King Bio Ltd.
|
435,683
|
0.3%
|
|
Cash
|
4,664,739
|
3.2%
|
|
Cash
|
4,664,739
|
3.2%
|
|
Grand Total
|
146,850,609
|
100.0
|
Source: MSCI. Neither MSCI nor any other party involved in or related to compiling, computing or creating the MSCI data makes any express of implied warranties or representations with respect to such data (or the results to be obtained by the use thereof), and all such parties hereby expressly disclaim all warranties of originality, accuracy, completeness, merchantability or fitness for a particular purpose with respect to any of such data. Without limiting any of the foregoing, in no event shall MSCI, any of its affiliates or any third party involved in or related to compiling computing or creating the data have any liability for any direct, indirect, special, punitive, consequential or any other damages (including lost profits) even if notified of the possibility of such damages.
No further distribution or dissemination of the MSCI data is permitted without MSCI's express written consent.
Important Information
This document is issued and approved by JF International Management, Inc. (“JFIMI”), as investment advisor of The Taiwan Fund, Inc. (the ‘'Fund''). JFIMI is an investment advisor registered with the US Securities and Exchange Commission. Certain information herein is believed to be reliable but has not been verified by JFIMI. JFIMI makes no representation or warranty and does not accept any responsibility in relation to such information or for opinion or conclusion which the reader may draw from this newsletter.
The Fund is classified as a diversified investment company under the US Investment Company Act of 1940 as amended. It meets the criteria of a closed end US fund and its shares are listed on the New York Stock Exchange. JFIMI has been appointed investment advisor to the Fund.
This newsletter does not constitute an offer of shares. Closed-end funds, unlike open-end funds, are not continuously offered. After the initial public offering, shares are bought and sold on the open market through a stock exchange. JFIMI, its ultimate and intermediate holding companies, subsidiaries, affiliates, clients, directors or staff may, at any time, have a position in the market referred to herein, and may buy or sell securities, currencies, or any other financial instruments in such markets. The information or opinion expressed in this newsletter should not be construed to be a recommendation to buy or sell any security, including the securities, commodities, currencies or financial instruments referred to herein.
Portfolio holdings are subject to change daily.
It should not be assumed that any of the securities transactions or holdings discussed here were or will prove to be profitable, or that the investment recommendations or decisions we make in the future will be profitable or will equal the investment performance of the securities discussed herein.
Investing in the Fund involves certain considerations in addition to the risks normally associated with making investments in securities. The value of the shares issued by the Fund, and the income from them, may go down as well as up and there can be no assurance that upon sale, or otherwise, investors will receive back the amount originally invested. There can be no assurance that you will receive comparable performance returns. Movements in foreign exchange rates may have a separate effect, unfavorable as well as favorable, on the gain or loss otherwise experienced on an investment. Past performance is not a guide to future returns. Accordingly, the Fund is only suitable for investment by investors who are able and willing to withstand the total loss of their investment. In particular, prospective investors should consider the following risks:
Discretionary investment is not risk-free. The past operating performance does not guarantee a minimum return for the discretionary investment fund. Apart from exercising the duty of care of a prudent adviser, JFIMI will not be responsible for the profit or loss of the discretionary investment fund, nor guarantee a minimum return.
| • | It should be noted that investment in the Fund is only suitable for sophisticated investors who are aware of the risk of investing in Taiwan and should be regarded as long term. Funds which invest in one country carry a higher degree of risk than those with portfolios diversified across a number of markets. |
| • | Investment in the securities of smaller and unquoted companies can involve greater risk than is customarily associated with investment in larger, more established, companies. In particular, smaller companies often have limited product lines, markets or financial resources and their management may be dependent on a smaller number of key individuals. In addition, the market for stock in smaller companies is often less liquid than that for stock in larger companies, bringing with it potential difficulties in acquiring, valuing and disposing of such stock. Proper information for determining their value, or the risks to which they are exposed, may not be available. |
| • | Investments within emerging markets such as Taiwan can be of higher risk. Many emerging markets, and the companies quoted on their stock exchanges, are exposed to the risks of political, social and religious instability, expropriation of assets or nationalization, rapid rates of inflation, high interest rates, currency depreciation and fluctuations and changes in taxation which may affect the Fund's income and the value of its investments. |
| • | The marketability of quoted shares may be limited due to foreign investment restrictions, wide dealing spreads, exchange controls, foreign ownership restrictions, the restricted opening of stock exchanges and a narrow range of investors. Trading volume may be lower than on more developed stock markets, and equities are less liquid. Volatility of prices can also be greater than in more developed stock markets. The infrastructure for clearing, settlement and registration on the primary and secondary markets may be undeveloped. Under certain circumstances, there may be delays in settling transactions in some of the markets. |