Attached files
| file | filename |
|---|---|
| 8-K - 8-K - Federal Home Loan Bank of Boston | a16-8812_18k.htm |
| EX-99.1 - EX-99.1 - Federal Home Loan Bank of Boston | a16-8812_1ex99d1.htm |
Exhibit 99.2
83rd Annual Shareholders Meeting April 22, 2016

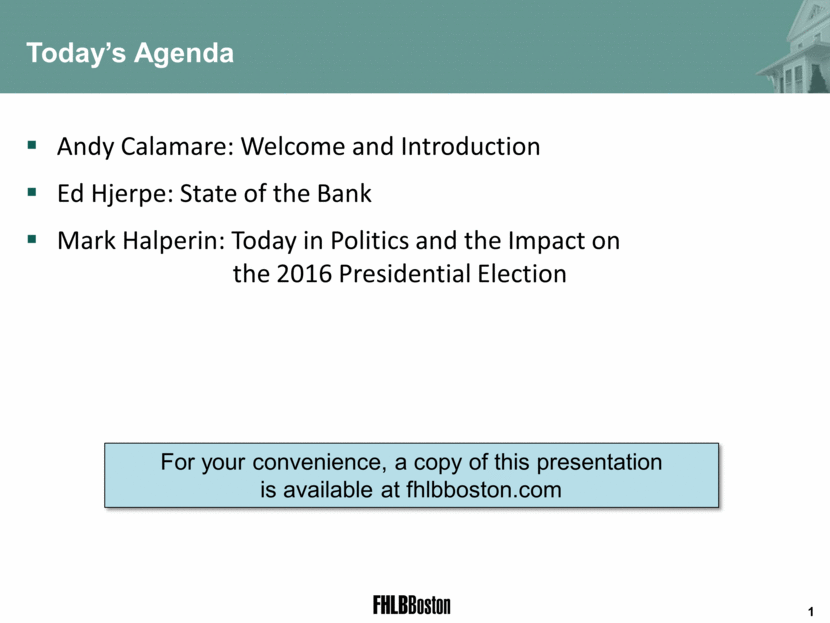
Andy Calamare: Welcome and Introduction Ed Hjerpe: State of the Bank Mark Halperin: Today in Politics and the Impact on the 2016 Presidential Election Today’s Agenda For your convenience, a copy of this presentation is available at fhlbboston.com 1
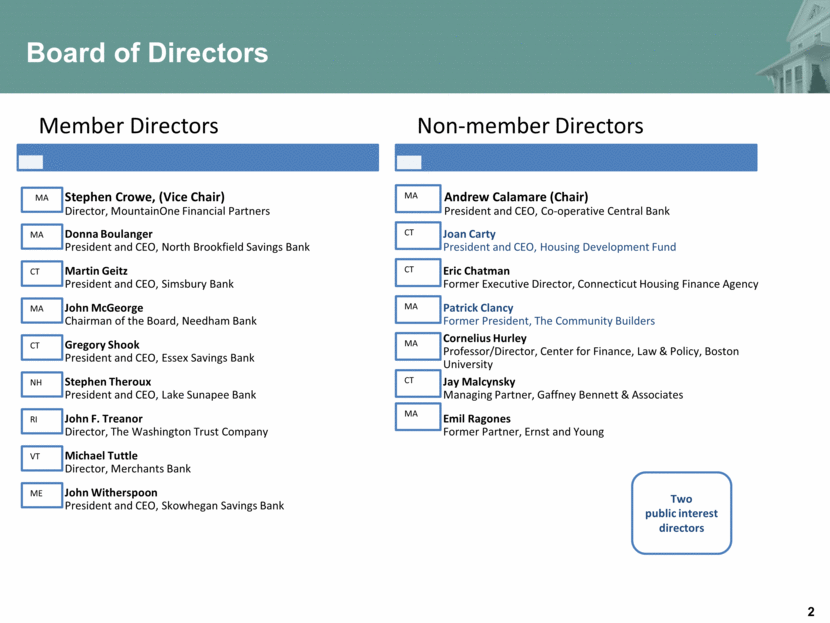
Board of Directors Member Directors MA Stephen Crowe, (Vice Chair) Director, MountainOne Financial Partners MA Donna Boulanger President and CEO, North Brookfield Savings Bank CT Martin Geitz President and CEO, Simsbury Bank MA John McGeorge Chairman of the Board, Needham Bank CT Gregory Shook President and CEO, Essex Savings Bank NH Stephen Theroux President and CEO, Lake Sunapee Bank RI John F. Treanor Director, The Washington Trust Company VT Michael Tuttle Director, Merchants Bank ME John Witherspoon President and CEO, Skowhegan Savings Bank Non-member Directors MA Andrew Calamare (Chair) President and CEO, Co-operative Central Bank CT Joan Carty President and CEO, Housing Development Fund CT Eric Chatman Former Executive Director, Connecticut Housing Finance Agency MA Patrick Clancy Former President, The Community Builders MA Cornelius Hurley Professor/Director, Center for Finance, Law & Policy, Boston University CT Jay Malcynsky Managing Partner, Gaffney Bennett & Associates MA Emil Ragones Former Partner, Ernst and Young Two public interest directors
83rd Annual Shareholders Meeting April 22, 2016

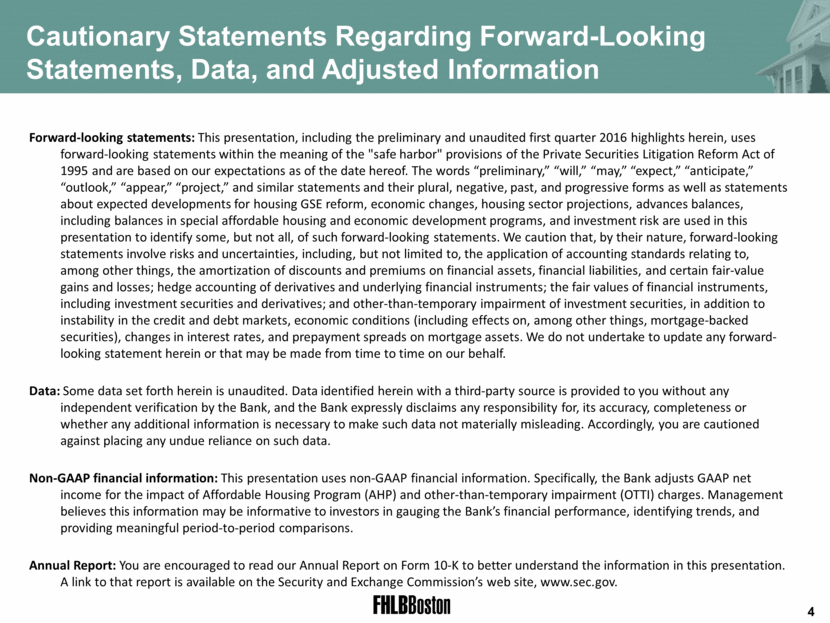
Cautionary Statements Regarding Forward-Looking Statements, Data, and Adjusted Information Forward-looking statements: This presentation, including the preliminary and unaudited first quarter 2016 highlights herein, uses forward-looking statements within the meaning of the "safe harbor" provisions of the Private Securities Litigation Reform Act of 1995 and are based on our expectations as of the date hereof. The words “preliminary,” “will,” “may,” “expect,” “anticipate,” “outlook,” “appear,” “project,” and similar statements and their plural, negative, past, and progressive forms as well as statements about expected developments for housing GSE reform, economic changes, housing sector projections, advances balances, including balances in special affordable housing and economic development programs, and investment risk are used in this presentation to identify some, but not all, of such forward-looking statements. We caution that, by their nature, forward-looking statements involve risks and uncertainties, including, but not limited to, the application of accounting standards relating to, among other things, the amortization of discounts and premiums on financial assets, financial liabilities, and certain fair-value gains and losses; hedge accounting of derivatives and underlying financial instruments; the fair values of financial instruments, including investment securities and derivatives; and other-than-temporary impairment of investment securities, in addition to instability in the credit and debt markets, economic conditions (including effects on, among other things, mortgage-backed securities), changes in interest rates, and prepayment spreads on mortgage assets. We do not undertake to update any forward-looking statement herein or that may be made from time to time on our behalf. Data: Some data set forth herein is unaudited. Data identified herein with a third-party source is provided to you without any independent verification by the Bank, and the Bank expressly disclaims any responsibility for, its accuracy, completeness or whether any additional information is necessary to make such data not materially misleading. Accordingly, you are cautioned against placing any undue reliance on such data. Non-GAAP financial information: This presentation uses non-GAAP financial information. Specifically, the Bank adjusts GAAP net income for the impact of Affordable Housing Program (AHP) and other-than-temporary impairment (OTTI) charges. Management believes this information may be informative to investors in gauging the Bank’s financial performance, identifying trends, and providing meaningful period-to-period comparisons. Annual Report: You are encouraged to read our Annual Report on Form 10-K to better understand the information in this presentation. A link to that report is available on the Security and Exchange Commission’s web site, www.sec.gov. 4
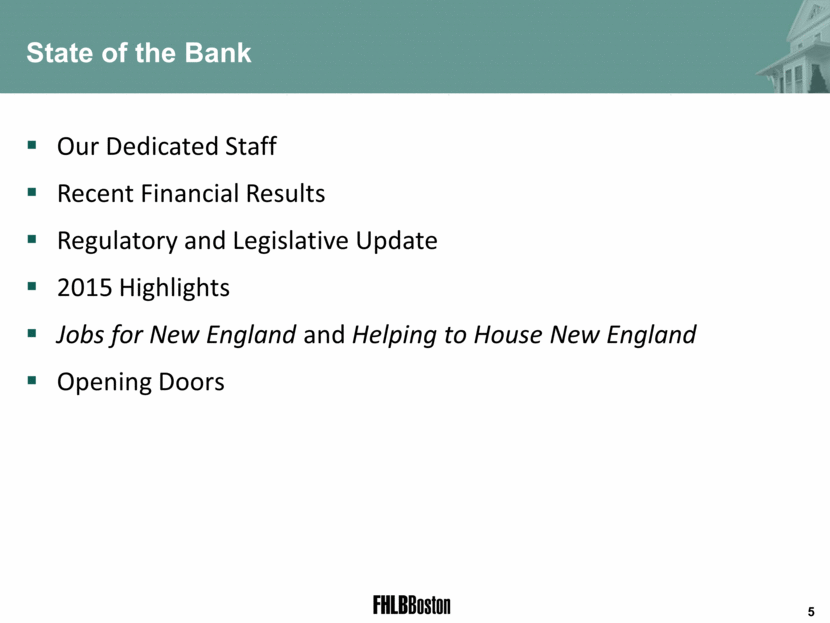
Our Dedicated Staff Recent Financial Results Regulatory and Legislative Update 2015 Highlights Jobs for New England and Helping to House New England Opening Doors State of the Bank 5
Our Dedicated Staff

Carol Hempfling Pratt General Counsel Timothy J. Barrett Treasurer Barry F. Gale Executive Director of HR George H. Collins Chief Risk Officer M. Susan Elliott Chief Business Officer Frank Nitkiewicz Chief Financial Officer Sean McRae Chief Information Officer Our Management Committee 7

Mary Ellen Jutras VP/Deputy Director, Housing & Community Investment Susan Elliott EVP/Chief Business Officer Linda Ballard Executive Assistant Thank You for 30+ Years of Service 8 35 years 30 years 30 years

Recent Financial Results
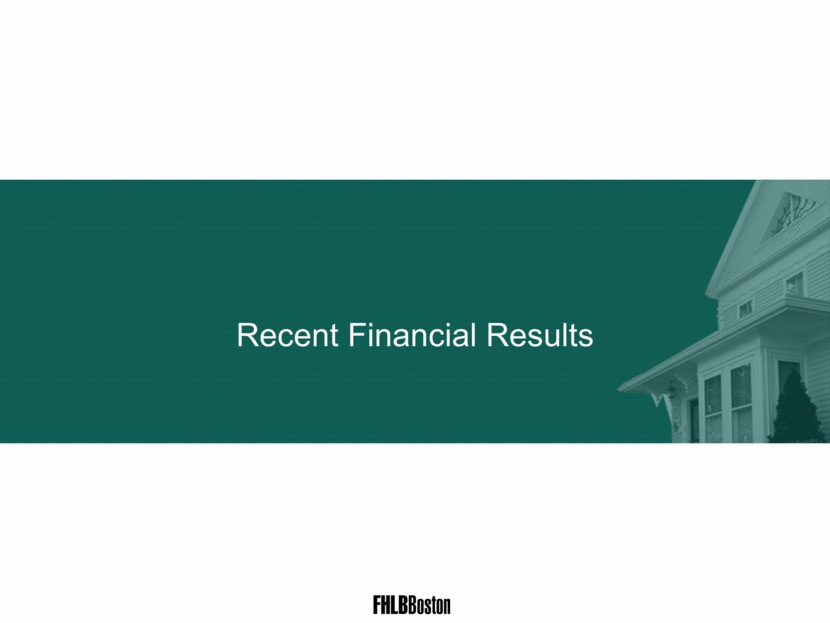
Q1 2016 Assets $58.7 billion Advances $34.5 billion Net Income Before OTTI Charges and AHP Assessment $34.1 million Credit-Related OTTI Losses $(1.3 million) Affordable Housing Program $(3.3 million) Net Income $29.5 million Dividend (LIBOR + 300 basis points; to be paid on May 3, 2016) 3.63 percent First Quarter 2016 Financial Highlights All first quarter results are preliminary and unaudited. 10
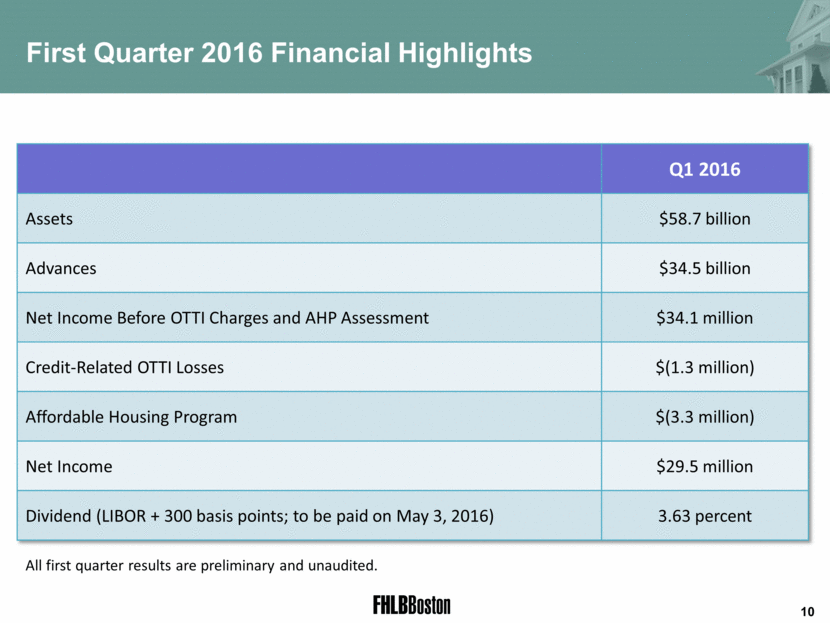
Year-End and Q1 2016 Assets, Advances, and Investments In billions MPF Advances Assets Investments 11
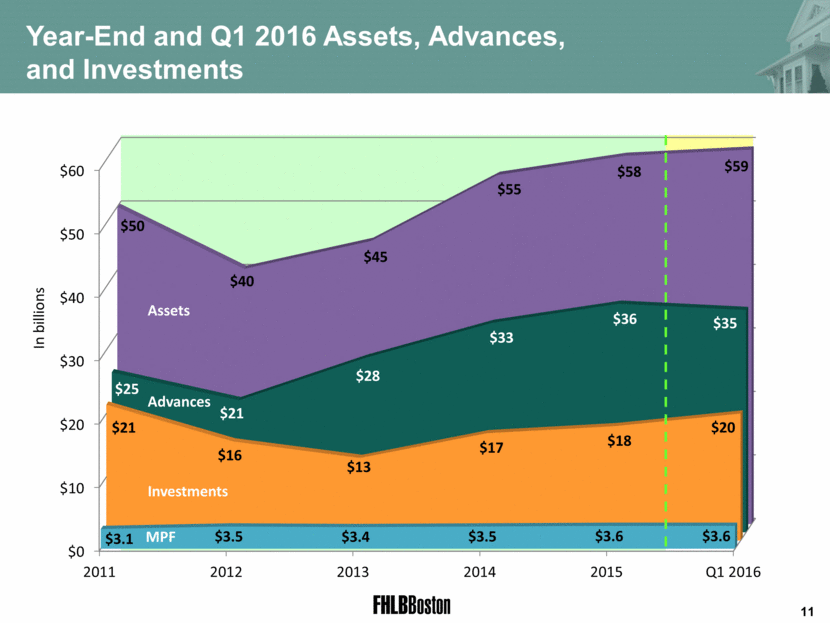
Annual and Q1 2016 Credit Losses In millions 12 PLMBS Carrying Value 2007: $6.0 billion 2011: $1.6 billion Q1 2016: $0.9 billion
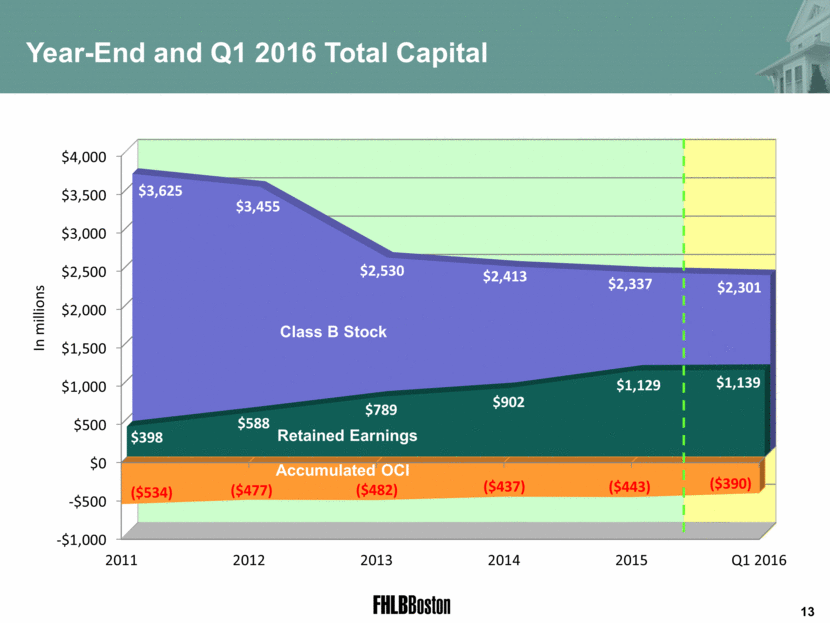
Year-End and Q1 2016 Total Capital In millions 13
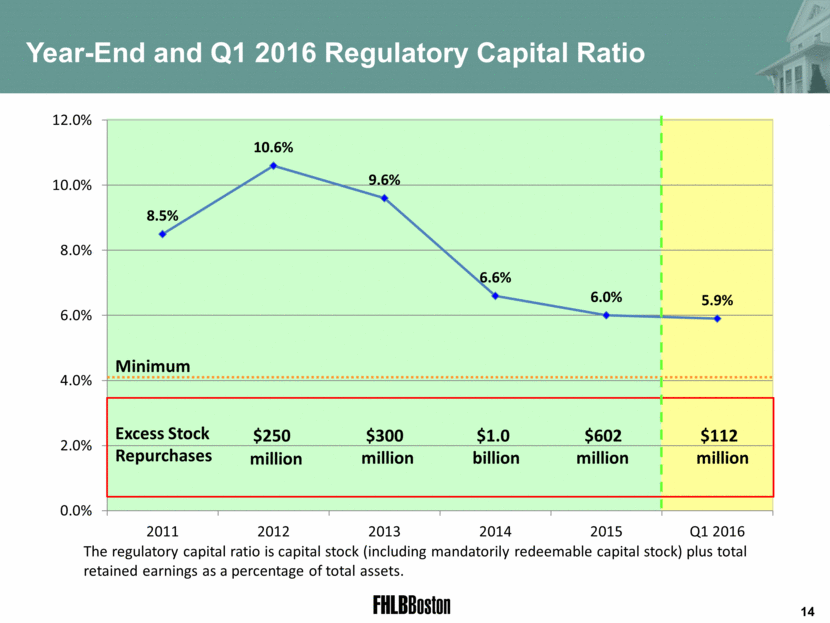
The regulatory capital ratio is capital stock (including mandatorily redeemable capital stock) plus total retained earnings as a percentage of total assets. Year-End and Q1 2016 Regulatory Capital Ratio Minimum 14 Excess Stock Repurchases
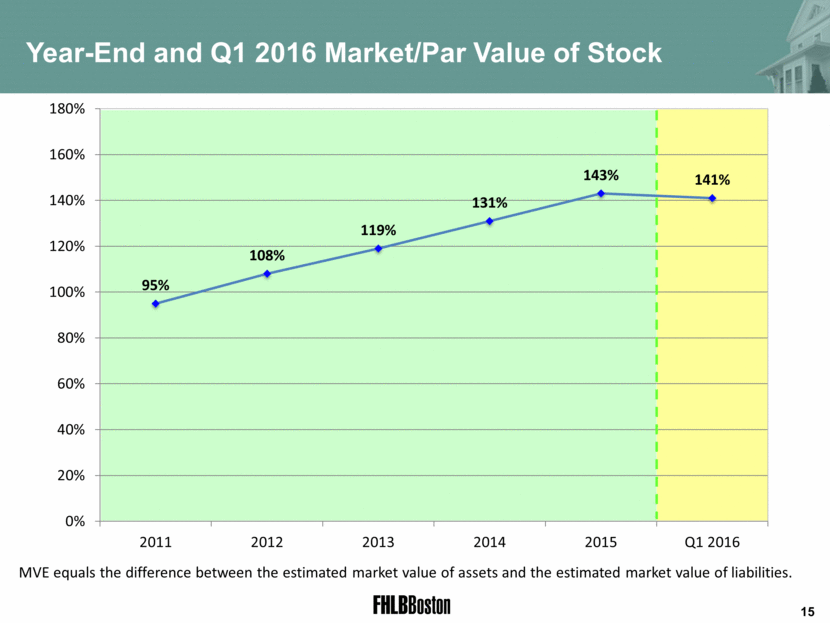
Year-End and Q1 2016 Market/Par Value of Stock MVE equals the difference between the estimated market value of assets and the estimated market value of liabilities. 15
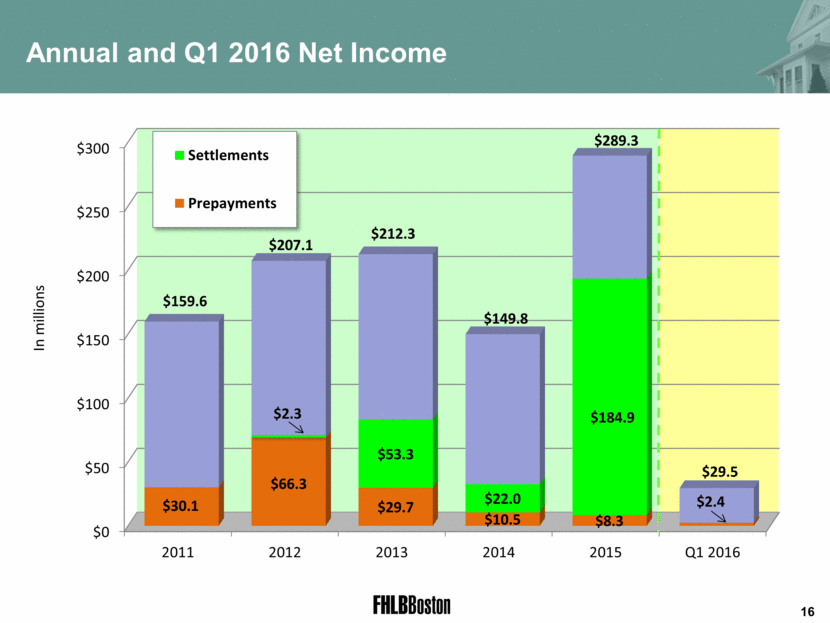
Annual and Q1 2016 Net Income In millions 16 $184.9 $0 $50 $100 $150 $200 $250 $300 2011 2012 2013 2014 2015 Q1 2016 $30.1 $66.3 $29.7 $10.5 $8.3 $2.4 $ 53.3 $ 22.0 $2.3 $159.6 $207.1 $212.3 $149.8 $289.3 $29.5 Settlements Prepayments
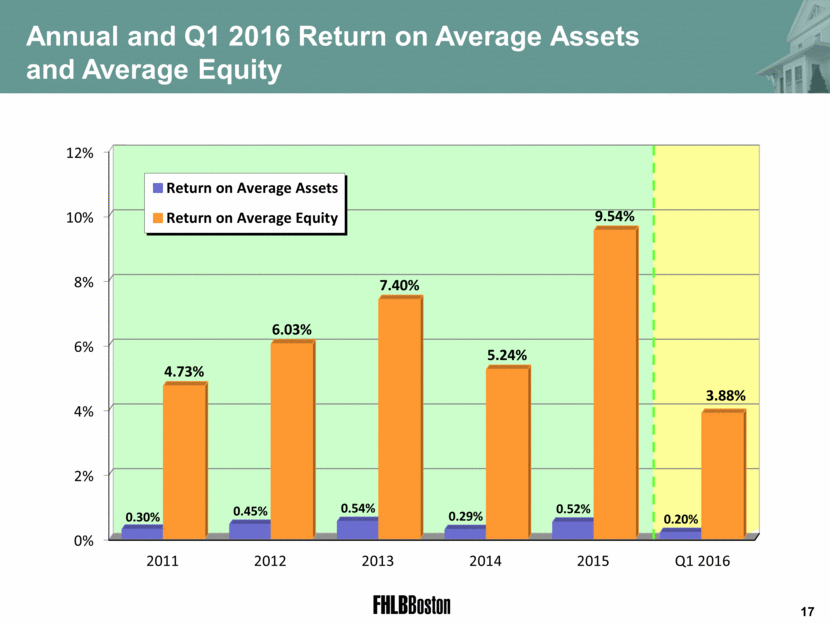
Annual and Q1 2016 Return on Average Assets and Average Equity 17 0% 2% 4% 6% 8% 10% 12% 2011 2012 2013 2014 2015 Q1 2016 0.30% 0.45% 0.54% 0.29% 0.52% 0.20% 4.73% 6.03% 7.40% 5.24% 9.54% 3.88% Return on Average Assets Return on Average Equity
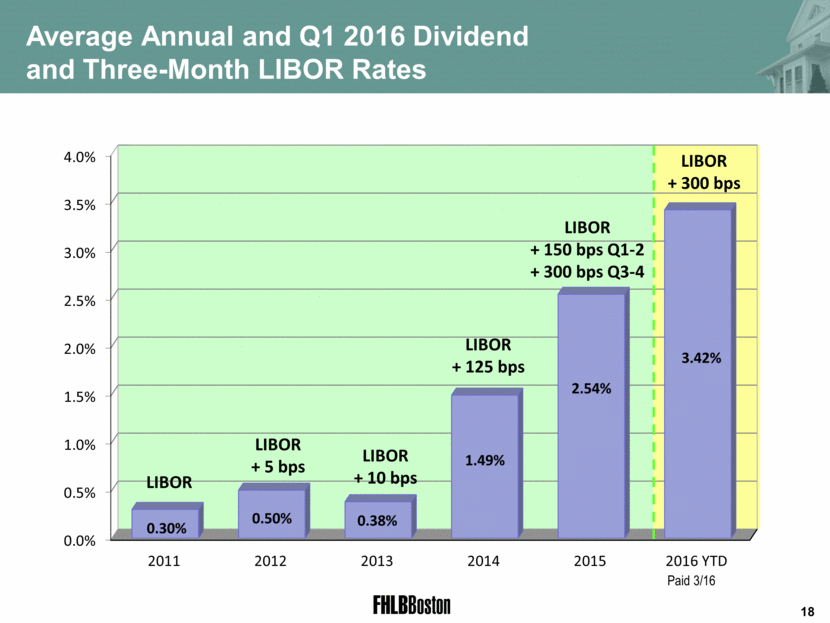
Average Annual and Q1 2016 Dividend and Three-Month LIBOR Rates 18 LIBOR LIBOR + 5 bps LIBOR + 10 bps LIBOR + 125 bps LIBOR + 150 bps Q1-2 + 300 bps Q3-4 LIBOR + 300 bps Paid 3/16 0.0% 0.5% 1.0% 1.5% 2.0% 2.5% 3.0% 3.5% 4.0% 2011 2012 2013 2014 2015 2016 YTD 0.30% 0.50% 0.38% 1.49% 2.54% 3.42%
Regulatory and Legislative Update
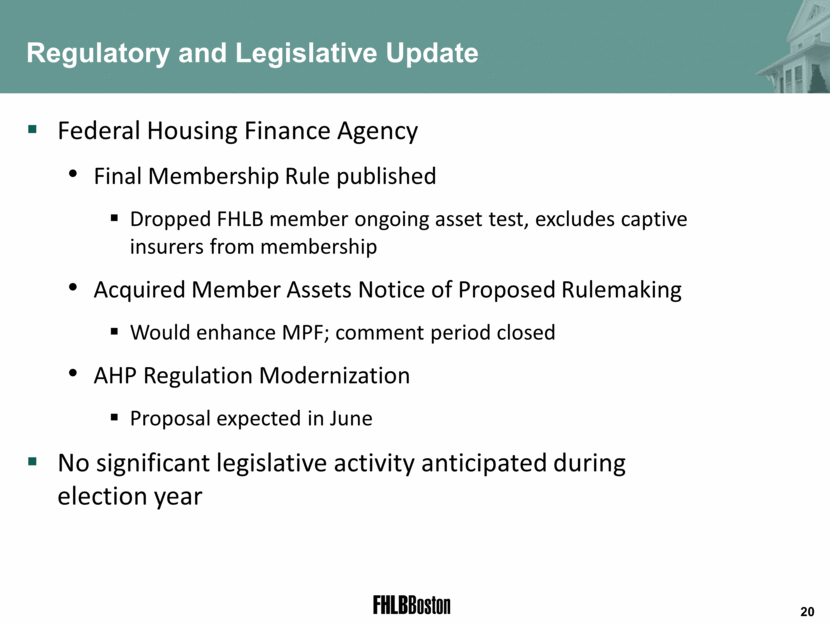
20 Regulatory and Legislative Update Federal Housing Finance Agency Final Membership Rule published Dropped FHLB member ongoing asset test, excludes captive insurers from membership Acquired Member Assets Notice of Proposed Rulemaking Would enhance MPF; comment period closed AHP Regulation Modernization Proposal expected in June No significant legislative activity anticipated during election year
2015 Highlights
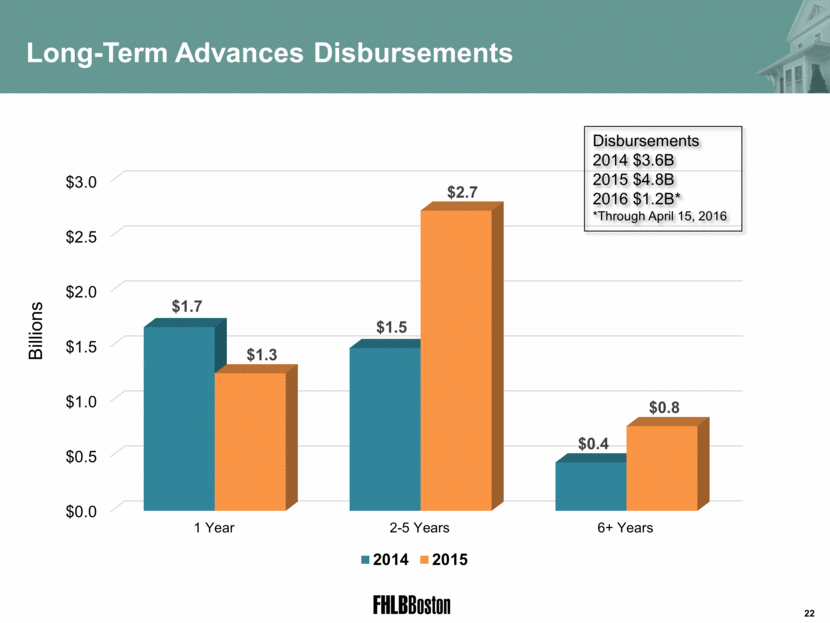
22 Long-Term Advances Disbursements Disbursements 2014 $3.6B 2015 $4.8B 2016 $1.2B* *Through April 15, 2016 Billions $0.0 $0.5 $1.0 $1.5 $2.0 $2.5 $3.0 1 Year 2-5 Years 6+ Years $1.7 $1.5 $0.4 $1.3 $2.7 $0.8 2014 2015
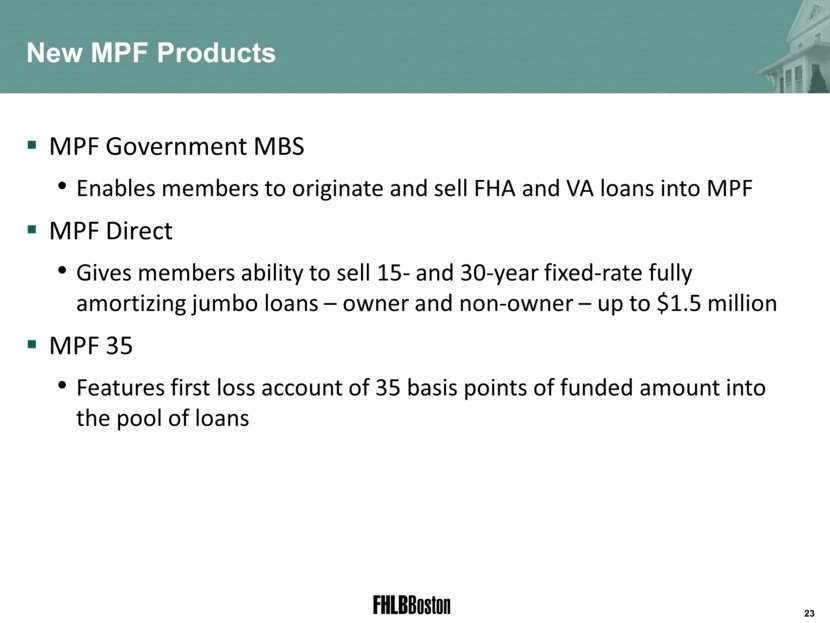
MPF Government MBS Enables members to originate and sell FHA and VA loans into MPF MPF Direct Gives members ability to sell 15- and 30-year fixed-rate fully amortizing jumbo loans – owner and non-owner – up to $1.5 million MPF 35 Features first loss account of 35 basis points of funded amount into the pool of loans New MPF Products 23
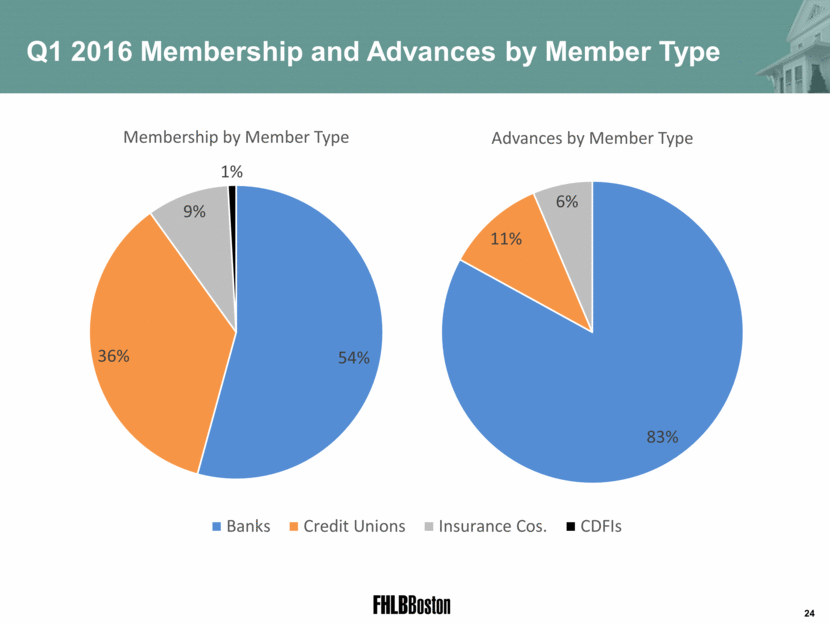
Long-Term Advances Disbursements 24 Q1 2016 Membership and Advances by Member Type 54% 36% 9% 1% Q1 2016 Banks Credit Unions Insurance Cos. CDFIs 54% 36% 9% 1% Membership by Member Type 83% 11% 6% Advances by Member Type
25 Introducing
26 Introducing Two New Programs Finances small business and overall economic development via members Supports affordable housing via New England’s Housing Finance Agencies Commits up to $30 million in interest-rate subsidies over a three-year period
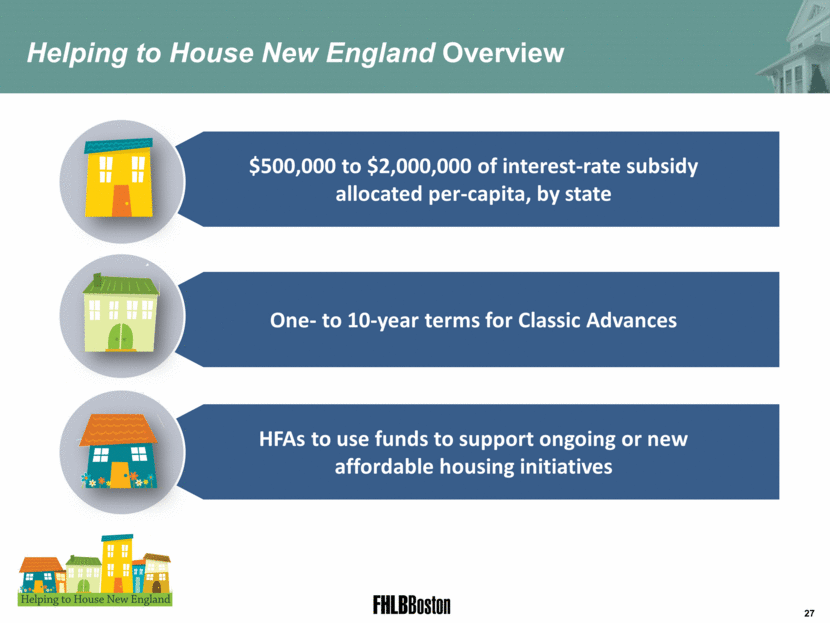
27 Helping to House New England Overview $500,000 to $2,000,000 of interest-rate subsidy allocated per-capita, by state One- to 10-year terms for Classic Advances HFAs to use funds to support ongoing or new affordable housing initiatives
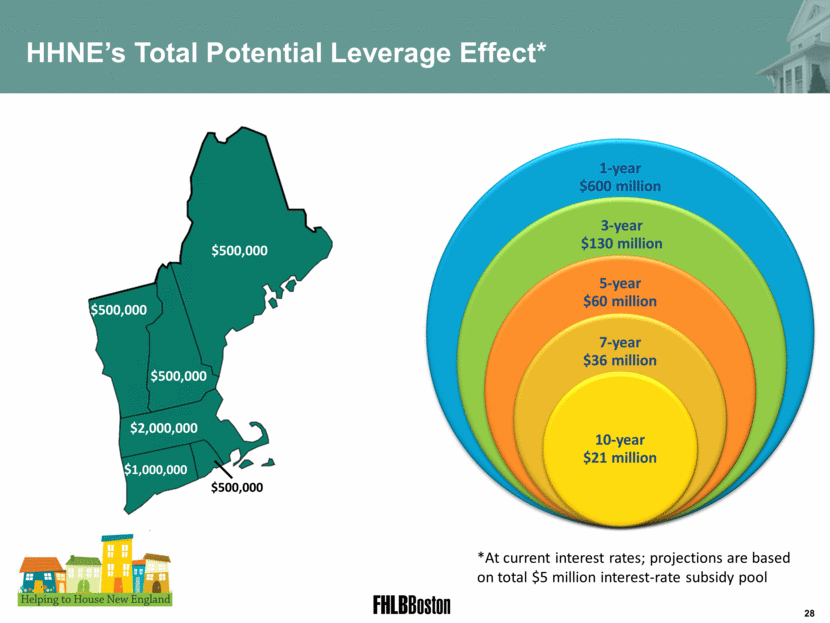
28 HHNE’s Total Potential Leverage Effect* *At current interest rates; projections are based on total $5 million interest-rate subsidy pool $500,000 $500,000 $500,000 $1,000,000 $2,000,000 $500,000 1-year $600 million 3-year $130 million 5-year $60 million 7-year $36 million 10-year $21 million
Jobs for New England Overview 29 $250,000 in subsidy available to members on first-come, first-served basis Up to $5 million in interest-rate subsidy per year through 2018 Zero-percent interest rate to members for low-interest loans to small businesses
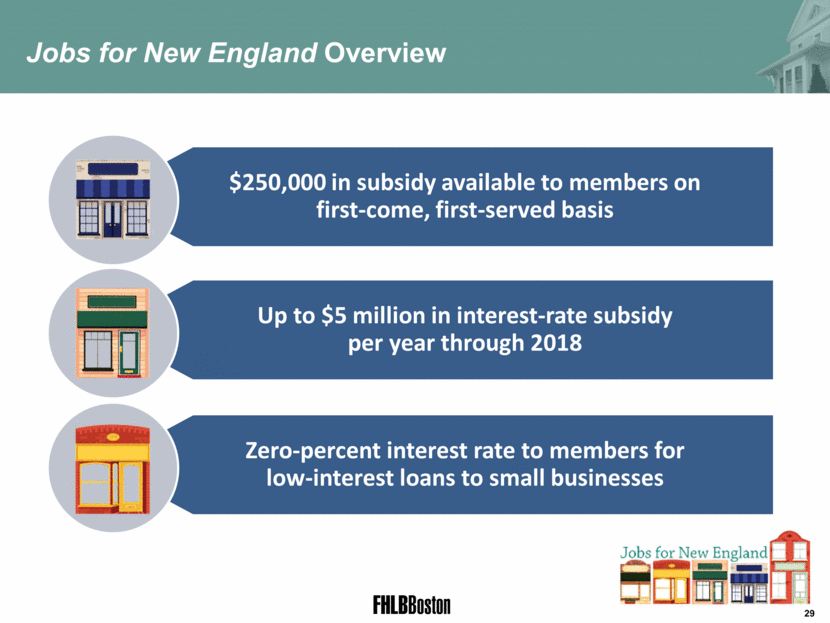
30 JNE’s Potential Leverage Effect* of $250 Thousand Maximum Subsidy Per Member *At current interest rates; projections are based on $250,000 interest-rate subsidy 1-year $30 million 3-year $6.5 million 5-year $3 million 7-year $1.8 million 10-year $1.1 million
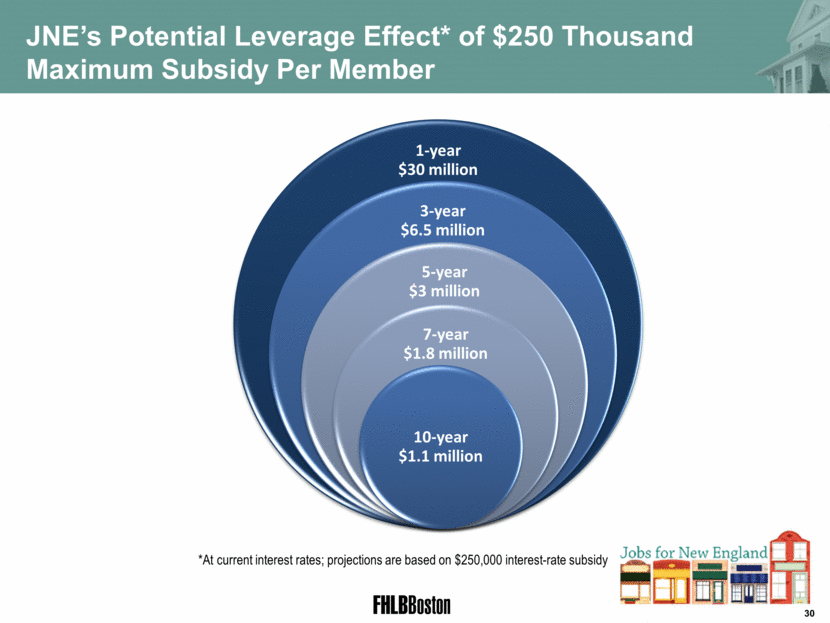
31 Utilization of Program Funds New Hampshire Housing Finance Authority supporting financing for rental housing 5-year, $7 million advance with $497,524 subsidy • serving families and individuals at or below 80% AMI • Rhode Island – Four diversity-owned small businesses (fabrics, glassmaker, pharmaceutical, and pet food) 3-year, $7.75 million advance with $250,000 subsidy • 14 new jobs • Vermont – Brewing facility expansion 5-year, $350,000 advance with $25,521 subsidy • 4 new jobs • 12 jobs preserved •
Opening doors Opening doors

Homeownership Opening doors Senior Housing Affordable Housing

Cutting-edge infrastructure Opening doors

Opportunity Business expansion Opening doors

Community landmarks Opening doors

communities strong Opening doors educated, healthy,

We are your reliable business partner, providing the liquidity, funding, and solutions you need in all economic environments. Together, we help build communities throughout New England. We continue to provide an attractive and stable return on your investment. Make the most of your membership, and open more doors in the communities you serve. Thank you for your business and support! Let’s Open More Doors Together 38
83rd Annual Shareholders Meeting April 22, 2016

