Attached files
| file | filename |
|---|---|
| EX-99.1 - EXHIBIT 99.1 - Ameris Bancorp | v437642_ex99-1.htm |
| 8-K - FORM 8-K - Ameris Bancorp | v437642_8k.htm |
Exhibit 99.2

Ameris Bancorp 1 st Quarter 2016 Earnings Presentation Edwin W. Hortman, Jr. – President & CEO Dennis J. Zember, Jr. – EVP & CFO

This presentation contains certain performance measures determined by methods other than in accordance with accounting principles generally accepted in the United States of America (“GAAP”) . Management of Ameris Bancorp (the “Company”) uses these non - GAAP measures in its analysis of the Company’s performance . These measures are useful when evaluating the underlying performance and efficiency of the Company’s operations and balance sheet . The Company’s management believes that these non - GAAP measures provide a greater understanding of ongoing operations, enhance comparability of results with prior periods and demonstrate the effects of significant gains and charges in the current period . The Company’s management believes that investors may use these non - GAAP financial measures to evaluate the Company’s financial performance without the impact of unusual items that may obscure trends in the Company’s underlying performance . These disclosures should not be viewed as a substitute for financial measures determined in accordance with GAAP, nor are they necessarily comparable to non - GAAP performance measures that may be presented by other companies . Tangible common equity and Tier 1 capital ratios are non - GAAP measures . The Company calculates the Tier 1 capital using current call report instructions . The Company’s management uses these measures to assess the quality of capital and believes that investors may find them useful in their evaluation of the Company . These capital measures may, or may not be necessarily comparable to similar capital measures that may be presented by other companies . This presentation may contain statements that constitute “forward - looking statements” within the meaning of Section 27 A of the Securities Act of 1933 , as amended, and Section 21 E of the Securities Exchange Act of 1934 , as amended . The words “believe”, “estimate”, “expect”, “intend”, “anticipate” and similar expressions and variations thereof identify certain of such forward - looking statements, which speak only as of the dates which they were made . The Company undertakes no obligation to publicly update or revise any forward - looking statements, whether as a result of new information, future events or otherwise . Readers are cautioned that any such forward - looking statements are not guarantees of future performance and involve risks and uncertainties and that actual results may differ materially from those indicated in the forward - looking statements as a result of various factors . Readers are cautioned not to place undue reliance on these forward - looking statements and are referred to the Company’s periodic filings with the Securities and Exchange Commission for a summary of certain factors that may impact the Company’s results of operations and financial condition . Cautionary Statements

Corporate Profile • Founded in Moultrie, Georgia in 1971 • Executive team headquartered in Jacksonville, Florida. • Completed 17 acquisitions in the last decade, building a material presence in strong southeastern markets. • Four state footprint with 103 offices • $6.1 billion in total assets managed by 1,318 employees • Ticker Symbol – “ABCB” followed by 6 analysts 3

Almost singular focus of our team right now is “to produce top quartile operating results, consistently . ” • Maintain double digit revenue growth with 12 % - 15 % growth in loans, funded almost entirely with low cost deposits augmented by highly profitable and growing lines of business (Mortgage, SBA and Treasury) • Expense management aimed at producing low single digit growth rates in operating expenses . Continued corporate restructure, branch consolidations with better administrative efficiency until we achieve our efficiency ratio goals . Current Focus Improved and More Consistent Operating Performance M&A Opportunities Still looking at M&A opportunities but being highly selective discipline regarding our three criteria : • Neutral (or almost neutral) to TBV • Accretive to our franchise • Meaningfully accretive to EPS (relative to size of acquisition) Anticipate growing through $ 10 billion hurdle with a combination of organic growth and M&A . Refine an Already Strong Balance Sheet • Building significant diversification into our Balance sheet with focus on asset classes with lower long term loss rates . • Insulate ourselves from rate movements and economic swings with highly stable, non - rate sensitive deposits . • Grow capital levels and book value through higher than average ROAs and ROTCE .

• Operating Return on Average Assets of 1 . 18 % • Operating Return on Tangible Capital of 15 . 42 % . • Net Interest Margin of 3 . 80 % excluding accretion . Accretion income only 3 . 9 % of total revenue . • Making Headway on Operating Efficiency : – Net Overhead Ratio down to 1 . 78 % , from 2 . 12 % a year ago . Incremental net overhead over the last 12 months totaled only $ 1 . 7 million despite 38 % growth in average assets (or $ 1 . 54 billion of growth) . – Operating efficiency of 65 . 9 % in the first quarter of 2016 compared to 72 . 4 % in the first quarter of 2015 . Executive Summary – 1Q 2016 Operating Ratios in the top Quartile M&A Opportunities • M&A conversations are ongoing and we are confident that there will be opportunities in 2016 . Momentum going into 2Q 2016 • Commercial loan pipelines at the highest levels . Pricing is consistent . Credit underwriting metrics unchanged . • Retail Mortgage and Warehouse lending built strong trends during last month of 1 Q . • Treasury and Retail produced $ 72 . 5 million of growth in NIB . Funded 63 % of our all loan growth, including mortgage pools .

1 st Quarter Operating Results First Quarter 2016 Results • 33 % growth in spread income results from successful deployment of liquidity from 2015 M&A and organic growth . • Steady levels of accretion income despite increasingly small percentage of revenue and EPS . • Total credit costs inside our forecast for 3 consecutive quarters . • Non - interest income stronger on mortgage and SBA revenues . • OPEX down $ 2 . 0 million versus linked quarter . Up 21 % compared to 1 Q 15 compared to 32 % growth in total revenue . • Effective tax rate increased to 33 . 7 % compared to 32 . 7 % in the same quarter 2015 . Net Income, operating basis 1Q 16 4Q 15 1Q 15 Linked Q 1Q 15 Net Interest Income, before Accretion 47,494 45,706 35,735 3.9% 32.9% Accretion Income 2,942 2,912 3,097 1.0% -5.0% Net Interest income 50,436 48,618 38,832 3.7% 29.9% Provision for loan losses 681 553 1,069 23.1% -36.3% Non-interest Income 24,286 22,407 17,575 8.4% 38.2% Non-interest expense, operating 49,241 51,221 40,812 -3.9% 20.7% Pretax Income 24,800 19,251 14,526 28.8% 70.7% Taxes 8,350 3,928 4,752 112.5% 75.7% Net Income, operating basis 16,450 15,323 9,774 7.4% 68.3% EPS 0.50$ 0.47$ 0.32$ ROA 1.18% 1.13% 0.96% ROTCE 15.42% 15.10% 10.26% Net Interest Margin 4.03% 3.98% 4.39% Net Interest Margin, ex accretion 3.80% 3.74% 4.05% Net Overhead Ratio 1.78% 2.12% 2.28% Efficiency ratio, operating 65.90% 72.12% 72.35% Effective Tax Rate 33.7% 20.4% 32.7% Average Diluted Shares 33,054 32,595 30,796 Note > Amounts above and all ratios are presented on an operating basis excluding charges shown below. Non-Operating Amounts 1Q 16 4Q 15 1Q 15 Merger/Conversion Related Charges 6,359 1,807 15 Credit Related Charge - - Tax Effect (2,226) (632) (5) Total Non-Operating Impact on Earnings 4,133 1,175 10 EPS, Reported 0.37$ 0.43$ 0.32$ 1Q 2016 Highlights Change versus:

Revenues – 1Q16 Spread revenue improved 30 % over 1 Q 15 . • Spread income and Margin upside – 32 % of earning assets yielding 3 . 00 % or less compared to quarterly loan production levels of approximately 4 . 42 % . • 3 . 29 % - Incremental margin (growth in spread compared to growth in earning assets) for last 12 months represents a concentration in mortgage pools as a short - term strategy . Very low incremental overhead associated with the earning asset growth over last 12 months . • 1 Q 16 Accretion income of $ 2 . 9 million vs . $ 3 . 0 million in 1 Q 15 and $ 2 . 9 million in 4 Q 15 . Non - Interest Income moved higher with Mortgage • Mortgage Revenues up 19 % over 4 Q 15 and up 26 % over 1 Q 15 . 1 Q 16 mortgage production totaled $ 268 million compared to $ 254 million in 4 Q 15 and $ 188 million in 1 Q 15 . • Gain on sale margins improved to 410 bps in 1 Q 16 . • Implementing new service charge routines that should impact deposit charges in 2 H 16 . Strong Growth in Revenue $47.6 $48.9 $54.6 $53.6 $53.8 $59.3 $69.7 $68.9 $72.5 $20.0 $40.0 $60.0 $80.0 1Q 14 2Q 14 3Q 14 4Q 14 1Q 15 2Q 15 3Q 15 4Q 15 1Q 16 Total Quarterly Revenue (in millions)
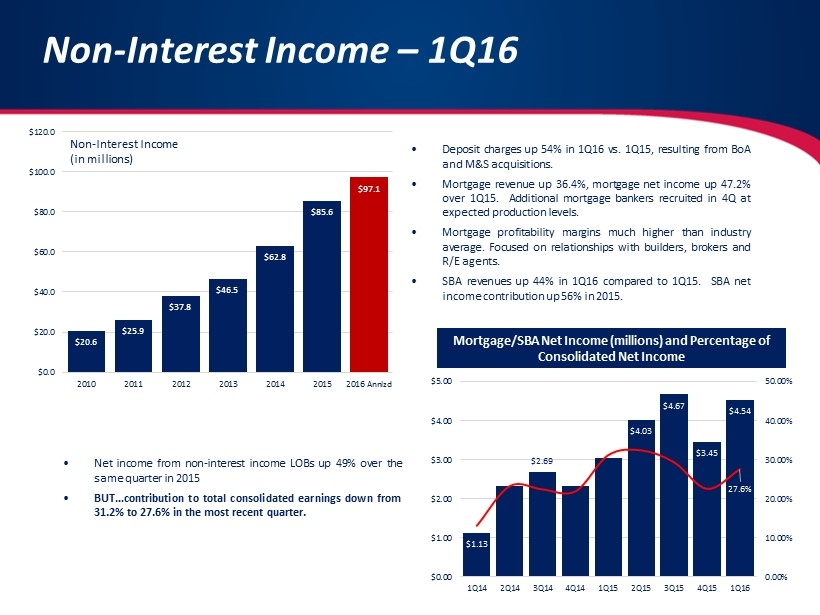
Non - Interest Income – 1Q16 • Deposit charges up 54 % in 1 Q 16 vs . 1 Q 15 , resulting from BoA and M&S acquisitions . • Mortgage revenue up 36 . 4 % , mortgage net income up 47 . 2 % over 1 Q 15 . Additional mortgage bankers recruited in 4 Q at expected production levels . • Mortgage profitability margins much higher than industry average . Focused on relationships with builders, brokers and R/E agents . • SBA revenues up 44 % in 1 Q 16 compared to 1 Q 15 . SBA net income contribution up 56 % in 2015 . $20.6 $25.9 $37.8 $46.5 $62.8 $85.6 $97.1 $0.0 $20.0 $40.0 $60.0 $80.0 $100.0 $120.0 2010 2011 2012 2013 2014 2015 2016 Annlzd Non - Interest Income (in millions) $1.13 $2.69 $4.03 $4.67 $3.45 $4.54 27.6% 0.00% 10.00% 20.00% 30.00% 40.00% 50.00% $0.00 $1.00 $2.00 $3.00 $4.00 $5.00 1Q14 2Q14 3Q14 4Q14 1Q15 2Q15 3Q15 4Q15 1Q16 Mortgage/SBA Net Income (millions) and Percentage of Consolidated Net Income • Net income from non - interest income LOBs up 49 % over the same quarter in 2015 • BUT … contribution to total consolidated earnings down from 31 . 2 % to 27 . 6 % in the most recent quarter .

Mortgage Results – 1Q16 Mortgage Division Statistics ($’ in 000’s) 1Q16 4Q15 3Q15 2Q15 1Q15 Mortgage Origination Production $268,639 $254,237 $311,007 $285,626 $188,297 Open Pipeline (locked loans) $135,600 $94,478 $105,290 $115,888 $110,856 Purchase % 83% 84% 86% 79% 75% FHA/VA % 41% 41% 43% 43% 43% Gain on Sale % 4.10% 3.55% 3.52% 3.76% 4.57% Retail Mortgage Bankers 95 96 91 75 64 Avg Production / Banker $ 2,401 $ 2,284 $ 2,884 $ 3,037 $ 2,432 Net Income / Banker $ 31.34 $ 20.75 $ 34.15 $ 29.96 $ 30.08 Warehouse Lending Production $ 565,207 $ 490,321 $ 521,901 $ 551,398 $ 404,702 Units (# of loans) 2,579 2,350 2,481 2,507 1,868 Number of customers 84 72 76 76 74 Approved Lines of Credit $ 340,000 $ 230,000 $ 227,500 $ 227,000 $ 196,000 Average days to roll 12 15 13 14 13 Portfolio Lending Portfolio Size $ 133,754 $ 108,233 $ 87,331 $ 68,154 $ 54,929 Portfolio Yield 4.59% 4.62% 4.64% 4.59% 4.57% Average loan size $ 247,692 $ 240,517 $ 236,029 $ 231,030 $ 230,793 • Origination volumes up 42 % compared to same quarter in 2015 . • Open pipeline up 22 % compared to same quarter in 2015 . • Growth in production and pipelines compared to same quarter in 2015 gives us confidence in mortgage’s contribution to our 2016 earnings . • Approved LOCs in Warehouse lending increased substantially in 1 Q . Expect volume in 2 q and 3 q to benefit materially from additional customers .

Expenses – 1Q16 • Expense leverage is our management team’s primary focus in 2016 . • Lower OPEX at Bank level result of branch closures, lower FDIC amortization, lower R&M, lower incentive compensation . • Expect FICA expense to be $ 700 k lower in 2 Q . • FDIC indemnification expense of $ 0 . 8 million in 1 Q 16 expected to drop to approx . $ 0 . 2 mm per quarter in 2 H 2016 . • Two additional branches expected to close in 2 Q 16 . • Additional branch consolidation being investigated as well as for 2 H 2016 . 1 – Core operating expenses exclude Problem loan and OREO costs as well as merger - related charges Opex Trending Lower $25.8 $24.9 $27.7 $29.4 $30.7 $31.1 $38.6 $40.2 $38.2 $4.8 $6.7 $7.1 $7.0 $7.0 $8.9 $8.7 $8.8 $9.2 $0.0 $10.0 $20.0 $30.0 $40.0 $50.0 1Q 14 3Q 14 1Q 15 3Q 15 1Q 16 Core Operating Expenses (in millions) Bank Level OPEX LOB OPEX

Loans – 1Q16 Total Loan Growth of $ 522 . 2 million against linked quarter from : • Organic Growth during 1 Q 16 of $ 59 million or 7 . 4 % annualized • Growth of $ 63 million related to purchased whole loan mortgage pools . Pools currently paying on about a 3 . 1 yr . avg . life . • Acquisition of JAXB with $ 420 million of loans • Payoffs of $ 7 million 1 – PNC – purchased, non - covered loans. 2 – combined yield includes transaction fees and interest earned. 12 . 1 % - Growth rate in organic loans over the last four quarters . $ 322 million – amount of organic loan growth over last 12 months . $ 7 million – Quarterly decline in covered loans in 1 Q 16 . Smallest decline in past 5 years, consistent with management forecasts . Loan Production Details Period Fixed Rate (2) Variable Rate (2) Total 1Q16 255,944 4.44% 160,625 4.39% 416,569 4.42% 4Q15 225,349 4.59% 158,750 4.28% 384,099 4.46% 3Q15 232,901 4.65% 117,563 4.48% 350,464 4.59% 2Q15 256,734 4.51% 106,376 4.44% 363,110 4.49% 1Q15 210,514 4.65% 103,799 4.73% 314,312 4.68% $2.78 $2.81 $2.81 $2.87 $3.44 $3.64 $3.89 $4.44 $1.0 $2.0 $3.0 $4.0 $5.0 2Q 14 3Q 14 4Q 14 1Q 15 2Q 15 3Q 15 4Q 15 1Q 16 Total Loans Oustanding (in billions)

Deposits – 1Q16 • 101 % - Percentage of all fixed rate loans (including short - duration mortgage arms) funded with non - rate sensitive deposits at 12 / 31 / 15 (up from 96 . 0 % at EOY 2014 ) . • $ 1 . 01 Billion – Growth in low cost, non - rate sensitive deposits in during 2015 . • 23 . 6 % – 5 Year Compounded Growth Rate in low cost, non - rate sensitive deposits . Non - Rate Sensitive Deposits include NIB, NOW and Savings Accounts. 47.1% 50.4% 50.4% 49.7% 51.1% 53.2% 53.4% 53.7% 54.9% 57.8% 44% 48% 52% 56% 60% 3Q 13 4Q 13 1Q 14 2Q 14 3Q 14 4Q 14 1Q 15 2Q 15 3Q 15 4Q 15 Non - Rate Sensitive Deposits as a % of Total Deposits • 0 . 075 % – weighted average cost of this group of low cost, non - rate sensitive deposits (down from 0 . 102 % a year ago) .

Tangible Book Value – 1Q16 • Last 3 M&A deals have been neutral or accretive to TBV • Earnings less quarterly dividend grows TBV approximately 3.5% - 4.0% per quarter. Consistent Growth in TBV $10.26 $10.68 $10.99 $13.01 $11.81 $12.31 $12.65 $13.13 $7.00 $9.00 $11.00 $13.00 $15.00 2Q 14 3Q 14 4Q 14 1Q 15 2Q 15 3Q 15 4Q 15 1Q 16 Tangible Book Value

• Diversified loan portfolio . Approximately 42 % in CRE and only 8 % in Construction/A&D • Asset sensitive – over 100 % of fixed rate loans funded with non - rate sensitive deposits . • Capital levels – capital levels are adequate and building, ensuring no need for additional outside capital . Investment Rationale Strong & Stable Balance Sheet • Top Quartile ROA – Top Quartile Growth Rate • ROTCE greater than 15 % . • Diversified revenue sources ( 66 % spread, 34 % non - interest income) . Operating Performance M&A Opportunities • Disciplined Acquirer • Announced/Executed low risk deals • Enough conversations underway – can avoid auctions • Strong Capital Ratios support additional M&A • Regulatory reputation presents no hurdle