Attached files
| file | filename |
|---|---|
| 8-K - FORM 8-K - Virtu KCG Holdings LLC | d73899d8k.htm |
| EX-99.1 - EX-99.1 - Virtu KCG Holdings LLC | d73899dex991.htm |
KCG Holdings, Inc. (KCG) 1st Quarter 2016 Earnings Presentation April 21, 2016 Exhibit 99.2
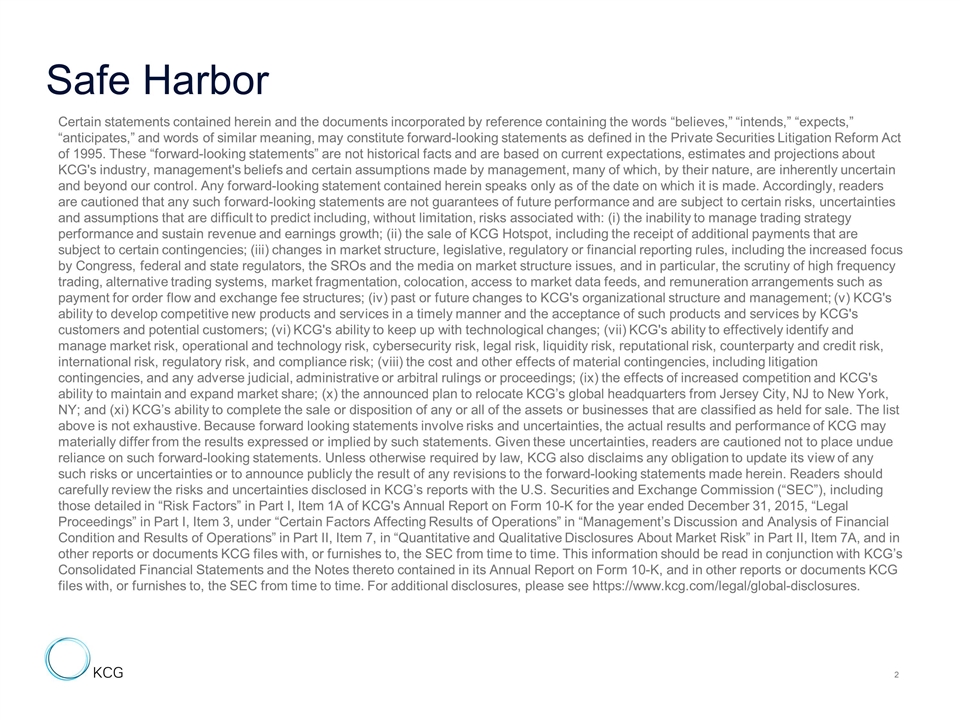
Safe Harbor Certain statements contained herein and the documents incorporated by reference containing the words “believes,” “intends,” “expects,” “anticipates,” and words of similar meaning, may constitute forward-looking statements as defined in the Private Securities Litigation Reform Act of 1995. These “forward-looking statements” are not historical facts and are based on current expectations, estimates and projections about KCG's industry, management's beliefs and certain assumptions made by management, many of which, by their nature, are inherently uncertain and beyond our control. Any forward-looking statement contained herein speaks only as of the date on which it is made. Accordingly, readers are cautioned that any such forward-looking statements are not guarantees of future performance and are subject to certain risks, uncertainties and assumptions that are difficult to predict including, without limitation, risks associated with: (i) the inability to manage trading strategy performance and sustain revenue and earnings growth; (ii) the sale of KCG Hotspot, including the receipt of additional payments that are subject to certain contingencies; (iii) changes in market structure, legislative, regulatory or financial reporting rules, including the increased focus by Congress, federal and state regulators, the SROs and the media on market structure issues, and in particular, the scrutiny of high frequency trading, alternative trading systems, market fragmentation, colocation, access to market data feeds, and remuneration arrangements such as payment for order flow and exchange fee structures; (iv) past or future changes to KCG's organizational structure and management; (v) KCG's ability to develop competitive new products and services in a timely manner and the acceptance of such products and services by KCG's customers and potential customers; (vi) KCG's ability to keep up with technological changes; (vii) KCG's ability to effectively identify and manage market risk, operational and technology risk, cybersecurity risk, legal risk, liquidity risk, reputational risk, counterparty and credit risk, international risk, regulatory risk, and compliance risk; (viii) the cost and other effects of material contingencies, including litigation contingencies, and any adverse judicial, administrative or arbitral rulings or proceedings; (ix) the effects of increased competition and KCG's ability to maintain and expand market share; (x) the announced plan to relocate KCG’s global headquarters from Jersey City, NJ to New York, NY; and (xi) KCG’s ability to complete the sale or disposition of any or all of the assets or businesses that are classified as held for sale. The list above is not exhaustive. Because forward looking statements involve risks and uncertainties, the actual results and performance of KCG may materially differ from the results expressed or implied by such statements. Given these uncertainties, readers are cautioned not to place undue reliance on such forward-looking statements. Unless otherwise required by law, KCG also disclaims any obligation to update its view of any such risks or uncertainties or to announce publicly the result of any revisions to the forward-looking statements made herein. Readers should carefully review the risks and uncertainties disclosed in KCG’s reports with the U.S. Securities and Exchange Commission (“SEC”), including those detailed in “Risk Factors” in Part I, Item 1A of KCG's Annual Report on Form 10-K for the year ended December 31, 2015, “Legal Proceedings” in Part I, Item 3, under “Certain Factors Affecting Results of Operations” in “Management’s Discussion and Analysis of Financial Condition and Results of Operations” in Part II, Item 7, in “Quantitative and Qualitative Disclosures About Market Risk” in Part II, Item 7A, and in other reports or documents KCG files with, or furnishes to, the SEC from time to time. This information should be read in conjunction with KCG’s Consolidated Financial Statements and the Notes thereto contained in its Annual Report on Form 10-K, and in other reports or documents KCG files with, or furnishes to, the SEC from time to time. For additional disclosures, please see https://www.kcg.com/legal/global-disclosures.
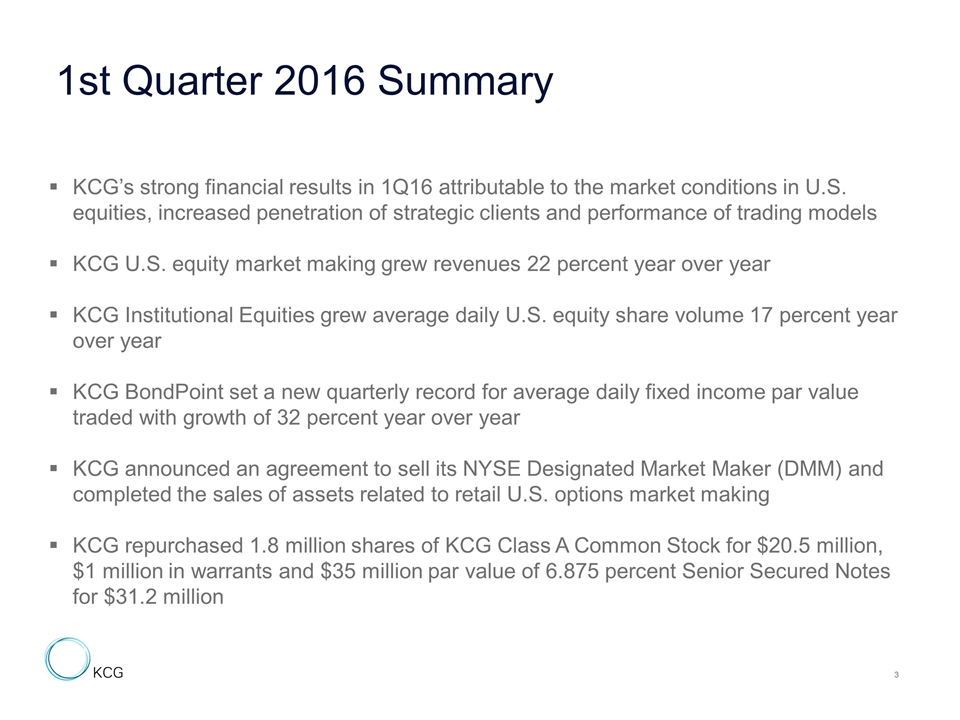
KCG’s strong financial results in 1Q16 attributable to the market conditions in U.S. equities, increased penetration of strategic clients and performance of trading models KCG U.S. equity market making grew revenues 22 percent year over year KCG Institutional Equities grew average daily U.S. equity share volume 17 percent year over year KCG BondPoint set a new quarterly record for average daily fixed income par value traded with growth of 32 percent year over year KCG announced an agreement to sell its NYSE Designated Market Maker (DMM) and completed the sales of assets related to retail U.S. options market making KCG repurchased 1.8 million shares of KCG Class A Common Stock for $20.5 million, $1 million in warrants and $35 million par value of 6.875 percent Senior Secured Notes for $31.2 million 1st Quarter 2016 Summary
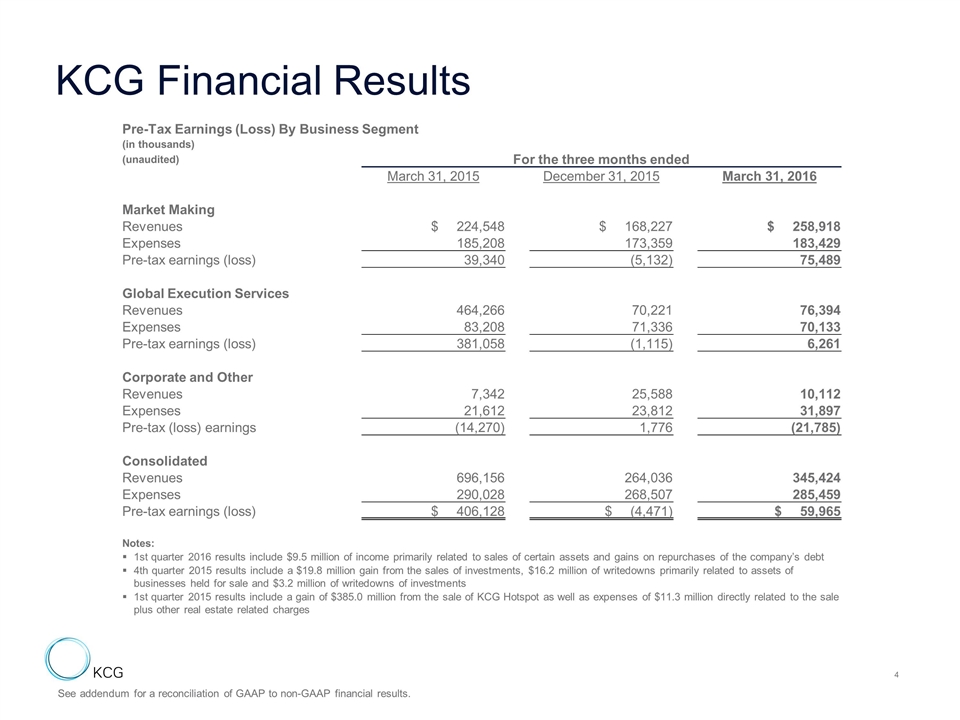
KCG Financial Results Pre-Tax Earnings (Loss) By Business Segment (in thousands) (unaudited) For the three months ended March 31, 2015 December 31, 2015 March 31, 2016 Market Making Revenues $ 224,548 $ 168,227 $ 258,918 Expenses 185,208 173,359 183,429 Pre-tax earnings (loss) 39,340 (5,132) 75,489 Global Execution Services Revenues 464,266 70,221 76,394 Expenses 83,208 71,336 70,133 Pre-tax earnings (loss) 381,058 (1,115) 6,261 Corporate and Other Revenues 7,342 25,588 10,112 Expenses 21,612 23,812 31,897 Pre-tax (loss) earnings (14,270) 1,776 (21,785) Consolidated Revenues 696,156 264,036 345,424 Expenses 290,028 268,507 285,459 Pre-tax earnings (loss) $ 406,128 $ (4,471) $ 59,965 Notes: 1st quarter 2016 results include $9.5 million of income primarily related to sales of certain assets and gains on repurchases of the company’s debt 4th quarter 2015 results include a $19.8 million gain from the sales of investments, $16.2 million of writedowns primarily related to assets of businesses held for sale and $3.2 million of writedowns of investments 1st quarter 2015 results include a gain of $385.0 million from the sale of KCG Hotspot as well as expenses of $11.3 million directly related to the sale plus other real estate related charges See addendum for a reconciliation of GAAP to non-GAAP financial results.
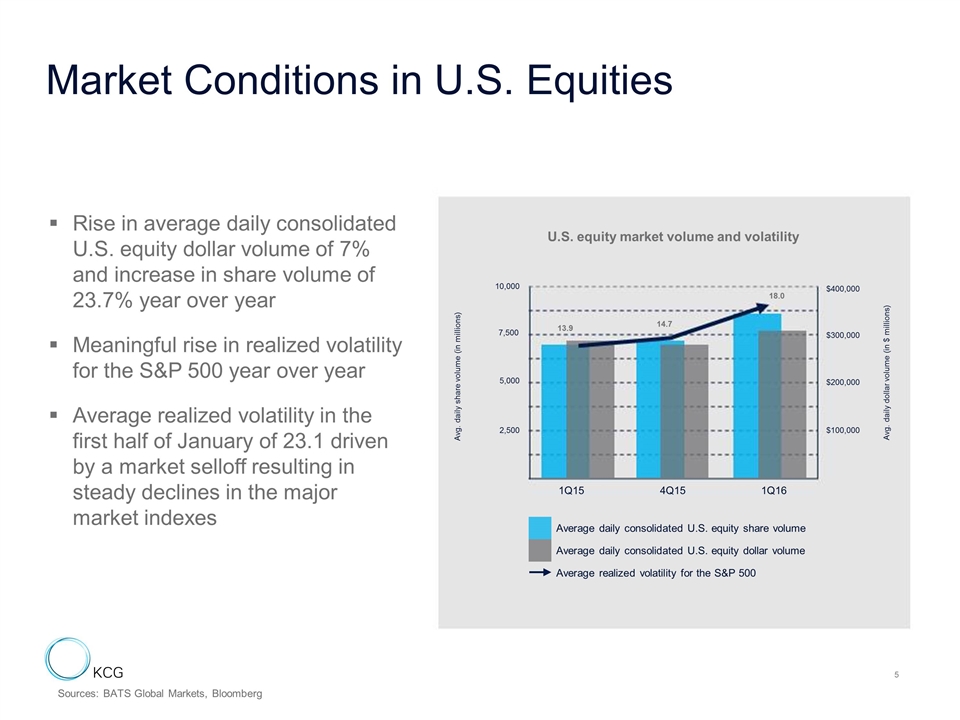
Market Conditions in U.S. Equities Rise in average daily consolidated U.S. equity dollar volume of 7% and increase in share volume of 23.7% year over year Meaningful rise in realized volatility for the S&P 500 year over year Average realized volatility in the first half of January of 23.1 driven by a market selloff resulting in steady declines in the major market indexes Sources: BATS Global Markets, Bloomberg Average daily consolidated U.S. equity share volume Average daily consolidated U.S. equity dollar volume Average realized volatility for the S&P 500 U.S. equity market volume and volatility 13.9 14.7 18.0 Avg. daily share volume (in millions) Avg. daily dollar volume (in $ millions) 10,000 7,500 5,000 2,500 $400,000 $300,000 $200,000 $100,000 1Q15 4Q15 1Q16
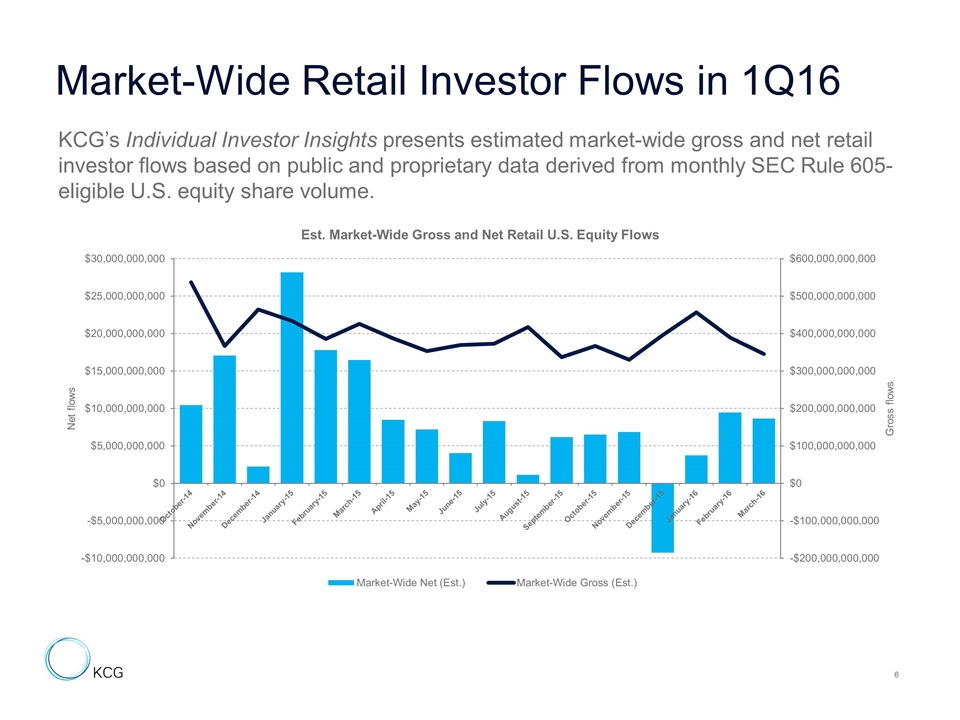
Market-Wide Retail Investor Flows in 1Q16 KCG’s Individual Investor Insights presents estimated market-wide gross and net retail investor flows based on public and proprietary data derived from monthly SEC Rule 605-eligible U.S. equity share volume.
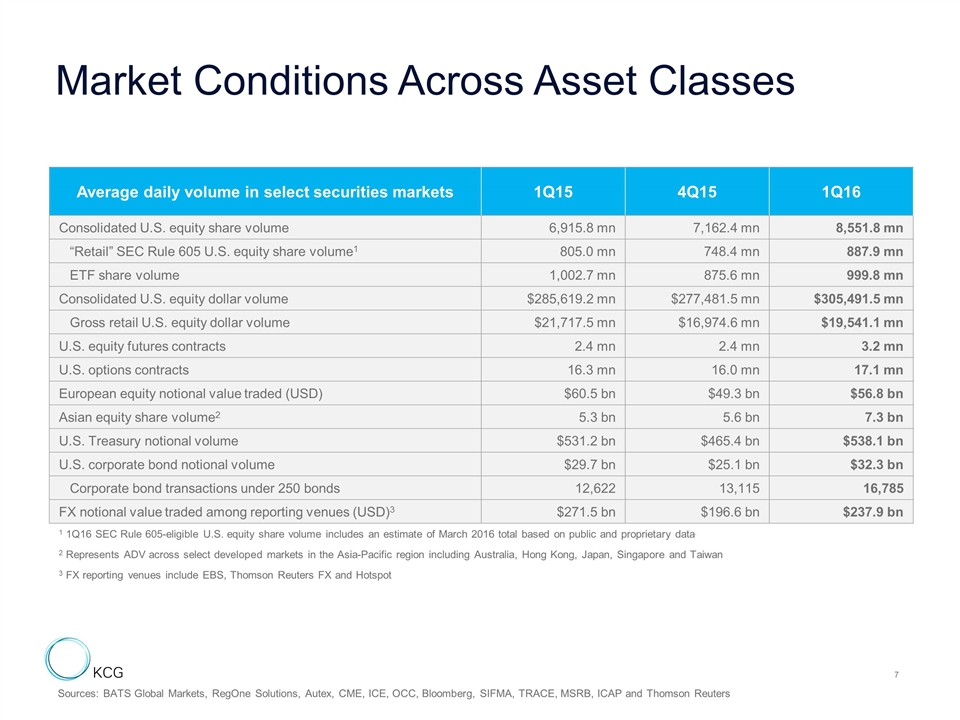
Market Conditions Across Asset Classes Average daily volume in select securities markets 1Q15 4Q15 1Q16 Consolidated U.S. equity share volume 6,915.8 mn 7,162.4 mn 8,551.8 mn “Retail” SEC Rule 605 U.S. equity share volume1 805.0 mn 748.4 mn 887.9 mn ETF share volume 1,002.7 mn 875.6 mn 999.8 mn Consolidated U.S. equity dollar volume $285,619.2 mn $277,481.5 mn $305,491.5 mn Gross retail U.S. equity dollar volume $21,717.5 mn $16,974.6 mn $19,541.1 mn U.S. equity futures contracts 2.4 mn 2.4 mn 3.2 mn U.S. options contracts 16.3 mn 16.0 mn 17.1 mn European equity notional value traded (USD) $60.5 bn $49.3 bn $56.8 bn Asian equity share volume2 5.3 bn 5.6 bn 7.3 bn U.S. Treasury notional volume $531.2 bn $465.4 bn $538.1 bn U.S. corporate bond notional volume $29.7 bn $25.1 bn $32.3 bn Corporate bond transactions under 250 bonds 12,622 13,115 16,785 FX notional value traded among reporting venues (USD)3 $271.5 bn $196.6 bn $237.9 bn 1 1Q16 SEC Rule 605-eligible U.S. equity share volume includes an estimate of March 2016 total based on public and proprietary data. 2 Represents ADV across select developed markets in the Asia-Pacific region including Australia, Hong Kong, Japan, Singapore and Taiwan 3 FX reporting venues include EBS, Thomson Reuters FX and Hotspot Sources: BATS Global Markets, RegOne Solutions, Autex, CME, ICE, OCC, Bloomberg, SIFMA, TRACE, MSRB, ICAP and Thomson Reuters
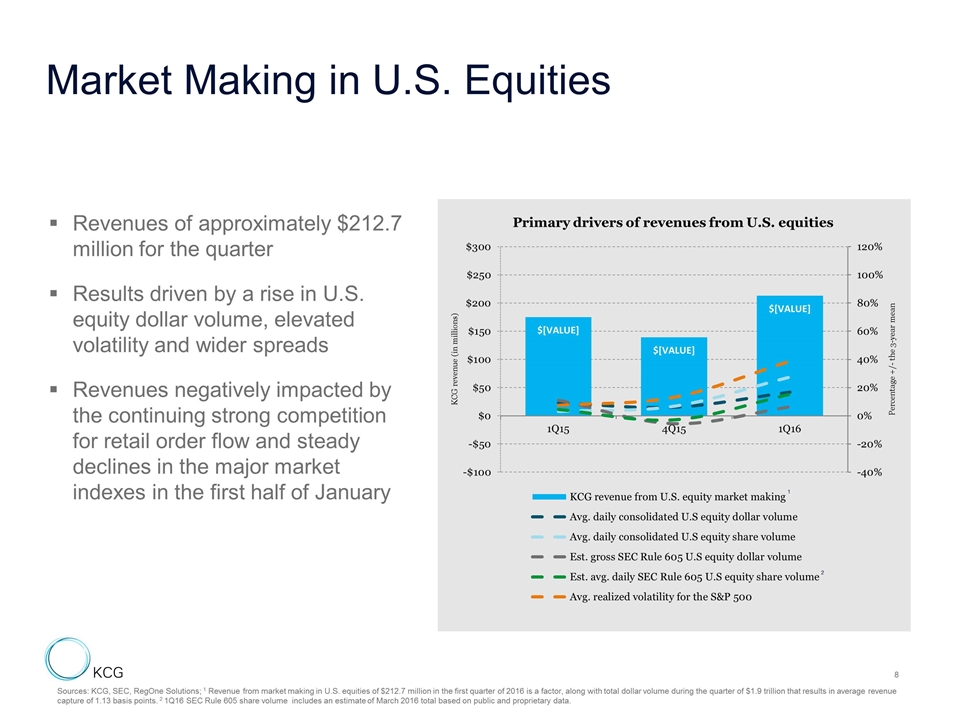
Market Making in U.S. Equities Sources: KCG, SEC, RegOne Solutions; 1 Revenue from market making in U.S. equities of $212.7 million in the first quarter of 2016 is a factor, along with total dollar volume during the quarter of $1.9 trillion that results in average revenue capture of 1.13 basis points. 2 1Q16 SEC Rule 605 share volume includes an estimate of March 2016 total based on public and proprietary data. Revenues of approximately $212.7 million for the quarter Results driven by a rise in U.S. equity dollar volume, elevated volatility and wider spreads Revenues negatively impacted by the continuing strong competition for retail order flow and steady declines in the major market indexes in the first half of January 1 2
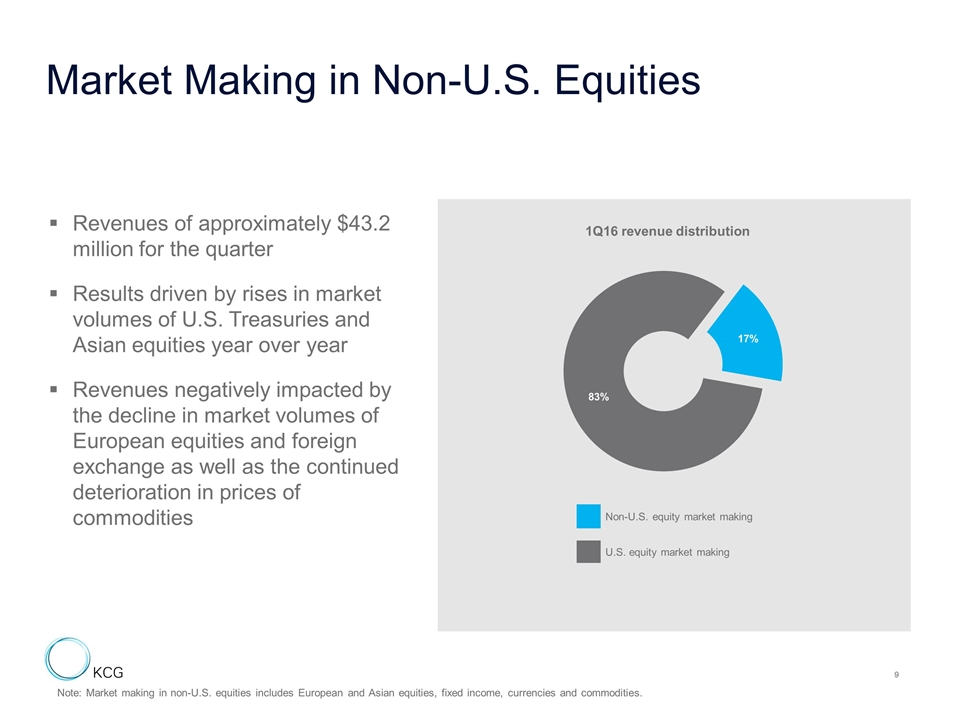
Market Making in Non-U.S. Equities Note: Market making in non-U.S. equities includes European and Asian equities, fixed income, currencies and commodities. Revenues of approximately $43.2 million for the quarter Results driven by rises in market volumes of U.S. Treasuries and Asian equities year over year Revenues negatively impacted by the decline in market volumes of European equities and foreign exchange as well as the continued deterioration in prices of commodities Non-U.S. equity market making U.S. equity market making 1Q16 revenue distribution
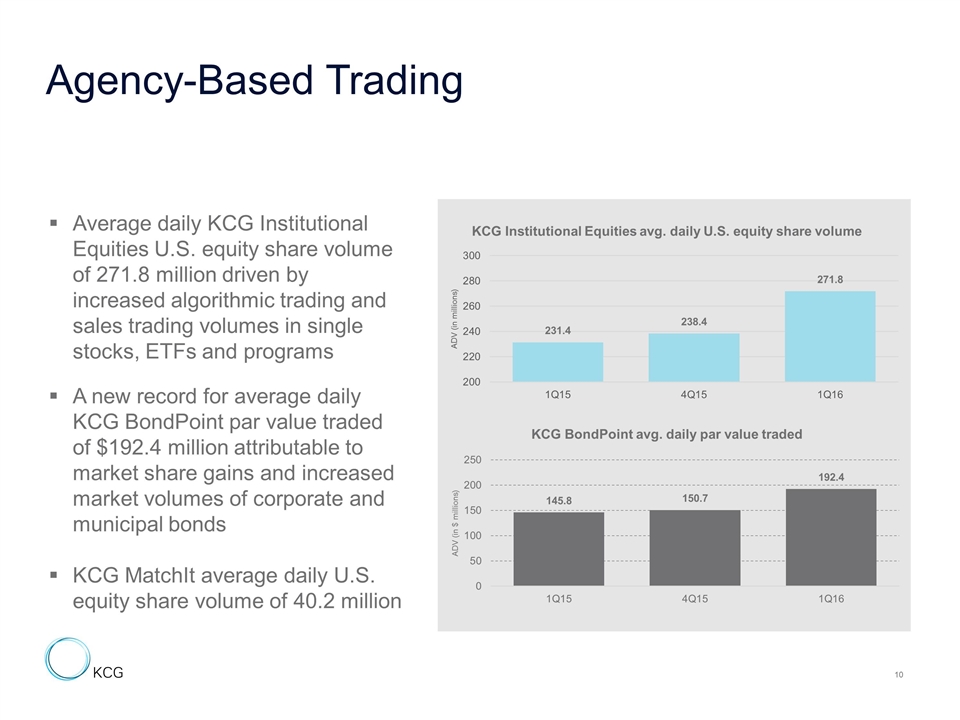
Agency-Based Trading Average daily KCG Institutional Equities U.S. equity share volume of 271.8 million driven by increased algorithmic trading and sales trading volumes in single stocks, ETFs and programs A new record for average daily KCG BondPoint par value traded of $192.4 million attributable to market share gains and increased market volumes of corporate and municipal bonds KCG MatchIt average daily U.S. equity share volume of 40.2 million KCG Institutional Equities avg. daily U.S. equity share volume KCG BondPoint avg. daily par value traded
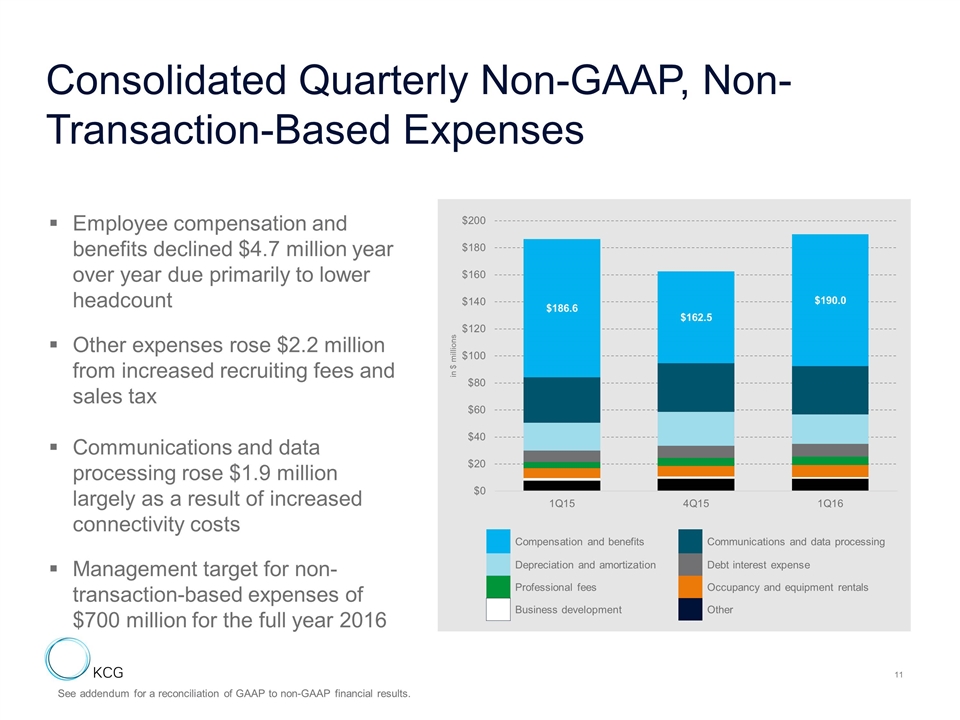
Consolidated Quarterly Non-GAAP, Non-Transaction-Based Expenses Employee compensation and benefits declined $4.7 million year over year due primarily to lower headcount Other expenses rose $2.2 million from increased recruiting fees and sales tax Communications and data processing rose $1.9 million largely as a result of increased connectivity costs Management target for non-transaction-based expenses of $700 million for the full year 2016 Compensation and benefits Communications and data processing Depreciation and amortization Debt interest expense Professional fees Occupancy and equipment rentals Business development Other See addendum for a reconciliation of GAAP to non-GAAP financial results.
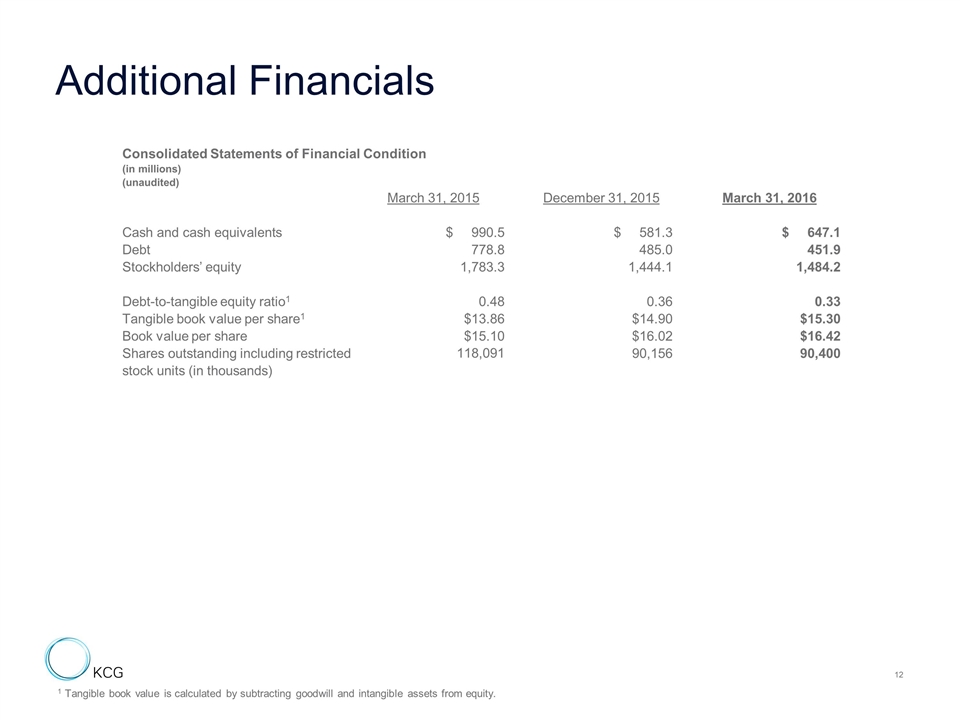
Additional Financials Consolidated Statements of Financial Condition (in millions) (unaudited) March 31, 2015 December 31, 2015 March 31, 2016 Cash and cash equivalents $ 990.5 $ 581.3 $ 647.1 Debt 778.8 485.0 451.9 Stockholders’ equity 1,783.3 1,444.1 1,484.2 Debt-to-tangible equity ratio1 0.48 0.36 0.33 Tangible book value per share1 $13.86 $14.90 $15.30 Book value per share $15.10 $16.02 $16.42 Shares outstanding including restricted 118,091 90,156 90,400 stock units (in thousands) 1 Tangible book value is calculated by subtracting goodwill and intangible assets from equity.
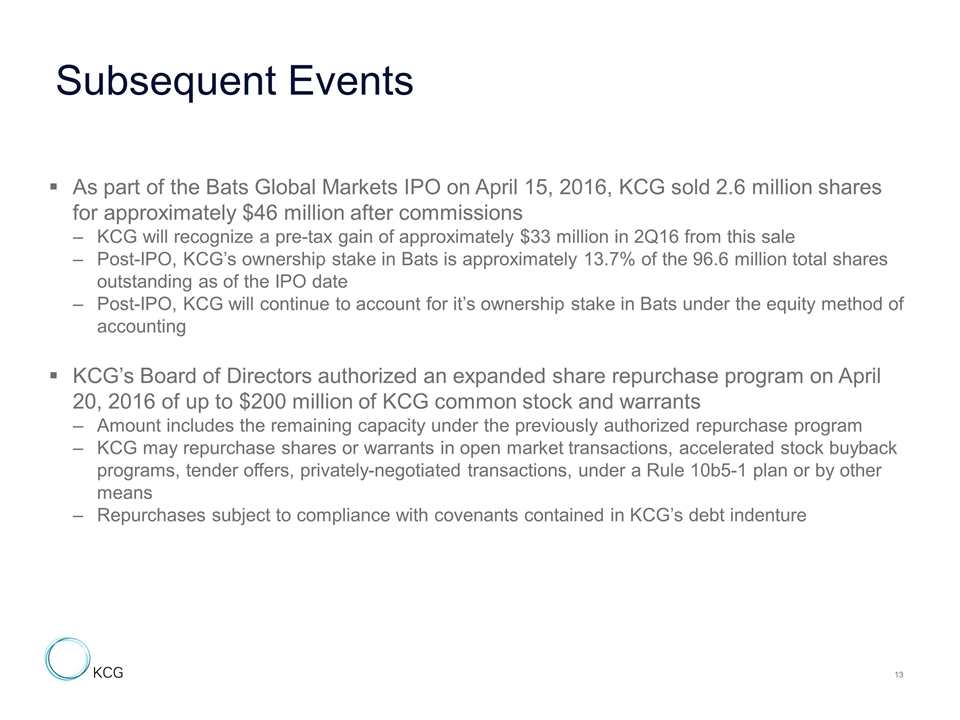
As part of the Bats Global Markets IPO on April 15, 2016, KCG sold 2.6 million shares for approximately $46 million after commissions KCG will recognize a pre-tax gain of approximately $33 million in 2Q16 from this sale Post-IPO, KCG’s ownership stake in Bats is approximately 13.7% of the 96.6 million total shares outstanding as of the IPO date Post-IPO, KCG will continue to account for it’s ownership stake in Bats under the equity method of accounting KCG’s Board of Directors authorized an expanded share repurchase program on April 20, 2016 of up to $200 million of KCG common stock and warrants Amount includes the remaining capacity under the previously authorized repurchase program KCG may repurchase shares or warrants in open market transactions, accelerated stock buyback programs, tender offers, privately-negotiated transactions, under a Rule 10b5-1 plan or by other means Repurchases subject to compliance with covenants contained in KCG’s debt indenture Subsequent Events
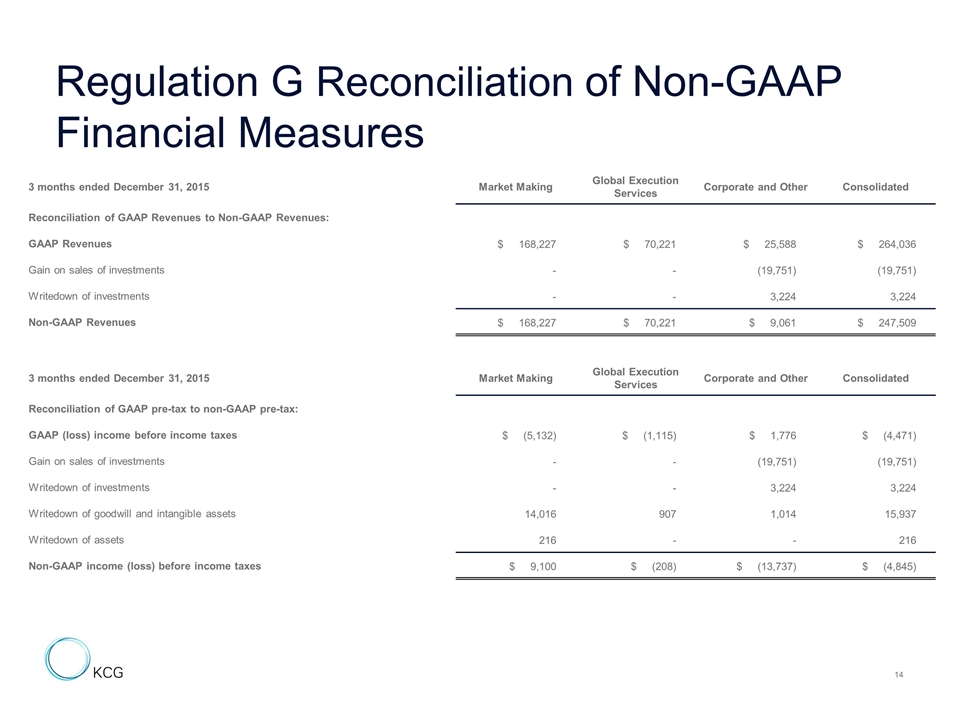
Regulation G Reconciliation of Non-GAAP Financial Measures 3 months ended December 31, 2015 Market Making Global Execution Services Corporate and Other Consolidated Reconciliation of GAAP Revenues to Non-GAAP Revenues: GAAP Revenues $ 168,227 $ 70,221 $ 25,588 $ 264,036 Gain on sales of investments - - (19,751) (19,751) Writedown of investments - - 3,224 3,224 Non-GAAP Revenues $ 168,227 $ 70,221 $ 9,061 $ 247,509 3 months ended December 31, 2015 Market Making Global Execution Services Corporate and Other Consolidated Reconciliation of GAAP pre-tax to non-GAAP pre-tax: GAAP (loss) income before income taxes $ (5,132) $ (1,115) $ 1,776 $ (4,471) Gain on sales of investments - - (19,751) (19,751) Writedown of investments - - 3,224 3,224 Writedown of goodwill and intangible assets 14,016 907 1,014 15,937 Writedown of assets 216 - - 216 Non-GAAP income (loss) before income taxes $ 9,100 $ (208) $ (13,737) $ (4,845) 14
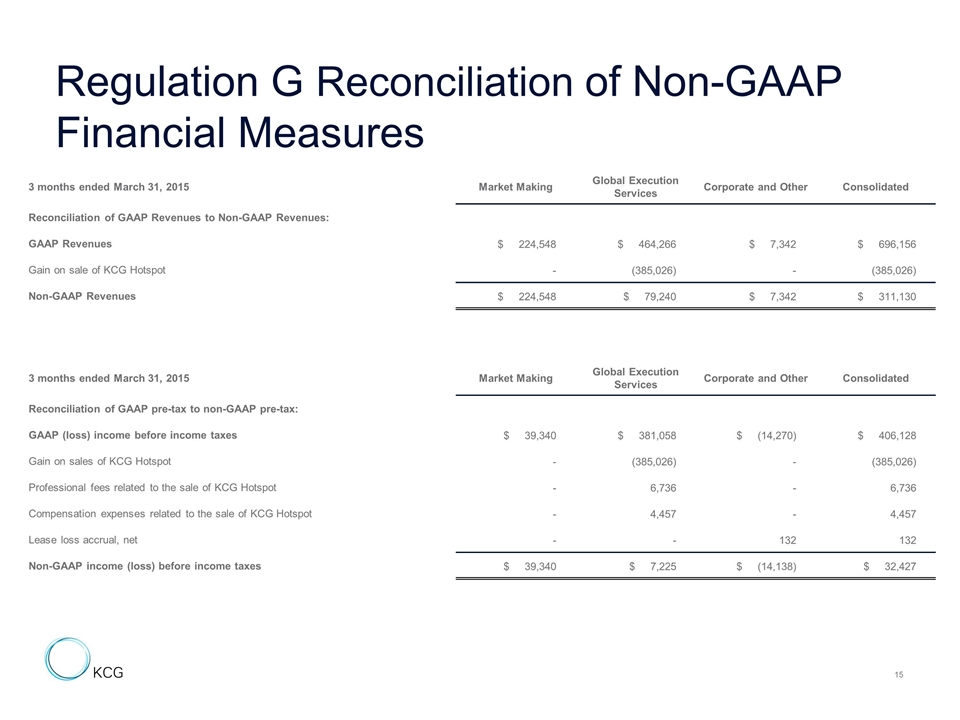
Regulation G Reconciliation of Non-GAAP Financial Measures 3 months ended March 31, 2015 Market Making Global Execution Services Corporate and Other Consolidated Reconciliation of GAAP Revenues to Non-GAAP Revenues: GAAP Revenues $ 224,548 $ 464,266 $ 7,342 $ 696,156 Gain on sale of KCG Hotspot - (385,026) - (385,026) Non-GAAP Revenues $ 224,548 $ 79,240 $ 7,342 $ 311,130 3 months ended March 31, 2015 Market Making Global Execution Services Corporate and Other Consolidated Reconciliation of GAAP pre-tax to non-GAAP pre-tax: GAAP (loss) income before income taxes $ 39,340 $ 381,058 $ (14,270) $ 406,128 Gain on sales of KCG Hotspot - (385,026) - (385,026) Professional fees related to the sale of KCG Hotspot - 6,736 - 6,736 Compensation expenses related to the sale of KCG Hotspot - 4,457 - 4,457 Lease loss accrual, net - - 132 132 Non-GAAP income (loss) before income taxes $ 39,340 $ 7,225 $ (14,138) $ 32,427 15
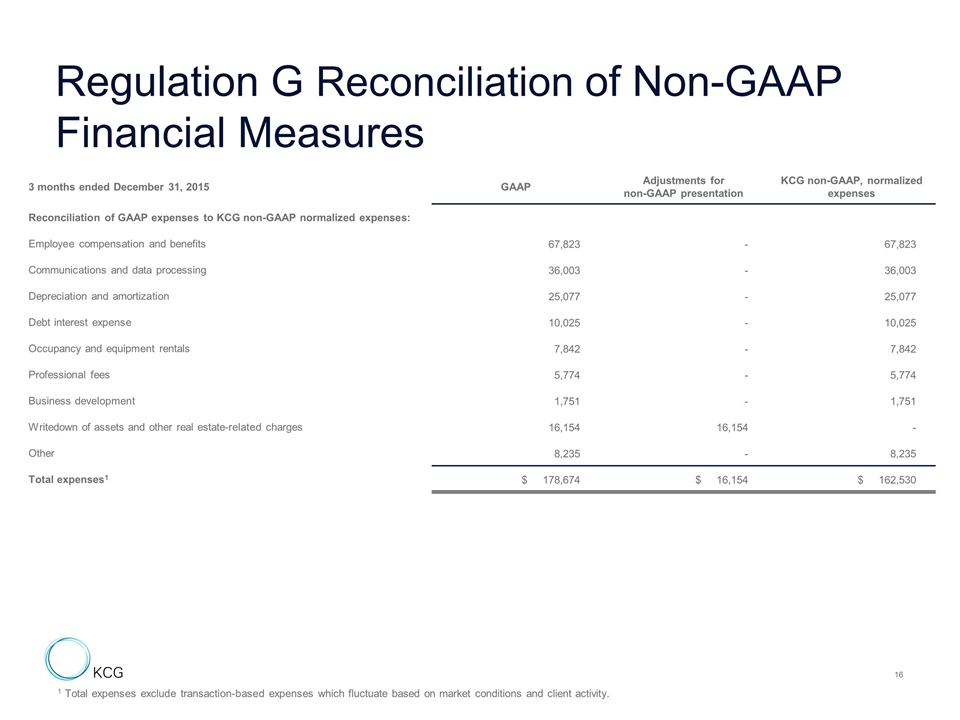
3 months ended December 31, 2015 GAAP Adjustments for non-GAAP presentation KCG non-GAAP, normalized expenses Reconciliation of GAAP expenses to KCG non-GAAP normalized expenses: Employee compensation and benefits 67,823 - 67,823 Communications and data processing 36,003 - 36,003 Depreciation and amortization 25,077 - 25,077 Debt interest expense 10,025 - 10,025 Occupancy and equipment rentals 7,842 - 7,842 Professional fees 5,774 - 5,774 Business development 1,751 - 1,751 Writedown of assets and other real estate-related charges 16,154 16,154 - Other 8,235 - 8,235 Total expenses1 $ 178,674 $ 16,154 $ 162,530 Regulation G Reconciliation of Non-GAAP Financial Measures 1 Total expenses exclude transaction-based expenses which fluctuate based on market conditions and client activity. 16
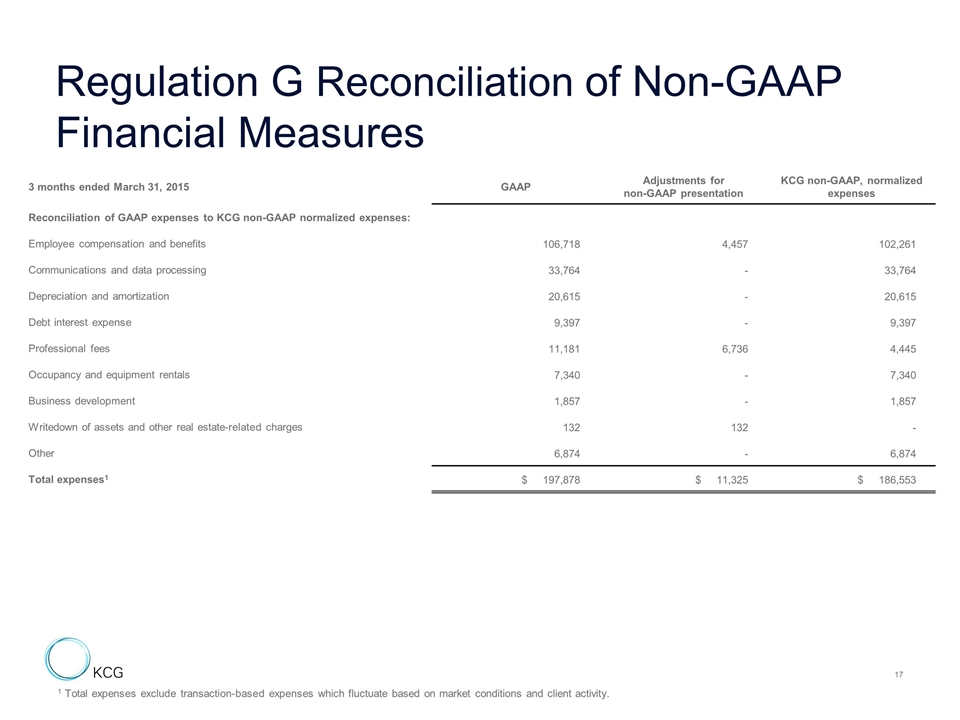
Regulation G Reconciliation of Non-GAAP Financial Measures 1 Total expenses exclude transaction-based expenses which fluctuate based on market conditions and client activity. 3 months ended March 31, 2015 GAAP Adjustments for non-GAAP presentation KCG non-GAAP, normalized expenses Reconciliation of GAAP expenses to KCG non-GAAP normalized expenses: Employee compensation and benefits 106,718 4,457 102,261 Communications and data processing 33,764 - 33,764 Depreciation and amortization 20,615 - 20,615 Debt interest expense 9,397 - 9,397 Professional fees 11,181 6,736 4,445 Occupancy and equipment rentals 7,340 - 7,340 Business development 1,857 - 1,857 Writedown of assets and other real estate-related charges 132 132 - Other 6,874 - 6,874 Total expenses1 $ 197,878 $ 11,325 $ 186,553 17
