Attached files
| file | filename |
|---|---|
| 8-K - FORM 8-K - FIFTH THIRD BANCORP | d158907d8k.htm |
| EX-99.3 - EX-99.3 - FIFTH THIRD BANCORP | d158907dex993.htm |
| EX-99.1 - EX-99.1 - FIFTH THIRD BANCORP | d158907dex991.htm |
 Fifth
Third Bank | All Rights Reserved 1Q16 Earnings Presentation
April 21, 2016 Refer to earnings release dated April 21, 2016 for further information. Exhibit 99.2 |
 2 Fifth Third Bank | All Rights Reserved Cautionary statement This release contains statements that we believe are “forward-looking statements” within the meaning of Section 27A of the
Securities Act of 1933, as amended, and Rule 175 promulgated thereunder,
and Section 21E of the Securities Exchange Act of 1934, as amended, and Rule 3b-6 promulgated thereunder. These statements relate to our financial condition, results of operations, plans, objectives, future performance or
business. They usually can be identified by the use of
forward-looking language such as “will likely result,” “may,” “are expected to,” “anticipates,” “potential,” “estimate,” “forecast,” “projected,” “intends to,” or may include other similar words or phrases such as “believes,” “plans,” “trend,” “objective,” “continue,” “remain,” or similar expressions, or future or conditional verbs such as “will,” “would,”
“should,” “could,” “might,” “can,” or similar verbs. You should not place undue reliance on these statements, as they are subject to risks and uncertainties, including but not limited to the risk
factors set
forth in our most recent Annual Report on Form 10-K as updated from time to time by our Quarterly Reports on Form 10-Q. When considering these forward-looking statements, you should keep in mind these risks and uncertainties, as well as any cautionary statements we may make. Moreover, you should treat these statements as speaking only as of the date they are made and based only on information then actually known to
us. There is a risk that additional information may become known during
the company’s quarterly closing process or as a result of subsequent
events that could affect the accuracy of the statements and financial information
contained herein. There are a number of important factors that could cause
future results to differ materially from historical performance and these forward-looking statements. Factors that might cause such a difference include, but are not limited to: (1) general economic conditions and the economy weaken
and become less favorable than expected, particularly in the real estate
market, either nationally or in the states in which Fifth Third, one or more acquired entities and/or the combined company do business; (2) deteriorating credit quality; (3) political developments, wars or other hostilities may disrupt or increase volatility in securities markets or other economic conditions; (4) changes in the interest rate environment reduce interest
margins; (5) prepayment speeds, loan origination and sale volumes,
charge-offs and loan loss provisions; (6) Fifth Third’s ability to maintain required capital levels and adequate sources of funding and liquidity; (7) maintaining capital requirements and adequate sources of funding and liquidity may
limit Fifth Third’s operations and potential growth; (8) changes and
trends in capital markets; (9) problems encountered by larger or similar financial institutions may adversely affect the banking industry and/or Fifth Third; (10) competitive pressures among depository institutions increase
significantly; (11) effects of critical accounting policies and
judgments; (12) changes in accounting policies or procedures as may be required by the Financial Accounting Standards Board (FASB) or other regulatory agencies; (13) legislative or regulatory changes or actions, or significant
litigation, adversely affect Fifth Third, one or more acquired entities
and/or the combined company or the businesses in which Fifth Third, one or more acquired entities and/or the combined company are engaged, including the Dodd-Frank Wall Street Reform and Consumer Protection Act; (14)
ability to maintain favorable ratings from rating agencies; (15)
fluctuation of Fifth Third’s stock price; (16) ability to attract and retain key personnel; (17) ability to receive dividends from its subsidiaries; (18) potentially dilutive effect of future acquisitions on current shareholders’
ownership of Fifth Third;
(19) effects of accounting or financial results of one or more acquired entities; (20) difficulties from Fifth Third’s investment in, relationship with, and nature of the operations of Vantiv, LLC; (21) loss of income from any sale or potential sale of businesses; (22) difficulties in
separating the operations of any branches or other assets divested; (23)
inability to achieve expected benefits from branch consolidations and planned sales within desired timeframes, if at all; (24) ability to secure confidential information and deliver products and services through the use of computer systems and telecommunications networks; and (25) the impact of reputational risk created by these developments on such matters as business generation
and retention, funding and liquidity.
You should refer to our periodic and current reports filed with the Securities and Exchange Commission, or “SEC,” for further information on other factors, which could cause actual results to be significantly different from those expressed or implied by these forward-looking statements. |
 3 Fifth Third Bank | All Rights Reserved • Strong NII and NIM; continued benefit from steady interest rate risk management strategy • Solid fee income despite market volatility • Strong corporate banking activity • Tightly controlled operational expenses • Executed on defined strategies • Credit quality excluding energy in line; monitoring energy portfolio closely First Quarter 2016 Highlights Earnings Per Share Reported $0.40 •Included $0.03 net benefit from certain items* Net Income to Common $312 million LCR 118% *1Q16 certain items detailed on page 4 of this presentation |
 4 Fifth Third Bank | All Rights Reserved 1Q16 in review Note: The percentages in all of the tables in this presentation are calculated on actual dollar amounts and not the rounded dollar
amounts. 1
Excludes loans held-for-sale
2 Non-GAAP measure; see Reg. G reconciliation in appendix Significant pre-tax items in 1Q16 results ($0.03 positive after-tax EPS impact): — $47MM pre-tax (~$31MM after-tax) positive valuation adjustment on the Vantiv warrant — $8MM pre-tax (~$5MM after-tax) gain on sale on St. Louis branches — ($14MM) pre-tax (~$9MM after-tax) voluntary early retirement expense Core businesses showed seasonal trends — Strong corporate banking activity offset seasonal impacts Credit trends — NCO ratio of 42 bps; 1 bp increase YoY and 8 bps QoQ — NPA ratio of 88 bps; up 18 bps sequentially — Primarily due to deterioration in RBL (reserve-based lending) energy loans — Reserve on energy portfolio of 6.20% up from 4.75% in 4Q15 ($ in millions) 1Q16 Seq. YOY Average Balances Total loans & leases $93,275 ($319) $2,767 Core deposits $98,715 ($1,013) $521 Income Statement Data Net interest income (taxable equivalent) $909 1% 7% Provision for loan and lease losses 119 31% 72% Non-interest income 637 (42%) 1% Non-interest expense 986 2% 7% Net income attributable to Bancorp $327 (50%) (9%) Net income available to common shareholders $312 (51%) (10%) Financial Ratios Earnings per share, diluted 0.40 (49%) (5%) Net interest margin 2.91% 6bps 5bps Efficiency ratio 63.8% 1580bps 150bps Return on average assets 0.93% (90bps) (13bps) Return on average common equity 8.3% (890bps) (140bps) Return on average tangible common equity 9.9% (1070bps) (180bps) Tangible book value per share $ 16.32 6% 10% 1 2 2 |
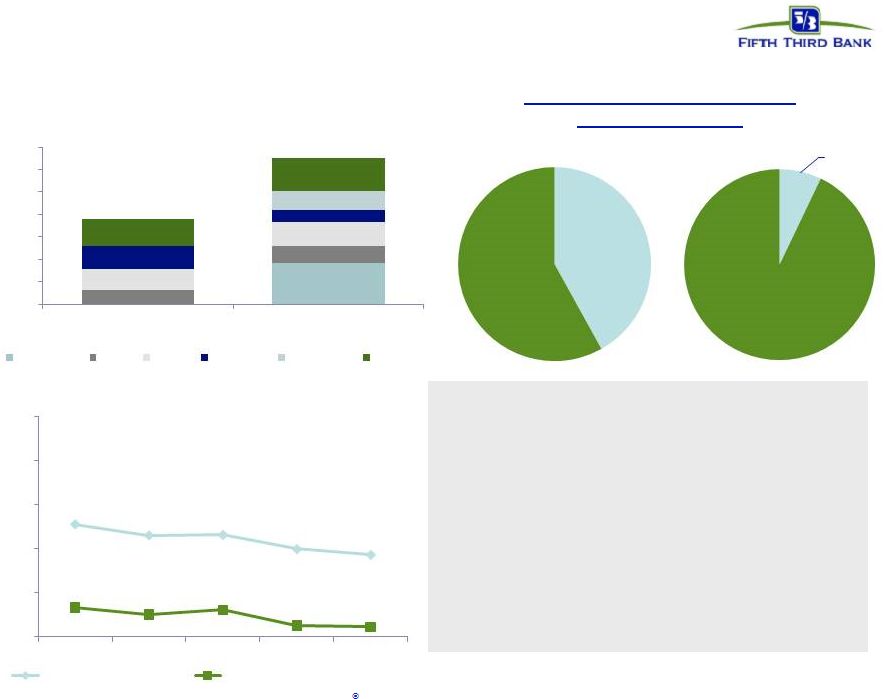
 5 Fifth Third Bank | All Rights Reserved Balance sheet Loan balances ($B) • Average commercial loans flat sequentially; up 5% year-over-year – EOP C&I growth 3% sequentially – Year-over-year growth driven by: C&I and commercial construction – Commodity broker balances of $241MM; down 48% from peak • Average consumer loans down 1% sequentially; up 1% year-over-year – Sold $158MM of consumer loans in connection with St. Louis branches • Average transaction deposits down $1.0B sequentially, driven by seasonal declines primarily in commercial demand deposit accounts – Sold $219MM of core deposits with St. Louis branches • Average loan to core deposit ratio of 94% • LCR of 118% at 1Q16 Average core deposit balances ($B) $98.7 $98.2 Average securities and short-term investments ($B) • Average securities up $6.5B year-over- year driven by: – LCR requirement additions – Positioning to maintain balanced interest rate exposures – Securities portfolio / total assets of 21.3%; 19.2% in 1Q15 $30.1 $31.3 $29.0 $30.6 Note: Numbers may not sum due to rounding. $31.6 $90.5 $92.2 $93.4 $93.6 $93.3 70 75 80 85 90 95 1Q15 2Q15 3Q15 4Q15 1Q16 $94.2 $96.5 $94.7 $95.7 $94.7 92% 92% 95% 94% 94% 80% 85% 90% 95% 100% 65 70 75 80 85 90 95 100 1Q15 2Q15 3Q15 4Q15 1Q16 Transaction deposits Other time deposits Loan to core deposit ratio $23.2 $27.4 $28.3 $29.0 $29.7 0 5 10 15 20 25 30 1Q15 2Q15 3Q15 4Q15 1Q16 Average securities Short-term investments |
 6 Fifth Third Bank | All Rights Reserved Net interest income NII and NIM (FTE) • Sequential comparisons: – NII and NIM increase primarily due to the December Fed funds rate increase – NII and NIM both negatively impacted by: – Loan yield compression from mix shift, lower consumer loan balances, and Fed stock dividend rate
reduction – 1 fewer day in 1Q16 vs. 4Q15 was a benefit to NIM, but a detriment to NII • Year-over-year comparisons: – NII increase driven by the impact of higher investment securities and loan balances
– NIM increase primarily driven by lower year-over-year cash balances $852 $892 $906 $904 $909 2.86% 2.90% 2.89% 2.85% 2.91% $0 $100 $200 $300 $400 $500 $600 $700 $800 $900 $1,000 0.0% 0.5% 1.0% 1.5% 2.0% 2.5% 3.0% 3.5% 4.0% 4.5% 1Q15 2Q15 3Q15 4Q15 1Q16 Net Interest Income ($MM) NIM |
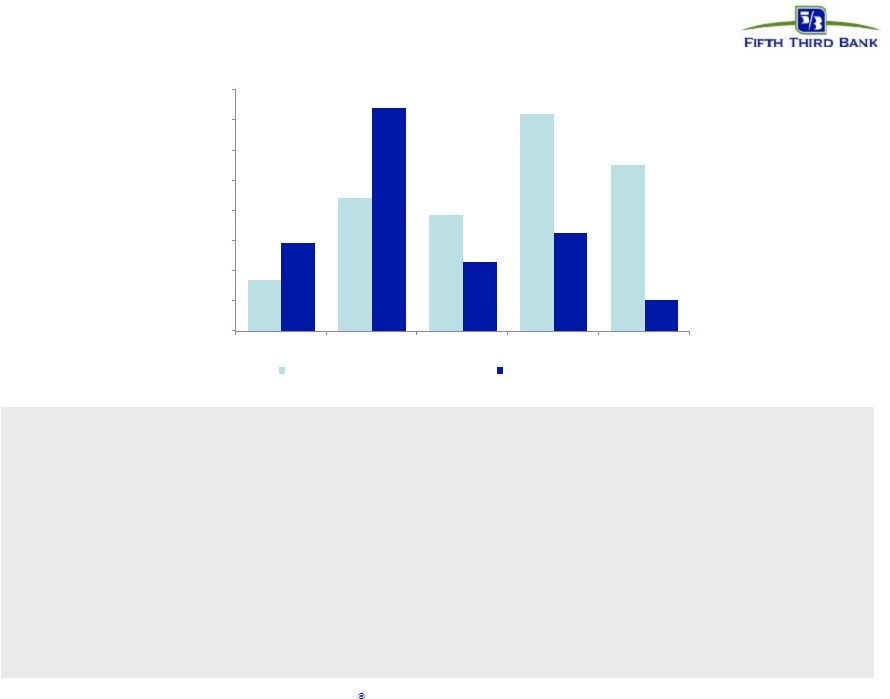
 7 Fifth Third Bank | All Rights Reserved Non-interest income • 1Q16 reported non-interest income impacted by Vantiv warrant valuation adjustment and impact of branch sale • Sequential decrease in adjusted non-interest income overall reflected normal seasonal
trends and the annual $31MM tax receivable payment recognized in 4Q15
– Wealth management impacted by equity markets and lower brokerage activity – Strong corporate banking activity offset normal seasonality Non-interest Income ($MM) $566 $637 $591 $623 $578 $630 $556 $713 $1,104 $637 $0 $200 $400 $600 $800 $1,000 1Q15 2Q15 3Q15 4Q15 1Q16 Adjusted non-interest income Reported non-interest income |
 8 Fifth Third Bank | All Rights Reserved Non-interest expense • Adjusted expenses up 2% sequentially, primarily due to: – Seasonal increase in FICA and unemployment tax – Costs associated with the voluntary retirement program • Adjusted expenses up 6% YoY: – Up 5% excluding 1Q15 benefit from tax liability settlement – Year-over-year growth primarily due to higher risk and compliance compensation expense Non-interest Expense ($MM) Note: Provision for unfunded commitments was an expense of $6MM in 1Q16, an expense of $4M in 4Q15, an expense of $2M in 3Q15, an expense
of $2M in 2Q15, and a benefit of $4M in 1Q15.
$916 $946 $939 $951 $971 $923 $947 $943 $963 $986 $750 $800 $850 $900 $950 $1,000 1Q15 2Q15 3Q15 4Q15 1Q16 Adjusted non-interest expense Reported non-interest expense |
 9 Fifth Third Bank | All Rights Reserved 52 41 46 46 42 39 45 34 54 $0 $25 $50 $75 $100 $125 $150 $175 $200 1Q15 2Q15 3Q15 4Q15 1Q16 Consumer Commercial Credit quality overview Net charge-offs ($MM) $86 NCO ratio 0.41% 0.37% 0.80% 0.34% $188 HFI Non-performing assets ($MM) Reserve Coverage $91 $80 Charge-off related to restructuring of a student loan backed commercial credit originally extended in 2007 102 40 0.42% $96 421 376 370 419 611 270 250 236 228 214 $0 $200 $400 $600 $800 $1,000 1Q15 2Q15 3Q15 4Q15 1Q16 Commercial Consumer $825 NPA ratio 0.76%
0.67% 0.65% 0.70%
0.88% $691
$626 $606 $647 • 1Q16 charge-offs up 8 bps from low levels in 4Q15 – Includes $16MM increase in C&I loans • $9MM of 1Q16 charge-offs in OFS (oil field services) • 1Q16 portfolio NPA growth of $178MM – Primarily due to $168MM of energy loans, predominantly RBL (reserve-based lending) • 1Q16 reserve of 1.38% up from 1.37% in 4Q15 1 $1,300 $1,293 $1,261 $1,272 $1,295 1.42% 1.39% 1.35% 1.37% 1.38% $750 $850 $950 $1,050 $1,150 $1,250 $1,350 0.00% 0.50% 1.00% 1.50% 2.00% 2.50% 1Q15 2Q15 3Q15 4Q15 1Q16 Allowance for Loan & Lease Losses (ALLL) ($MM) ALLL / Loans and Leases 1 |
 10 Fifth Third Bank | All Rights Reserved Energy Portfolio $170 $443 $385 $722 $552 $294 $742 $232 $327 $105 $0 $100 $200 $300 $400 $500 $600 $700 $800 OFS RBL Oil & Gas Midstream Refining Total Exposure ($MM) Unfunded Commitments Outstandings • Energy balances stable at $1.7B – Total unfunded commitments of $2.3B • 76% of total energy loans outstanding are SNCs • $9.2MM charge-offs in OFS (oil field services) • $168MM increase in NPAs sequentially; predominantly RBL (reserve-based lending)
– All RBLs current on interest and well-collateralized • Reserves of 6.20% of funded loans, up from 4.75% in 4Q15 • 41% of energy loans are criticized, up from 36% in 4Q15 |
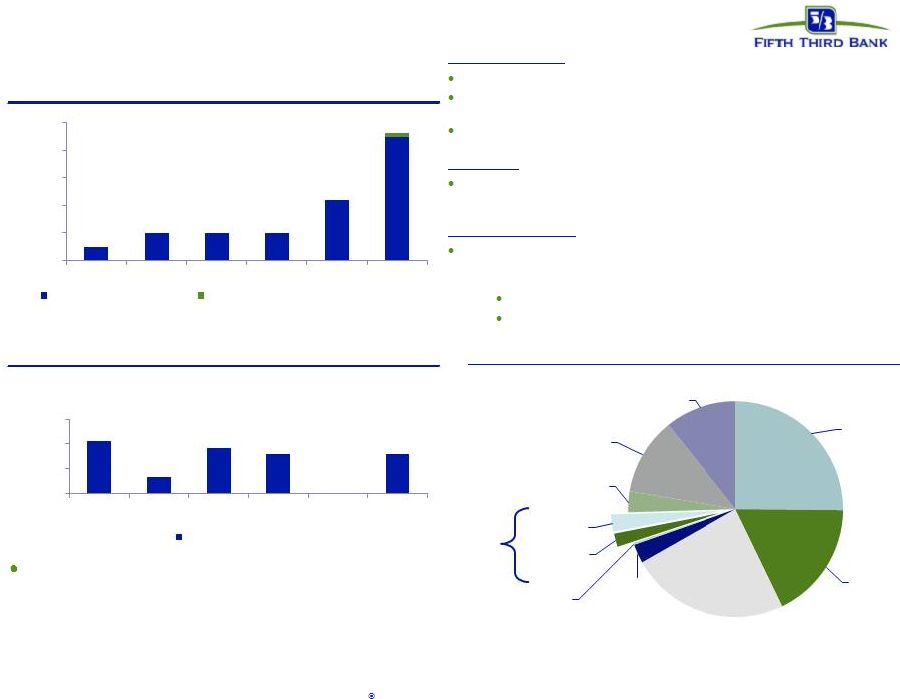
 11 Fifth Third Bank | All Rights Reserved Commercial Real Estate Loans • Total CRE balance of $10.2B; 10.9% of total portfolio loans – Total CRE balance of $17.4B at the end of 2007; 22% of total portfolio loans – Peer group average is 13% – Balances flat over the past 5 years • Multi-family balances of $1.9B as of 1Q16 – Multi-family construction book geographically diverse Non-owner Occupied Portfolio Distribution ($MM) 2.56% 2.31% 2.32% 2.00% 1.87% 0.67% 0.51% 0.62% 0.26% 0.23% 0.00% 1.00% 2.00% 3.00% 4.00% 5.00% 1Q15 2Q15 3Q15 4Q15 1Q16 Commercial Mortgage Commercial Construction Residential and Land $4,513 Other $6,242 2007 Residential and Land $462 Other $6,044 1Q16 Apartment Retail Office Industrial Hospitality Other Owner Occupied Non-Owner Occupied $1,862 $648 $731 $918 $1,078 $1,043 $531 $851 $1,177 $1,453 $0 $1,000 $2,000 $3,000 $4,000 $5,000 $6,000 $7,000 1Q16 CRE Property Type Breakout $3,786 $6,506 ($MM) 1Q16 Commercial Real Estate NPAs |
 12 Fifth Third Bank | All Rights Reserved Strong capital position 1 Non-GAAP measure; See Reg. G reconciliation in appendix. 2 Represents Basel III common equity tier 1 ratio under the final capital rule, subject to phase-in periods. Fifth Third made a one-time
permanent election to not include AOCI in common equity tier 1 capital in
the March 31, 2015 regulatory filings. 3
EOP share impact of 12.4 MM for 4Q15 and 14.4MM for 1Q16; Average share impact of 11.0MM
for 4Q15, 13.2MM for 1Q16 and 10.2MM for 2Q16 Tangible Book Value per
share Capital Actions
Avg. Diluted Shares Outstanding (MM)
Common Equity Tier 1 Ratio
(Basel III) CET1 stable at 9.8% Executed $240MM accelerated share repurchase (ASR) transaction on March 1, 2016 — March 1 – retired 12.6MM shares — April 11 – retired an additional 1.9MM shares due to ASR completion January 14 – retired 1.8MM shares due to completion of December 9, 2015 ASR Sequential growth in TBV per share driven primarily by an increase in AOCI 9.5% 9.4% 9.4% 9.8% 9.8% 0% 2% 4% 6% 8% 10% 1Q15 2Q15 3Q15 4Q15 1Q16 $14.85 $14.62 $15.18 $15.39 $16.32 $10.00 $11.00 $12.00 $13.00 $14.00 $15.00 $16.00 $17.00 1Q15 2Q15 3Q15 4Q15 1Q16 819 813 805 794 778 750 760 770 780 790 800 810 820 830 1Q15 2Q15 3Q15 4Q15 1Q16 2 1 3 |
 13 Fifth Third Bank | All Rights Reserved Appendix |
 14 Fifth Third Bank | All Rights Reserved $497 $578 $553 $571 $510 $0 $100 $200 $300 $400 $500 $600 $700 $800 $900 $1,000 $1,100 1Q15 2Q15 3Q15 4Q15 1Q16 Adjusted PPNR Reported PPNR Pre-tax pre-provision earnings 1 PPNR trend 1 Non-GAAP measure; see Reg. G reconciliation in appendix. 2 Prior quarters include similar adjustments. PPNR decreased 47% sequentially, reflecting : – $469MM net benefit in 4Q15 primarily related to Vantiv gains Adjusted PPNR down 11% sequentially – Primarily due to the $31MM annual Vantiv tax receivable payment recorded in 4Q15 PPNR reconciliation Efficiency ratio 65.4% 62.3% 58.2% 48.0% 63.8% 64.9% 61.9% 62.7% 62.2% 1Q15 2Q15 3Q15 4Q15 1Q16 Efficiency Ratio Adjusted Efficiency Ratio 65.3% ($ in millions) 1Q15 2Q15 3Q15 4Q15 1Q16 Income before income taxes (U.S. GAAP) (a) $485 $417 $515 $949 $436 Add: Provision expense (U.S. GAAP) (b) 69 79 156 91 119 PPNR (a) + (b) $554 $496 $671 $1,040 $554 Adjustments to remove (benefit) / detriment²: In noninterest income: Gain on sale of Vantiv shares - - - (331) - Gain on Vantiv warrant actions - - - (89) - Vantiv TRA settlement payment - - - (49) - Vantiv warrant valuation (70) (14) (130) (21) (47) Gain on sale of certain branches - - - - (8) Branch and land valuation adjustments - 97 - - - Gain from sales of troubled debt restructurings (37) - - - - Impairment associated with aircraft leases 30 - - - - Valuation of 2009 Visa total return swap 17 2 8 10 (1) Securities (gains) / losses (4) (4) - (1) (3) In noninterest expense: Contribution to Fifth Third Foundation 4 - - 10 - Severance expense 1 2 3 2 15 Litigation reserve charges 2 (1) (5) - - Executive Retirements - - 6 - - Adjusted PPNR $497 $578 $553 $571 $510 |
 15 Fifth Third Bank | All Rights Reserved 2 1 Available and contingent borrowing capacity (1Q16): – FHLB ~$10.6B available, ~$14.2B total – Federal Reserve ~$23.5B Holding company unsecured debt maturities ($MM) Bank unsecured debt maturities ($MM – excl. Retail Brokered CDs) Heavily core funded Strong liquidity profile S-T wholesale 3% 1 $1B matured in 1Q16 2 $700MM matured in 1Q16 3 (Debt maturities, common and preferred dividends, interest and other expenses) without accessing capital markets; relying on dividends from
subsidiaries or any other discretionary actions
Holding Company: Holding Company cash at 03/31/16: $2.3B $1B maturity in January 2016, was pre-funded with the $1.1B Holding Company issuance executed in 3Q15 Cash currently sufficient to satisfy all fixed obligations in a stressed environment for ~26 months Bank Entity: Of the $2.5B maturing this year, $700MM matured in 1Q16. During the quarter the Bank issued $1.5B of long term debt, comprised of $750MM of senior debt and $750MM of sub debt 2016 Funding Plans: Due to the Moody’s LGF methodology, we intend to replace all debt maturities this calendar year ($3.7B in total) in order to maintain our current senior debt ratings $1.5B of the $3.7B was replaced in 1Q16 It is likely that most of this replacement funding will take place at the Bank Entity Demand 25% Interest checking 18% Savings/ MMDA 24% Consumer time 3% Foreign Office 0% Non-Core Deposits 2% S-T borrowings Other liabilities 3% Equity 12% L-T debt 2% 11% $2,100 $650 $1,850 $1,600 $1,600 $0 $1,000 $2,000 $3,000 2016 2017 2018 2019 2020 2021 On Fifth Third Bank $250 $500 $500 $500 $1,100 $2,312 $0 $500 $1,000 $1,500 $2,000 $2,500 2016 2017 2018 2019 2020 2021 on Fifth Third Bancorp Fifth Third Capital Trust (Bancorp) Fifth Third Bank |
 16 Fifth Third Bank | All Rights Reserved 42% 39% 19% Bancorp Investment Portfolio (BV) Level 1 Level 2A Non-HQLA 22% 30% 2% 6% 40% EOP Consumer Loans Home Equity Auto Other Credit Card Resi Mortgage & Construction 75% 12% 6% 7% EOP Commercial Loans Commercial & Industrial Commercial Mortgage Commercial Construction Commercial Lease Portfolio Compositions Commercial: Fixed: $10.2B 1 Float: $47.5B 1 • 1M Libor based: 68% • 3M Libor based: 8% • Prime based: 5% Weighted Avg. Life: 1.86 years 74% Float / 26% Fix 96% Float / 4% Fix 0% Float / 100% Fix 90% Float / 10% Fix 71% Float / 29% Fix 25% Float / 75% Fix 91% Float / 9% Fix 1% Float / 99% Fix 100% Float / 0% Fix Investments: 52% allocation to bullet/locked-out cash flow securities Investment portfolio yield: 3.14% Duration: 4.8 years Net unrealized pre-tax gain: $1B Portfolio Characteristics 0% Float / 100% Fix 0% Float / 100% Fix 17% Float / 83% Fix Consumer: Fixed: $23.3B 1 Float: $13.4B 1 • Prime based: 25% Weighted Avg. Life: 3.48 years Avg. duration of Auto book: 1.33 years 1 Includes HFS Loans & Leases 1 1 |
 17 Fifth Third Bank | All Rights Reserved Interest Rate Risk Management 1. Actual results may vary from these simulated results due to differences between forecasted and actual balance sheet composition, timing, magnitude, and frequency of interest rate changes, as well as other changes in market conditions and management strategies.
2. Re-pricing percentage or “beta” is the estimated change in yield over 12 months as a result of a shock or ramp 100 bps parallel
shift in the yield curve Well-positioned for rising rates
• NII benefits from asset re-pricings in a rising rate environment – 64% of total loans are floating rate (82% of commercial and 36% of consumer) – Investment portfolio duration less than 5 years – Short-term wholesale funding represents approximately 4% of total funding – Approximately $11B in non-core funding matures beyond one year • Interest rate sensitivity tables are based on conservative deposit assumptions – 70% beta on all interest-bearing deposit and sweep balances (~50% betas experienced in 2004 – 2006 Fed tightening cycle) – No modeled re-pricing lag – Modeled non-interest bearing commercial DDA runoff of approximately $2.5B (about 10%) for each 100 bps increase in
rates – DDA runoff rolls into an interest bearing product with a 100% beta Change in Interest Rates (bps) +200 bps Shock Change in Interest Rates +100 bps Shock +200 bps Ramp 2.12% 6.98% (4.00%) +25 bps Shock +100 bps Ramp 1.20% 4.27% - -25 bps Shock -50 bps Ramp (2.00%) (2.67%) - Betas 25% Higher Betas 25% Lower Change in Interest Rates 12 Months 13 to 24 Months 12 Months Change in Interest Rates 12 Months 13 to 24 Months 12 Months 13 to 24 Months +200 bps Ramp 1.84% 6.43% 2.40% +200 bps Ramp (1.11%) 0.52% 5.35% 13.44% +100 bps Ramp 1.06% 3.99% 1.34% +100 bps Ramp (0.41%) 1.04% 2.82% 7.50% ESTIMATED NII SENSITIVITY PROFILE ESTIMATED EVE SENSITIVITY PROFILE Percent Change in NII (FTE) ALCO Policy Limits Change in EVE ALCO Policy Limit 12 Months 13 to 24 Months 12 Months 13 to 24 Months (12.00%) (0.90%) (6.00%) (0.10%) - (0.06%) (2.85%) ESTIMATED NII SENSITIVITY with DEPOSIT BETA CHANGES Percent Change in NII (FTE) Percent Change in NII (FTE) $1B Balance Decrease $1B Balance Increase 13 to 24 Months 7.54% 4.54% - ESTIMATED NII SENSITIVITY with DEMAND DEPOSIT BALANCE CHANGES |
 18 Fifth Third Bank | All Rights Reserved NPL rollforward NPL HFI Rollforward Commercial 1Q15 2Q15 3Q15 4Q15 1Q16 367 $ 325 $ 287 $ 286 $ 341 $ Transfers to nonperforming 80 66 195 165 306 Transfers to performing (1) (3) (2) (3) (3) Transfers from held for sale - - - - - Transfers to held for sale - - - (12) (3) Loans sold from portfolio (5) (3) (1) (2) (6) Loan paydowns/payoffs (62) (44) (46) (37) (39) Transfers to OREO (9) (10) - (13) (1) Charge-offs (45) (49) (149) (46) (60) Draws/other extensions of credit - 5 2 3 8 325 $ 287 $ 286 $ 341 $ 543 $ Consumer 1Q15 2Q15 3Q15 4Q15 1Q16 212 $ 201 $ 188 $ 172 $ 165 $ Transfers to nonperforming 54 55 55 56 55 Transfers to performing (23) (26) (30) (28) (33) Transfers from held for sale 5 - - - - Transfers to held for sale - - (1) - - Loans sold from portfolio - - - - - Loan paydowns/payoffs (8) (14) (11) (10) (9) Transfers to OREO (17) (10) (11) (9) (6) Charge-offs (22) (18) (18) (16) (14) Draws/other extensions of credit - - - - - 201 $ 188 $ 172 $ 165 $ 158 $ Total NPL 526 $ 475 $ 458 $ 506 $ 701 $ Total new nonaccrual loans - HFI 134 $ 121 $ 250 $ 221 $ 361 $ Beginning NPL amount Ending Commercial NPL Beginning NPL amount Ending Consumer NPL |
  19 Fifth Third Bank | All Rights Reserved Credit Trends Residential Mortgage Commercial & Industrial Home Equity & Automobile Commercial Real Estate * Excludes loans held-for-sale. ($ in millions) 1Q15 2Q15 3Q15 4Q15 1Q16 EOP Balance* $42,052 $42,800 $42,948 $42,131 $43,433 Avg Loans* $41,426 $42,550 $43,149 $43,154 $43,089 90+ days delinquent $2 $2 $3 $7 $3 as % of loans NM NM 0.01% 0.02% 0.01% NPAs* $216 $193 $183 $272 $472 as % of loans 0.58% 0.45% 0.43% 0.65% 1.09% Net charge-offs $38 $34 $128 $30 $46 as % of loans 0.38% 0.32% 1.17% 0.28% 0.43% C&I ($ in millions) 1Q15 2Q15 3Q15 4Q15 1Q16 EOP Balance* $7,209 $7,150 $7,061 $6,957 $6,864 Avg Loans* $7,241 $7,148 $7,023 $7,032 $6,886 NPAs* $186 $166 $165 $138 $126 as % of loans 2.56% 2.31% 2.34% 1.98% 1.84% Net charge-offs $1 $11 $11 $3 $6 as % of loans 0.05% 0.62% 0.66% 0.19% 0.35% Commercial mortgage ($ in millions) 1Q15 2Q15 3Q15 4Q15 1Q16 EOP Balance* $2,302 $2,709 $3,101 $3,214 $3,428 Avg Loans* $2,197 $2,549 $2,965 $3,141 $3,297 NPAs* $16 $14 $19 $8 $8 as % of loans 0.67% 0.51% 0.61% 0.25% 0.23% Net charge-offs - - $3 - - as % of loans (0.06%) 0.00% 0.43% 0.00% (0.06%) Commercial construction ($ in millions) 1Q15 2Q15 3Q15 4Q15 1Q16 EOP Balance* $12,569 $12,933 $13,392 $13,716 $13,895 Avg Loans* $12,433 $12,831 $13,144 $13,504 $13,788 90+ days delinquent $48 $43 $40 $40 $44 as % of loans 0.38% 0.33% 0.30% 0.29% 0.32% NPAs* $113 $101 $91 $86 $77 as % of loans 0.91% 0.78% 0.68% 0.63% 0.55% Net charge-offs $6 $5 $3 $3 $2 as % of loans 0.19% 0.16% 0.10% 0.08% 0.07% Residential mortgage ($ in millions) 1Q15 2Q15 3Q15 4Q15 1Q16 EOP Balance* $8,714 $8,547 $8,427 $8,301 $8,112 90+ days delinquent - - - - - as % of loans NM NM NM NM NM Net charge-offs $14 $9 $9 $9 $8 as % of loans 0.61% 0.41% 0.42% 0.39% 0.36% Home equity ($ in millions) 1Q15 2Q15 3Q15 4Q15 1Q16 EOP Balance* $11,873 $11,909 $11,826 $11,493 $11,128 90+ days delinquent $7 $8 $8 $10 $8 as % of loans 0.06% 0.07% 0.07% 0.09% 0.07% Net charge-offs $8 $4 $7 $9 $9 as % of loans 0.28% 0.14% 0.23% 0.31% 0.32% Automobile |
 20 Fifth Third Bank | All Rights Reserved Regulation G Non-GAAP reconciliation Fifth Third Bancorp and Subsidiaries Regulation G Non-GAAP Reconciliation $ and shares in millions (unaudited) March December September June March 2016 2015 2015 2015 2015 Income before income taxes (U.S. GAAP) 435 949 515 417 485 Add: Provision expense (U.S. GAAP) 119 91 156 79 69 Pre-provision net revenue 554 1,040 671 496 554 Net income available to common shareholders (U.S. GAAP) 312 634 366 292 346 Add: Intangible amortization, net of tax - - - - - Tangible net income available to common shareholders 312 634 366 292 346 Tangible net income available to common shareholders (annualized) (a) 1,255 2,515 1,452 1,171 1,403 Average Bancorp shareholders' equity (U.S. GAAP) 16,376 15,982 15,815 15,841 15,820 Less: Average preferred stock (1,331) (1,331) (1,331) (1,331) (1,331) Average goodwill (2,416) (2,416) (2,416) (2,416) (2,416) Average intangible assets and other servicing rights (12) (13) (14) (15) (15) Average tangible common equity (b) 12,617 12,222 12,054 12,079 12,058 Total Bancorp shareholders' equity (U.S. GAAP) 16,323 15,839 15,826 15,605 15,864 Less: Preferred stock (1,331) (1,331) (1,331) (1,331) (1,331) Goodwill (2,416) (2,416) (2,416) (2,416) (2,416) Intangible assets and other servicing rights (12) (13) (13) (14) (15) Tangible common equity, including unrealized gains / losses (c) 12,564 12,079 12,066 11,844 12,102 Less: Accumulated other comprehensive income (684) (197) (522) (291) (588) Tangible common equity, excluding unrealized gains / losses (d) 11,880 11,882 11,544 11,553 11,514 Total assets (U.S. GAAP) 142,430 141,048 141,883 141,628 140,437 Less: Goodwill (2,416) (2,416) (2,416) (2,416) (2,416) Intangible assets and other servicing rights (12) (13) (13) (14) (15) Tangible assets, including unrealized gains / losses (e) 140,002 138,619 139,454 139,198 138,006 Less: Accumulated other comprehensive income / loss, before tax (1,052) (303) (803) (448) (905) Tangible assets, excluding unrealized gains / losses (f) 138,950 138,316 138,651 138,750 137,101 Common shares outstanding (g) 770 785 795 810 815 Ratios: Return on average tangible common equity (a) / (b) 9.9% 20.6% 12.0% 9.7% 11.7% Tangible common equity (excluding unrealized gains/losses) (d) / (f) 8.55% 8.59% 8.33% 8.33% 8.40% Tangible common equity (including unrealized gains/losses) (c) / (e) 8.97% 8.71% 8.65% 8.51% 8.77% Tangible book value per share (c) / (g) $16.32 $15.39 $15.18 $14.62 $14.85 For the Three Months Ended |
 21 Fifth Third Bank | All Rights Reserved Regulation G Non-GAAP reconciliation Fifth Third Bancorp and Subsidiaries Regulation G Non-GAAP Reconciliation $ and shares in millions (unaudited) March December September June March 2016 2015 2015 2015 2015 Basel III Final Rule - Transitional to fully phased-in CET 1 capital (transitional) $11,914 $11,917 $11,574 $11,582 $11,543 Less: Adjustments to CET 1 capital from transitional to fully phased-in (3) (5) (8)
(11) (12)
(13) CET 1 capital (fully phased-in) (c)
11,909 11,909 11,563 11,570 11,530 Risk-weighted assets (transitional)
121,432 121,290 123,148 122,986 121,310 Add: Adjustments to risk-weighted assets from transitional to fully phased-in
(4) 1,027 1,178 1,136 1,280 1,182 Risk-weighted assets (fully phased-in) (d)
$122,459 $122,468 $124,284 $124,266 $122,492 Estimated CET 1 capital ratio under Basel III Final Rule (fully phased-in) (c) / (d)
9.72% 9.72% 9.30% 9.31% 9.41% (1) Primarily relates to disallowed intangible assets (other than goodwill and MSRs, net of associated deferred tax liabilities).
(2) Primarily relates to higher risk-weighting for MSRs. March December September June March 2016 2015 2015 2015 2015 Non-interest income excluding certain items Non-interest income (U.S. GAAP) $637 $1,104 $713 $556 $630 Gain on sale of Vantiv shares - (331)
- -
- Gain on Vantiv warrant
actions -
(89) -
- -
Vantiv TRA settlement payment - (49)
- -
- Vantiv warrant
valuation (47)
(21) (130)
(14) (70)
Gain on sale of certain branches
(8) -
- -
- Branch and land valuation
adjustments -
- -
97 -
Gain from sales of troubled debt restructurings - -
- -
(37) Impairment associated with aircraft leases
- -
- -
30 Valuation of 2009 Visa total return swap
(1) 10
8 2
17 Securities (gains) / losses
(3) (1)
- (4)
(4) Adjusted non-interest income
$578 $623 $591 $637 $566 Non-interest expense excluding certain items Non-interest expense (U.S. GAAP) $986 $963 $943 $947 $923 Contribution for Fifth Third Foundation - (10)
- -
(4) Severance expense
(15) (2)
(3) (2)
(1) Litigation reserve changes
- -
5 1
(2) Executive retirements
- -
(6) -
- Adjusted non-interest
expense $971
$951 $939 $946 $916 For the Three Months Ended For the Three Months Ended |