Attached files
| file | filename |
|---|---|
| 8-K - 8-K - CITIZENS FINANCIAL GROUP INC/RI | d105268d8k.htm |
| EX-99.1 - EX-99.1 - CITIZENS FINANCIAL GROUP INC/RI | d105268dex991.htm |
| EX-99.3 - EX-99.3 - CITIZENS FINANCIAL GROUP INC/RI | d105268dex993.htm |
  1Q16 Financial Results
April 21, 2016 Exhibit 99.2 |
 Forward-looking statements
2 This document contains forward-looking statements within the Private Securities Litigation Reform Act of 1995. Any statement that does not describe historical or current facts is a forward-looking statement. These statements often include the words “believes,” “expects,” “anticipates,” “estimates,” “intends,” “plans,” “goals,” “targets,” “initiatives,” “potentially,” “probably,” “projects,” “outlook” or similar expressions or future conditional verbs such as “may,” “will,” “should,” “would,” and “could.” Forward-looking statements are based upon the current beliefs and expectations of management, and on information currently available to management. Our statements speak as of the date hereof, and we do not assume any obligation to update these statements or to update the reasons why actual results could differ from those contained in such statements in light of new information or future events. We caution you, therefore, against relying on any of these forward-looking statements. They are neither statements of historical fact nor guarantees or assurances of future performance. While there is no assurance that any list of risks and uncertainties or risk factors is complete, important factors that could cause actual results to differ materially from those in the forward-looking statements include the following, without limitation: negative economic conditions that adversely affect the general economy, housing prices, the job market, consumer confidence and spending habits which may affect, among other things, the level of nonperforming assets, charge-offs and provision expense; the rate of growth in the economy and employment levels, as well as general business and economic conditions; our ability to implement our strategic plan, including the cost savings and efficiency components, and achieve our indicative performance targets; our ability to remedy regulatory deficiencies and meet supervisory requirements and expectations; liabilities and business restrictions resulting from litigation and regulatory investigations; our capital and liquidity requirements (including under regulatory capital standards, such as the Basel III capital standards) and our ability to generate capital internally or raise capital on favorable terms; the effect of the current low interest rate environment or changes in interest rates on our net interest income, net interest margin and our mortgage originations, mortgage servicing rights and mortgages held for sale; changes in interest rates and market liquidity, as well as the magnitude of such changes, which may reduce interest margins, impact funding sources and affect the ability to originate and distribute financial products in the primary and secondary markets; the effect of changes in the level of checking or savings account deposits on our funding costs and net interest margin; financial services reform and other current, pending or future legislation or regulation that could have a negative effect on our revenue and businesses, including the Dodd- Frank Act and other legislation and regulation relating to bank products and services; a failure in or breach of our operational or security systems or infrastructure, or those of our third party vendors or other service providers, including as a result of cyber attacks; management’s ability to identify and manage these and other risks; and any failure by us to successfully replicate or replace certain functions, systems and infrastructure provided by The Royal Bank of Scotland Group plc (RBS). In addition to the above factors, we also caution that the amount and timing of any future common stock dividends or share repurchases will depend on our financial condition, earnings, cash needs, regulatory constraints, capital requirements (including requirements of our subsidiaries), and any other factors that our board of directors deems relevant in making such a determination. Therefore, there can be no assurance that we will pay any dividends to holders of our common stock, or as to the amount of any such dividends. More information about factors that could cause actual results to differ materially from those described in the forward-looking statements can be found under “Risk Factors” in Part I, Item 1A in our Annual Report on Form 10-K for the year ended December 31, 2015, filed with the United States Securities and Exchange Commission on February 26, 2016. Note: Percentage changes, per share amounts and ratios presented in this document are calculated using whole dollars. |
 Generated 7% 1Q16 YoY average loan growth, with strength in both commercial
and consumer NII up 8% YoY and 4% QoQ
– Loan yields improved 12 bps and deposit costs flat from 4Q15 Consumer Banking initiatives — 1% household growth YoY led by strong checking engagement, continued growth in student; regaining momentum in Wealth; stabilizing Mortgage Commercial Banking initiatives — Strong loan growth, up 9% YoY; Treasury Solutions fees up 20% YoY; Capital Markets fees rebounded from market weakness in 4Q15
On track to deliver $90-115 million of pre-tax benefit from TOP II in
2016 1Q16 highlights
3 Improving profitability and returns Strong capital, liquidity and funding Excellent credit quality and progress on risk management Continued progress on strategic growth, efficiency and balance sheet optimization initiatives Robust capital levels with a common equity tier 1 ratio of 11.6% (2) 1Q16 average deposits increased $6.3 billion, or 7% vs. 1Q15; loan-to-deposit ratio of 99%
Repurchased $125 million of sub-debt and issued $750 million of senior
notes Announced increase in quarterly dividend of 20% to 12¢/common share to holders of record on May 4, 2016 Provision expense was stable with 4Q15; rose from 1Q15 levels which included higher commercial recoveries
NPLs to total loans and leases of 1.07% remained stable with 4Q15 and improved
from 1.20% in 1Q15 despite oil & gas downgrades
– Transferred $373 million of consumer real estate TDRs to held for sale in advance of a targeted June/July sale
Allowance coverage of NPLs 113% vs. 115% in 4Q15 and 106% in 1Q15
GAAP diluted EPS of $0.41 up 8% from 1Q15 and up 5% from Adjusted (1) diluted EPS Adjusted (1) operating leverage of 3% YoY NIM improved 9 bps to 2.86% from 2.77% in 1Q15 and 4Q15 ROTCE and efficiency ratio stable with 4Q15 (1) 1)
Non-GAAP item. Where there is a reference to an “Adjusted” result
in a paragraph, all measures which follow that “Adjusted” result are also “Adjusted” and exclude restructuring charges and special items as applicable. See important information on use and reconciliation of Non-GAAP items in the Appendix. There were no net
restructuring charges and special items recorded in 1Q16 or 4Q15.
2)
Current period regulatory capital ratios are preliminary. |
 1Q16 change from
$s in millions
1Q16 4Q15 1Q15 4Q15 1Q15 $ % $ % Net interest income 904 $ 870 $ 836 $ 34 $ 4 % 68 $ 8 % Noninterest income 330 362 347 (32) (9) (17) (5) Total revenue 1,234 1,232 1,183 2 — 51 4 Noninterest expense 811 810 810 1 — 1 — Pre-provision profit 423 422 373 1 — 50 13 Provision for credit losses 91 91 58 — — 33 57 Income before income tax expense 332 331 315 1 — 17 5 Income tax expense 109 110 106 (1) (1) 3 3 Net income 223 $ 221 $ 209 $ 2 $ 1 14 $ 7 Preferred dividends 7 $ — $ — $ 7 $ 100 7 $ 100 Net income available to common stockholders 216 $ 221 $ 209 $ (5) $ (2) % 7 $ 3 % $s in billions Average interest-earning assets 126.2 $ 124.2 $ 121.3 $ 2.0 $ 2 % 4.8 $ 4 % Average deposits 102.0 $ 101.4 $ 95.6 $ 0.6 $ 1 % 6.3 $ 7 % Key metrics Net interest margin 2.86 % 2.77 % 2.77 % 9 bps 9 bps Loan-to-deposit ratio (2) 99.2 % 96.9 % 95.8 % 222 bps 332 bps ROTCE (1,3) 6.6 % 6.7 % 6.5 % (14) bps 8 bps ROTA (1,4) 0.7 % 0.7 % 0.7 % 1 bps 1 bps Efficiency ratio (1) 66 % 66 % 68 % (10) bps (283) bps FTEs (5) 17,902 17,714 17,792 188 1 % 110 1 % Per common share Diluted earnings 0.41 $ 0.42 $ 0.38 $ (0.01) $ (2) % 0.03 $ 8 % Tangible book value (1) 25.21 $ 24.63 $ 23.96 $ 0.58 $ 2 % 1.25 $ 5 % Average diluted shares outstanding (in millions) 530.4 530.3 549.8 0.2 — % (19.4) (4) % Financial summary — GAAP 4 1) Non-GAAP item. See important information on use of Non-GAAP items in the Appendix.
2) Includes held for sale. Loan-to-deposit ratio is period end. 3) Return on average tangible common equity. 4) Return on average total tangible assets. 5) Full-time equivalent employees. Linked quarter: GAAP net income improved modestly from 4Q15 – Diluted EPS reduced $0.01 by the preferred dividend NII up $34 million driven by 2% average loan growth and a 9 bp improvement in NIM Noninterest income decreased $32 million, or 9%, as seasonally lower service charges and lower card fees, reflecting a $7 million card
reward accounting change, were partially offset by a rebound in
Capital Markets fees
Noninterest expense remained relatively stable as seasonally higher
salaries and benefits were offset by lower outside services and
the card reward accounting change benefit
Provision for credit losses was stable as increased commercial
charge-offs were partially offset by a reduction in retail
charge-offs Prior-year quarter:
GAAP net income increased $14 million, or 7%, reflecting 4% positive
operating leverage. Diluted EPS were up 8%
NII up $68 million driven by 7% average loan growth, improved
earning asset yields and mix, partially offset by higher borrowing and
deposit costs and an FRB stock dividend reduction. NIM increased
by 9 bps
Noninterest income decreased $17 million as growth in service
charges and fees was more than offset by lower mortgage banking
fees and a $7 million impact from a card reward accounting change
Noninterest expense remained stable as a slight increase in salaries and employee benefits and higher outsourcing costs and equipment expense were partially offset by the card reward accounting change impact – Efficiency ratio improved 283 bps (1) Provision expense increased $33 million from 1Q15 levels which included $28 million in commercial recoveries, reflecting loan growth and a gradual return to more normalized charge-off rates Highlights |
 1Q16 change from
$s in millions
1Q16 4Q15 1Q15 4Q15 1Q15 $ % $ % Net interest income 904 $ 870 $ 836 $ 34 $ 4 % 68 $ 8 % Noninterest income 330 362 347 (32) (9) (17) (5) Total revenue 1,234 1,232 1,183 2 — 51 4 Adjusted noninterest expense (1) 811 810 800 1 — 11 1 Adjusted pre-provision profit (1) 423 422 383 1 — 40 10 Provision for credit losses 91 91 58 — — 33 57 Adjusted pretax income (1) 332 331 325 1 — 7 2 Adjusted income tax expense (1) 109 110 110 (1) (1) (1) (1) Adjusted net income (1) 223 221 215 2 1 8 $ 4 Preferred dividends 7 $ — $ — $ 7 $ 100 7 $ 100 Adjusted net income available to common stockholders (1) 216 $ 221 $ 215 $ (5) $ (2) % 1 $ — % $s in billions Average interest-earning assets 126.2 $ 124.2 $ 121.3 $ 2.0 $ 2 % 4.8 $ 4 % Average deposits 102.0 $ 101.4 $ 95.6 $ 0.6 $ 1 % 6.3 $ 7 % Key metrics Net interest margin 2.86 % 2.77 % 2.77 % 9 bps 9 bps Loan-to-deposit ratio (2) 99.2 % 96.9 % 95.8 % 222 bps 332 bps Adjusted ROTCE (1,3) 6.6 % 6.7 % 6.7 % (14) bps (12) bps Adjusted ROTA (1,4) 0.7 % 0.7 % 0.7 % 1 bps (1) bps Adjusted efficiency ratio (1) 66 % 66 % 68 % (10) bps (199) bps FTEs (5) 17,902 17,714 17,792 188 1 % 110 1 % Per common share Adjusted diluted EPS (1) 0.41 $ 0.42 $ 0.39 $ (0.01) $ (2) % 0.02 $ 5 % Tangible book value (1) 25.21 $ 24.63 $ 23.96 $ 0.58 $ 2 % 1.25 $ 5 % Average diluted shares outstanding (in millions) 530.4 530.3 549.8 0.2 — % (19.4) (4) % Adjusted financial summary — excluding restructuring charges and special items (1) 5 1) Non-GAAP item. Adjusted results exclude the effect of net restructuring charges and special items associated with efficiency and effectiveness programs and separation from RBS. See important information on use of Non-GAAP items in the Appendix.
2) Includes held for sale. Loan-to-deposit ratio is period-end. 3) Adjusted return on average tangible common equity. 4) Adjusted return on average total tangible assets. 5) Full-time equivalent employees. Highlights Linked quarter: Net income improved modestly from 4Q15 – Diluted EPS reduced $0.01 by the preferred dividend NII up $34 million driven by 2% average loan growth and a 9 bp improvement in NIM Noninterest income decreased $32 million, or 9%, as seasonally lower service charges and lower card fees, reflecting a $7 million card reward accounting change, were partially offset by a rebound in Capital Markets fees Noninterest expense remained relatively stable as seasonally higher salaries and benefits were offset by lower outside services and the card reward accounting change benefit Provision for credit losses was stable as increased commercial charge-offs were partially offset by a reduction in retail charge-offs
Prior-year
Adjusted (1) quarter: Net income increased $8 million, or 4%, reflecting 3% positive operating leverage. Adjusted diluted EPS were up 5% NII up $68 million driven by 7% average loan growth, improved earning asset yields and mix, partially offset by higher borrowing and deposit costs and an FRB stock dividend reduction. NIM increased by 9 bps Noninterest income decreased $17 million as growth in service charges and fees was more than offset by lower mortgage banking fees and a $7 million impact from a card reward accounting change Noninterest expense up $11 million from Adjusted 1Q15, as growth in salaries and employee benefits, as well as higher outsourcing costs, were partially offset by lower insurance and taxes and a $7 million card reward accounting change impact – Efficiency ratio improved ~200 bps (1) Provision expense increased $33 million from 1Q15 levels which included $28 million in commercial recoveries, reflecting loan growth and a gradual return to more normalized charge-off rates |
 Net
interest income 6
Highlights 1) Includes interest-bearing cash and due from banks and deposits in banks.
Linked quarter:
NII up $34 million, or 4%
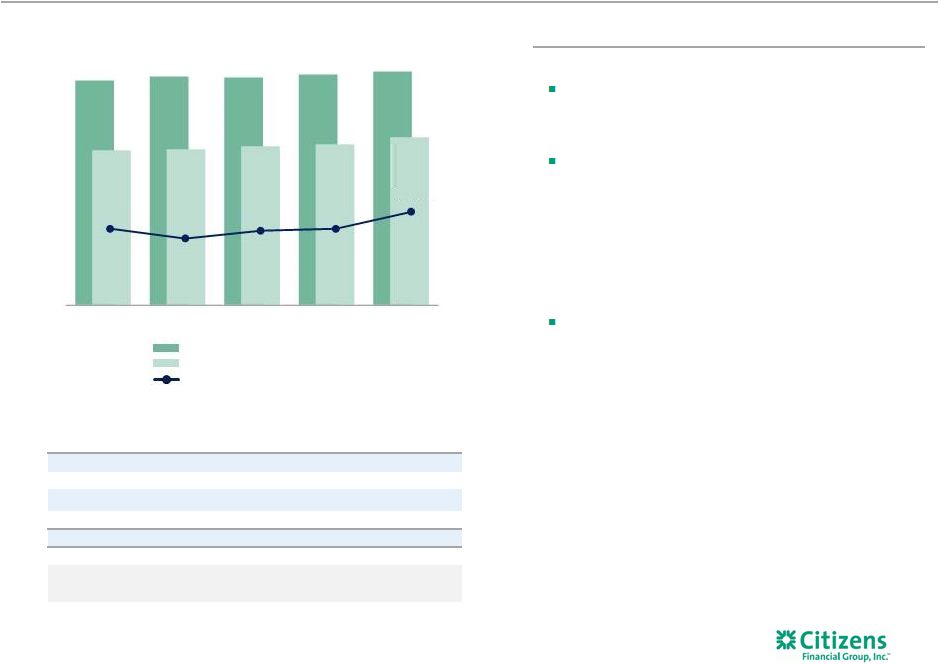
– Reflects 2% average loan growth driven by commercial, student and mortgage loans, and a 9 bp improvement in NIM, partially offset by lower day count NIM improved 9 bps to 2.86% – Benefitted from December rate increase, initiatives to improve loan yields and mix and lower pay-fixed swap costs, partially offset by the lower FRB stock dividend and higher borrowing costs – Deposit costs remained stable; Consumer Banking down 3 bps offset by expected increase in Commercial Banking Prior-year quarter: NII up $68 million, or 8%, with NIM up 9 bps – Reflects 7% average loan growth – Improving retail and commercial loan yields partially offset the impact of an FRB stock dividend decrease as well as higher deposit costs Net interest income $s in millions, except earning assets Average interest earning assets Average interest earning assets Net interest income Net interest margin $s in billions 1Q15 2Q15 3Q15 4Q15 1Q16 Retail loans $50.4 $50.9 $51.6 $52.4 $53.2 Commercial loans 43.5 44.7 45.2 45.8 47.0 Investments and cash (1) 27.1 27.1 25.8 25.7 25.5 Loans held for sale 0.3 0.5 0.5 0.3 0.4 Total interest-earning assets $121.3 $123.2 $123.0 $124.2 $126.2 Loan Yields 3.34% 3.30% 3.32% 3.34% 3.46% Total cost of funds 0.39% 0.40% 0.41% 0.41% 0.40% 2.77% 2.72% 2.76% 2.77% 2.86% $121B $123B $123B $124B $126B $836 $840 $856 $870 $904 1Q15 2Q15 3Q15 4Q15 1Q16 |
 Net
interest margin 7
2.77% 2.86% 0.11% – % – % (0.02%) 4Q15 NIM% Loan yields Investment portfolio yields Deposit costs Borrowing costs/other 1Q16 NIM% 2.77% 2.86% 0.10% 0.03% (0.01%) (0.03%) 1Q15 NIM% Loan yields Investment portfolio yields Deposit costs Borrowing costs/other 1Q16 NIM% NIM walk 1Q15 to 1Q16 NIM walk 4Q15 to 1Q16 |
 1Q16 change from
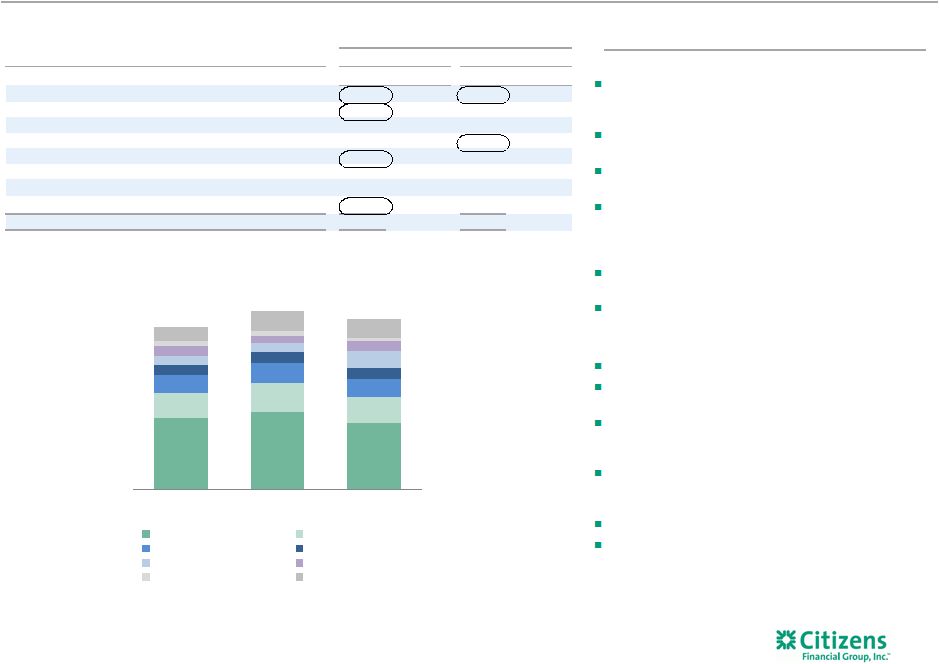
1Q16 4Q15 1Q15 4Q15 1Q15 $ % $ % Service charges and fees 144 $ 156 $ 135 $ (12) $ (8) % 9 $ 7 % Card fees 50 60 52 (10) (17) (2) (4) Trust & investment services fees 37 39 36 (2) (5) 1 3 Mortgage banking fees
18 20 33 (2) (10) (15) (45) Capital markets fees 22 15 22 7 47 — — FX & LC fees 21 23 23 (2) (9) (2) (9) Securities gains, net 9 10 8 (1) (10) 1 13 Other income (1) 29 39 38 (10) (26) (9) (24) Noninterest income 330 $ 362 $ 347 $ (32) $ (9) % (17) $ (5) % Noninterest income Linked quarter: Noninterest income decreased $32 million, or 9%, which reflects the impact of seasonality, market volatility and an accounting change Service charges and fees decreased $12 million, reflecting seasonality and lower loan prepayment fees Card fees decreased $10 million, driven by a $7 million card reward accounting change impact as well as seasonality Mortgage banking fees decreased $2 million largely reflecting a reduction in MSR valuation, partially offset by the benefit of higher sale gains and spreads, and higher application volumes Capital Markets fees improved $7 million from weak market conditions in 4Q15 Other income decreased $10 million, largely reflecting lower interest-rate product and leasing income Prior-year quarter: Noninterest income decreased $17 million, or 5% Service charges and fees were up 7% reflecting improved household growth and commercial pricing initiatives Mortgage banking fees decreased $15 million from 1Q15 which included $10 million portfolio sale gain, also reflecting lower volume and a reduction in MSR valuation Card fees down $2 million, as improved volumes were more than offset by a $7 million impact from a card reward accounting change Weaker results in FX & LC fees reflecting market conditions Other income decreased $9 million, largely reflecting lower leasing income 8 Highlights 1) Other income includes bank-owned life insurance and other income. $s in millions $330 $362 $347 1Q16 4Q15 1Q15 Service charges and fees Card fees Trust and inv services FX & LC fees Mortgage banking fees Capital markets fee income Securities gains (losses) Other income (1) |
 Adjusted noninterest expense
— excluding restructuring
charges and special items (1)
Linked quarter:
Noninterest expense relatively stable
– Higher salaries and employee benefits and occupancy expense were partially offset by lower outside services from seasonally higher 4Q levels and other expense Salaries and employee benefits up $21 million driven by $16 million increase in payroll taxes – FTEs up 188 largely reflecting additions to support mortgage originators and risk, compliance and operations Outside services down $11 million from seasonally higher 4Q15 levels Other expense decreased $10 million and included a $7 million benefit tied to card reward accounting change Prior-year quarter: Noninterest expense increased $11 million from Adjusted (1) 1Q15 levels Salaries and employee benefits up $5 million largely reflecting investments to drive future revenue growth and improve risk and operations, partially offset by ongoing efficiency initiatives Outside services increased $20 million driven by technology outsourcing and incremental investments to drive future revenue growth Equipment expense increase driven by depreciation for technology projects put into service, including new data center 9 Highlights 1) Non-GAAP item. Adjusted results exclude the effect of net restructuring charges and special items associated with efficiency and effectiveness programs and separation from RBS. See important information on use of Non-GAAP items in the Appendix.
. Full-time equivalents (FTEs) 17,902 17,714 17,792 (1) (1) (1) (1) (1) (1) (1) 1Q16 change from $s in millions 1Q16 4Q15 1Q15 4Q15 1Q15 $ % $ % Adjusted salaries and benefits (1) 425 $ 404 $ 420 $ 21 $ 5 % 5 $ 1 % Adjusted occupancy (1) 76 74 78 2 3 (2) (3) Adjusted equipment expense (1) 65 67 62 (2) (3) 3 5 Adjusted outside services (1) 91 102 71 (11) (11) 20 28 Amortization of software 39 38 36 1 3 3 8 Other expense 115 125 133 (10) (8) (18) (14) Adjusted noninterest expense (1) 811 $ 810 $ 800 $ 1 $ — % 11 $ 1 % Restructuring charges and special items — — 10 — — (10) (100) Total noninterest expense 811 $ 810 $ 810 $ 1 $ — % 1 $ — % $811 $810 $800 66% 66% 68% 1Q16 4Q15 1Q15 Adjusted salary and benefits Adjusted occupancy & equip Adjusted all other Adjusted efficiency ratio |
 Consolidated average balance sheet
Linked quarter:
Total earning assets up $2.0 billion, or 2%, with loan
growth of $2.1 billion, or 2%
Commercial loans up $1.2 billion driven by solid
growth in Mid-corporate and Industry Verticals,
Corporate Finance and Commercial Real Estate
Retail loans up $839 million driven by student,
mortgage and iPhone upgrade program (iUp)
Total deposits increased $613 million on strength in
low-cost core deposits, partially offset by lower money
market balances
Prior-year quarter:
Total earning assets up $4.8 billion, or 4%
Commercial loans up 8% driven by strength in
Commercial Real Estate, Corporate Finance, Mid-
corporate and Industry Verticals and Franchise
Finance Retail loans up 5% driven by growth in student, mortgage and auto Total deposits up $6.3 billion, or 7%, reflecting strength in DDA and checking with interest as well as money market Borrowed funds down $1.6 billion Senior debt and sub-debt issuances replaced short- term FHLB and repos 10 Highlights Note: Loan portfolio trends reflect non-core portfolio impact not included in segment results on pages 11 & 12.
1) Low-cost core deposits include demand, checking with interest and regular savings.
1Q16 change from
$s in billions 1Q16 4Q15 1Q15 4Q15 1Q15 $ % $ % Investments and interest bearing deposits 25.5 $ 25.7 $ 27.1 $ (0.1) $ — % (1.5) $ (6) % Total commercial loans 47.0 45.8 43.5 1.2 3 3.5 8 Total retail loans
53.2 52.4 50.4 0.8 2 2.8 5 Total loans and leases
100.3 98.2 94.0 2.1 2 6.3 7 Loans held for sale
0.4 0.3 0.3 — 5 — 7 Total interest-earning assets
126.2 124.2 121.3 2.0 2 4.8 4 Total noninterest-earning assets
12.6 12.1 12.0 0.5 4 0.6 5 Total assets 138.8 $ 136.3 $ 133.3 $ 2.5 $ 2 5.5 $ 4 Low-cost core deposits
(1) 53.6 52.7 49.8 0.9 2 3.7 8 Money market deposits
36.2 36.5 33.6 (0.3) (1) 2.6 8 Term deposits
12.2 12.2 12.2 — — — — Total deposits 102.0 $ 101.4 $ 95.6 $ 0.6 $ 1 6.3 $ 7 Total borrowed funds
13.9 12.6 15.5 1.3 10 (1.6) (11) Total liabilities 119.0 $ 116.7 $ 113.9 $ 2.3 $ 2 5.0 $ 4 Total stockholders' equity
19.8 19.6 19.4 0.2 1 0.4 2 Total liabilities and equity
138.8 $ 136.3 $ 133.3 $ 2.5 $ 2 % 5.5 $ 4 % $126.2 billion Interest earning assets $115.9 billion Deposits/borrowed funds Total Retail 43% Total Commercial 37% CRE Other Commercial Residential mortgage Total home equity Automobile Other Retail Investments and interest-bearing deposits Retail / Personal Commercial/ Municipal/ Wholesale Borrowed funds 7% 30% 11% 15% 11% 6% 20% 50% 38% 12% — — — — — |
 Consumer Banking average loans and leases
11 1) Other includes Credit Card, RV, Marine, Other. $s in billions Linked quarter: Average loans increased $1.0 billion, or 2%, largely reflecting growth in higher yielding student, mortgage and iUp balances Consumer loan yields up 11 bps, reflecting higher interest rates and continued improvement in mix Prior-year quarter: Average loans increased $3.4 billion, or 7%, as growth of $2.2 billion in student, $1.8 billion in mortgages and $859 million in auto was partially offset by a $1.4 billion decrease in home equity outstandings Consumer loan yields up 12 bps, reflecting focus on driving improved risk-adjusted returns Recent developments: Mortgage originations of $1.4 billion in 1Q16 with a 30% increase in applications Highlights $10.9 $11.1 $11.6 $12.2 $12.7 $18.4 $18.0 $17.6 $17.2 $17.0 $12.9 $13.5 $13.8 $13.8 $13.8 $2.3 $2.7 $3.2 $3.7 $4.5 $3.1 $3.1 $3.0 $3.0 $3.0 $2.5 $2.3 $2.4 $2.6 $2.5 $50.1B $50.7B $51.6B $52.5B $53.5B 1Q15 2Q15 3Q15 4Q15 1Q16 Mortgage Home Equity Auto Student Business Banking Other Average loans and leases (1) Yields 3.72% 3.68% 3.69% 3.73% 3.84% |
 Commercial Banking average loans and leases
Linked quarter:
Average loans up $1.3 billion, or 3%, with solid growth in
Mid- corporate and Industry Verticals, Corporate Finance and
Commercial Real Estate
Results reflect solid loan demand coupled with enhanced client
targeting efforts, along with continued pricing and credit
discipline Loan yields increased 18 bps driven by higher
rates Prior-year quarter:
Average loans up $3.7 billion, or 9%, on strength in Commercial Real
Estate, Corporate Finance, Mid-corporate and Industry
Verticals and Franchise Finance
Loan yields increased 18 bps reflecting higher rates and improved
mix 12
1) Other includes Business Capital, Govt & Professional Banking, Corporate Finance, Treasury Solutions, Corporate and Commercial Banking Admin. Highlights $s in billions Average loans and leases Yields 2.57% 2.56% 2.57% 2.57% 2.75% $6.2 $6.4 $6.2 $6.5 $6.4 $2.9 $3.0 $3.0 $3.1 $3.5 $2.9 $3.1 $3.2 $3.4 $3.8 $12.0 $12.2 $12.0 $11.8 $11.9 $6.1 $6.1 $6.1 $6.1 $6.2 $7.4 $7.7 $8.2 $8.5 $8.7 $2.6 $2.8 $3.1 $3.1 $3.3 $40.1B $41.3B $41.8B $42.5B $43.8B 1Q15 2Q15 3Q15 4Q15 1Q16 Mid-Corporate Industry Verticals Franchise Finance Middle Market Asset Finance Commercial Real Estate Other (1) |
 Average funding and cost of funds
Linked quarter:
Total average deposits up $613 million
Growth in interest checking and money market and savings
partially offset by lower Commercial Banking DDA balances
Total deposit costs remained stable reflecting disciplined
pricing actions in Consumer Banking, offset by expected
rates-driven uptick in Commercial Banking
Continued progress in repositioning liabilities structure to align
better with peers
Repurchased $125 million of holding company sub-debt
and issued $750 million in bank senior notes
Prior-year quarter:
Total average deposits increased $6.3 billion, or 7%, on strength
across all categories
Total deposit cost of funds increased 2 bps
13 Highlights Average interest-bearing liabilities and DDA $s in billions $41.7 $43.0 $44.6 $44.6 $44.6 $25.8 $26.4 $26.8 $27.5 $27.2 $16.0 $16.6 $16.9 $17.1 $18.0 $12.2 $12.6 $12.7 $12.2 $12.2 $4.6 $4.4 $2.9 $1.6 $0.9 $7.0 $6.5 $5.1 $5.0 $3.1 $3.9 $3.9 $4.1 $6.0 $9.9 $111.2B $113.3B $113.0B $114.0B $115.9B 1Q15 2Q15 3Q15 4Q15 1Q16 Money market & savings DDA Checking with interest Term & time deposits Total fed funds & repo Short-term borrowed funds Total long-term borrowings Deposit cost of funds 0.22% 0.24% 0.25% 0.24% 0.24% Total cost of funds 0.39% 0.40% 0.41% 0.41% 0.40% |
 Overall credit quality remains solid with charge offs and NPLs relatively
stable Net charge-offs of $83 million, or 0.33% of average
loans and leases increased modestly from 4Q15;
Commercial NCOs beginning to normalize but retail NCOs decreased linked
quarter, in part due to seasonality
Up 10 bps from 1Q15, which included an unusually high $28 million of
commercial recoveries
NPLs to total loans and leases remained stable at 1.07% as an increase in
commercial NPLs was largely offset by reduction in
retail Oil & gas portfolio NPLs up $210 million
TDR transaction and reclassification of GSE guaranteed loans reduced NPLs by
$97 million and $77 million, respectively
Provision for credit losses of $91 million stable with 4Q15
Reserve increase related to the oil & gas portfolio was partially offset
by the benefit related to the planned TDR transaction as well as
improvement in retail Strong credit quality trends
continue 14
Highlights 1) Allowance for loan and lease losses to nonperforming loans and leases. $s in millions $54 $78 $75 $77 $83 $58 $77 $76 $91 $91 $1.1B $1.1B $1.0B $1.1B $1.1B 1Q15 2Q15 3Q15 4Q15 1Q16 Net charge-offs Provision for credit losses ($22) $7 $5 ($3) $9 $69 $68 $66 $73 $67 $7 $3 $4 $7 $7 $54 $78 $75 $77 $83 0.23% 0.33% 0.31% 0.31% 0.33% 1Q15 2Q15 3Q15 4Q15 1Q16 Commercial Retail SBO Net c/o ratio Net charge-offs (recoveries) Provision for credit losses, charge-offs, NPLs NPLs to loans and leases NPLs $1,202 $1,201 $1,201 $1,216 $1,224 106% 114% 116% 115% 113% 1Q15 2Q15 3Q15 4Q15 1Q16 Allowance for loan and lease losses NPL coverage ratio Allowance for loan and lease losses (1) 1.20% 1.09% 1.06% 1.07% 1.07% 1.27% 1.24% 1.23% 1.23% 1.21% Allowance to loan coverage ratio |
 Planned TDR transaction highlights
15 Planned TDR transaction expected to further improve credit profile and is consistent with overall balance sheet optimization strategies Reduces NPLs by $97 million, or 8.2%, in 1Q16 Expect targeted sale to result in a gain in 2Q/3Q Reflects active market for TDR assets and the benefit of continued home price appreciation Expected to enhance returns and provide partial offset to pending FDIC assessment increase after 2Q16 Highlights TDR transaction detail Category Total Mortgage Home Equity Total Mortgage Total Performing 158 54 212 64 64 276 $ Nonperforming 50 31 81 16 16 97 $ Total 208 $ 85 $ 293 $ 80 $ 80 $ 373 $ Consumer Banking Segment Other $s in millions $373 million of loans transferred to held for sale at 3/31/16: Consumer $208 million core mortgage loans $85 million core home equity loans Other $80 million non-core mortgage loans |
 Capital and liquidity remain strong
16 Highlights 1) Current reporting period regulatory capital ratios are preliminary. 2) Basel III ratios assume that certain definitions impacting qualifying Basel III capital will phase in through 2019. Ratios also reflect
the required U.S. Standardized methodology for calculating RWAs,
effective January 1, 2015.
3) This is a non-GAAP financial measure. See important information on use of non-GAAP items in the Appendix.
4) Based on the September 2014 release of the U.S. version of the Liquidity Coverage Ratio (LCR). Note that as a modified LCR company,
CFG’s minimal LCR requirement of 90% began January 2016.
5) Period end includes held for sale. Capital levels remain above regional peers 1Q16 Basel III common equity tier 1 ratio (transitional basis) down approximately 10 basis points from 4Q15 Net income: ~19 bps increase RWA growth: ~25 bps decrease Dividends & other: ~4 bps decrease LDR increased from 97% in 4Q15 to 99% in 1Q16 Fully compliant with LCR requirement (4) Repurchased $125 million of sub-debt not included in 2015 CCAR submission Announced increase in quarterly dividend of 20% to 12¢/common share to holders of record on May 4, 2016
15.5% 15.3% 15.4% 15.3% 15.1% 12.2% 11.8% 11.8% 11.7% 11.6% 1Q15 2Q15 3Q15 4Q15 1Q16 Total capital ratio Common equity tier 1 ratio 96% 97% 96% 97% 99% 1Q15 2Q15 3Q15 4Q15 1Q16 as of $s in billions (period-end) 1Q15 2Q15 3Q15 4Q15 1Q16 Basel III transitional basis (1,2) Common equity tier 1 capital 13.4 $ 13.3 $ 13.2 $ 13.4 $ 13.6 $ Risk-weighted assets 109.8 $ 112.1 $ 112.3 $ 114.1 $ 116.6 $ Common equity tier 1 ratio 12.2 % 11.8 % 11.8 % 11.7 % 11.6 % Total capital ratio 15.5 % 15.3 % 15.4 % 15.3 % 15.1 % Basel III fully phased-in (1,3) Common equity tier 1 ratio 12.1% 11.8% 11.7% 11.7% 11.6% Basel III minimum for CET1 ratio 2015 2016 2017 2018 2019 Basel III minimum plus phased-in capital conservation buffer 4.5 % 5.1 % 5.8 % 6.4 % 7.0 % Loan-to-deposit ratio (5) Capital ratio trend (1,2) (1,2) |
 Summary of progress on strategic initiatives
17 1) Excludes the impact of $335 million transfer of loan balances to Franchise Finance.
Reenergize household growth
Expand mortgage sales force Grow Auto Grow Student/Installment Expand Business Banking Expand Wealth sales force Build out Mid-Corp & verticals Continue development of Capital and Global Markets activities Build out Treasury Solutions Grow Franchise Finance Expand Middle Market Grow CRE Reposition Asset Finance Balance Sheet Optimization Top II Retail checking households grew by ~15,000 or 1% vs. 1Q15. Deposits up 5% vs. prior year quarter and services
charges up 5%.
Origination volume up 15% from the prior year quarter, though LOs relatively flat and conforming mix below
40%. Work continues to improve operational processes.
Continue to execute on pricing optimization strategy, with stable credit performance. 1Q16 organic origination
yields of 3.54%, up 4 bps from prior quarter and 11 bps from
1Q15. Sustained momentum in Student with total loan balances doubling from 1Q15.
Continued strong growth in Apple iPhone product with
approximately $310 million of balances by the end of 1Q16. Increasing focus on deposits, cash management, and other fee income streams
driving deposits up 6% and deposit fees up 7% compared to 1Q15.
Financial consultants up 8%, or 25, vs. 1Q15 with strong hiring momentum in 1Q16. Continue to reposition
business from transaction to fee-based model, notwithstanding market
volatility. Mid-Corp and specialty verticals grew loan balances by over 10% vs. 1Q15.
Continue to see strong growth in verticals driven by building
industry-based expertise. Business holding fee income flat despite continuing weak market conditions.
Rolling out enhanced interest rate products and FX originations
platform in 2Q16 to improve delivery and risk management. Fees up 20% vs. 1Q15 led by strength in core cash management services, TOP II
pricing initiative, and commercial card.
Portfolio relatively stable compared to 1Q15, and up 1% vs. prior quarter. Deposits up ~$450 million, or 6%,
and fee income up 6% versus prior year quarter.
Continue to deepen relationships with top developers across core geographies. CRE loans up 2% QoQ and 17%
YoY to $8.7 billion. Origination yields up 47 bps from 4Q15.
Re-aligned business to reduce expense and drive increased penetration with Middle Market customer base.
Portfolio balances up 1% compared to 4Q15, supported by initiatives targeting
transportation, construction, and renewable sectors.
Asset optimization and deposit costs efforts led to NIM improvement in 1Q16. NIM of 2.86% in 1Q16 was 9
bps higher than both 4Q15 and 1Q15 with roughly 5 bps of benefit from Fed
increase and 4 bps due to balance sheet initiatives. Cost of
deposits remained flat from 4Q15 at 24 bps. Initiatives performing well in 1Q16. Remain on track to deliver $90-$115
million of P&L benefit in 2016. Strong growth with balances up 21% YoY (1) . Continue expansion in well-established brands of quick service and
fast casual franchises.
Initiative 1Q16 Status Commentary |
 2Q16 outlook (1) 18 1) Does not reflect impact of the targeted TDR loan sale. See page 15 for more information on expected TDR sale.
Net interest income,
net interest margin
Noninterest expense
Credit trends,
tax rate ~2.0% loan growth Expect relatively stable net interest margin Modest increase Committed to YoY operating leverage goals Provision expense up modestly Tax rate of ~33% 2Q16 expectations vs. 1Q16 (1) Capital, liquidity and funding Quarter-end Basel III common equity tier 1 ratio ~11.6% Loan-to-deposit ratio of ~98% Noninterest income Mid-single digit growth |
 1Q16 was another good quarter for Citizens
Financial results continue to improve and meet expectations
Good progress on strategic initiatives, mindset of ‘continuous
improvement’ Balance sheet management showing results (NIM,
loan growth, TDR sale, sub-debt repurchase, dividend
increase) Tangible
book value (1) per share continues to grow; $25.21 at quarter-end 2016 will continue to see a focus on execution Comprehensive plan to deliver well for all stakeholders Key to financial results is to grow the balance sheet smartly, execute build-out of fee businesses
and deliver positive operating leverage
Will seek more efficiencies to offset fee sluggishness
Capital and credit position remain strong
Peer leading CET1 ratio permits both strong loan growth and returns to
shareholders Credit metrics remain robust; oil and gas exposure
modest and well-reserved Key messages
19 1) Non-GAAP item. See important information on use of non-GAAP items in the Appendix. |
 Appendix 20 |
 Quarter-over-quarter results
Adjusted pre-provision profit
(1) $s in millions Adjusted return on average tangible assets (1) Adjusted net income (1) $s in millions 1) Adjusted results are non-GAAP items and exclude the effect of net restructuring charges and special items associated with efficiency
and effectiveness programs and separation from RBS. See important
information on use of non-GAAP items in the Appendix.
2) Excludes loans held for sale. Adjusted return on average tangible common equity (1) 12 bps 1 bps 4% 10% Period-end loans (2) $s in billions Period-end deposits $s in billions 5% Adjusted Diluted EPS (1) $101.0 $102.6 7% 4% $383 $423 1Q15 1Q16 $94.5 1Q15 1Q16 0.69% 0.68% 1Q15 1Q16 $215 $223 $0.39 $0.41 1Q15 1Q16 $99.0 1Q15 1Q16 6.7% 6.6% 1Q15 1Q16 21 |
 Linked-quarter results
22 1 bps 14 bps 0.2% Diluted EPS 2% Pre-provision profit $s in millions Return on average tangible assets (2) Period-end loans (1) $s in billions Net income $s in millions Return on average tangible (2) common equity Period-end deposits $s in billions 2% 1) Excludes loans held for sale. 2) Non-GAAP item. See important information on use of non-GAAP items in the Appendix.
$101.0 1% $102.5 $102.6 0.1% $422 $423 4Q15 1Q16 $99.0 4Q15 1Q16 0.67% 0.68% 4Q15 1Q16 $221 $223 $0.42 $0.41 4Q15 1Q16 4Q15 1Q16 6.7% 6.6% 4Q15 1Q16 |
 Consumer Banking segment
23 1) Non-GAAP item. Adjusted results exclude the effect of net restructuring charges and special items associated with efficiency and
effectiveness programs and separation from RBS. See important
information on use of non-GAAP items in the Appendix.
2) Includes held for sale. 3) Operating segments are allocated capital on a risk-adjusted basis considering economic and regulatory capital requirements. We
approximate that regulatory capital is equivalent to a sustainable
target level for tier 1 common equity and then allocate that approximation to the segments based on economic capital. Highlights Linked quarter: Net income up $4 million, or 6% Net interest income up $16 million, driven by higher loan balances and higher checking and savings deposits and improved pricing Average loans up 2% and average deposits stable Noninterest income down $18 million, driven by the impact of the card reward accounting change, seasonally lower service charges and fees as well as a reduction in mortgage banking and trust and investment sales Mortgage banking fees down $2 million, largely reflecting mortgage servicing rights valuation and lower volumes largely offset by the benefit of higher loan sale gains and application volumes Noninterest expense decreased $8 million, reflecting the impact of the card reward accounting change, lower outside services expense, partially offset by increased salaries and employee benefits including seasonally higher payroll taxes Prior-year quarter: Net income up $10 million, or 16% Total revenue up $37 million reflecting strength in NII on higher interest rates and improving loan portfolio mix as well as lower deposit costs Average loans up $3.5 billion and average deposits up $3.4 billion Noninterest expense increased $20 million, or 3%, given continued investment in the business to drive further growth 1Q16 change from $s in millions 1Q16 4Q15 1Q15 4Q15 1Q15 $ % $ % Net interest income 581 $ 565 $ 533 $ 16 $ 3 % 48 $ 9 % Noninterest income 208 226 219 (18) (8) (11) (5) Total revenue 789 791 752 (2) — 37 5 Noninterest expense 616 624 596 (8) (1) 20 3 Pre-provision profit 173 167 156 6 4 17 11 Provision for credit losses 63 65 63 (2) (3) — — Income before income tax expense 110 102 93 8 8 17 18 Income tax expense 39 35 32 4 11 7 22 Net income 71 $ 67 $ 61 $ 4 $ 6 % 10 $ 16 % Average balances $s in billions Total loans and leases (2) 53.7 $ 52.7 $ 50.3 $ 1.0 $ 2 % 3.5 $ 7 % Total deposits 70.9 $ 70.9 $ 67.5 $ (0.1) $ — % 3.4 $ 5 % Mortgage Banking metrics Originations 1,386 $ 1,426 $ 1,211 $ (40) $ (3) % 175 $ 14 % Origination Pipeline 2,126 1,684 1,683 442 26 % 443 26 % Gain on sale of secondary originations 2.40% 1.77% 2.65% 63 bps (25) bps Performance metrics ROTCE (1,3) 5.6% 5.5% 5.3% 9 bps 29 bps Efficiency ratio (1) 78% 79% 79% (77) bps (117) bps |
 Commercial Banking segment
24 1) Non-GAAP item. See important information on use of non-GAAP items in the Appendix.
2) Includes held for sale. 3) Operating segments are allocated capital on a risk-adjusted basis considering economic and regulatory capital requirements. We
approximate that regulatory capital is equivalent to a sustainable
target level for tier 1 common equity and then allocate that approximation to the segments based on economic capital. Highlights 1Q16 change from $s in millions 1Q16 4Q15 1Q15 4Q15 1Q15 $ % $ % Net interest income 300 $ 301 $ 276 $ (1) $ — % 24 $ 9 % Noninterest income 99 107 100 (8) (7) (1) (1) Total revenue 399 408 376 (9) (2) 23 6 Noninterest expense 187 180 173 7 4 14 8 Pre-provision profit 212 228 203 (16) (7) 9 4 Provision for credit losses 9 (2) (21) 11 550 30 143 Income before income tax expense 203 230 224 (27) (12) (21) (9) Income tax expense 70 78 77 (8) (10) (7) (9) Net income 133 $ 152 $ 147 $ (19) $ (13) % (14) $ (10) % Average balances $s in billions Total loans and leases (2) 43.9 $ 42.6 $ 40.2 $ 1.3 $ 3 % 3.7 $ 9 % Total deposits 24.8 $ 24.6 $ 21.9 $ 0.2 $ 1 % 2.9 $ 13 % Performance metrics ROTCE (1,3) 11.2% 12.6% 13.2% (138) bps (196) bps Efficiency ratio (1) 47% 44% 46% 272 bps 73 bps Linked quarter: Commercial Banking net income decreased $19 million, or 13% Total revenue decreased $9 million, with net interest income relatively stable with higher deposit costs and nonaccruals offsetting the benefit of higher interest rates Strength in Mid-corporate and Industry Verticals, Corporate Finance, Commercial Real Estate and Middle Market Average deposits up slightly from 4Q15 Noninterest income decreased $8 million due in part to lower interest-rate products and leasing income and service charges and fees offsetting higher Capital Markets fees Noninterest expense increased $7 million, or 4%, partly due to higher salary and benefits expense Prior-year quarter: Net income decreased $14 million, or 10% Net interest income was up $24 million reflecting the benefit of higher interest rates and a $3.7 billion increase in average loans and $2.9 billion increase in deposits Noninterest income was relatively stable as strength in service charges and fees was offset by lower leasing income and foreign exchange and letter of credit fees Noninterest expense increased $14 million, reflecting increased outside services and salary and benefits costs associated with continued sales force expansion |
 Other 25 Linked quarter: Other recorded net income of $19 million, up $17 million as higher net interest income and lower provision for credit losses were partially offset by lower noninterest income and higher noninterest expense Net interest income increased $19 million largely reflecting favorable residual funds transfer pricing, partially offset by higher wholesale funding costs and a lower FRB stock dividend Noninterest income decreased $6 million, reflecting lower bank- owned life insurance benefits, the impact of a 4Q15 gain on a sub-debt redemption and lower securities gains Noninterest expense increased $2 million driven by seasonally higher incentive compensation Provision for credit losses decreased $9 million Reflects a $8 million reserve build versus a $14 million build in the prior quarter Also reflects a $3 million decrease in non-core charge-offs Prior-year quarter: Net income increased $18 million Net interest income decreased $4 million Noninterest income decreased $5 million Noninterest expense down $33 million from 1Q15 which included restructuring charges and special items Provision for credit losses increased $3 million Reflects an $8 million reserve build versus a $4 million build in the prior-year quarter Highlights 1Q16 change from $s in millions 1Q16 4Q15 1Q15 4Q15 1Q15 $ % $ % Net interest income 23 $ 4 $ 27 $ 19 $ 475 % (4) $ (15) % Noninterest income 23 29 28 (6) (21) (5) (18) Total revenue 46 33 55 13 39 (9) (16) Noninterest expense 8 6 41 2 33 (33) (80) Pre-provision profit (loss) 38 27 14 11 41 24 171 Provision for credit losses 19 28 16 (9) (32) 3 19 Income (loss) before income tax expense (benefit) 19 (1) (2) 20 NM 21 NM Income tax expense (benefit) — (3) (3) 3 100 3 100 Net income (loss) 19 $ 2 $ 1 $ 17 $ NM % 18 $ NM % Average balances $s in billions Total loans and leases 3.0 $ 3.2 $ 3.8 $ (0.2) $ (6) % (0.8) $ (21) % Total deposits 6.3 $ 5.8 $ 6.2 $ 0.4 $ 8 % 0.1 $ 1 % — — — |
 $53.0 billion 1Q16 retail portfolio (1) $48.0 billion 1Q16 commercial portfolio (2) Mid-Atlantic Midwest New England (2) Leases C&I CRE Mid-Atlantic Midwest New England 26 Diversified and granular loan mix Weighted-average FICO score of 756 (3) 86% collateralized (3) 69% of the consumer real estate portfolio is secured by a 1 st lien (3) Highly granular, diversified portfolio with an average loan balance of less
than $10 million across the C&I, CRE and Leasing portfolios
Home Equity Indirect Auto Residential Mortgage Education Finance Credit Cards Other Non-Core Business Banking Retail NCO% (4) Retail NPL% (5) Commercial NPL% (7) Commercial NCO% (6) Non-Core 31% 13% 31% 25% Out of footprint (8) 25% 15% 33% 27% CFG Peers CFG vs. Peers Out of footprint (8) 1)
Includes loans and leases (other than loans held for sale) from our Other
portfolio allocated by product class according to our risk management system.
2)
Includes owner-occupied commercial real estate. 3)
Portfolio balances as of March 31, 2016. FICO score, LTV ratio, loan term, lien
position, risk rating, property type, industry sector and geographic stratifications as of February 29, 2016, as applicable. 4)
Source: Company data and SNL, includes core and non-core loans – Peers
include BB&T, Comerica, Fifth Third, Key, M&T, PNC, Regions, SunTrust and U.S. Bancorp.
5)
Source: Company data and SNL, includes core and non-core loans – NPL%
equals Nonaccrual plus 90+ days past due and still accruing loans (excluding FDIC “covered” loans and loans guaranteed by the U.S. government) as a % of total. 6)
Note: Includes non-core loans, which total 1% of Commercial loans. Product
view. Source: Company data and SNL – Regulatory reporting basis; peer banks include: BB&T, Comerica, Fifth Third, Key, M&T, PNC, Regions, SunTrust and U.S Bancorp. 7)
Product view. Source: Company data and SNL includes core and non-core loans
– Regulatory reporting basis; peer banks include: BB&T, Comerica, Fifth Third, Key, M&T, PNC, Regions, SunTrust, and U.S. Bancorp. NPL% equals nonaccrual plus 90+ days past due and still-accruing loans (excluding covered loans and loans guaranteed by the U.S. government) as a % of total. 8)
Footprint defined as 11-state branch footprint (CT, DE, MA, MI, NH, NJ, NY,
OH, PA, RI & VT) and contiguous states where CFG maintains offices (IL, IN, KY, MD & ME).
|
 25% 19% 17% 5% 8% 26% 1.8% 98.2% 6% 9% 42% 21% 22% Oil & Gas portfolio overview Well-diversified portfolio with ~100 clients Includes $339 million of corporate aircraft leases arising from Asset Finance $200 million of loans across six credits moved to nonperforming status in 1Q16 following new regulatory guidance related to multi-tiered structures All loans current, still paying No charge-offs have been recorded No second lien positions Oil and gas portfolio loan loss reserves of $61 million as of 3/31/16 Reserves to total loans of more price-sensitive portfolios now at 6.3% (3) No E&P customers have filed bankruptcy 27 Highlights Total loans outstanding Oil & Gas All other loans AAA to A- BBB+ to BBB- BB+ to BB- B+ to B B- and lower 15% investment grade ~$1.1 billion more sensitive to declining oil prices Midstream Integrated Downstream Reserve-Based Lending (RBL) Upstream, Non-RBL Oil Field Services Oil & Gas portfolio by Sub-sector Oil & Gas portfolio by Investment grade-equivalent risk rating (2) 1Q16 Oil & Gas Outstandings $s in millions Total O/S Utilized % Criticized % Nonaccrual status Less price-sensitive total 706 $ 64% 0% 0 $
Upstream 314 82% Oilfield Services 344 67% RBL 457 63% More price-sensitive total 1,115 69% 49% 210 Total Oil & Gas 1,821 $ 67% 30% 210 $ (1) 1)
Includes Downstream, Integrated, and Midstream sub-categories. 2)
Portfolio balances as of March 31, 2016. FICO score, LTV ratio, loan term, lien
position, risk rating, property type, industry sector and geographic stratifications as of February 29, 2016 as applicable. 3)
Reserves/(More price-sensitive Oil & Gas portfolio outstandings -
leases secured by aircraft ($135 million)). |
 Restructuring charges and special items
28 1) These are non-GAAP financial measures. Please see Non-GAAP Reconciliation Tables in the Appendix for an explanation of our use of
non-GAAP financial measures and their reconciliation to GAAP.
$s in millions, except per share data
GAAP results included restructuring charges and special items related to enhancing efficiencies and improving processes across the organization and separation from The Royal Bank of Scotland Group plc (“RBS”). Restructuring charges and special items (1) 1Q16 change from 1Q16 4Q15 1Q15 4Q15 1Q15 $ % $ % Pre-tax restructuring charges and special items — — 10 — NM % (10) NM % After-tax restructuring charges and special items — — 6 — NM (6) NM Diluted EPS impact — $ — $ 0.01 $ — $ NM % (0.01) $ NM % |
 Non-GAAP financial measures
29 This document contains non-GAAP financial measures. The table below presents reconciliations of certain non-GAAP measures. These
reconciliations exclude restructuring charges and/or special
items, which are usually included, where applicable, in the financial results presented in accordance with GAAP. Restructuring charges and special items include expenses related to our efforts to improve processes and enhance efficiencies, as well as rebranding,
separation from RBS and regulatory expenses. The non-GAAP measures set forth below include “noninterest income”, “total revenue”, “ noninterest
expense”, “pre-provision profit”, “income before income tax expense”, “income tax expense”, “net income”, “net income available to common stockholders”,
“salaries and employee benefits”, “outside services”, “occupancy”, “equipment expense”, “other operating expense”, “net income per average common share”, “return on
average common equity” and “return on average total assets”. In addition, we present computations for "tangible book value per common share", “return on average tangible common
equity”, “return on average total tangible
assets”, “efficiency ratio”, “pro forma Basel III fully
phased-in common equity tier 1 capital”, “operating leverage”, “noninterest income before accounting change” and “card fee income before accounting change” as part of our non-GAAP measures. We believe these non-GAAP measures provide useful information to investors because these are among the measures used by our
management team to evaluate our operating performance and make
day-to-day operating decisions. In addition, we believe restructuring charges and special items in any period do not reflect the operational performance of the business in that period and, accordingly, it is useful to consider these line items with and without
restructuring charges and special items. We believe this
presentation also increases comparability of period-to-period results. We also consider pro forma capital ratios defined by banking regulators but not effective at each period end to be non-GAAP financial
measures. Since analysts and banking regulators may assess our
capital adequacy using these pro forma ratios, we believe they are useful to provide investors the ability to assess our capital adequacy on the same basis.
Other companies may use similarly titled non-GAAP
financial measures that are calculated differently from the way we calculate such measures. Accordingly, our non-GAAP financial measures may not be comparable to similar measures used by other companies. We caution investors not to place
undue reliance on such non- GAAP measures, but instead to
consider them with the most directly comparable GAAP measure. Non-GAAP financial measures have limitations as analytical tools, and should not be considered in isolation, or as a substitute for our results as reported under GAAP.
|
 Non-GAAP reconciliation table
30 (Excluding restructuring charges and special items) $s in millions, except per share data 1Q16 4Q15 3Q15 2Q15 1Q15 Noninterest income, excluding special items: Noninterest income (GAAP) $330 $362 $353 $360 $347 Less: Special items — — — — — Noninterest income, excluding special items (non-GAAP) $330 $362 $353 $360 $347 Total revenue, excluding special items: Total revenue (GAAP) A $1,234 $1,232 $1,209 $1,200 $1,183 Less: Special items — — — — — Total revenue, excluding special items (non-GAAP) B $1,234 $1,232 $1,209 $1,200 $1,183 Noninterest expense, excluding restructuring charges and special items: Noninterest expense (GAAP) C $811 $810 $798 $841 $810 Less: Restructuring charges and special items — — — 40 10 Noninterest expense, excluding restructuring charges and special items (non-GAAP)
D $811 $810 $798 $801 $800 Pre-provision profit, excluding restructuring charges and special items:
Total revenue, excluding restructuring charges and special items
(non-GAAP) $1,234
$1,232 $1,209 $1,200 $1,183 Less: Noninterest expense, excluding restructuring charges and special items (non-GAAP)
811 810 798 801 800 Pre-provision profit, excluding restructuring charges and special items (non-GAAP)
$423 $422 $411 $399 $383 Income before income tax expense, excluding restructuring charges and special items:
Income before income tax expense (GAAP)
$332 $331 $335 $282 $315 Less: Income before income tax expense (benefit) related to restructuring charges and special items (GAAP)
— — — (40) (10) Income before income tax expense, excluding restructuring charges and special items (non-GAAP)
$332 $331 $335 $322 $325 Income tax expense, excluding restructuring charges and special items: Income tax expense (GAAP) $109 $110 $115 $92 $106 Less: Income tax (benefit) related to restructuring charges and special items (GAAP)
— — — (15) (4) Income tax expense, excluding restructuring charges and special items (non-GAAP)
$109 $110 $115 $107 $110 Net income, excluding restructuring charges and special items: Net income (GAAP) E $223 $221 $220 $190 $209 Add: Restructuring charges and special items, net of income tax expense (benefit)
— — — 25 6 Net income, excluding restructuring charges and special items (non-GAAP)
F $223 $221 $220 $215 $215 Net income available to common stockholders (GAAP), excluding restructuring charges and special items:
Net income available to common stockholders (GAAP)
G $216 $221 $213 $190 $209 Add: Restructuring charges and special items, net of income tax expense (benefit)
— — — 25 6 Net income available to common stockholders, excluding restructuring charges and special items (non-GAAP)
H $216 $221 $213 $215 $215 Return on average common equity, excluding restructuring charges and special items:
Average common equity (GAAP)
I $19,567 $19,359 $19,261 $19,391 $19,407 Return on average common equity, excluding restructuring charges and special items (non-GAAP)
H/I 4.45 % 4.51 % 4.40 % 4.45 % 4.49 % Return on average tangible common equity and return on average tangible common equity, excluding
restructuring charges and special items:
Average common equity (GAAP)
I $19,567 $19,359 $19,261 $19,391 $19,407 Less: Average goodwill (GAAP) 6,876
6,876
6,876
6,876
6,876 Less: Average other intangibles
(GAAP)
3
3
4
5
5 Add: Average deferred tax liabilities related to goodwill (GAAP) 481
468
453
437
422 Average tangible
common equity (non-GAAP) J
$13,169 $12,948 $12,834 $12,947 $12,948 Return on average tangible common equity (non-GAAP) G/J 6.61 % 6.75 % 6.60 % 5.90 % 6.53 % Return on average tangible common equity, excluding preferred dividends (non-GAAP)
E/J 6.82 % 6.75 % 6.81 % 5.90 % 6.53 % Return on average tangible common equity, excluding restructuring charges and special items (non-GAAP)
H/J 6.61 % 6.75 % 6.60 % 6.67 % 6.73 % QUARTERLY TRENDS |
 Non-GAAP reconciliation table
31 (Excluding restructuring charges and special items) $s in millions, except per share data 1Q16 4Q15 3Q15 2Q15 1Q15 Return on average total assets, excluding restructuring charges and special items:
Average total assets (GAAP)
K $138,780 $136,298 $135,103 $135,521 $133,325 Return on average total assets, excluding restructuring charges and special items (non-GAAP)
F/K 0.65% 0.64% 0.65% 0.64% 0.65% Return on average total tangible assets and return on average total tangible assets, excluding restructuring
charges and special items:
Average total assets (GAAP)
K $138,780 $136,298 $135,103 $135,521 $133,325 Less: Average goodwill (GAAP) 6,876 6,876 6,876 6,876 6,876 Less: Average other intangibles (GAAP) 3 3 4 5 5 Add: Average deferred tax liabilities related to goodwill (GAAP) 481 468 453 437 422 Average tangible assets (non-GAAP) L $132,382 $129,887 $128,676 $129,077 $126,866 Return on average total tangible assets (non-GAAP) E/L 0.68% 0.67% 0.68% 0.59% 0.67% Return on average total tangible assets, excluding restructuring charges and special items (non-GAAP)
F/L 0.68% 0.67% 0.68% 0.67% 0.69% Efficiency ratio and efficiency ratio, excluding restructuring charges and special items:
Efficiency ratio (non-GAAP)
C/A 65.66% 65.76% 66.02% 70.02% 68.49% Efficiency ratio, excluding restructuring charges and special items (non-GAAP)
D/B 65.66% 65.76% 66.02% 66.70% 67.65% Tangible book value per common share: Common shares - at end of period (GAAP) M 528,933,727 527,774,428 527,636,510 537,149,717 547,490,812 Common stockholders' equity (GAAP) $19,718 $19,399 $19,353 $19,339 $19,564 Less: Goodwill (GAAP) 6,876 6,876 6,876 6,876 6,876 Less: Other intangible assets (GAAP) 3 3 3 4 5 Add: Deferred tax liabilities related to goodwill (GAAP) 494 480 465 450 434 Tangible common equity (non-GAAP) N $13,333 $13,000 $12,939 $12,909 $13,117 Tangible book value per common share (non-GAAP) N/M $25.21 $24.63 $24.52 $24.03 $23.96 Net income per average common share - basic and diluted, excluding restructuring charges and special items: Average common shares outstanding - basic (GAAP) O 528,070,648 527,648,630 530,985,255 537,729,248 546,291,363 Average common shares outstanding - diluted (GAAP) P 530,446,188 530,275,673 533,398,158 539,909,366 549,798,717 Net income available to common stockholders (GAAP) G $216 $221 $213 $190 $209 Net income per average common share - basic (GAAP) G/O 0.41 0.42 0.40 0.35 0.38 Net income per average common share - diluted (GAAP) G/P 0.41 0.42 0.40 0.35 0.38 Net income available to common stockholders, excluding restructuring charges and special items (non-GAAP)
H 216 221 213 215 215 Net income per average common share - basic, excluding restructuring charges and special items (non-GAAP) H/O 0.41 0.42 0.40 0.40 0.39 Net income per average common share - diluted, excluding restructuring charges and special items (non-GAAP) H/P 0.41 0.42 0.40 0.40 0.39 Pro forma Basel III fully phased-in common equity tier 1 capital ratio
1 : Common equity tier 1 (regulatory) $13,570 $13,389 $13,200 $13,270 $13,360 Less: Change in DTA and other threshold deductions (GAAP) 1 2 2 3 3 Pro forma Basel III fully phased-in common equity tier 1 (non-GAAP)
Q $13,569 $13,387 $13,198 $13,267 $13,357 Risk-weighted assets (regulatory general risk weight approach) $116,591 $114,084 $112,277 $112,131 $109,786 Add: Net change in credit and other risk-weighted assets (regulatory)
232 244 243 247 242 Basel III standardized approach risk-weighted assets (non-GAAP) R $116,823 $114,328 $112,520 $112,378 $110,028 Pro forma Basel III fully phased-in common equity tier 1 capital ratio (non-GAAP)
1 Q/R 11.6% 11.7% 11.7% 11.8% 12.1% QUARTERLY TRENDS 1 Basel III ratios assume certain definitions impacting qualifying Basel III capital, which otherwise will phase in through 2019, are fully
phased-in. Ratios also reflect the required US Standardized methodology for calculating RWAs, effective January 1, 2015 |
 Non-GAAP reconciliation table
32 (Excluding restructuring charges and special items) $s in millions, except per share data 1Q16 4Q15 3Q15 2Q15 1Q15 Salaries and employee benefits, excluding restructuring charges and special items:
Salaries and employee benefits (GAAP)
$425 $402 $404 $411 $419 Less: Restructuring charges and special items — (2) — 6 (1) Salaries and employee benefits, excluding restructuring charges and special items (non-GAAP)
$425 $404 $404 $405 $420 Outside services, excluding restructuring charges and special items: Outside services (GAAP) $91 $104 $89 $99 $79 Less: Restructuring charges and special items — 2 — 16 8 Outside services, excluding restructuring charges and special items (non-GAAP)
$91 $102 $89 $83 $71 Occupancy, excluding restructuring charges and special items: Occupancy (GAAP) $76 $74 $75 $90 $80 Less: Restructuring charges and special items — — — 15 2 Occupancy, excluding restructuring charges and special items (non-GAAP)
$76 $74 $75 $75 $78 Equipment expense, excluding restructuring charges and special items: Equipment expense (GAAP) $65 $67 $62 $65 $63 Less: Restructuring charges and special items — — — — 1 Equipment expense, excluding restructuring charges and special items (non-GAAP)
$65 $67 $62 $65 $62 Other operating expense, excluding restructuring charges and special items:
Other operating expense (GAAP)
$115 $125 $133 $139 $133 Less: Restructuring charges and special items — — — 3 — Other operating expense, excluding restructuring charges and special items (non-GAAP)
$115 $125 $133 $136 $133 Restructuring charges and special expense items include: Restructuring charges $— $— $— $25 $1 Special items — — — 15 9 Restructuring charges and special expense items before income tax expense $— $— $— $40 $10 1Q16 vs 4Q15 1Q16 vs 1Q15 1Q16 4Q15 3Q15 2Q15 1Q15 % Change % Change Operating leverage: Total revenue (GAAP) A $1,234 $1,232 $1,209 $1,200 $1,183 0.2% 4.3% Noninterest expense (GAAP) C $811 $810 $798 $841 $810 0.1% 0.1% Operating leverage (GAAP) 0.0% 4.2% Operating leverage, excluding restructuring charges and special items: Total revenue, excluding restructuring charges and special items (non-GAAP)
B $1,234 $1,232 $1,209 $1,200 $1,183 0.2% 4.3% Less: Noninterest expense, excluding restructuring charges and special items (non-GAAP)
D $811 $810 $798 $801 $800 0.1% 1.4% Operating leverage, excluding restructuring charges and special items: (non-GAAP)
0.0% 2.9% 1Q16 vs 1Q15 1Q16 vs 1Q15 Noninterest income: $ Change % Change Noninterest income (GAAP) $330 $347 ($17) (5)% Add: Reward accounting change 7 — 7 NM Noninterest income, before accounting change (non-GAAP) $337 $347 ($10) (3)% Card fee income: Card fees (GAAP) $50 $52 ($2) Add: Reward accounting change 7 — 7 Card fee income, before accounting change (non-GAAP) $57 $52 $5 QUARTERLY TRENDS QUARTERLY TRENDS |
 Non-GAAP reconciliation table
33 Consumer Banking Commercial Banking Other Consolidated Consumer Banking Commercial Banking Other Consolidated Consumer Banking Commercial Banking Other Consolidated Net income available to common stockholders: Net income (GAAP) A $71 $133 $19 $223 $67 $152 $2 $221 $68 $145 $7 $220 Less: Preferred stock dividends — — 7 7 — — — — — — 7 7 Net income available to common stockholders B $71 $133 $12 $216 $67 $152 $2 $221 $68 $145 $— $213 Return on average tangible common equity: Average common equity (GAAP) $5,089 $4,790 $9,688 $19,567 $4,831 $4,787 $9,741 $19,359 $4,791 $4,722 $9,748 $19,261 Less: Average goodwill (GAAP) — — 6,876 6,876 — — 6,876 6,876 — — 6,876 6,876 Average other intangibles (GAAP)
— — 3 3 — — 3 3 — — 4 4 Add: Average deferred tax liabilities related to goodwill (GAAP) — — 481 481 — — 468 468 — — 453 453 Average tangible common equity (non-GAAP) C $5,089 $4,790 $3,290 $13,169 $4,831 $4,787 $3,330 $12,948 $4,791 $4,722 $3,321 $12,834 Return on average tangible common equity (non-GAAP): B/C 5.59% 11.19% NM 6.61% 5.50% 12.57% NM 6.75% 5.67% 12.24% NM 6.60% Return on average total tangible assets: Average total assets (GAAP) $55,116 $45,304 $38,360 $138,780 $54,065 $43,835 $38,398 $136,298 $53,206 $43,113 $38,784 $135,103 Less: Average goodwill (GAAP) — — 6,876 6,876 — — 6,876 6,876 — — 6,876 6,876 Average other intangibles (GAAP)
— — 3 3 — — 3 3 — — 4 4 Add: Average deferred tax liabilities related to goodwill (GAAP) — — 481 481 — — 468 468 — — 453 453 Average tangible assets (non-GAAP) D $55,116 $45,304 $31,962 $132,382 $54,065 $43,835 $31,987 $129,887 $53,206 $43,113 $32,357 $128,676 Return on average total tangible assets (non-GAAP) A/D 0.52% 1.18% NM 0.68% 0.49% 1.37% NM 0.67% 0.51% 1.34% NM 0.68% Efficiency ratio: Noninterest expense (GAAP) E $616 $187 $8 $811 $624 $180 $6 $810 $623 $175 $— $798 Net interest income (GAAP) 581 300 23 904 565 301 4 870 556 299 1 856 Noninterest income (GAAP) 208 99 23 330 226 107 29 362 235 100 18 353 Total revenue F $789 $399 $46 $1,234 $791 $408 $33 $1,232 $791 $399 $19 $1,209 Efficiency ratio (non-GAAP) E/F 78.08% 46.74% NM 65.66% 78.85% 44.02% NM 65.76% 78.72% 43.75% NM 66.02% THREE MONTHS ENDED SEPTEMBER 30, 2016 2015 2015 THREE MONTHS ENDED MARCH 31, THREE MONTHS ENDED DECEMBER 31, Non-GAAP Reconciliation - Segments $s in millions |
 Non-GAAP reconciliation table
34 Non-GAAP Reconciliation - Segments $s in millions Consumer Banking Commercial Banking Other Consolidated Consumer Banking Commercial Banking Other Consolidated Net income available to common stockholders: Net income (loss) (GAAP) A $66 $135 ($11) $190 $61 $147 $1 $209 Less: Preferred stock dividends — — — — — — — — Net income available to common stockholders B $66 $135 ($11) $190 $61 $147 $1 $209 Return on average tangible common equity: Average total assets (GAAP) $4,681 $4,625 $10,085 $19,391 $4,649 $4,526 $10,232 $19,407 Less: Average goodwill (GAAP) — — 6,876 6,876 — — 6,876 6,876 Average other intangibles (GAAP)
— — 5 5 — — 5 5 Add: Average deferred tax liabilities related to goodwill (GAAP) — — 437 437 — — 422 422 Average tangible common equity (non-GAAP) C $4,681 $4,625 $3,641 $12,947 $4,649 $4,526 $3,773 $12,948 Return on average tangible common equity (non-GAAP): B/C 5.66% 11.69% NM 5.90% 5.30% 13.15% NM 6.53% Return on average total tangible assets: Average total assets (GAAP) $52,489 $42,617 $40,415 $135,521 $51,602 $41,606 $40,117 $133,325 Less: Average goodwill (GAAP) — — 6,876 6,876 — — 6,876 6,876 Average other intangibles (GAAP)
— — 5 5 — — 5 5 Add: Average deferred tax liabilities related to goodwill (GAAP) — — 437 437 — — 422 422 Average tangible assets (non-GAAP) D $52,489 $42,617 $33,971 $129,077 $51,602 $41,606 $33,658 $126,866 Return on average total tangible assets (non-GAAP) A/D 0.51% 1.27% NM 0.59% 0.48% 1.43% NM 0.67% Efficiency ratio: Noninterest expense (GAAP) E $613 $181 $47 $841 $596 $173 $41 $810 Net interest income (GAAP) 544 286 10 840 533 276 27 836 Noninterest income (GAAP) 230 108 22 360 219 100 28 347 Total revenue F $774 $394 $32 $1,200 $752 $376 $55 $1,183 Efficiency ratio (non-GAAP) E/F 79.25% 46.07% NM 70.02% 79.25% 46.01% NM 68.49% 2015 2015 THREE MONTHS ENDED JUNE 30, THREE MONTHS ENDED MARCH 31, |
 35 |