Attached files
| file | filename |
|---|---|
| 8-K - FORM 8-K - BENCHMARK ELECTRONICS INC | form8-k.htm |
| EX-99.1 - EXHIBIT 99.1 - BENCHMARK ELECTRONICS INC | ex99_1.htm |
Exhibit 99.2

design develop deliver advanced technology Q1 - 2016 Earnings Presentation April 21, 2016

design develop deliver advanced technology 2 Forward - Looking Statements This document contains forward - looking statements within the scope of the Securities Act of 1933 and the Securities Exchange Act of 1934. The words “expect,” “estimate,” “anticipate,” “predict” and similar expressions, and the negatives thereof, often identify forward - looking statements, which are not limited to historical facts. Our forward - looking statements include, among other things: guidance for the second quarter of 2016 relating to sales; statements , express or implied, concerning future operating results or margins, the ability to generate sales, income or cash flow; and Benchmark’s business and growth strategies and expected growth and performance. Although Benchmark believes these statements are based upon reasonable assumptions, they involve risks and uncertainties relating to our operations, markets and business environment generally. If one or more of these risks or uncertainties materializes, or underlying assumptions prove incorrect, actual outcomes may vary materially from those indicated. All forward - looking statements included in this document are based upon information available to Benchmark as of the date of this document, and the Company assumes no obligation to update them. Readers are advised to consult further disclosures on related subjects, particularly in Item 1A, “Risk Factors” of the Company’s annual report on Form 10 - K for the year ended December 31, 2015, in its other filings with the Securities and Exchange Commission and in its press releases. Non - GAAP Financial Information This document includes certain financial measures, such as operating margin, that exclude certain items and therefore are not in accordance with generally accepted accounting principles (“GAAP”). A detailed reconciliation between GAAP results and results excluding special items (“non - GAAP”) is included in the Appendix of this document.

design develop deliver advanced technology 3 President and CEO Update

design develop deliver advanced technology 4 First Quarter 2016 Summary ▪ Revenue at $549 millions and non - GAAP operating margin at 3.5%, which lagged expectations due to: − Lower - than - expected demand from our top computing customer − Late quarter industrial sector slowdown − Delayed qualifications for medical programs ▪ Operating model remains strong, and we are accelerating cost alignment to current demand levels ▪ Strong operating cash flow of $77 million ▪ Returned $14 million of domestic cash to shareholders through share repurchases - $42 million in U.S. cash as of March 31, 2016 ▪ Cash conversion cycle of 99 days; Q2 - 16 target of 90 days

design develop deliver advanced technology 5 Strategic Plan Execution Highlights Priorities ► 64% of revenues from higher - value markets (medical, industrial, and test & instrumentation) ► >10% HVM YoY growth in 2016 Q1 - 2016 Update Targets Portfolio Shift to Higher - Value Markets Margin Expansion Balanced Capital Deployment >10% Annual Growth and 70% of revenues from Higher - Value Markets ► 3.5% operating margin on lower revenues ► Operational excellence and cost optimization for sequential QoQ FY16 improvement >5% Operating Margin ► Operating cash f low of $77M in Q1 ► 35 th sequential quarter of share buybacks ► 52% of FCF returned to shareholders LTM ~50% F CF Returned to Shareholders 3 3 FCF defined as CFO less capex

design develop deliver advanced technology 6 Q1 2016 New Business Wins by Segment ▪ Q1 2016: 27 new business bookings and 17 engineering projects ▪ Estimated annual revenue run rate between $110 - 140 million ▪ Continued new business wins in targeted markets Quarterly Estimated Annual Revenue Run Rate for New Business Wins First Quarter 2016 New Business Wins
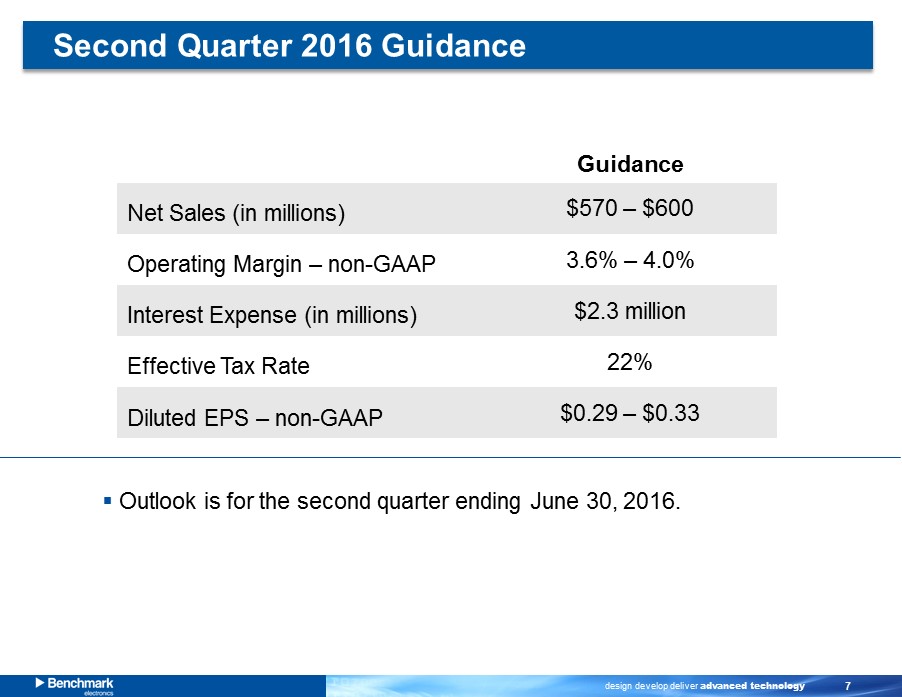
design develop deliver advanced technology 7 Guidance Net Sales (in millions) $570 – $600 Operating Margin – non - GAAP 3.6% – 4.0% Interest Expense (in millions) $2.3 million Effective Tax Rate 22% Diluted EPS – non - GAAP $0.29 – $0.33 ▪ Outlook is for the second quarter ending June 30, 2016. Second Quarter 2016 Guidance

design develop deliver advanced technology 8 Q1 2016 Financial Highlights
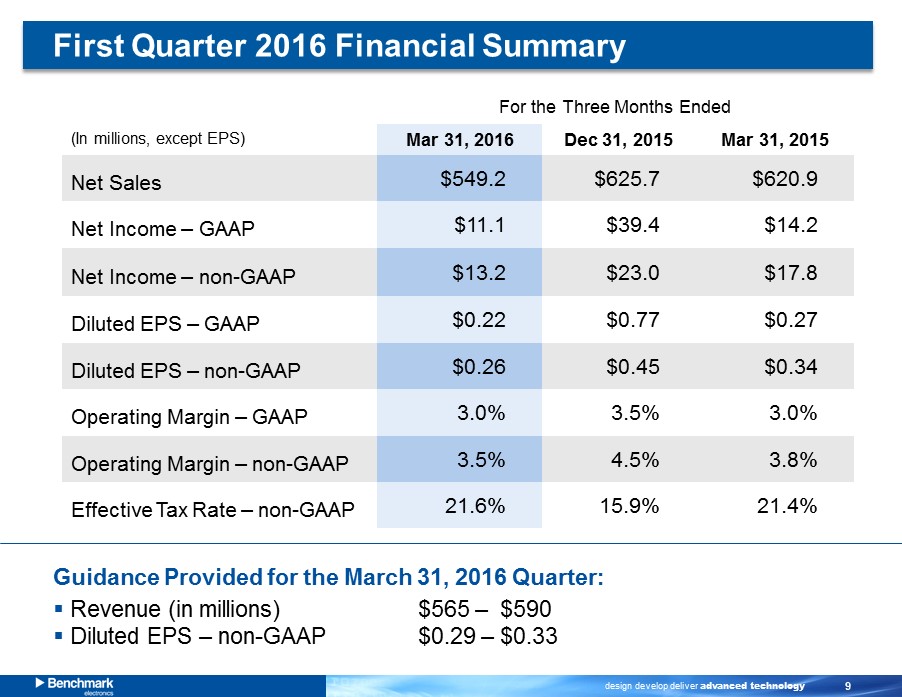
design develop deliver advanced technology 9 (In millions, except EPS) Mar 31 , 2016 Dec 31 , 2015 Mar 31 , 2015 Net Sales $549.2 $625.7 $620.9 Net Income – GAAP $11.1 $39.4 $14.2 Net Income – non - GAAP $13.2 $23.0 $17.8 Diluted EPS – GAAP $0.22 $0.77 $0.27 Diluted EPS – non - GAAP $0.26 $0.45 $0.34 Operating Margin – GAAP 3.0% 3.5% 3.0% Operating Margin – non - GAAP 3.5% 4.5% 3.8% Effective Tax Rate – non - GAAP 21.6% 15.9% 21.4% For the Three Months Ended Guidance Provided for the March 31, 2016 Quarter: ▪ Revenue (in millions) $565 – $590 ▪ Diluted EPS – non - GAAP $0.29 – $0.33 First Quarter 2016 Financial Summary

design develop deliver advanced technology 10 Trending Operating Income
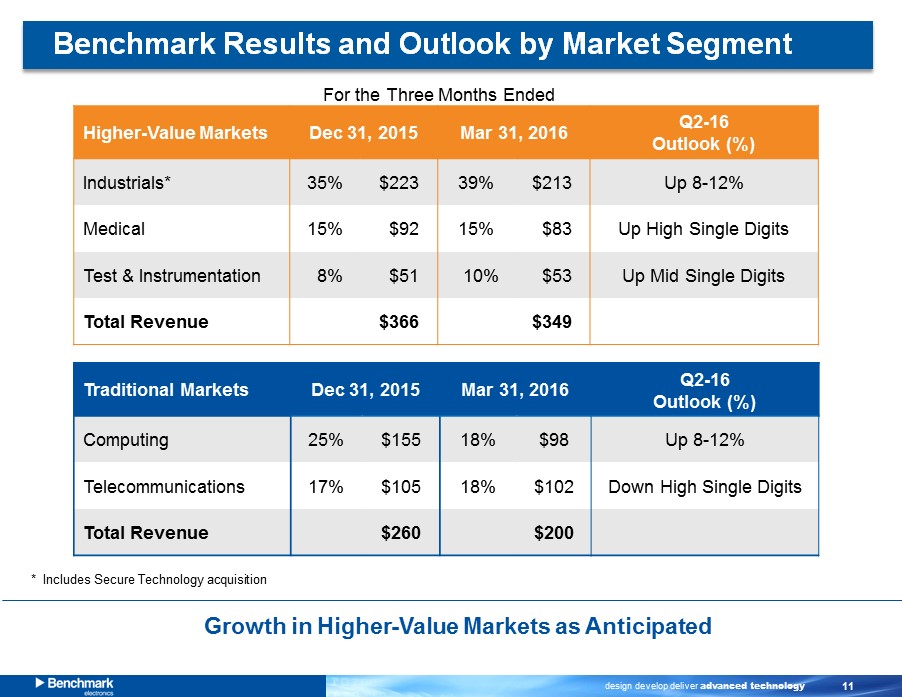
design develop deliver advanced technology 11 Higher - Value Markets Dec 31 , 2015 Mar 31 , 2016 Q2 - 16 Outlook (%) Industrials* 35% $223 39% $213 Up 8 - 12% Medical 15% $92 15% $83 Up High Single Digits Test & Instrumentation 8% $51 10% $53 Up Mid Single Digits Total Revenue $366 $349 Traditional Markets Dec 31 , 2015 Mar 31 , 2016 Q2 - 16 Outlook (%) Computing 25% $155 18% $98 Up 8 - 12% Telecommunication s 17% $105 18% $102 Down High Single Digits Total Revenue $260 $200 Benchmark Results and Outlook by Market Segment For the Three Months Ended Growth in Higher - Value Markets as Anticipated * Includes Secure Technology acquisition
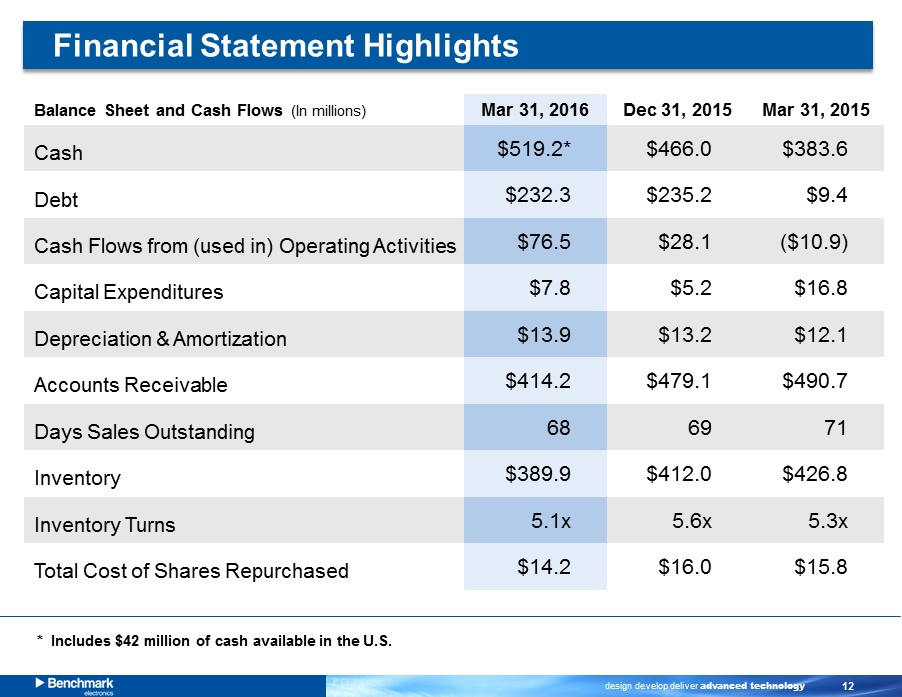
design develop deliver advanced technology 12 Balance Sheet and Cash Flows (In millions) ) Mar 31 , 2016 Dec 31 , 2015 Mar 31, 2015 Cash $519.2* $466.0 $383.6 Debt $232.3 $235.2 $9.4 Cash Flows from (used in) Operating Activities $76.5 $28.1 ($10.9) Capital Expenditures $7.8 $5.2 $16.8 Depreciation & Amortization $13.9 $13.2 $12.1 Accounts Receivable $414.2 $479.1 $490.7 Days Sales Outstanding 68 69 71 Inventory $389.9 $412.0 $426.8 Inventory Turns 5.1x 5.6x 5.3x Total Cost of Shares Repurchased $14.2 $16.0 $15.8 * Includes $42 million of cash available in the U.S. Financial Statement Highlights
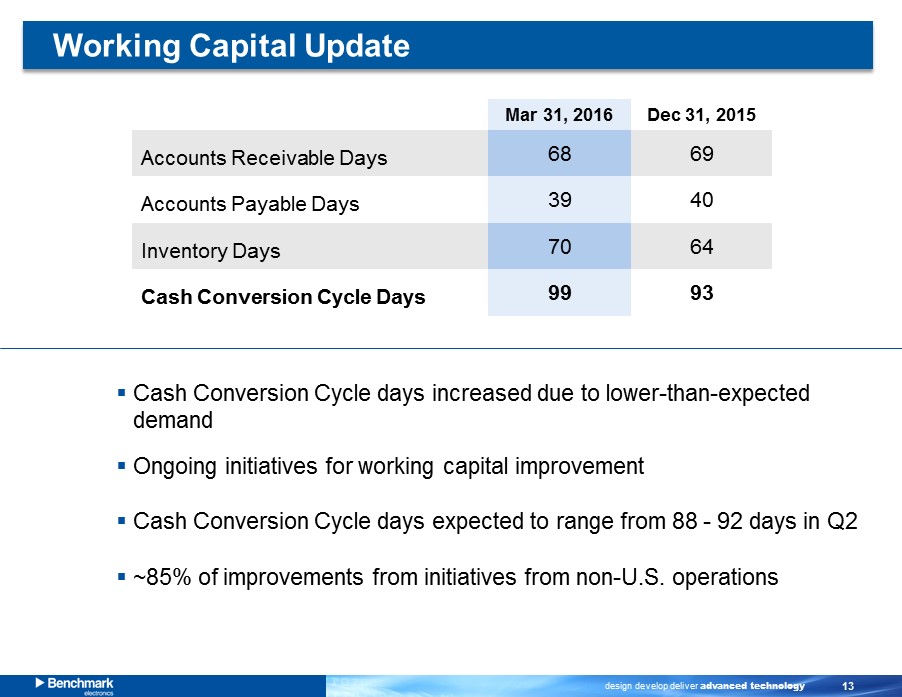
design develop deliver advanced technology 13 Mar 31 , 2016 Dec 31 , 2015 Accounts Receivable Days 68 69 Accounts Payable Days 39 40 Inventory Days 70 64 Cash Conversion Cycle Days 99 93 ▪ Cash Conversion Cycle days increased due to lower - than - expected demand ▪ Ongoing initiatives for working capital improvement ▪ Cash Conversion Cycle days expected to range from 88 - 92 days in Q2 ▪ ~85% of improvements from initiatives from non - U.S. operations Working Capital Update
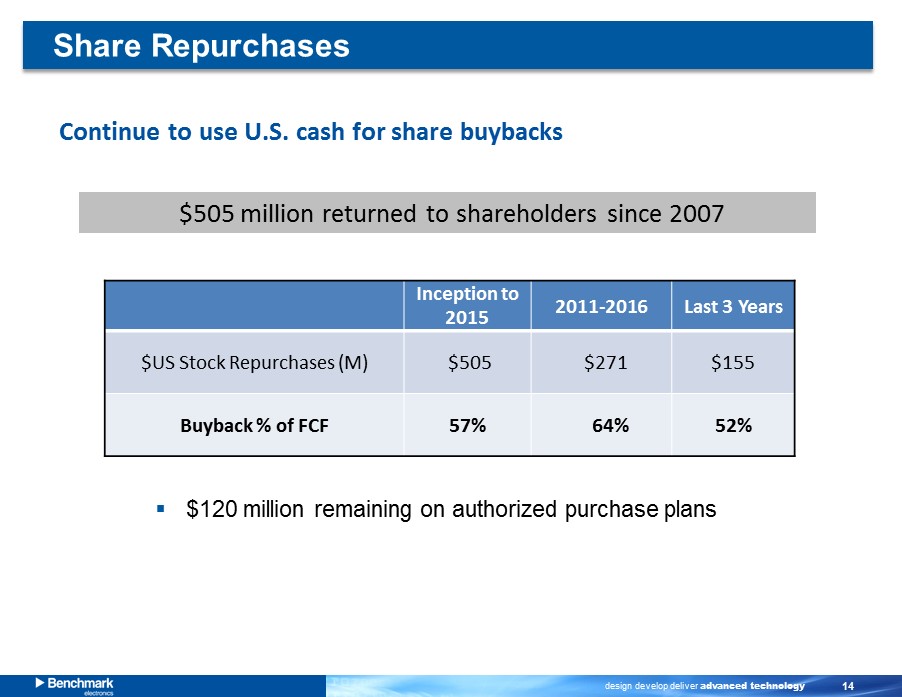
design develop deliver advanced technology 14 Share Repurchases Continue to use U.S. cash for share buybacks $ 505 million returned to shareholders since 2007 ▪ $120 m illion remaining on authorized purchase plans Inception to 2015 2011 - 2016 Last 3 Years $US Stock Repurchases (M ) $505 $271 $155 Buyback % of FCF 57% 64% 52%
design develop deliver advanced technology 15 Appendix

design develop deliver advanced technology 16 Reconciliation of GAAP to non - GAAP Financial Results (Amounts in Thousands, Except Per Share Data) – (UNAUDITED) Mar 31, Dec 31, Mar 31, 2016 2015 2015 16,268$ 21,905$ 18,708$ 2,789 6,308 4,869 19,057$ 28,213$ 23,577$ 11,052$ 39,421$ 14,205$ 2,098 4,717 3,595 - (21,174) - 13,150$ 22,964$ 17,800$ Basic $0.22 $0.78 $0.27 Diluted $0.22 $0.77 $0.27 Basic $0.26 $0.45 $0.34 Diluted $0.26 $0.45 $0.34 Three Months Ended Income from operations (GAAP) Net income (GAAP) Earnings per share: (Non-GAAP) Non-GAAP income from operations Discrete tax benefits Non-GAAP net income Earnings per share: (GAAP) Restructuring charges and other costs, net of tax Restructuring charges and other costs

design develop deliver advanced technology 17 Additional Information and Where to Find It Benchmark has filed a definitive proxy statement with the SEC with respect to the 2016 Annual Meeting and has mailed the definitive proxy statement and accompanying white proxy card to its shareholders. Benchmark shareholders are strongly encouraged to read the definitive proxy statement, the accompanying white proxy card and other documents filed with the SEC carefully in their entirety when they become available because they contain (or will contain) important information. Benchmark, its directors, executive officers and other employees may be deemed to be participants in the solicitation of proxies from Benchmark shareholders in connection with the matters to be considered at Benchmark’s 2016 Annual Meeting. Information about Benchmark’s directors and executive officers is available in Benchmark’s definitive proxy statement for its 2016 Annual Meeting. Shareholders may obtain a free copy of the definitive proxy statement and any other documents filed by Benchmark with the SEC free of charge at the SEC’s website at www.sec.gov. Copies also are available free of charge on Benchmark’s website at www.bench.com under “Investor Relations – Annual Reports” or by contacting Benchmark Investor Relations at (979) 849 - 6550.