Attached files
| file | filename |
|---|---|
| 8-K - 8-K - UNITIL CORP | d159287d8k.htm |
 Annual
Meeting of Shareholders
Charting Our Growth – April 20, 2016 Robert G. Schoenberger Chairman, Chief Executive Officer and President Exhibit 99.1 |
 Safe
Harbor Provision This presentation contains “forward-looking
statements” made pursuant to the safe harbor provisions of the
Private Securities Litigation Reform Act of 1995. These forward-looking statements include statements regarding Unitil Corporation’s (“Unitil”) financial condition, results of operations, capital
expenditures, business strategy, regulatory strategy, market opportunities, and other
plans and objectives. In some cases, forward-looking statements
can be identified by terminology such as “may,”
“will,” “should,” “expects,” “plans,”
“anticipates,” “believes,” “estimates,” “predicts,” “potential” or “continue”, the negative of such terms, or other comparable terminology.
These forward-looking statements are neither promises nor guarantees, but involve
risks and uncertainties that could cause the actual results to differ
materially from those set forth in the forward- looking statements.
Those risks and uncertainties include: Unitil’s regulatory environment (including regulations relating to climate change, greenhouse gas emissions and other environmental matters);
fluctuations in the supply of, demand for, and the prices of energy commodities and
transmission capacity and Unitil’s ability to recover energy
commodity costs in its rates; customers’ preferred energy sources;
severe storms and Unitil’s ability to recover storm costs in its rates; general economic conditions; variations in weather; long-term global climate change; Unitil’s ability to retain its existing
customers and attract new customers; Unitil’s energy brokering customers’
performance and energy used under multi-year energy brokering
contracts; increased competition; integrity and security of operational
and information systems; publicity and reputational risks; and other risks detailed in Unitil's filings with the Securities and Exchange Commission, including those appearing under the caption
"Risk Factors" in Unitil's Annual Report on Form 10-K for the year ended
December 31, 2015. Readers should not place undue reliance on any forward
looking statements, which speak only as of the date they are made.
Unitil undertakes no obligation to update any forward-looking statements to reflect any change in Unitil’s expectations or in events, conditions, or circumstances on which any
such statements may be based, or that may affect the likelihood that actual results
will differ from those set forth in the forward-looking
statements. 2 |
 Natural gas and electric utility
operations in Maine, New Hampshire
and Massachusetts Serving approximately 182,000 gas and electric customers Utility operations sales margin split ~55% gas and ~45% electric Regulated “Pipes and Wires” utility business model Growing operations and customers Regulated electric and gas rate base growth Robust natural gas system expansion Constructive rate plans and cost trackers Recent dividend increases Experienced management team Unitil Overview 3 |
 2015
Accomplishments •
Met or exceeded all service quality metrics for safety, reliability and customer service • Customers enjoying best reliability in Company’s history – 48% reduction in outages since 2010 • Achieved record levels of
revenues, earnings and total customers served
• Continued to expand natural gas business hitting milestones to double gas utility rate base and quadruple income • Successfully executed regulatory rate
adjustment plans in all jurisdictions
to match growing level of electric and gas investments
resulting in 9.5% ROE
• Recently increased annual dividend $0.02 to $1.42 per share 4 |
 $1.43
$1.57 $1.79 $1.89 2012 2013 2014 2015 Generating Financial Results • Business fundamentals • Improving economy • Strong demand for natural gas • Gas distribution expansion • Strong customer and unit sales growth rates • Utility rate base growth • Gas distribution expansion and infrastructure replacement and upgrade projects • Electric reliability investments • Constructive regulation • Rate relief has provided ~50% increase to sales margin since 2010 • Capital trackers in all jurisdictions • Filed for $6.8 million in rate relief in Massachusetts; Order due May 1, 2016 • Recently filed notice of 2016 rate case for NH electric operations $18.1 $21.6 $24.7 $26.3 2012 2013 2014 2015 Net Income Earnings Per Share ($ in millions) 5 |
 Robust
Capital Spending •
Capital spending annual growth rate of 15% since 2012
• Total capital budget of $98 million in 2016 ($ in millions) 6 Capital Spending |
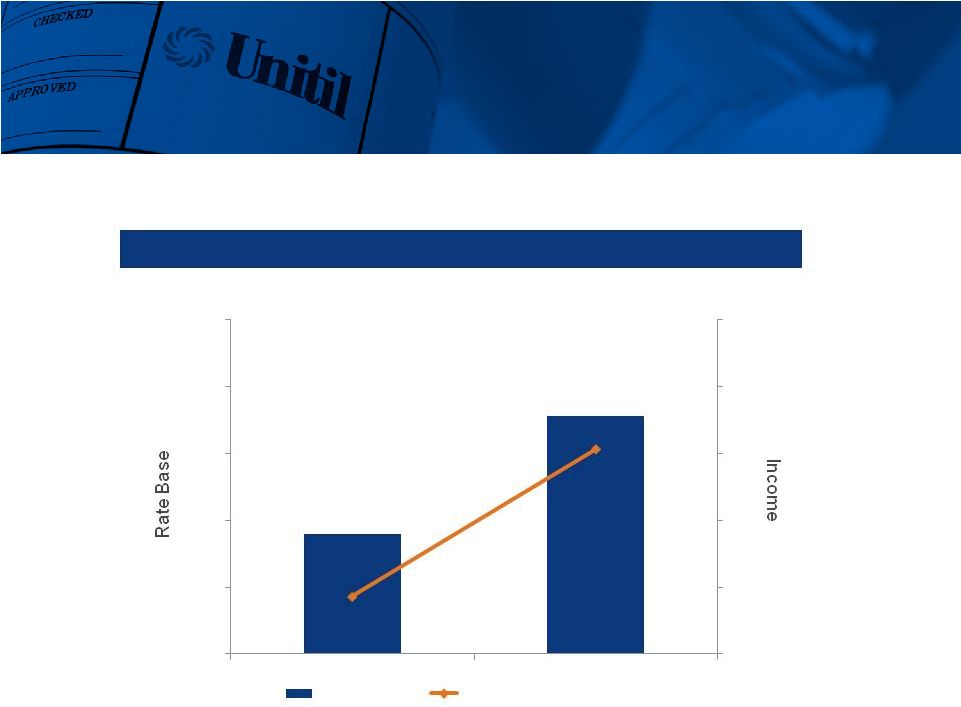 Gas
Rate Base Growth •
Gas rate base has doubled and gas segment income has nearly quadrupled since
acquiring New Hampshire and Maine gas business
Gas Rate Base & Income
($ in millions) 7 $179 $357 $0 $5 $10 $15 $20 $25 $0 $100 $200 $300 $400 $500 2008 2015 Rate Base Gas Segment Income $4 $15 |
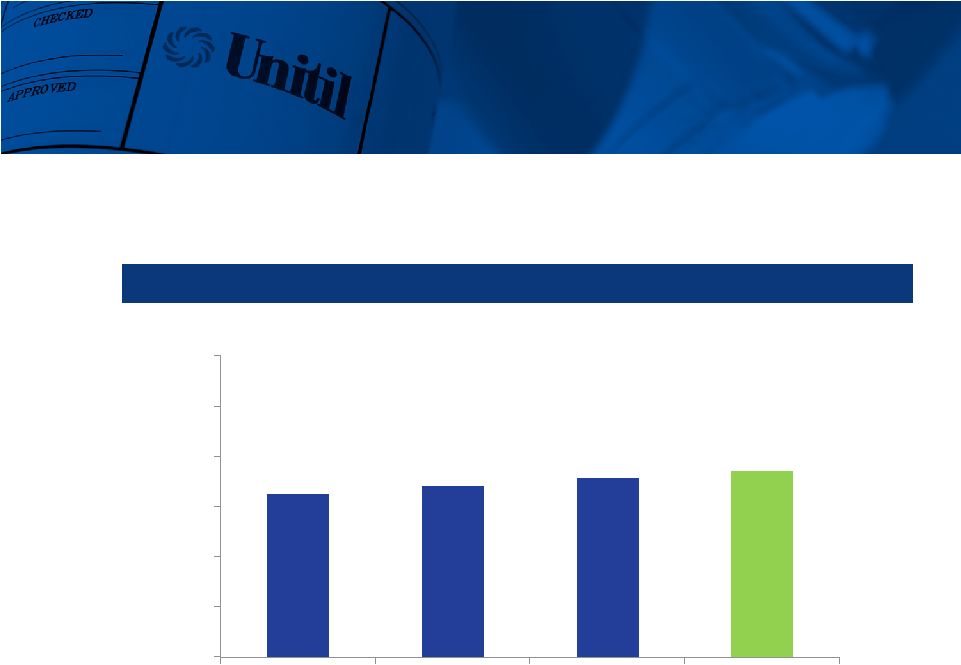 163 170 179 186 0 50 100 150 200 250 300 2012 2013 2014 2015 Gas Sales Growth • Historical weather-normalized sales growth of 4-6% annually since 2012 • Commercial and industrial weather-normalized sales* were up 8% in 2015 compared
to 2014 Historical Weather-Normalized Sales* *Excludes decoupled gas sales Therms, in millions 8 |
 New Gas
Service Areas •
Targeted Area Buildout
• Saco, Maine pilot • Potential new market of 1,000 customers • $1 million in potential distribution revenue • Evaluating new opportunities in other cities and towns • System expansion projects • Extending existing mains into adjacent areas attractive for growth • Years of growth potential in and around service area Saco TAB Target Areas 9 |
 New Hampshire Maine Massachusetts ~6 miles annually in 2016 and 2017 ~50 miles scheduled 2016 - 2024 ~3 miles scheduled annually Project completion expected end of 2017– entire system will be modern Project completion expected end of 2024 – entire system will be modern Project completion expected end of 2035 – entire system will be modern Gas Infrastructure Replacement • Cast iron and bare steel replacement program is ongoing with majority of replacement and upgrades recovered annually through capital tracker mechanisms 10 |
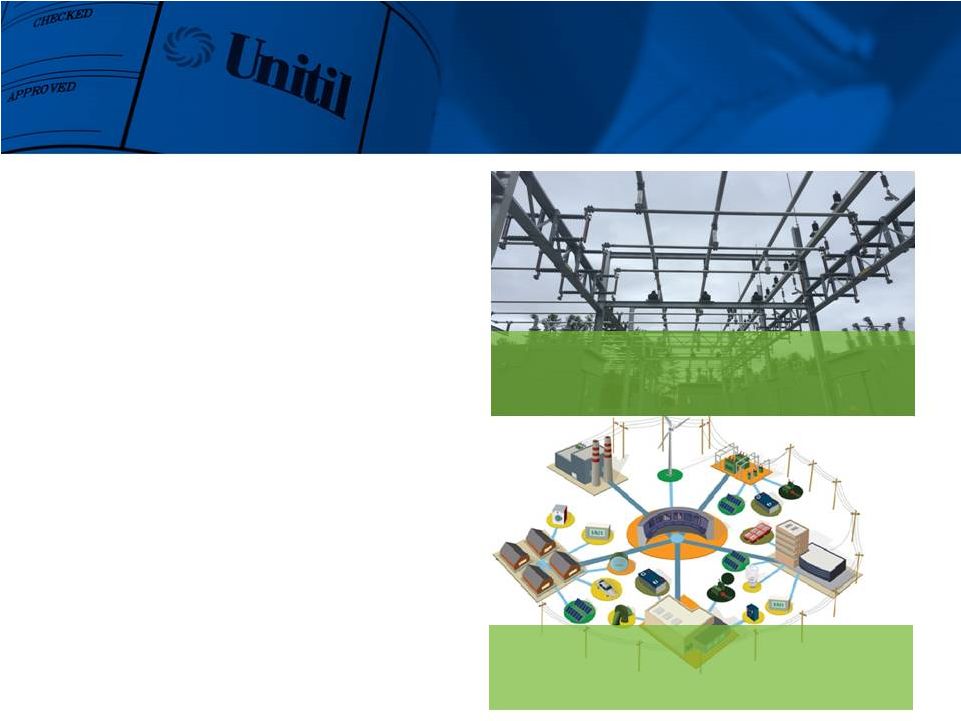 Electric Growth Investment
• Construction of two major electric substations in New Hampshire to provide capacity and enhance reliability • Grid modernization – regulatory initiatives in New Hampshire and Massachusetts supporting new investment in the distribution system Grid Modernization Substation Projects 11 |
 System
Average Interruption Duration Index (SAIDI) Minutes/Year
Electric Reliability Average system outage duration has gone down 48% since 2010 12 80 100 120 140 160 180 200 2010 2011 2012 2013 2014 2015 Year |
 Constructive Regulation
Sales and customer growth combined with constructive rate case results and cost trackers continue to drive increases in return on equity 8.0% 8.2% 9.2% 9.5% 2012 2013 2014 2015 Return on Equity Achieved ~$60 million (~50% increase to sales margin) in rate relief since 2010 13 |
 $5.7
$6.2 2014 2015 $1.1 $1.4 2014 2015 Usource Revenue Earnings • Premier energy advisor to over 1,200 businesses • Currently serves electricity and/or natural gas clients in 18 states • Forward book of $9.4 million at year-end 2015 ($ in millions) ($ in millions) 14 |
 Market
Outperformance 5-Year Total Return
15 UTL 100% S&P 500 81% S&P Utilities 69% -20% 0% 20% 40% 60% 80% 100% 120% UTL S&P Utilities S&P 500 |
 2016
Dividend Increase •
On January 27, 2016, Unitil announced a $0.02 annual increase in the
dividend •
Achieved a 74% dividend payout ratio in 2015; down from 77% in 2014
• Unitil has continuously paid quarterly dividends and has never reduced its dividend
rate Dividends Per Share 16 |
 • Regulated local distribution utility business model • Diversified natural gas and electric sales • Growing operations and customer base – Regulated rate base growth – Robust natural gas system expansion – Constructive rate plans and cost trackers • Dividend strength • Experienced management team Key Investment Highlights 17 |