Attached files
| file | filename |
|---|---|
| EX-99.1 - EX-99.1 - SOUTHWEST BANCORP INC | oksb-20160420xex99_1.htm |
| 8-K - 8-K - SOUTHWEST BANCORP INC | oksb-20160420x8k.htm |
 2016 First Quarter Earnings Presentation April 20, 2016 NASDAQ: OKSB
 Forward Looking Statements We make forward-looking statements in this presentation that are subject to risks and uncertainties. We intend these statements to be covered by the safe harbor provision for forward-looking statements contained in the Private Securities Litigation Reform Act of 1995. These forward-looking statements include: •Statements of Southwest's goals, intentions, and expectations; •Estimates of risks and of future costs and benefits; •Expectations regarding our future financial performance and the financial performance of our operating segments; •Expectations regarding regulatory actions; •Expectations regarding our ability to utilize tax loss benefits; •Expectations regarding our stock repurchase program; •Expectations regarding dividends; •Expectations regarding acquisitions and divestitures; •Assessments of loan quality, probable loan losses, and the amount and timing of loan payoffs; •Estimates of the value of assets held for sale or available for sale; and •Statements of our ability to achieve financial and other goals. These forward-looking statements are subject to significant uncertainties because they are based upon: the amount and timing of future changes in interest rates, market behavior, and other economic conditions; future laws, regulations, and accounting principles; changes in regulatory standards and examination policies, and a variety of other matters. These other matters include, among other things, the direct and indirect effects of economic conditions on interest rates, credit quality, loan demand, liquidity, and monetary and supervisory policies of banking regulators. Because of these uncertainties, the actual future results may be materially different from the results indicated by these forward-looking statements. In addition, Southwest's past growth and performance do not necessarily indicate our future results. For other factors, risks, and uncertainties that could cause actual results to differ materially from estimates and projections contained in forward-looking statements, please read the “Risk Factors” contained in Southwest’s reports to the Securities and Exchange Commission. We do not intend, or undertake no obligation, to update or revise any forward-looking statements contained in this presentation, whether as a result of differences in actual results, changes in assumptions, or changes in other factors affecting said statements, except as required by law.
 First Quarter 2016 Highlights Net income was $1.9 million, or $0.10 per share, compared to $4.5 million, or $0.24 per share, in the first quarter of 2015. Total loans grew to $1.78 billion, a slight increase over year-end 2015 and a 24% increase compared to the first quarter of 2015. We funded $108.8 million in new loans during the first quarter of 2016 making this quarter our ninth consecutive quarter of loan growth. This good production was offset by anticipated pay-offs of certain real estate and healthcare credits. The quarterly net interest margin improved to 3.54% at March 31, 2016 compared to 3.48% at December 31, 2015. Pre-tax, pre-provision income was $7.3 million for the first quarter, an increase of 10% from $6.6 million in the fourth quarter of 2015 and an increase of 35% from $5.4 million in the first quarter of 2015.
 First Quarter 2016 Highlights-cont. Our fourth quarter 2015 acquisition of FCB has been fully integrated, and projected expense savings have been mostly realized. Colorado team making positive inroads in that market. Our Board approved a cash dividend of $0.08 per share payable on May 13, 2016 to shareholders of record on April 29, 2016. On February 23, 2016, our Board of Directors authorized a third consecutive share repurchase program of up to another 5.0%, or approximately 967,000 shares, which became effective during the first quarter of 2016 upon the completion of the repurchase of all of the shares under the prior program. Our capital ratios all remain strong and well above the criteria for regulatory classification as “well-capitalized”.
 Credit Quality Highlights First Quarter 2016 Potential problem loans increased by $29.3 million to $68.4 million, or 3.8% of total portfolio loans. This increase was driven by both the energy sector slowdown and general business credits not impacted by energy. We experienced a modest increase in nonperforming numbers of $1.9 million, which was limited by a resolution and settlement structure in a long standing problem credit. We reached a resolution on the AZ hospital loans and other real estate creating an opportunity for potential full repayment of the remaining $8.2 million in book balance plus a significant potential recovery. A provision for loan losses in the amount of $4.4 million was made, increasing our reserve position to 1.53% of portfolio loans. We incurred net charge-offs of $3.3 million centered in three loans.
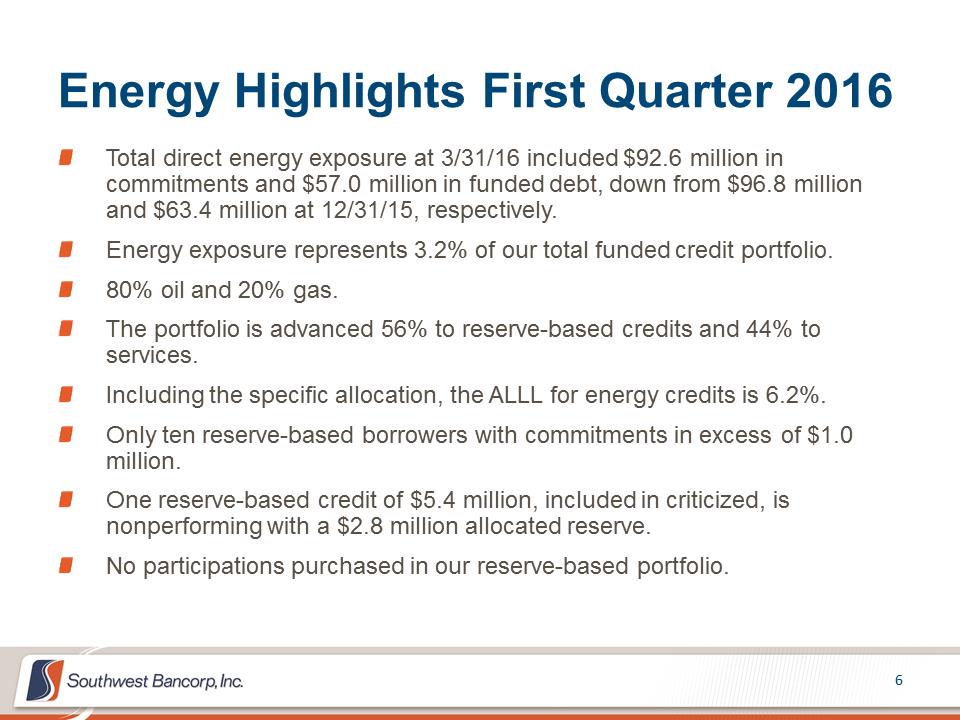 Energy Highlights First Quarter 2016 Total direct energy exposure at 3/31/16 included $92.6 million in commitments and $57.0 million in funded debt, down from $96.8 million and $63.4 million at 12/31/15, respectively. Energy exposure represents 3.2% of our total funded credit portfolio. 80% oil and 20% gas. The portfolio is advanced 56% to reserve-based credits and 44% to services. Including the specific allocation, the ALLL for energy credits is 6.2%. Only ten reserve-based borrowers with commitments in excess of $1.0 million. One reserve-based credit of $5.4 million, included in criticized, is nonperforming with a $2.8 million allocated reserve. No participations purchased in our reserve-based portfolio.
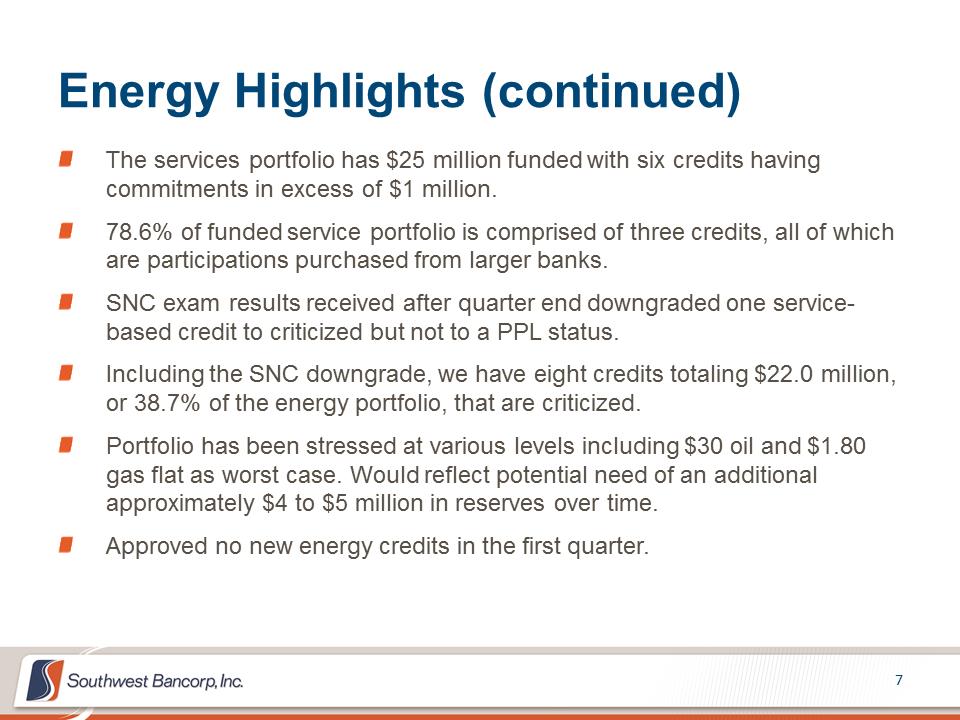 Energy Highlights (continued) The services portfolio has $25 million funded with six credits having commitments in excess of $1 million. 78.6% of funded service portfolio is comprised of three credits, all of which are participations purchased from larger banks. SNC exam results received after quarter end downgraded one service-based credit to criticized but not to a PPL status. Including the SNC downgrade, we have eight credits totaling $22.0 million, or 38.7% of the energy portfolio, that are criticized. Portfolio has been stressed at various levels including $30 oil and $1.80 gas flat as worst case. Would reflect potential need of an additional approximately $4 to $5 million in reserves over time. Approved no new energy credits in the first quarter.
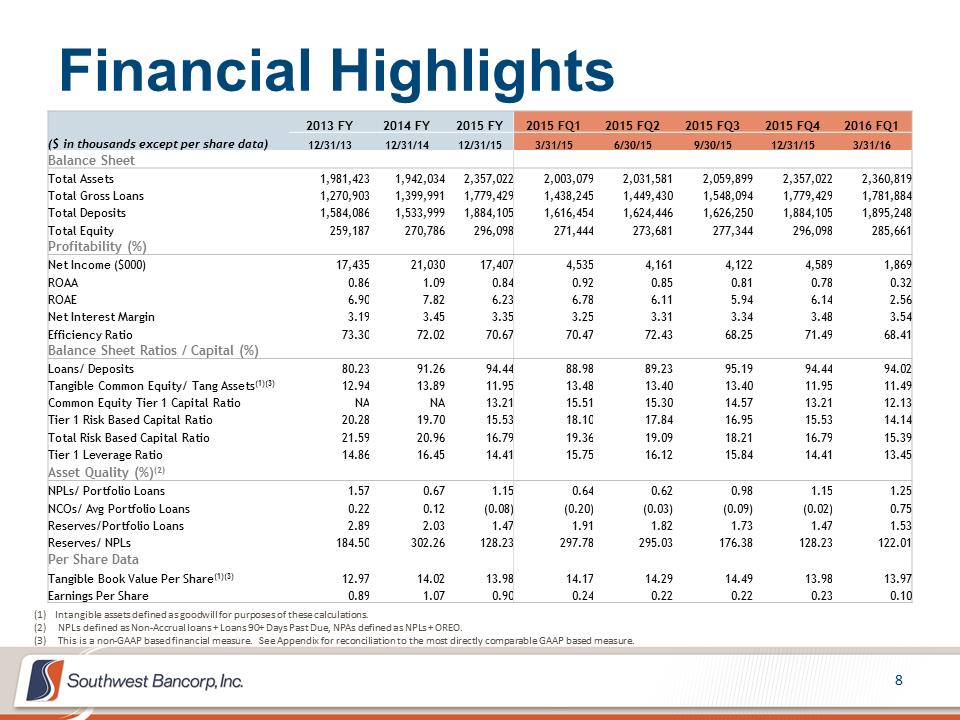 Financial Highlights 2013 FY 2014 FY 2015 FY 2015 FQ1 2015 FQ2 2015 FQ3 2015 FQ4 2016 FQ1 ($ in thousands except per share data) 12/31/13 12/31/14 12/31/15 3/31/15 6/30/15 9/30/15 12/31/15 3/31/16 Balance Sheet Total Assets 1,981,423 1,942,034 2,357,022 2,003,079 2,031,581 2,059,899 2,357,022 2,360,819 Total Gross Loans 1,270,903 1,399,991 1,779,429 1,438,245 1,449,430 1,548,094 1,779,429 1,781,884 Total Deposits 1,584,086 1,533,999 1,884,105 1,616,454 1,624,446 1,626,250 1,884,105 1,895,248 Total Equity 259,187 270,786 296,098 271,444 273,681 277,344 296,098 285,661 Profitability (%) Net Income ($000) 17,435 21,030 17,407 4,535 4,161 4,122 4,589 1,869 ROAA 0.86 1.09 0.84 0.92 0.85 0.81 0.78 0.32 ROAE 6.90 7.82 6.23 6.78 6.11 5.94 6.14 2.56 Net Interest Margin 3.19 3.45 3.35 3.25 3.31 3.34 3.48 3.54 Efficiency Ratio 73.30 72.02 70.67 70.47 72.43 68.25 71.49 68.41 Balance Sheet Ratios / Capital (%) Loans/ Deposits 80.23 91.26 94.44 88.98 89.23 95.19 94.44 94.02 Tangible Common Equity/ Tang Assets(1)(3) 12.94 13.89 11.95 13.48 13.40 13.40 11.95 11.49 Common Equity Tier 1 Capital Ratio NA NA 13.21 15.51 15.30 14.57 13.21 12.13 Tier 1 Risk Based Capital Ratio 20.28 19.70 15.53 18.10 17.84 16.95 15.53 14.14 Total Risk Based Capital Ratio 21.59 20.96 16.79 19.36 19.09 18.21 16.79 15.39 Tier 1 Leverage Ratio 14.86 16.45 14.41 15.75 16.12 15.84 14.41 13.45 Asset Quality (%)(2) NPLs/ Portfolio Loans 1.57 0.67 1.15 0.64 0.62 0.98 1.15 1.25 NCOs/ Avg Portfolio Loans 0.22 0.12 (0.08) (0.20) (0.03) (0.09) (0.02) 0.75 Reserves/Portfolio Loans 2.89 2.03 1.47 1.91 1.82 1.73 1.47 1.53 Reserves/ NPLs 184.50 302.26 128.23 297.78 295.03 176.38 128.23 122.01 Per Share Data Tangible Book Value Per Share(1)(3) 12.97 14.02 13.98 14.17 14.29 14.49 13.98 13.97 Earnings Per Share 0.89 1.07 0.90 0.24 0.22 0.22 0.23 0.10 (1) Intangible assets defined as goodwill for purposes of these calculations. (2)NPLs defined as Non-Accrual loans + Loans 90+ Days Past Due, NPAs defined as NPLs + OREO. (3)This is a non-GAAP based financial measure. See Appendix for reconciliation to the most directly comparable GAAP based measure.
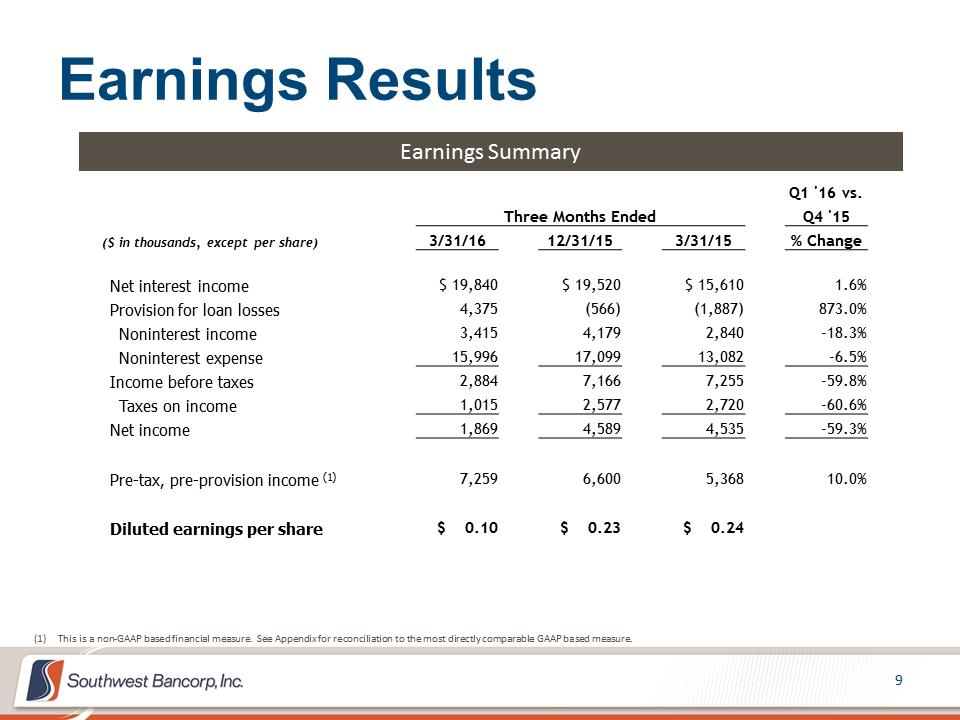 Earnings Results Earnings Summary Q1 '16 vs. Three Months Ended Q4 '15 ($ in thousands, except per share) 3/31/16 12/31/15 3/31/15 % Change Net interest income $ 19,840 $ 19,520 $ 15,610 1.6% Provision for loan losses 4,375 (566) (1,887) 873.0% Noninterest income 3,415 4,179 2,840 -18.3% Noninterest expense 15,996 17,099 13,082 -6.5% Income before taxes 2,884 7,166 7,255 -59.8% Taxes on income 1,015 2,577 2,720 -60.6% Net income 1,869 4,589 4,535 -59.3% Pre-tax, pre-provision income (1) 7,259 6,600 5,368 10.0% Diluted earnings per share $ 0.10 $ 0.23 $ 0.24 (1)This is a non-GAAP based financial measure. See Appendix for reconciliation to the most directly comparable GAAP based measure.
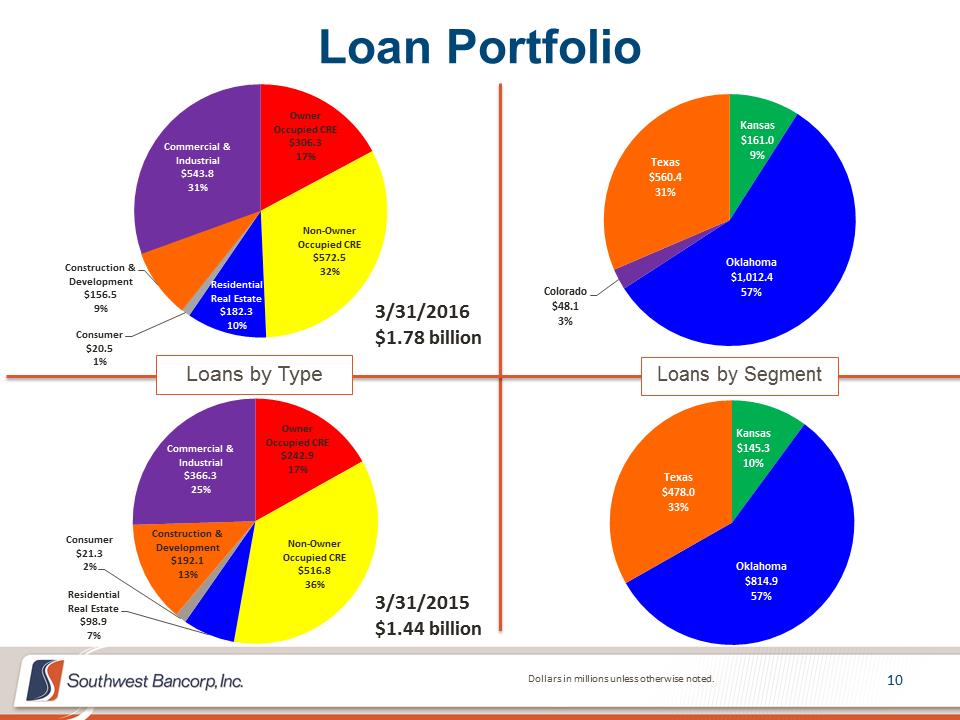 Loan Portfolio Owner Occupied CRE $306.3 17% Non-Owner Occupied CRE $572.5 32% Residential Real Estate $182.3 10% Consumer $20.5 1% Construction & Development $156.5 9% Commercial & Industrial $543.8 31% Dollars in millions unless otherwise noted. Loans by Type Loans by Segment Owner Occupied CRE $242.9 17% Non-Owner Occupied CRE $516.8 36% Residential Real Estate $98.9 7% Consumer $21.3 2% Construction & Development $192.1 13% Commercial & Industrial $366.3 25% 3/31/2016 $1.78 billion 3/31/2015 $1.44 billion Kansas $161.0 9% Oklahoma $1,012.4 57% Colorado $48.1 3% Texas $560.4 31% Kansas $145.3 10% Oklahoma $814.9 57% Texas $478.0 33%
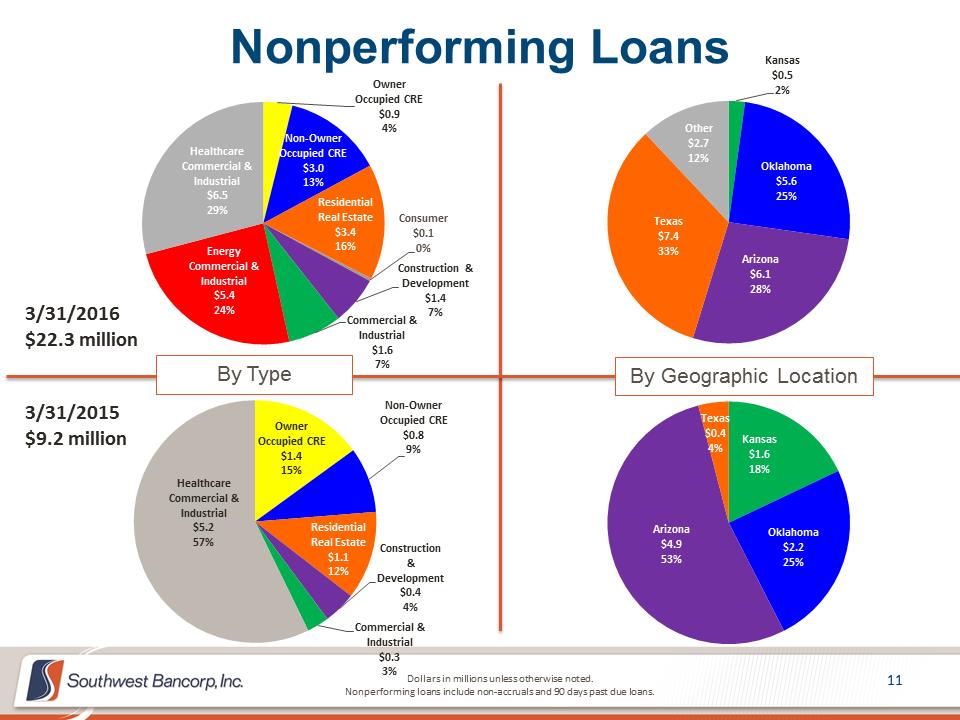 Nonperforming Loans Owner Occupied CRE $0.9 4% Non-Owner Occupied CRE $3.0 13% Residential Real Estate $3.4 16% Consumer $0.1 0% Construction & Development $1.4 7% Commercial & Industrial $1.6 7% Energy Commercial & Industrial $5.4 24% Healthcare Commercial & Industrial $6.5 29% Dollars in millions unless otherwise noted. Nonperforming loans include non-accruals and 90 days past due loans. By Type By Geographic Location Owner Occupied CRE $1.4 15% Non-Owner Occupied CRE $0.8 9% Residential Real Estate $1.1 12% Construction & Development $0.4 4% Commercial & Industrial $0.3 3% Healthcare Commercial & Industrial $5.2 57% 3/31/2016 $22.3 million 3/31/2015 $9.2 million Kansas $0.5 2% Oklahoma $5.6 25% Arizona $6.1 28% Texas $7.4 33% Other $2.7 12% Kansas $1.6 18% Oklahoma $2.2 25% Arizona $4.9 53% Texas $0.4 4%
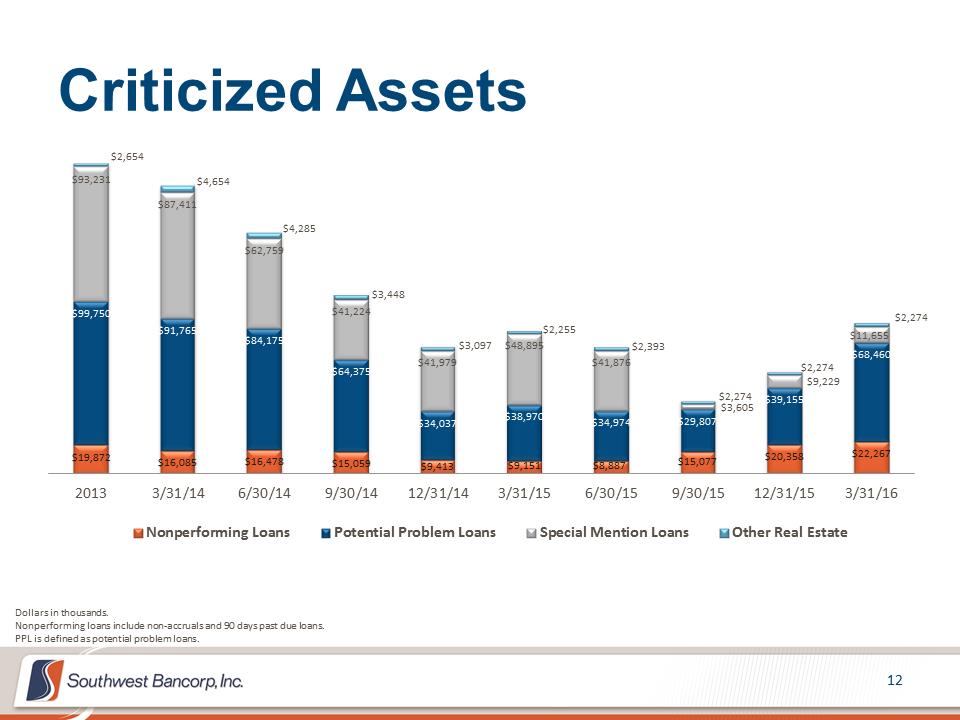 Criticized Assets $19,872 $16,085 $16,478 $15,059 $9,413 $9,151 $8,887 $15,077 $20,358 $22,267 $99,750 $91,765 $84,175 $64,375 $34,037 $38,970 $34,974 $29,807 $39,155 $68,460 $93,231 $87,411 $62,759 $41,224 $41,979 $48,895 $41,876 $3,605 $9,229 $11,655 $2,654 $4,654 $4,285 $3,448 $3,097 $2,255 $2,393 $2,274 $2,274 $2,274 20133/31/146/30/149/30/1412/31/143/31/156/30/159/30/1512/31/153/31/16Nonperforming LoansPotential Problem LoansSpecial Mention LoansOther Real EstateDollars in thousands. Nonperforming loans include non-accruals and 90 days past due loans. PPL is defined as potential problem loans.
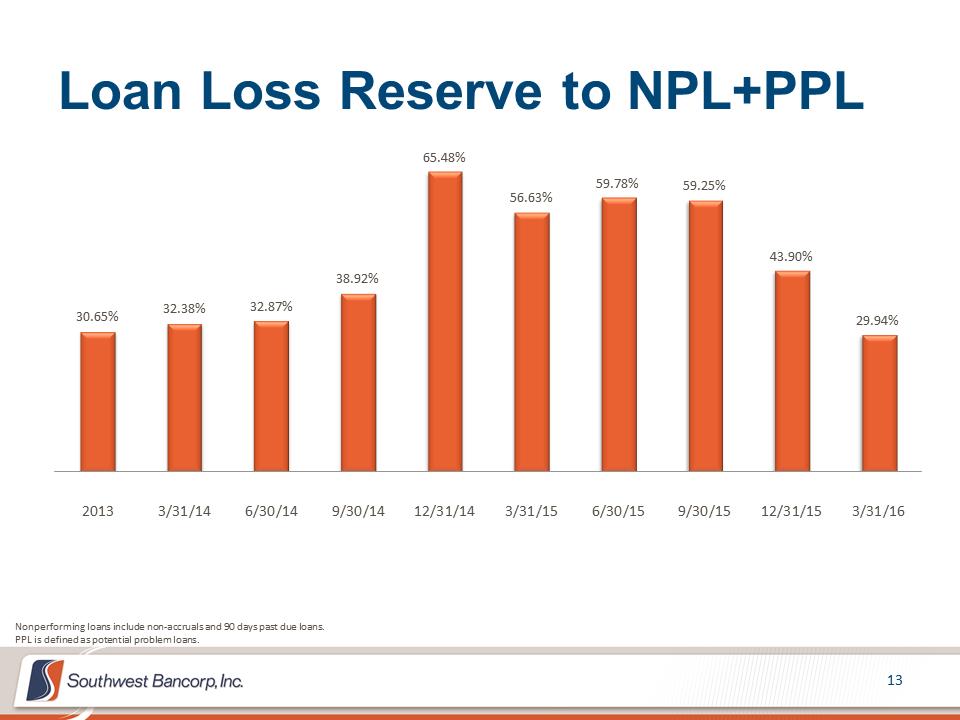 Loan Loss Reserve to NPL+PPL 30.65% 32.38% 32.87% 38.92% 65.48% 56.63% 59.78% 59.25% 43.90% 29.94% 20133/31/146/30/149/30/1412/31/143/31/156/30/159/30/1512/31/153/31/16Nonperforming loans include non-accruals and 90 days past due loans. PPL is defined as potential problem loans.
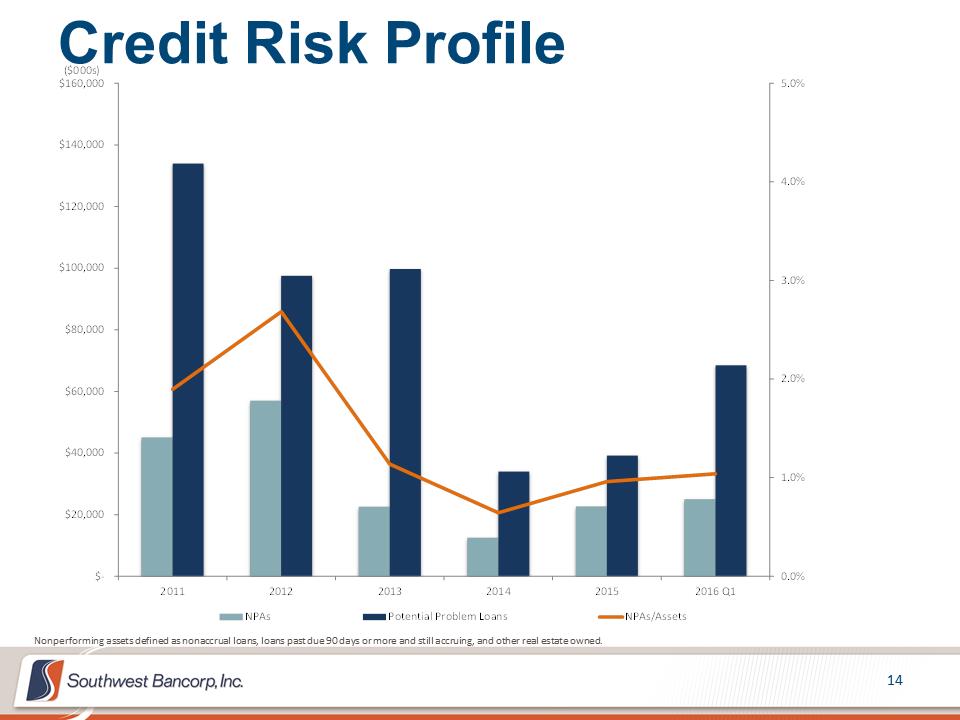 Credit Risk Profile Nonperforming assets defined as nonaccrual loans, loans past due 90 days or more and still accruing, and other real estate owned. 0.0%1.0%2.0%3.0%4.0%5.0% $- $20,000 $40,000 $60,000 $80,000 $100,000 $120,000 $140,000 $160,000201120122013201420152016 Q1($000s)NPAsPotential Problem LoansNPAs/Assets
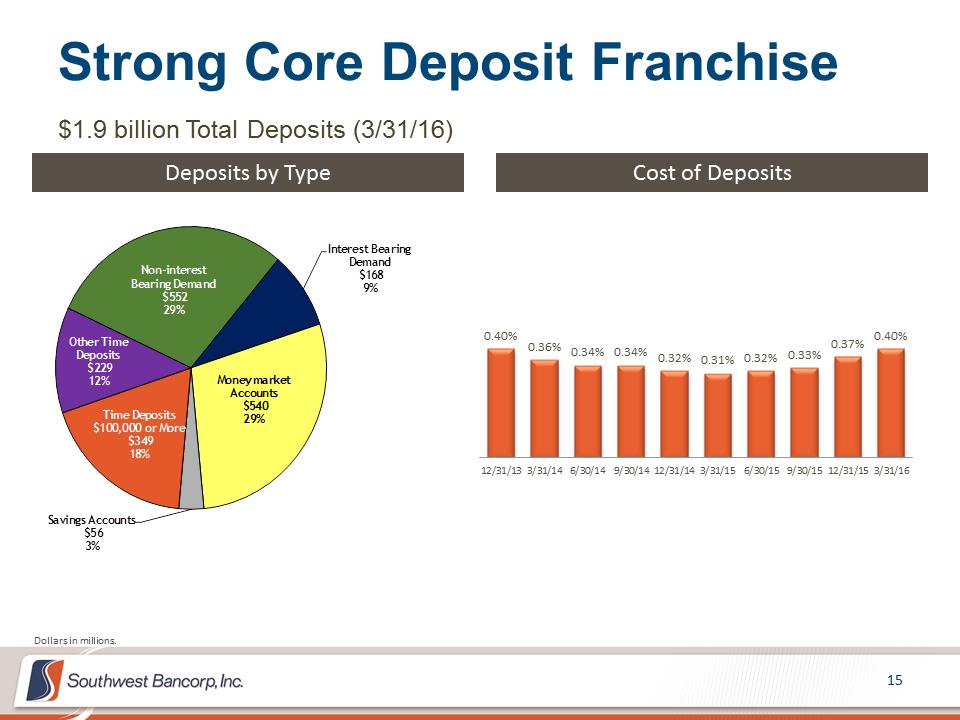 Strong Core Deposit Franchise $1.9 billion Total Deposits (3/31/16) Deposits by Type Cost of Deposits 0.40% 0.36% 0.34% 0.34% 0.32% 0.31% 0.32% 0.33% 0.37% 0.40% 12/31/133/31/146/30/149/30/1412/31/143/31/156/30/159/30/1512/31/153/31/16Non-interest Bearing Demand$552 29%Interest Bearing Demand$168 9%Money market Accounts$540 29%Savings Accounts$56 3%Time Deposits $100,000 or More$349 18%Other Time Deposits$229 12%Dollars in millions.
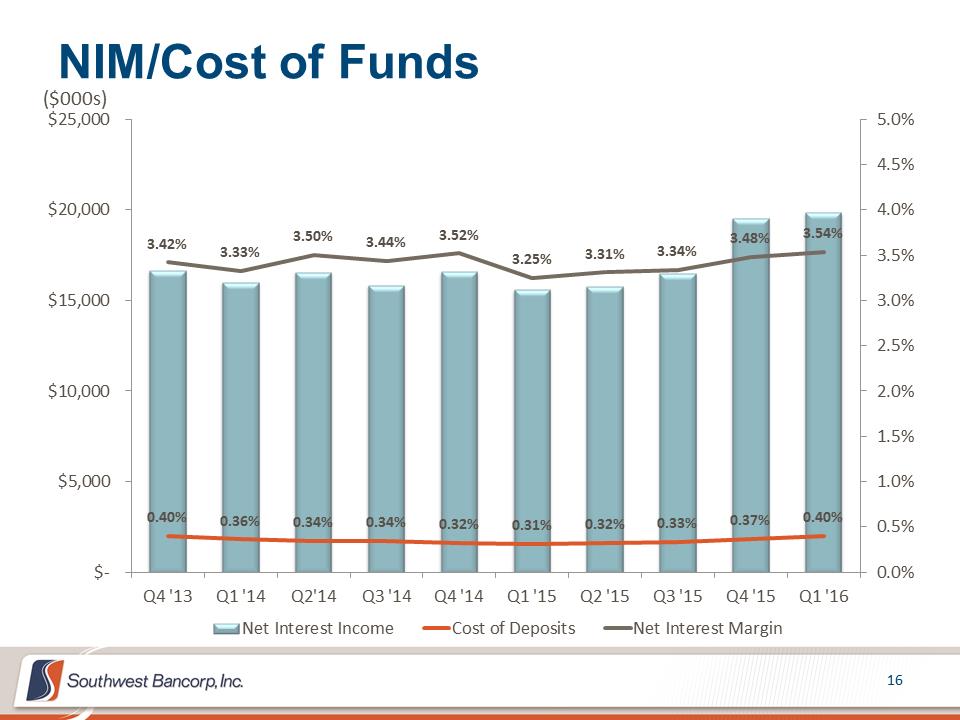 NIM/Cost of Funds 0.40% 0.36% 0.34% 0.34% 0.32% 0.31% 0.32% 0.33% 0.37% 0.40% 3.42% 3.33% 3.50% 3.44% 3.52% 3.25% 3.31% 3.34% 3.48% 3.54% 0.0%0.5%1.0%1.5%2.0%2.5%3.0%3.5%4.0%4.5%5.0% $- $5,000 $10,000 $15,000 $20,000 $25,000Q4 '13Q1 '14Q2'14Q3 '14Q4 '14Q1 '15Q2 '15Q3 '15Q4 '15Q1 '16($000s) Net Interest IncomeCost of DepositsNet Interest Margin
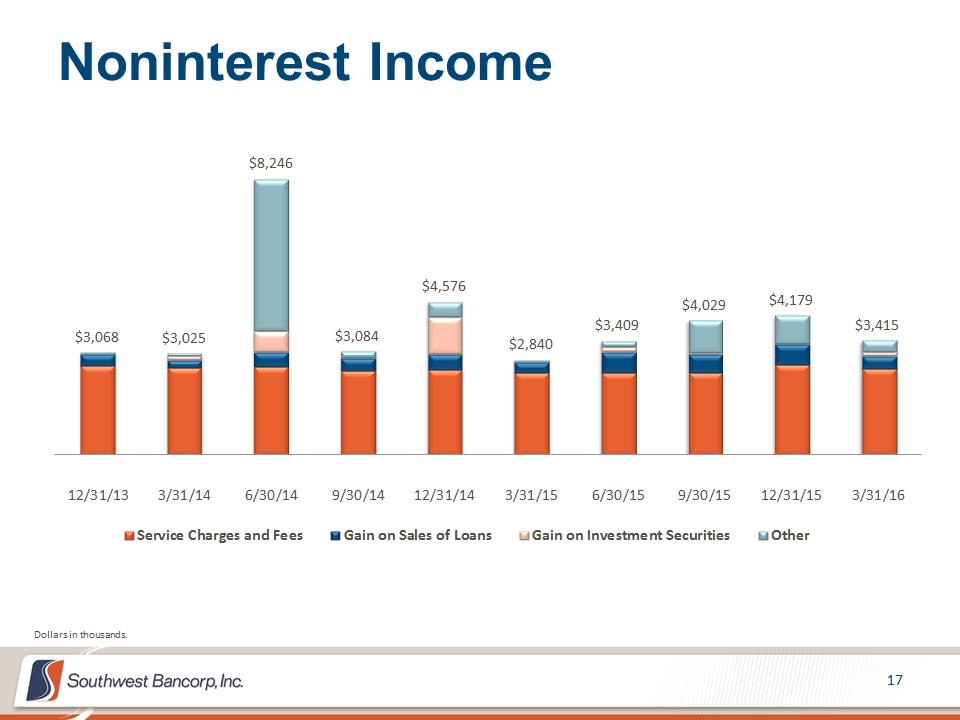 Noninterest Income $3,068 $3,025 $8,246 $3,084 $4,576 $2,840 $3,409 $4,029 $4,179 $3,415 12/31/133/31/146/30/149/30/1412/31/143/31/156/30/159/30/1512/31/153/31/16Service Charges and FeesGain on Sales of LoansGain on Investment SecuritiesOtherDollars in thousands.
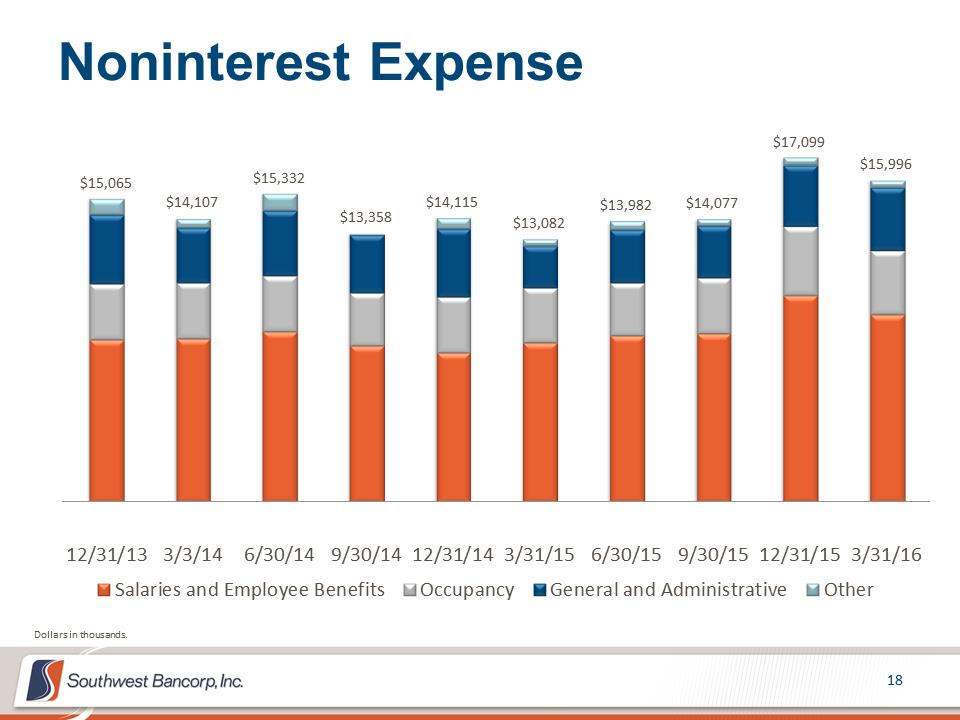 Noninterest Expense $15,065 $14,107 $15,332 $13,358 $14,115 $13,082 $13,982 $14,077 $17,099 $15,996 12/31/133/3/146/30/149/30/1412/31/143/31/156/30/159/30/1512/31/153/31/16Salaries and Employee BenefitsOccupancyGeneral and AdministrativeOtherDollars in thousands.
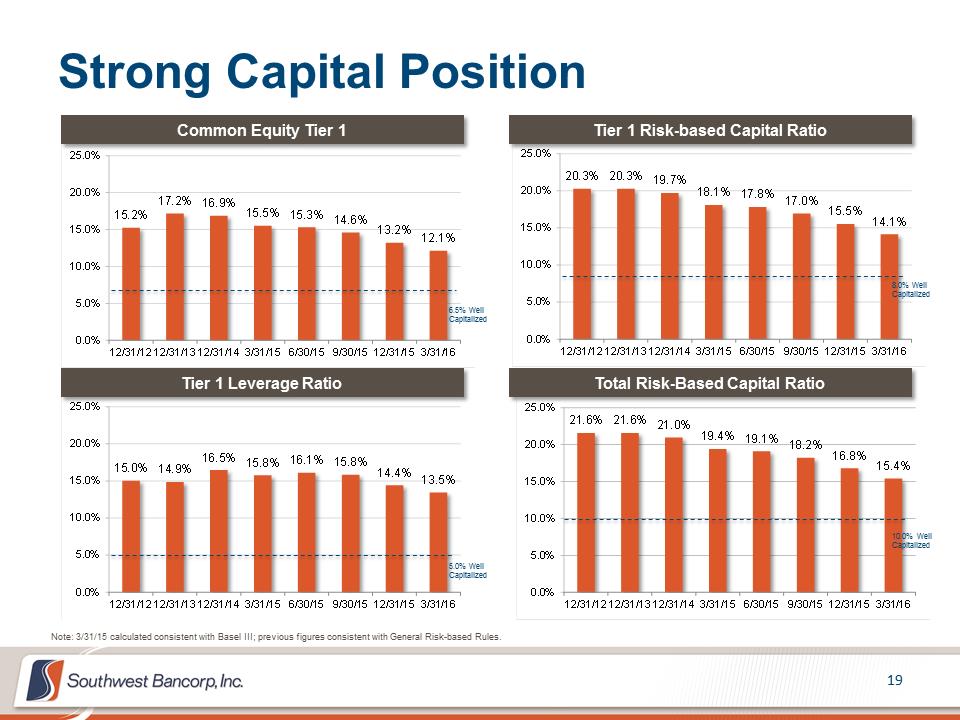 Strong Capital Position 21.6%21.6%21.0%19.4%19.1%18.2%16.8%15.4%0.0%5.0%10.0%15.0%20.0%25.0%12/31/1212/31/1312/31/143/31/156/30/159/30/1512/31/153/31/1620.3%20.3%19.7%18.1%17.8%17.0%15.5%14.1%0.0%5.0%10.0%15.0%20.0%25.0%12/31/1212/31/1312/31/143/31/156/30/159/30/1512/31/153/31/1615.2%17.2%16.9%15.5%15.3%14.6%13.2%12.1%0.0%5.0%10.0%15.0%20.0%25.0%12/31/1212/31/1312/31/143/31/156/30/159/30/1512/31/153/31/1615.0%14.9%16.5%15.8%16.1%15.8%14.4%13.5%0.0%5.0%10.0%15.0%20.0%25.0%12/31/1212/31/1312/31/143/31/156/30/159/30/1512/31/153/31/16Tier 1 Leverage Ratio Common Equity Tier 1 Note: 3/31/15 calculated consistent with Basel III; previous figures consistent with General Risk-based Rules. Tier 1 Risk-based Capital Ratio Total Risk-Based Capital Ratio 6.5% Well Capitalized 8.0% Well Capitalized 10.0% Well Capitalized 5.0% Well Capitalized
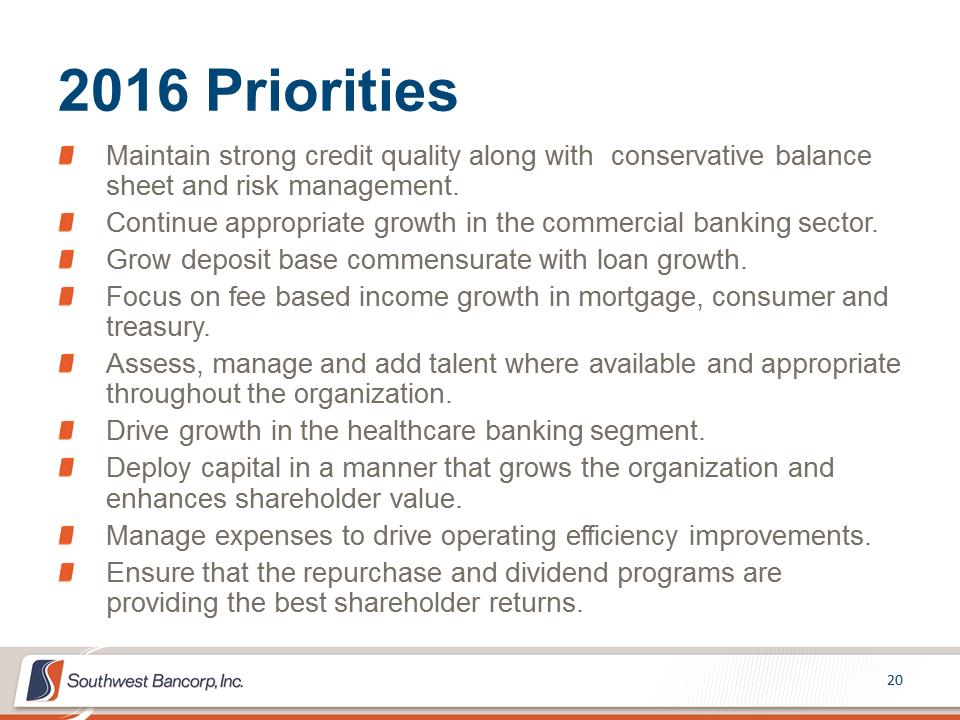 2016 Priorities Maintain strong credit quality along with conservative balance sheet and risk management. Continue appropriate growth in the commercial banking sector. Grow deposit base commensurate with loan growth. Focus on fee based income growth in mortgage, consumer and treasury. Assess, manage and add talent where available and appropriate throughout the organization. Drive growth in the healthcare banking segment. Deploy capital in a manner that grows the organization and enhances shareholder value. Manage expenses to drive operating efficiency improvements. Ensure that the repurchase and dividend programs are providing the best shareholder returns.
 ADDITIONAL FINANCIAL INFORMATION
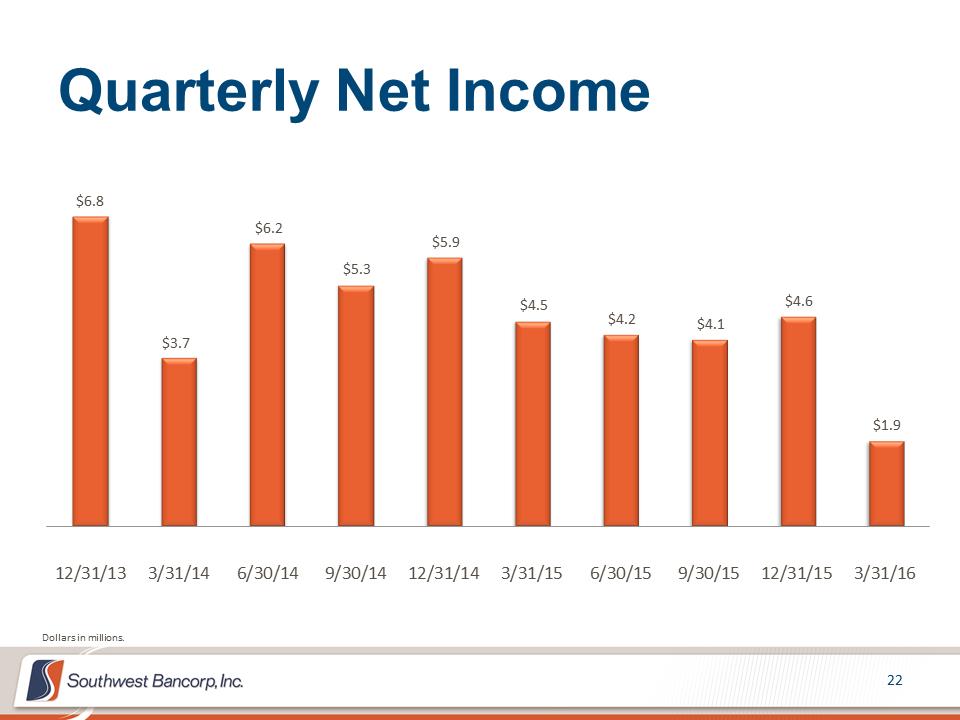 Quarterly Net Income $6.8 $3.7 $6.2 $5.3 $5.9 $4.5 $4.2 $4.1 $4.6 $1.9 12/31/133/31/146/30/149/30/1412/31/143/31/156/30/159/30/1512/31/153/31/16Dollars in millions.
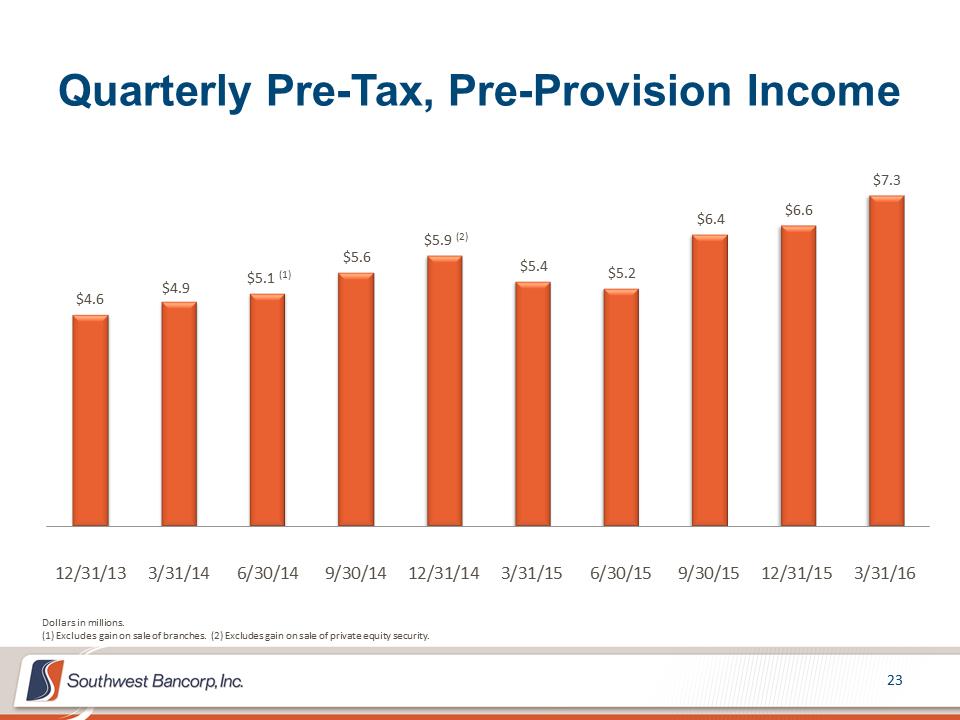 Quarterly Pre-Tax, Pre-Provision Income $4.6 $4.9 $5.1 (1) $5.6 $5.9 (2) $5.4 $5.2 $6.4 $6.6 $7.3 12/31/133/31/146/30/149/30/1412/31/143/31/156/30/159/30/1512/31/153/31/16Dollars in millions. Excludes gain on sale of branches. (2) Excludes gain on sale of private equity security.
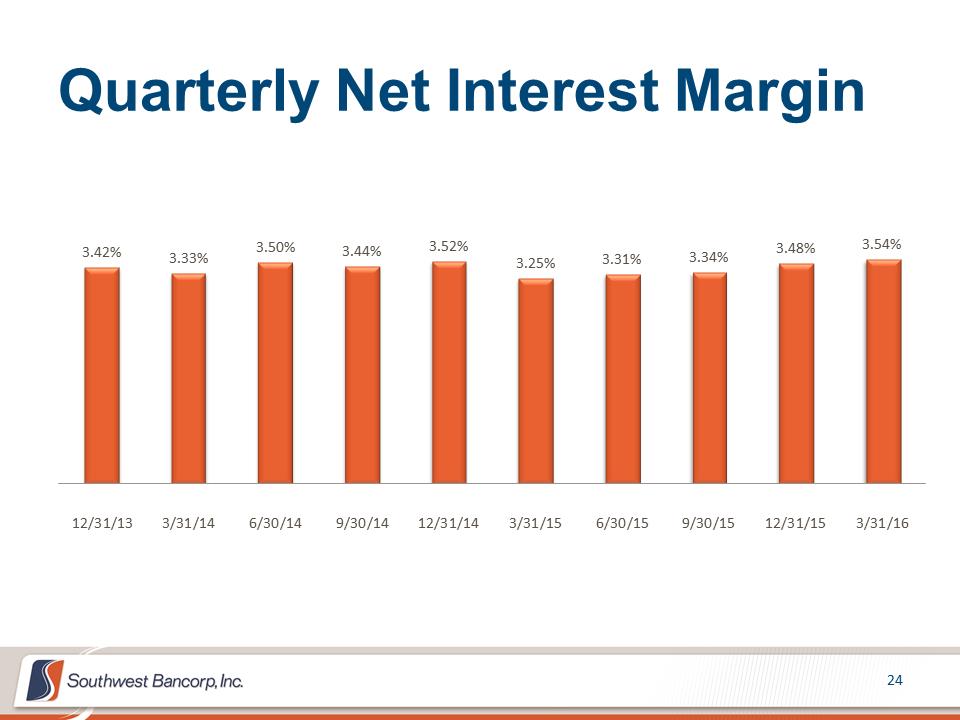 Quarterly Net Interest Margin 3.42% 3.33% 3.50% 3.44% 3.52% 3.25% 3.31% 3.34% 3.48% 3.54% 12/31/133/31/146/30/149/30/1412/31/143/31/156/30/159/30/1512/31/153/31/16
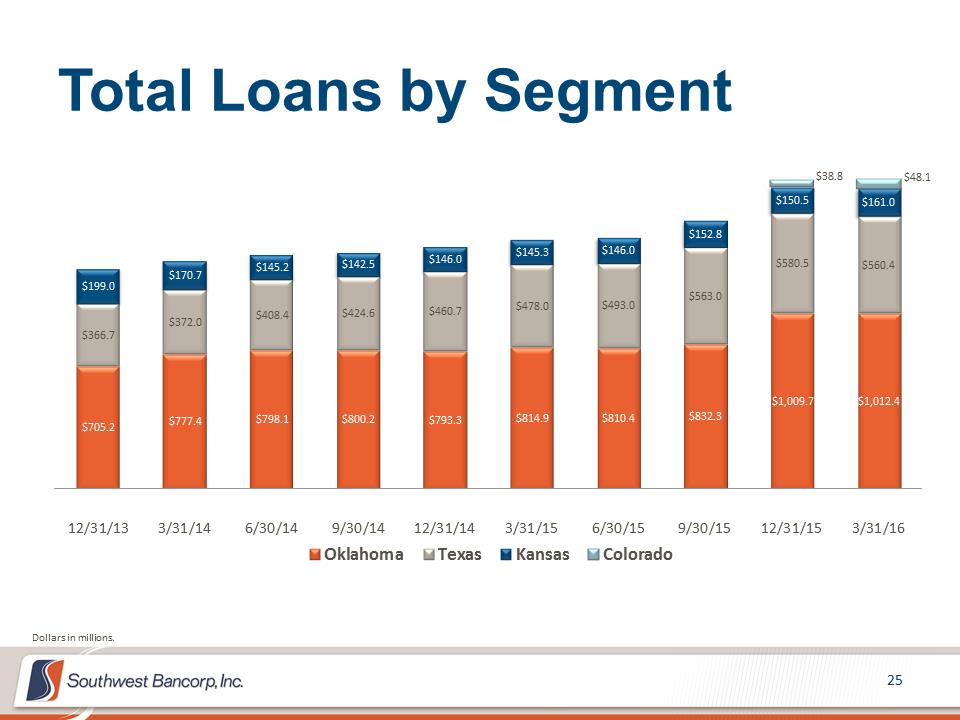 Total Loans by Segment $705.2 $777.4 $798.1 $800.2 $793.3 $814.9 $810.4 $832.3 $1,009.7 $1,012.4 $366.7 $372.0 $408.4 $424.6 $460.7 $478.0 $493.0 $563.0 $580.5 $560.4 $199.0 $170.7 $145.2 $142.5 $146.0 $145.3 $146.0 $152.8 $150.5 $161.0 $38.8 $48.1 12/31/133/31/146/30/149/30/1412/31/143/31/156/30/159/30/1512/31/153/31/16OklahomaTexasKansasColoradoDollars in millions.
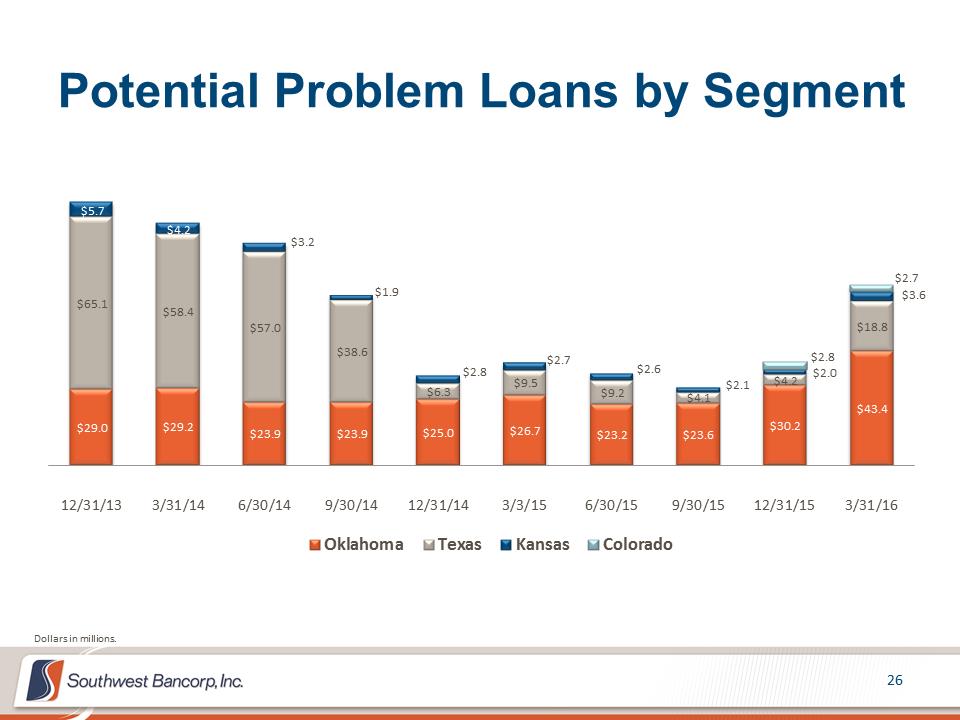 Potential Problem Loans by Segment $29.0 $29.2 $23.9 $23.9 $25.0 $26.7 $23.2 $23.6 $30.2 $43.4 $65.1 $58.4 $57.0 $38.6 $6.3 $9.5 $9.2 $4.1 $4.2 $18.8 $5.7 $4.2 $3.2 $1.9 $2.8 $2.7 $2.6 $2.1 $2.0 $3.6 $2.8 $2.7 12/31/133/31/146/30/149/30/1412/31/143/3/156/30/159/30/1512/31/153/31/16OklahomaTexasKansasColoradoDollars in millions.
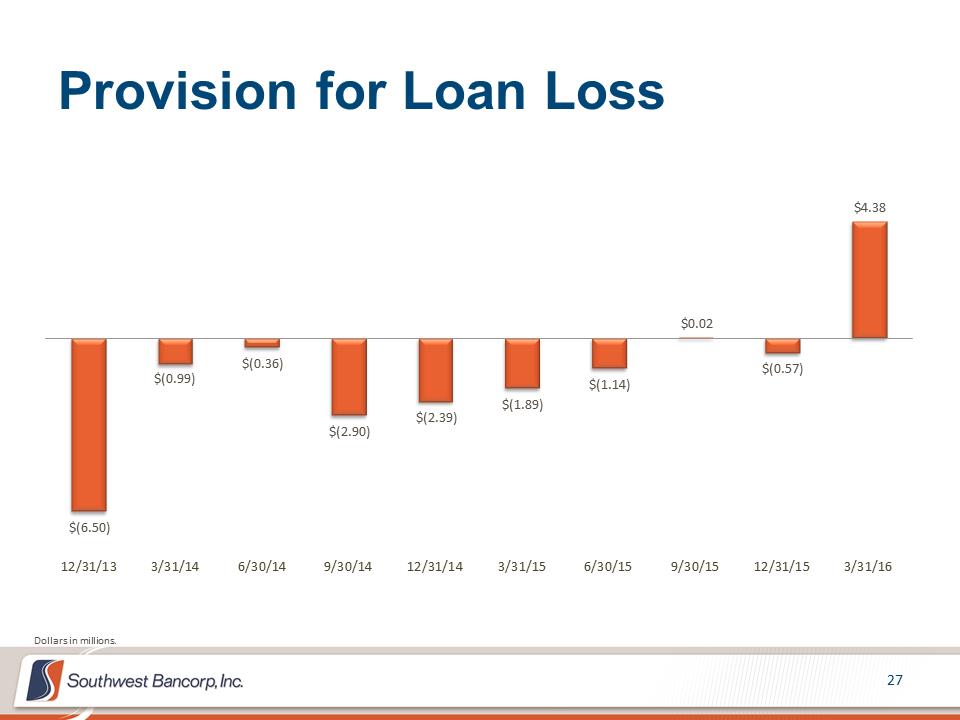 Provision for Loan Loss $(6.50) $(0.99) $(0.36) $(2.90) $(2.39) $(1.89) $(1.14) $0.02 $(0.57) $4.38 12/31/133/31/146/30/149/30/1412/31/143/31/156/30/159/30/1512/31/153/31/16Dollars in millions.
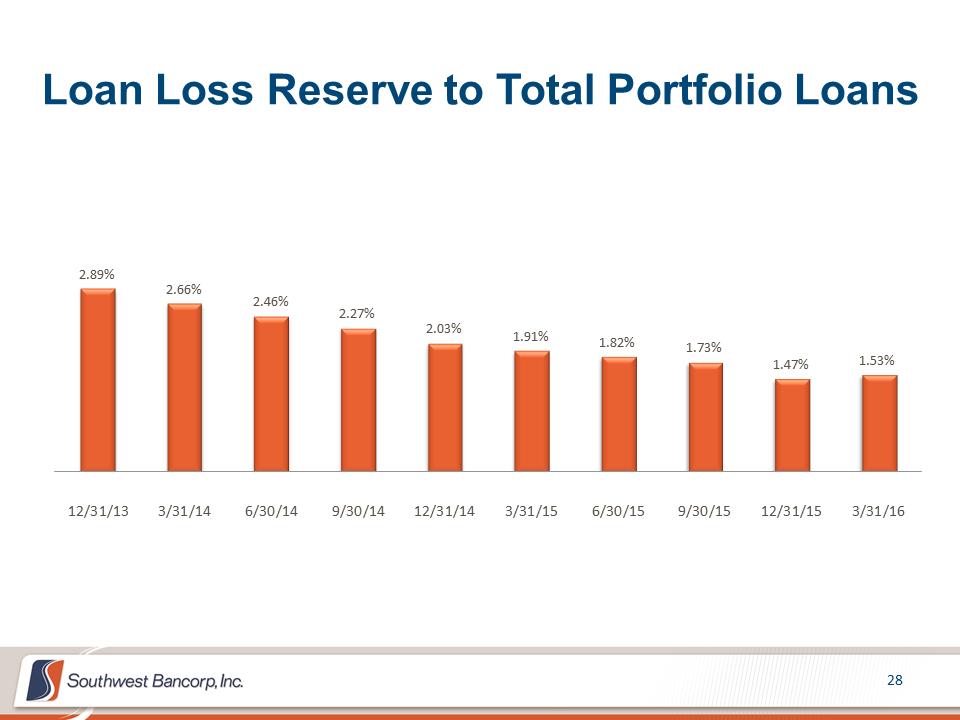 Loan Loss Reserve to Total Portfolio Loans 2.89% 2.66% 2.46% 2.27% 2.03% 1.91% 1.82% 1.73% 1.47% 1.53% 12/31/133/31/146/30/149/30/1412/31/143/31/156/30/159/30/1512/31/153/31/16
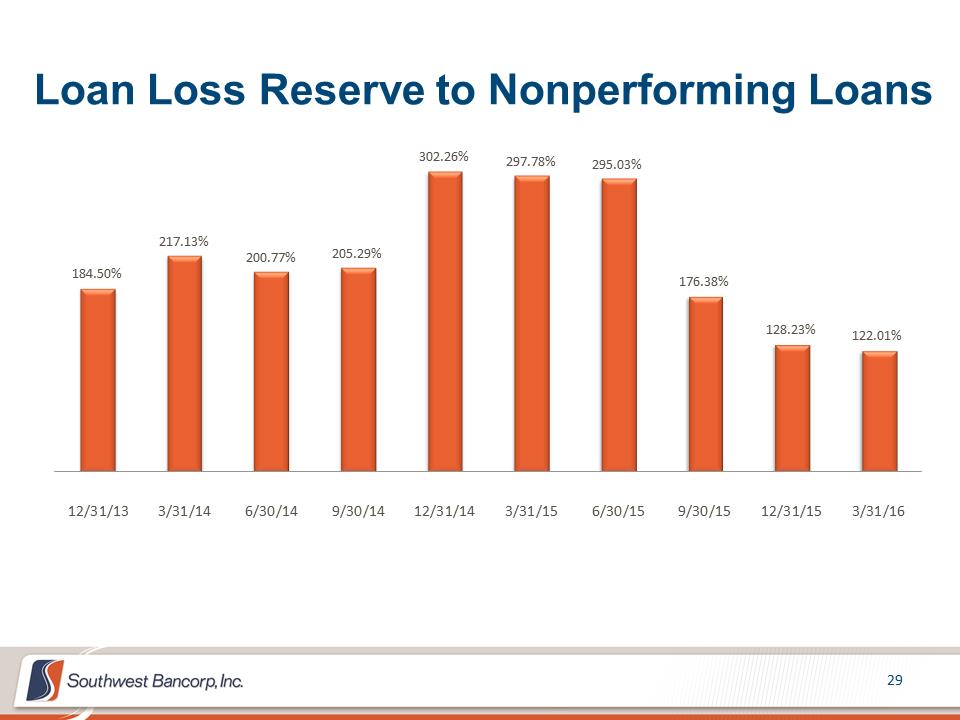 Loan Loss Reserve to Nonperforming Loans 184.50% 217.13% 200.77% 205.29% 302.26% 297.78% 295.03% 176.38% 128.23% 122.01% 12/31/133/31/146/30/149/30/1412/31/143/31/156/30/159/30/1512/31/153/31/16
 APPENDIX
 The subsequent tables present non-GAAP reconciliations of the following calculations: –Tangible Common Equity (TCE) to Tangible Assets (TA) ratio –Tangible Book Value per Share –Pre-tax, Pre-provision Income
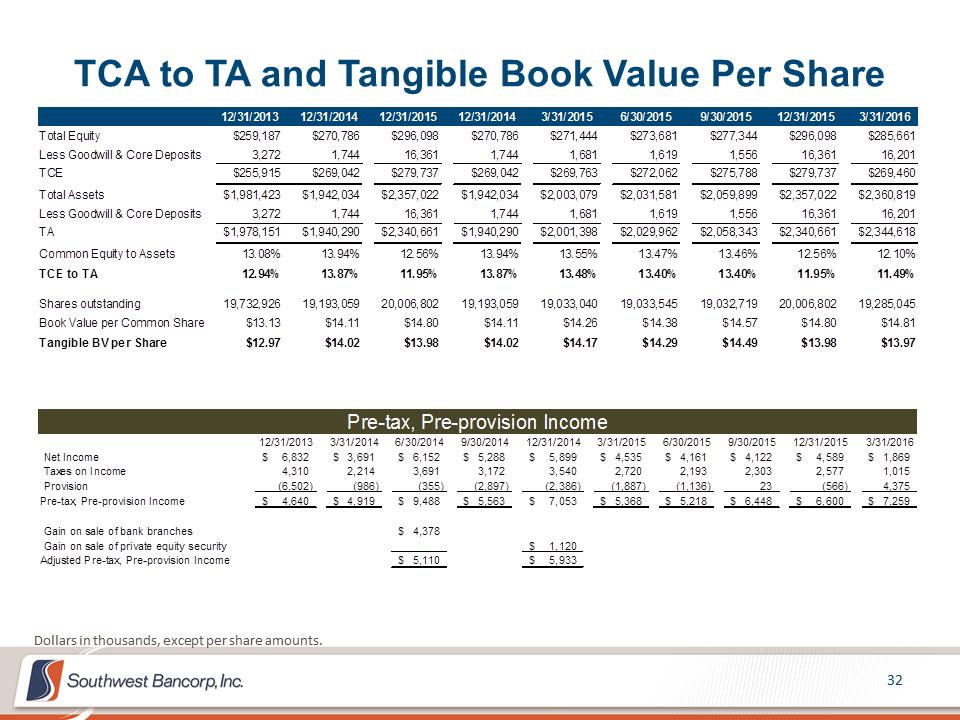 TCA to TA and Tangible Book Value Per Share Dollars in thousands, except per share amounts. 12/31/201312/31/201412/31/201512/31/20143/31/20156/30/20159/30/201512/31/20153/31/2016Total Equity$259,187 $270,786 $296,098 $270,786 $271,444 $273,681 $277,344 $296,098 $285,661 Less Goodwill & Core Deposits3,2721,74416,3611,7441,6811,6191,55616,36116,201TCE$255,915 $269,042 $279,737 $269,042 $269,763 $272,062 $275,788 $279,737 $269,460 Total Assets$1,981,423 $1,942,034 $2,357,022 $1,942,034 $2,003,079 $2,031,581 $2,059,899 $2,357,022 $2,360,819 Less Goodwill & Core Deposits3,2721,74416,3611,7441,6811,6191,55616,36116,201TA$1,978,151 $1,940,290 $2,340,661 $1,940,290 $2,001,398 $2,029,962 $2,058,343 $2,340,661 $2,344,618 Common Equity to Assets13.08%13.94%12.56%13.94%13.55%13.47%13.46%12.56%12.10%TCE to TA12.94%13.87%11.95%13.87%13.48%13.40%13.40%11.95%11.49%Shares outstanding19,732,92619,193,05920,006,80219,193,05919,033,04019,033,54519,032,71920,006,80219,285,045Book Value per Common Share$13.13 $14.11 $14.80 $14.11 $14.26 $14.38 $14.57 $14.80 $14.81 Tangible BV per Share$12.97 $14.02 $13.98 $14.02 $14.17 $14.29 $14.49 $13.98 $13.97 12/31/20133/31/20146/30/20149/30/201412/31/20143/31/20156/30/20159/30/201512/31/20153/31/2016Net Income6,832$ 3,691$ 6,152$ 5,288$ 5,899$ 4,535$ 4,161$ 4,122$ 4,589$ 1,869$ Taxes on Income4,310 2,214 3,691 3,172 3,540 2,720 2,193 2,303 2,577 1,015 Provision(6,502) (986) (355) (2,897) (2,386) (1,887) (1,136) 23 (566) 4,375 Pre-tax, Pre-provision Income4,640$ 4,919$ 9,488$ 5,563$ 7,053$ 5,368$ 5,218$ 6,448$ 6,600$ 7,259$ Gain on sale of bank branches4,378$ Gain on sale of private equity security1,120$ Adjusted Pre-tax, Pre-provision Income5,110$ 5,933$ Pre-tax, Pre-provision Income
2016 First Quarter Earnings Presentation April 20, 2016