Attached files
| file | filename |
|---|---|
| 8-K - 8-K - United Financial Bancorp, Inc. | a8-k20160331.htm |
| EX-99.1 - EXHIBIT 99.1 - United Financial Bancorp, Inc. | ex-99120160331.htm |
First Quarter 2016 EarningsNASDAQ Global Select Market: UBNK Create Your Balance
2NASDAQ: UBNK This Presentation contains forward-looking statements that are within the meaning of the Private Securities Litigation Reform Act of 1995. Such statements are based upon the current beliefs and expectations of our management and are subject to significant risks and uncertainties. These risks and uncertainties could cause our results to differ materially from those set forth in such forward-looking statements. Forward-looking statements can be identified by the fact that they do not relate strictly to historical or current facts. Words such as “believes,” “anticipates,” “expects,” “intends,” “plans,” “estimates,” “targeted” and similar expressions, and future or conditional verbs, such as “will,” “would,” “should,” “could” or “may” are intended to identify forward-looking statements but are not the only means to identify these statements. Forward-looking statements involve risks and uncertainties. Actual conditions, events or results may differ materially from those contemplated by a forward-looking statement. Factors that could cause this difference — many of which are beyond our control — include without limitation the following: Any forward-looking statements made by or on behalf of us in this Presentation speak only as of the date of this Presentation. We do not undertake to update forward-looking statements to reflect the impact of circumstances or events that arise after the date the forward-looking statement was made. The reader should; however, consult any further disclosures of a forward-looking nature we may make in future filings. With regard to presentations compared to peer institutions, the peer companies include: BHLB, BNCL, BPFH, BRKL, CBU, CUBI, DCOM, EGBN, FCF, FFIC, INDB, KRNY, NBTB, NWBI, PFS, SASR, STBA, TMP, TRST, WSFS Data for peers is sourced from SNL Financial LLC. NON-GAAP FINANCIAL MEASURES This presentation references non-GAAP financial measures incorporating tangible equity and related measures, and operating earnings excluding non-recurring costs. These measures are commonly used by investors in evaluating financial condition. GAAP earnings are lower than core earnings primarily due to non- recurring conversion, balance sheet restructuring and cost cutting initiative related expenses. The efficiency ratio represents the ratio of non-interest expenses to the sum of net interest income before provision for loan losses and non-interest income, exclusive of net gain (loss) on limited partnership investments. The pre-provision net revenue to average assets ratio represents the ratio of net interest income, on a fully tax-equivalent basis, fees and other non-interest income, net of non-credit-related expenses as a percent of total average assets. The pre-provision net revenue to average equity ratio represents the ratio of net interest income, on a fully tax-equivalent basis, fees and other non-interest income, net of non-credit-related expenses as a percent of total average equity. Reconciliations are in earnings releases at www.unitedfinancialinc.com. Forward Looking Statements
3NASDAQ: UBNK Corporate Contacts William H. W. Crawford, IV Chief Executive Officer Eric R. Newell, CFA Executive Vice President, Chief Financial Officer 860-291-3722 or ENewell@bankatunited.com Investor Information: Marliese L. Shaw Executive Vice President, Corporate Secretary/Investor Relations Officer 860-291-3622 or MShaw@bankatunited.com
4NASDAQ: UBNK Table of Contents Page Key Objectives 5 Second Quarter Reorganization 6 Commercial Banking Overview 7 Improved Core Strength 8 2016 Forecast 9 Mortgage Banking 10 Indexed Pipelines 11 Appendix 12
5NASDAQ: UBNK Four Key Objectives 1. Align earning asset growth rate with organic capital and low cost core deposit generation to maintain strong capital and liquidity ratios; 2. Re-mix cash flows into better yielding risk adjusted earning assets and reduce funding cost relative to peers. Transition thrift deposit base to commercial bank deposit base with more DDA and low cost core deposits; 3. Invest in people, systems, and technology to grow revenue and improve customer experience while maintaining very attractive cost structure; 4. Grow operating revenue, maximize operating earnings, grow tangible book value, and pay our dividend. Map more of our revenue into net interest income and core fee income while more volatile loan level hedging and mortgage banking decline relative to total revenue.
6NASDAQ: UBNK Second Quarter Reorganization • Designed to centralize operational duties in our back office to free up sales and service staff allowing for a better customer experience and lower operating costs; • Results in $3 million of annual pre-tax savings; • Expected one-time severance payout of $1.5 million in second quarter.
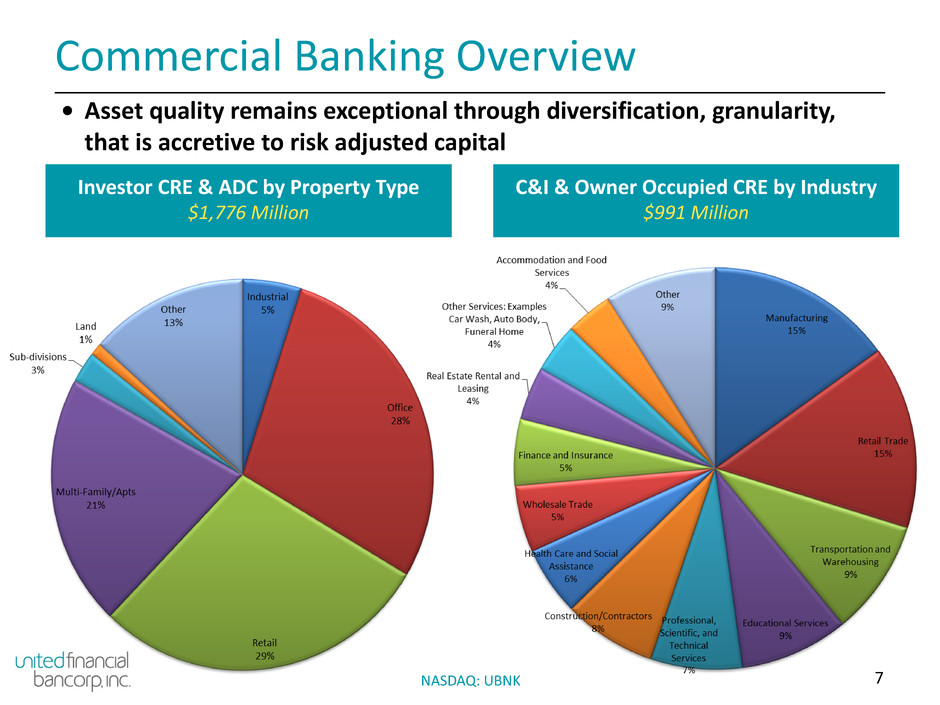
7NASDAQ: UBNK Commercial Banking Overview • Asset quality remains exceptional through diversification, granularity, that is accretive to risk adjusted capital Investor CRE & ADC by Property Type $1,776 Million C&I & Owner Occupied CRE by Industry $991 Million
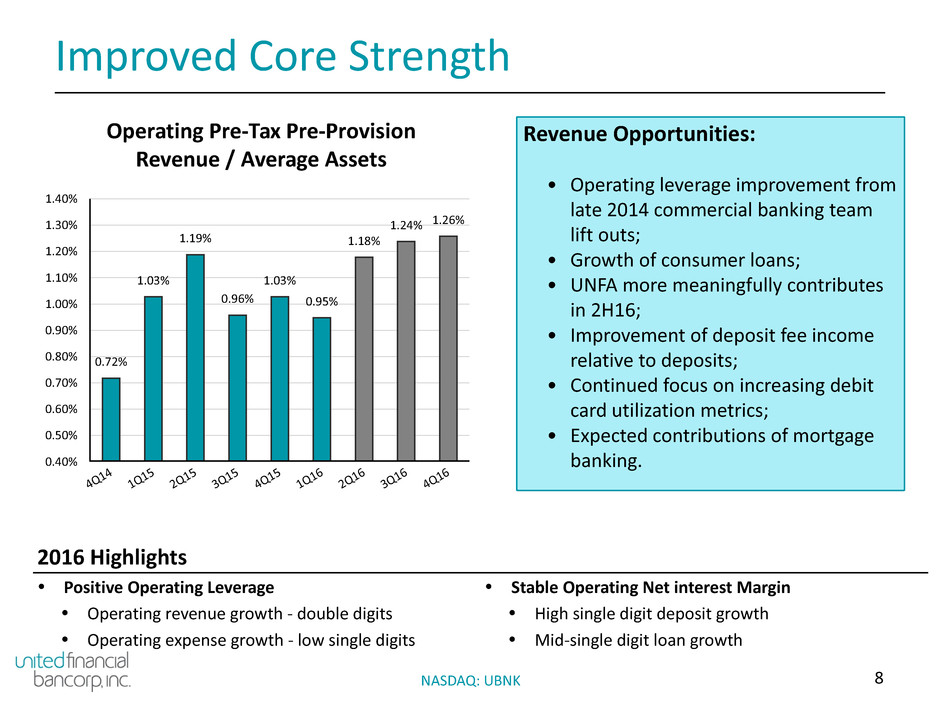
8NASDAQ: UBNK Improved Core Strength Operating Pre-Tax Pre-Provision Revenue / Average Assets 1.40% 1.30% 1.20% 1.10% 1.00% 0.90% 0.80% 0.70% 0.60% 0.50% 0.40% 4Q1 4 1Q1 5 2Q1 5 3Q1 5 4Q1 5 1Q1 6 2Q1 6 3Q1 6 4Q1 6 0.72% 1.03% 1.19% 0.96% 1.03% 0.95% 1.18% 1.24% 1.26% 2016 Highlights Ÿ Positive Operating Leverage Ÿ Stable Operating Net interest Margin Ÿ Operating revenue growth - double digits Ÿ High single digit deposit growth Ÿ Operating expense growth - low single digits Ÿ Mid-single digit loan growth Revenue Opportunities: • Operating leverage improvement from late 2014 commercial banking team lift outs; • Growth of consumer loans; • UNFA more meaningfully contributes in 2H16; • Improvement of deposit fee income relative to deposits; • Continued focus on increasing debit card utilization metrics; • Expected contributions of mortgage banking.
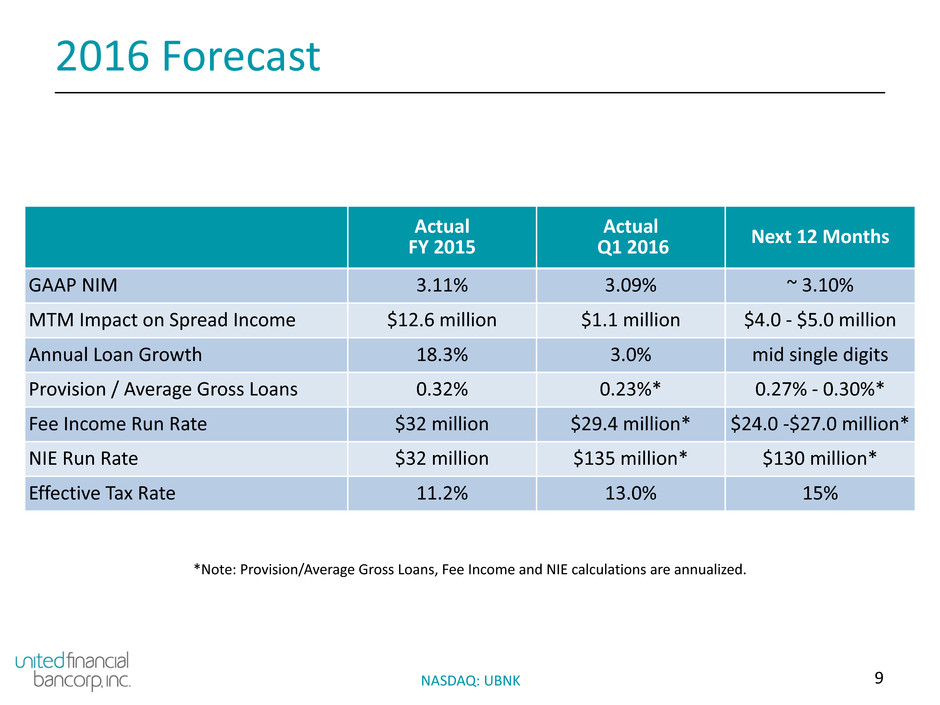
9NASDAQ: UBNK 2016 Forecast Actual FY 2015 Actual Q1 2016 Next 12 Months GAAP NIM 3.11% 3.09% ~ 3.10% MTM Impact on Spread Income $12.6 million $1.1 million $4.0 - $5.0 million Annual Loan Growth 18.3% 3.0% mid single digits Provision / Average Gross Loans 0.32% 0.23%* 0.27% - 0.30%* Fee Income Run Rate $32 million $29.4 million* $24.0 -$27.0 million* NIE Run Rate $32 million $135 million* $130 million* Effective Tax Rate 11.2% 13.0% 15% *Note: Provision/Average Gross Loans, Fee Income and NIE calculations are annualized.
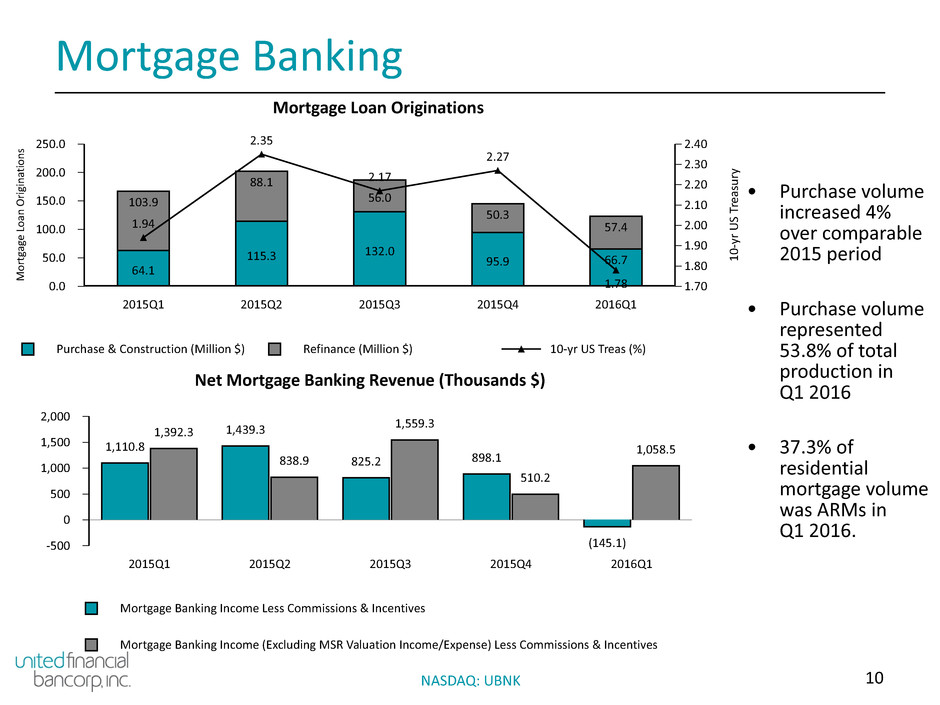
10NASDAQ: UBNK • Purchase volume increased 4% over comparable 2015 period • Purchase volume represented 53.8% of total production in Q1 2016 • 37.3% of residential mortgage volume was ARMs in Q1 2016. Mortgage Banking Mortgage Banking Income Less Commissions & Incentives Mortgage Banking Income (Excluding MSR Valuation Income/Expense) Less Commissions & Incentives Net Mortgage Banking Revenue (Thousands $) 2,000 1,500 1,000 500 0 -500 2015Q1 2015Q2 2015Q3 2015Q4 2016Q1 1,110.8 1,439.3 825.2 898.1 (145.1) 1,392.3 838.9 1,559.3 510.2 1,058.5 Purchase & Construction (Million $) Refinance (Million $) 10-yr US Treas (%) Mortgage Loan Originations 250.0 200.0 150.0 100.0 50.0 0.0 M or tg ag e Lo an O rig in at io ns 2.40 2.30 2.20 2.10 2.00 1.90 1.80 1.70 10 -y rU S Tr ea su ry 2015Q1 2015Q2 2015Q3 2015Q4 2016Q1 64.1 115.3 132.0 95.9 66.7 103.9 88.1 56.0 50.3 57.41.94 2.35 2.17 2.27 1.78
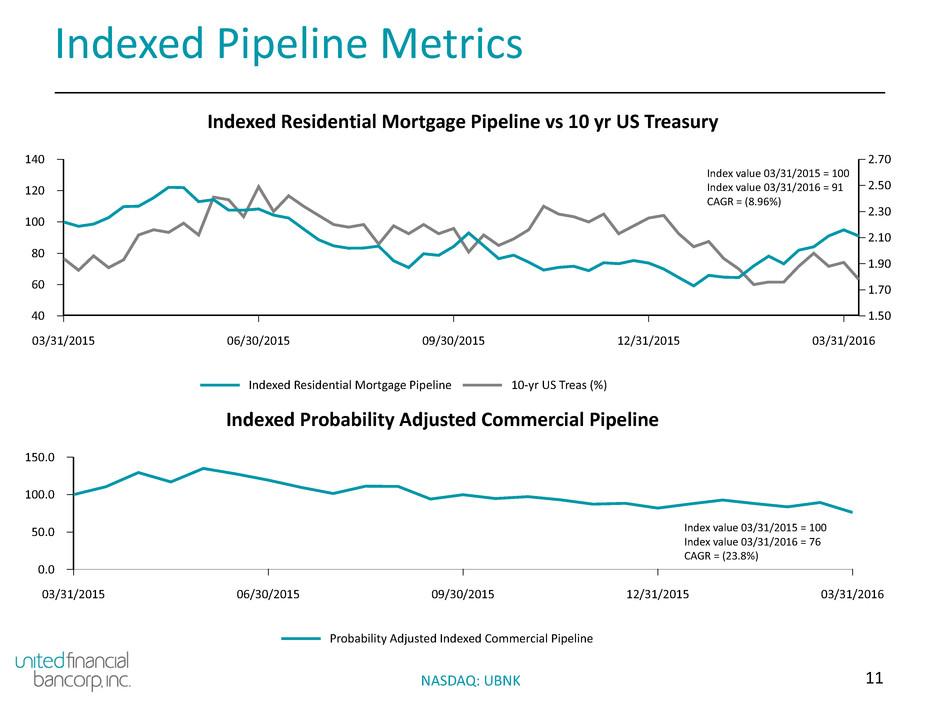
11NASDAQ: UBNK Indexed Pipeline Metrics Indexed Residential Mortgage Pipeline 10-yr US Treas (%) Indexed Residential Mortgage Pipeline vs 10 yr US Treasury 140 120 100 80 60 40 2.70 2.50 2.30 2.10 1.90 1.70 1.50 03/31/2015 06/30/2015 09/30/2015 12/31/2015 03/31/2016 Probability Adjusted Indexed Commercial Pipeline Indexed Probability Adjusted Commercial Pipeline 150.0 100.0 50.0 0.0 03/31/2015 06/30/2015 09/30/2015 12/31/2015 03/31/2016 Index value 03/31/2015 = 100 Index value 03/31/2016 = 76 CAGR = (23.8%) Index value 03/31/2015 = 100 Index value 03/31/2016 = 91 CAGR = (8.96%)
12NASDAQ: UBNK APPENDIX
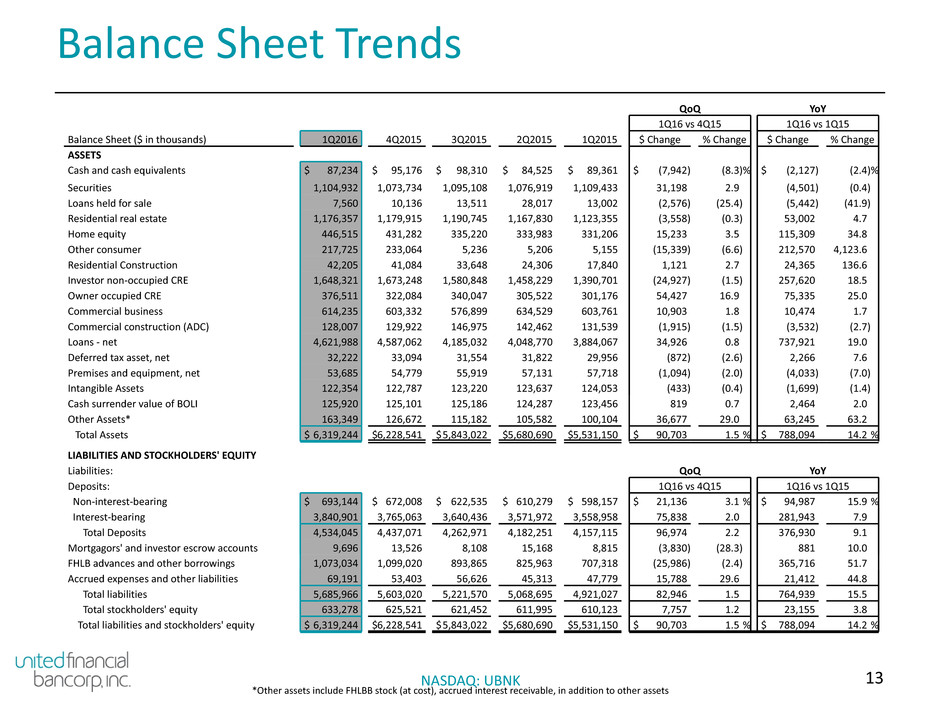
13NASDAQ: UBNK Balance Sheet Trends QoQ YoY 1Q16 vs 4Q15 1Q16 vs 1Q15 Balance Sheet ($ in thousands) 1Q2016 4Q2015 3Q2015 2Q2015 1Q2015 $ Change % Change $ Change % Change ASSETS Cash and cash equivalents $ 87,234 $ 95,176 $ 98,310 $ 84,525 $ 89,361 $ (7,942) (8.3)% $ (2,127) (2.4)% Securities 1,104,932 1,073,734 1,095,108 1,076,919 1,109,433 31,198 2.9 (4,501) (0.4) Loans held for sale 7,560 10,136 13,511 28,017 13,002 (2,576) (25.4) (5,442) (41.9) Residential real estate 1,176,357 1,179,915 1,190,745 1,167,830 1,123,355 (3,558) (0.3) 53,002 4.7 Home equity 446,515 431,282 335,220 333,983 331,206 15,233 3.5 115,309 34.8 Other consumer 217,725 233,064 5,236 5,206 5,155 (15,339) (6.6) 212,570 4,123.6 Residential Construction 42,205 41,084 33,648 24,306 17,840 1,121 2.7 24,365 136.6 Investor non-occupied CRE 1,648,321 1,673,248 1,580,848 1,458,229 1,390,701 (24,927) (1.5) 257,620 18.5 Owner occupied CRE 376,511 322,084 340,047 305,522 301,176 54,427 16.9 75,335 25.0 Commercial business 614,235 603,332 576,899 634,529 603,761 10,903 1.8 10,474 1.7 Commercial construction (ADC) 128,007 129,922 146,975 142,462 131,539 (1,915) (1.5) (3,532) (2.7) Loans - net 4,621,988 4,587,062 4,185,032 4,048,770 3,884,067 34,926 0.8 737,921 19.0 Deferred tax asset, net 32,222 33,094 31,554 31,822 29,956 (872) (2.6) 2,266 7.6 Premises and equipment, net 53,685 54,779 55,919 57,131 57,718 (1,094) (2.0) (4,033) (7.0) Intangible Assets 122,354 122,787 123,220 123,637 124,053 (433) (0.4) (1,699) (1.4) Cash surrender value of BOLI 125,920 125,101 125,186 124,287 123,456 819 0.7 2,464 2.0 Other Assets* 163,349 126,672 115,182 105,582 100,104 36,677 29.0 63,245 63.2 Total Assets $ 6,319,244 $6,228,541 $5,843,022 $5,680,690 $5,531,150 $ 90,703 1.5 % $ 788,094 14.2 % LIABILITIES AND STOCKHOLDERS' EQUITY Liabilities: QoQ YoY Deposits: 1Q16 vs 4Q15 1Q16 vs 1Q15 Non-interest-bearing $ 693,144 $ 672,008 $ 622,535 $ 610,279 $ 598,157 $ 21,136 3.1 % $ 94,987 15.9 % Interest-bearing 3,840,901 3,765,063 3,640,436 3,571,972 3,558,958 75,838 2.0 281,943 7.9 Total Deposits 4,534,045 4,437,071 4,262,971 4,182,251 4,157,115 96,974 2.2 376,930 9.1 Mortgagors' and investor escrow accounts 9,696 13,526 8,108 15,168 8,815 (3,830) (28.3) 881 10.0 FHLB advances and other borrowings 1,073,034 1,099,020 893,865 825,963 707,318 (25,986) (2.4) 365,716 51.7 Accrued expenses and other liabilities 69,191 53,403 56,626 45,313 47,779 15,788 29.6 21,412 44.8 Total liabilities 5,685,966 5,603,020 5,221,570 5,068,695 4,921,027 82,946 1.5 764,939 15.5 Total stockholders' equity 633,278 625,521 621,452 611,995 610,123 7,757 1.2 23,155 3.8 Total liabilities and stockholders' equity $ 6,319,244 $6,228,541 $5,843,022 $5,680,690 $5,531,150 $ 90,703 1.5 % $ 788,094 14.2 % *Other assets include FHLBB stock (at cost), accrued interest receivable, in addition to other assets
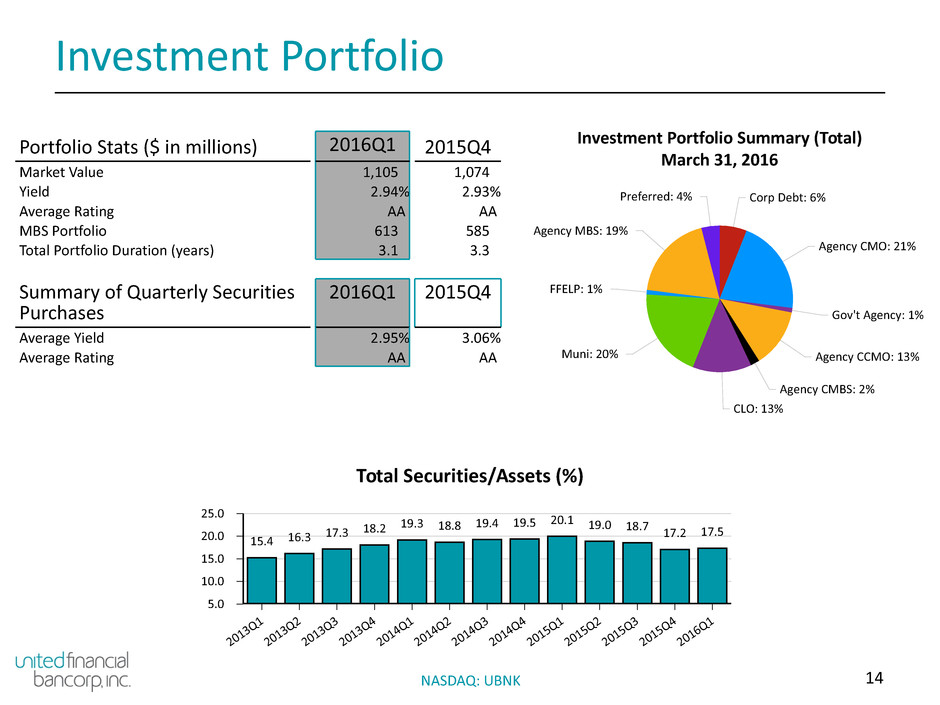
14NASDAQ: UBNK Investment Portfolio Portfolio Stats ($ in millions) 2016Q1 2015Q4 Market Value 1,105 1,074 Yield 2.94% 2.93% Average Rating AA AA MBS Portfolio 613 585 Total Portfolio Duration (years) 3.1 3.3 Summary of Quarterly Securities Purchases 2016Q1 2015Q4 Average Yield 2.95% 3.06% Average Rating AA AA Total Securities/Assets (%) 25.0 20.0 15.0 10.0 5.0 201 3Q 1 201 3Q 2 201 3Q 3 201 3Q 4 201 4Q 1 201 4Q 2 201 4Q 3 201 4Q 4 201 5Q 1 201 5Q 2 201 5Q 3 201 5Q 4 201 6Q 1 15.4 16.3 17.3 18.2 19.3 18.8 19.4 19.5 20.1 19.0 18.7 17.2 17.5 Investment Portfolio Summary (Total) March 31, 2016 Corp Debt: 6% Agency CMO: 21% Gov't Agency: 1% Agency CCMO: 13% Agency CMBS: 2% CLO: 13% Muni: 20% FFELP: 1% Agency MBS: 19% Preferred: 4%
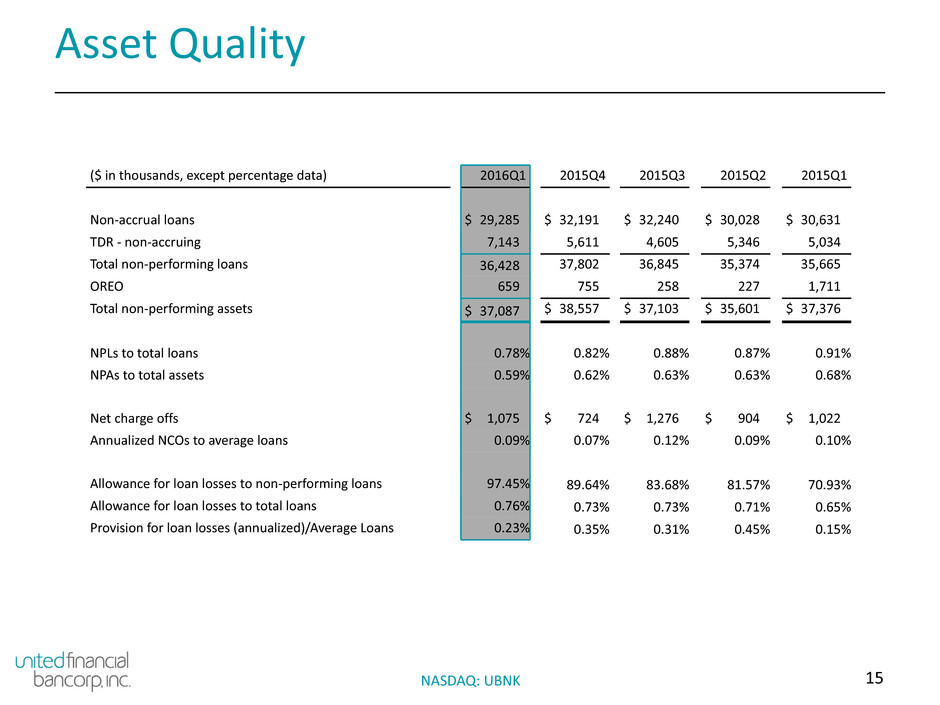
15NASDAQ: UBNK Asset Quality ($ in thousands, except percentage data) 2016Q1 2015Q4 2015Q3 2015Q2 2015Q1 Non-accrual loans $ 29,285 $ 32,191 $ 32,240 $ 30,028 $ 30,631 TDR - non-accruing 7,143 5,611 4,605 5,346 5,034 Total non-performing loans 36,428 37,802 36,845 35,374 35,665 OREO 659 755 258 227 1,711 Total non-performing assets $ 37,087 $ 38,557 $ 37,103 $ 35,601 $ 37,376 NPLs to total loans 0.78% 0.82% 0.88% 0.87% 0.91% NPAs to total assets 0.59% 0.62% 0.63% 0.63% 0.68% Net charge offs $ 1,075 $ 724 $ 1,276 $ 904 $ 1,022 Annualized NCOs to average loans 0.09% 0.07% 0.12% 0.09% 0.10% Allowance for loan losses to non-performing loans 97.45% 89.64% 83.68% 81.57% 70.93% Allowance for loan losses to total loans 0.76% 0.73% 0.73% 0.71% 0.65% Provision for loan losses (annualized)/Average Loans 0.23% 0.35% 0.31% 0.45% 0.15%
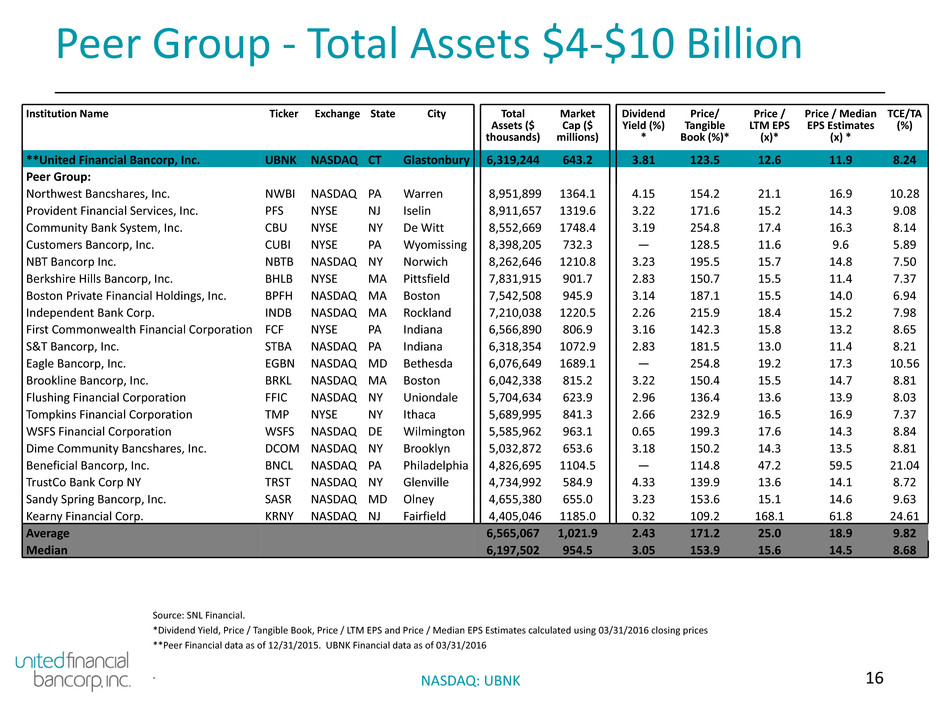
16NASDAQ: UBNK Peer Group - Total Assets $4-$10 Billion Source: SNL Financial. *Dividend Yield, Price / Tangible Book, Price / LTM EPS and Price / Median EPS Estimates calculated using 03/31/2016 closing prices **Peer Financial data as of 12/31/2015. UBNK Financial data as of 03/31/2016 . Institution Name Ticker Exchange State City Total Assets ($ thousands) Market Cap ($ millions) Dividend Yield (%) * Price/ Tangible Book (%)* Price / LTM EPS (x)* Price / Median EPS Estimates (x) * TCE/TA (%) **United Financial Bancorp, Inc. UBNK NASDAQ CT Glastonbury 6,319,244 643.2 3.81 123.5 12.6 11.9 8.24 Peer Group: Northwest Bancshares, Inc. NWBI NASDAQ PA Warren 8,951,899 1364.1 4.15 154.2 21.1 16.9 10.28 Provident Financial Services, Inc. PFS NYSE NJ Iselin 8,911,657 1319.6 3.22 171.6 15.2 14.3 9.08 Community Bank System, Inc. CBU NYSE NY De Witt 8,552,669 1748.4 3.19 254.8 17.4 16.3 8.14 Customers Bancorp, Inc. CUBI NYSE PA Wyomissing 8,398,205 732.3 — 128.5 11.6 9.6 5.89 NBT Bancorp Inc. NBTB NASDAQ NY Norwich 8,262,646 1210.8 3.23 195.5 15.7 14.8 7.50 Berkshire Hills Bancorp, Inc. BHLB NYSE MA Pittsfield 7,831,915 901.7 2.83 150.7 15.5 11.4 7.37 Boston Private Financial Holdings, Inc. BPFH NASDAQ MA Boston 7,542,508 945.9 3.14 187.1 15.5 14.0 6.94 Independent Bank Corp. INDB NASDAQ MA Rockland 7,210,038 1220.5 2.26 215.9 18.4 15.2 7.98 First Commonwealth Financial Corporation FCF NYSE PA Indiana 6,566,890 806.9 3.16 142.3 15.8 13.2 8.65 S&T Bancorp, Inc. STBA NASDAQ PA Indiana 6,318,354 1072.9 2.83 181.5 13.0 11.4 8.21 Eagle Bancorp, Inc. EGBN NASDAQ MD Bethesda 6,076,649 1689.1 — 254.8 19.2 17.3 10.56 Brookline Bancorp, Inc. BRKL NASDAQ MA Boston 6,042,338 815.2 3.22 150.4 15.5 14.7 8.81 Flushing Financial Corporation FFIC NASDAQ NY Uniondale 5,704,634 623.9 2.96 136.4 13.6 13.9 8.03 Tompkins Financial Corporation TMP NYSE NY Ithaca 5,689,995 841.3 2.66 232.9 16.5 16.9 7.37 WSFS Financial Corporation WSFS NASDAQ DE Wilmington 5,585,962 963.1 0.65 199.3 17.6 14.3 8.84 Dime Community Bancshares, Inc. DCOM NASDAQ NY Brooklyn 5,032,872 653.6 3.18 150.2 14.3 13.5 8.81 Beneficial Bancorp, Inc. BNCL NASDAQ PA Philadelphia 4,826,695 1104.5 — 114.8 47.2 59.5 21.04 TrustCo Bank Corp NY TRST NASDAQ NY Glenville 4,734,992 584.9 4.33 139.9 13.6 14.1 8.72 Sandy Spring Bancorp, Inc. SASR NASDAQ MD Olney 4,655,380 655.0 3.23 153.6 15.1 14.6 9.63 Kearny Financial Corp. KRNY NASDAQ NJ Fairfield 4,405,046 1185.0 0.32 109.2 168.1 61.8 24.61 Average 6,565,067 1,021.9 2.43 171.2 25.0 18.9 9.82 Median 6,197,502 954.5 3.05 153.9 15.6 14.5 8.68
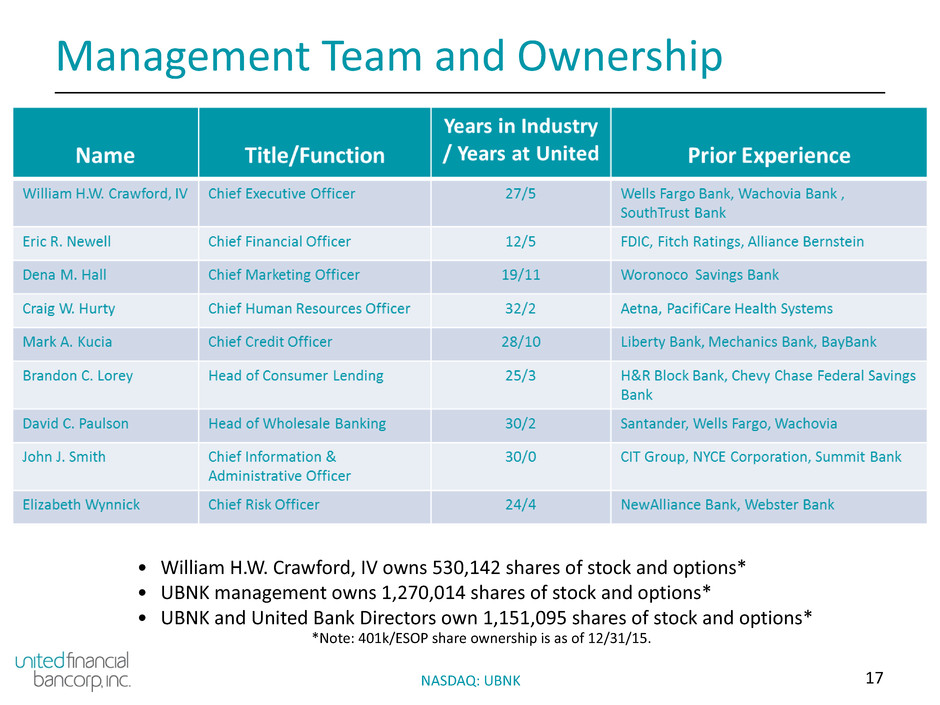
17NASDAQ: UBNK Management Team and Ownership • William H.W. Crawford, IV owns 530,142 shares of stock and options* • UBNK management owns 1,270,014 shares of stock and options* • UBNK and United Bank Directors own 1,151,095 shares of stock and options* *Note: 401k/ESOP share ownership is as of 12/31/15.
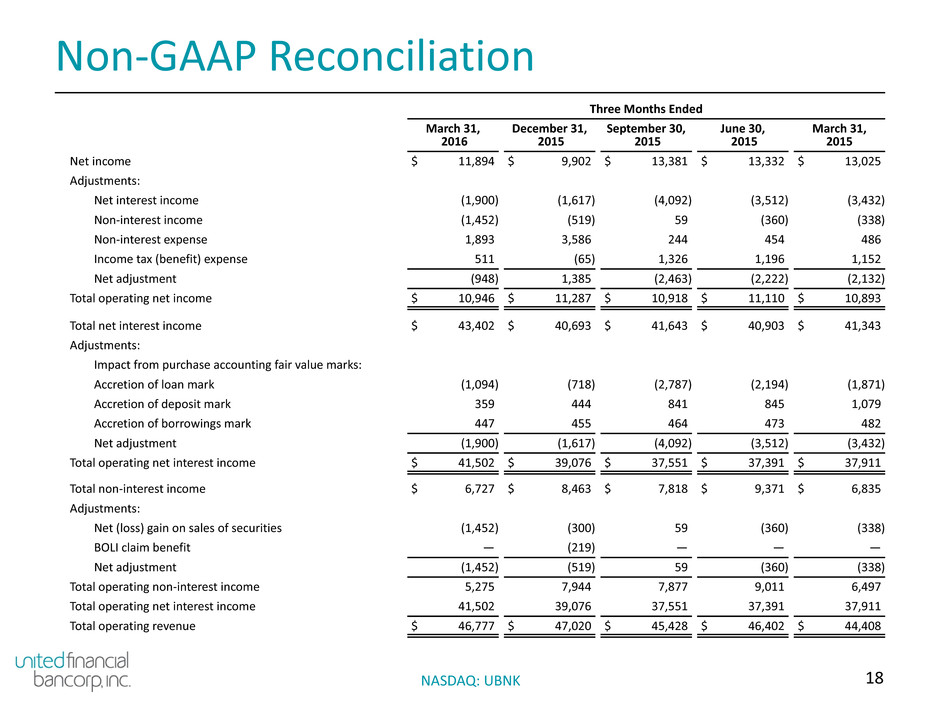
18NASDAQ: UBNK Non-GAAP Reconciliation Three Months Ended March 31, 2016 December 31, 2015 September 30, 2015 June 30, 2015 March 31, 2015 Net income $ 11,894 $ 9,902 $ 13,381 $ 13,332 $ 13,025 Adjustments: Net interest income (1,900) (1,617) (4,092) (3,512) (3,432) Non-interest income (1,452) (519) 59 (360) (338) Non-interest expense 1,893 3,586 244 454 486 Income tax (benefit) expense 511 (65) 1,326 1,196 1,152 Net adjustment (948) 1,385 (2,463) (2,222) (2,132) Total operating net income $ 10,946 $ 11,287 $ 10,918 $ 11,110 $ 10,893 Total net interest income $ 43,402 $ 40,693 $ 41,643 $ 40,903 $ 41,343 Adjustments: Impact from purchase accounting fair value marks: Accretion of loan mark (1,094) (718) (2,787) (2,194) (1,871) Accretion of deposit mark 359 444 841 845 1,079 Accretion of borrowings mark 447 455 464 473 482 Net adjustment (1,900) (1,617) (4,092) (3,512) (3,432) Total operating net interest income $ 41,502 $ 39,076 $ 37,551 $ 37,391 $ 37,911 Total non-interest income $ 6,727 $ 8,463 $ 7,818 $ 9,371 $ 6,835 Adjustments: Net (loss) gain on sales of securities (1,452) (300) 59 (360) (338) BOLI claim benefit — (219) — — — Net adjustment (1,452) (519) 59 (360) (338) Total operating non-interest income 5,275 7,944 7,877 9,011 6,497 Total operating net interest income 41,502 39,076 37,551 37,391 37,911 Total operating revenue $ 46,777 $ 47,020 $ 45,428 $ 46,402 $ 44,408
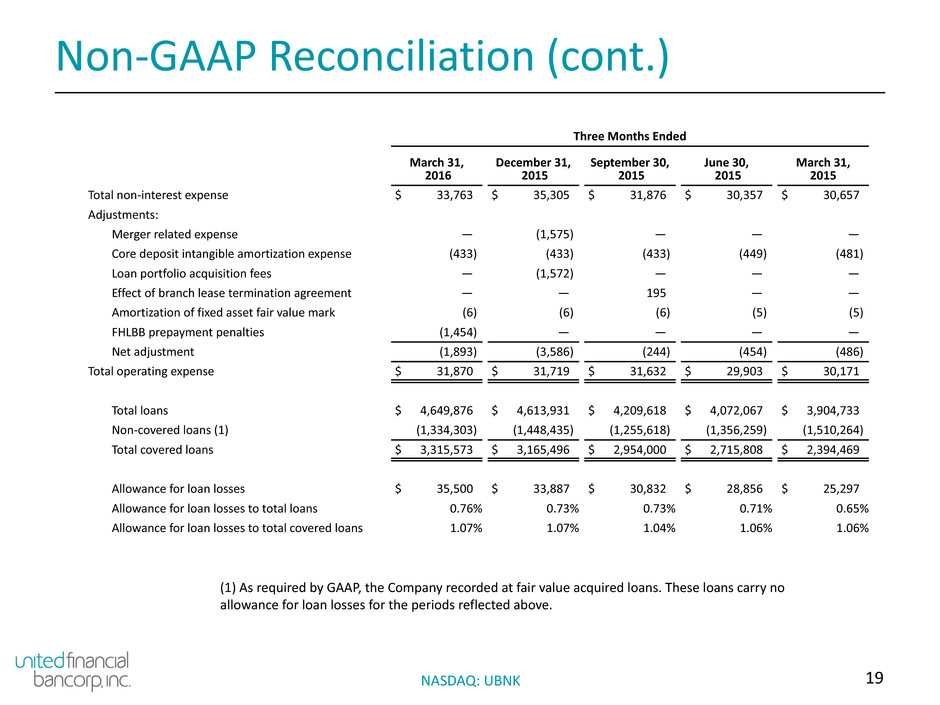
19NASDAQ: UBNK Non-GAAP Reconciliation (cont.) Three Months Ended March 31, 2016 December 31, 2015 September 30, 2015 June 30, 2015 March 31, 2015 Total non-interest expense $ 33,763 $ 35,305 $ 31,876 $ 30,357 $ 30,657 Adjustments: Merger related expense — (1,575) — — — Core deposit intangible amortization expense (433) (433) (433) (449) (481) Loan portfolio acquisition fees — (1,572) — — — Effect of branch lease termination agreement — — 195 — — Amortization of fixed asset fair value mark (6) (6) (6) (5) (5) FHLBB prepayment penalties (1,454) — — — — Net adjustment (1,893) (3,586) (244) (454) (486) Total operating expense $ 31,870 $ 31,719 $ 31,632 $ 29,903 $ 30,171 Total loans $ 4,649,876 $ 4,613,931 $ 4,209,618 $ 4,072,067 $ 3,904,733 Non-covered loans (1) (1,334,303) (1,448,435) (1,255,618) (1,356,259) (1,510,264) Total covered loans $ 3,315,573 $ 3,165,496 $ 2,954,000 $ 2,715,808 $ 2,394,469 Allowance for loan losses $ 35,500 $ 33,887 $ 30,832 $ 28,856 $ 25,297 Allowance for loan losses to total loans 0.76% 0.73% 0.73% 0.71% 0.65% Allowance for loan losses to total covered loans 1.07% 1.07% 1.04% 1.06% 1.06% (1) As required by GAAP, the Company recorded at fair value acquired loans. These loans carry no allowance for loan losses for the periods reflected above.
