Attached files
| file | filename |
|---|---|
| 8-K - SOUND FINANCIAL BANCORP, INC. 8-K 4-19-2016 - Sound Financial Bancorp, Inc. | form8k.htm |
Exhibit 99.1

Sound Financial Bancorp, Inc. (NASDAQ: SFBC)Investor Meetings

Safe Harbor Statement When used in filings by Sound Financial Bancorp, Inc. (the "Company”) with the Securities and Exchange Commission (the “SEC”), in the Company's press releases or other public or stockholder communications, and in oral statements made with the approval of an authorized executive officer, the words or phrases “will likely result,” “are expected to,” “will continue,” “is anticipated,” “estimate,” “project,” “intends” or similar expressions are intended to identify “forward-looking statements” within the meaning of the Private Securities Litigation Reform Act of 1995. Such forward-looking statements, which are based on various underlying assumptions and expectations and are subject to risks, uncertainties and other unknown factors, may include projections of our future financial performance based on our growth strategies and anticipated trends in our business. These statements are only predictions based on our current expectations and projections about future events, and may turn out to be wrong because of inaccurate assumptions we might make, because of the factors illustrated below or because of other important factors that we cannot foresee that could cause our actual results to be materially different from the historical results or from any future results expressed or implied by such forward-looking statements. Factors which could cause actual results to differ materially, include, but are not limited to: changes in economic conditions; legislative changes; changes in policies by regulatory agencies; fluctuations in interest rates; the risks of lending and investing activities, including changes in the level and direction of loan delinquencies and write-offs and changes in estimates of the adequacy of the allowance for loan losses; the Company's ability to access cost-effective funding; fluctuations in real estate values and both residential and commercial real estate market conditions; demand for loans and deposits in the Company's market area; secondary market conditions for loans; results of examinations of the Company or its wholly owned bank subsidiary by their regulators; competition; changes in management’s business strategies and other factors described in the Company’s latest annual Report on Form 10-K and Quarterly Reports on Form 10-Q and other filings with the Securities and Exchange Commission – which are available at www.soundcb.com and on the SEC’s website at www.sec.gov.The Company does not undertake - and specifically declines any obligation - to publicly release the result of any revisions which may be made to any forward-looking statements to reflect events or circumstances after the date of such statements or to reflect the occurrence of anticipated or unanticipated events

Corporate Overview
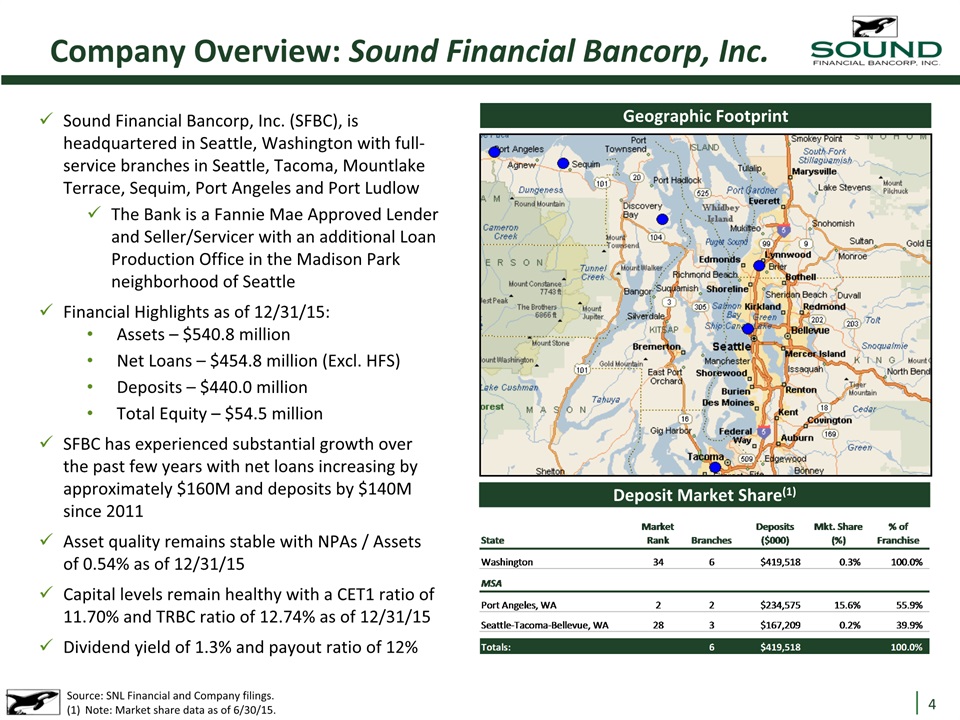
Company Overview: Sound Financial Bancorp, Inc. Source: SNL Financial and Company filings. (1) Note: Market share data as of 6/30/15. Sound Financial Bancorp, Inc. (SFBC), is headquartered in Seattle, Washington with full-service branches in Seattle, Tacoma, Mountlake Terrace, Sequim, Port Angeles and Port LudlowThe Bank is a Fannie Mae Approved Lender and Seller/Servicer with an additional Loan Production Office in the Madison Park neighborhood of SeattleFinancial Highlights as of 12/31/15:Assets – $540.8 millionNet Loans – $454.8 million (Excl. HFS)Deposits – $440.0 millionTotal Equity – $54.5 millionSFBC has experienced substantial growth over the past few years with net loans increasing by approximately $160M and deposits by $140M since 2011Asset quality remains stable with NPAs / Assets of 0.54% as of 12/31/15Capital levels remain healthy with a CET1 ratio of 11.70% and TRBC ratio of 12.74% as of 12/31/15Dividend yield of 1.3% and payout ratio of 12% Geographic Footprint Deposit Market Share(1)
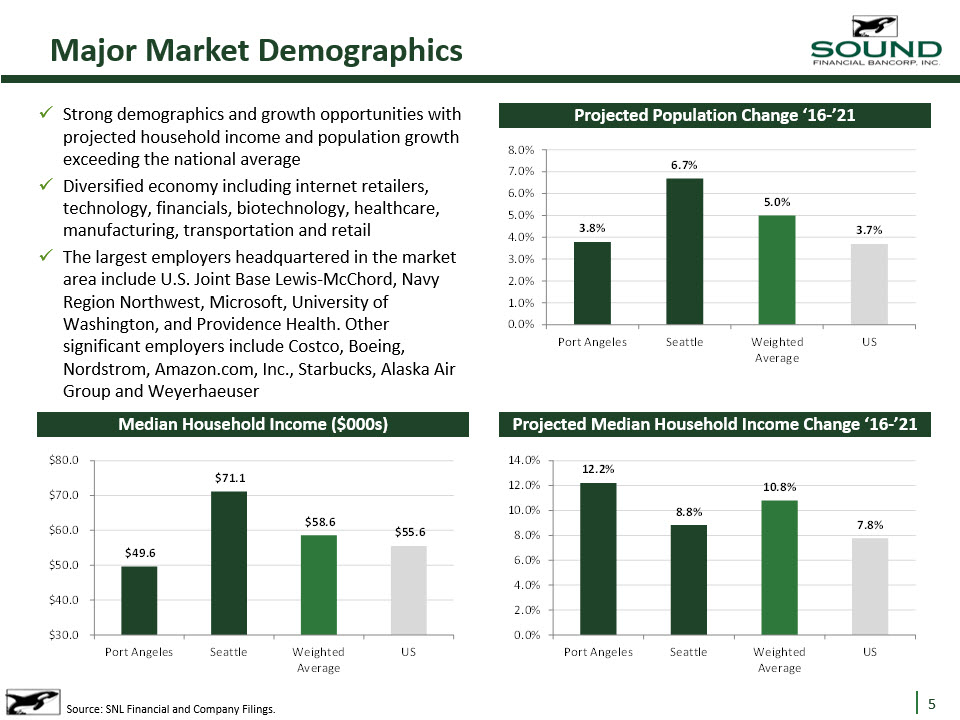
Major Market Demographics Source: SNL Financial and Company Filings. Strong demographics and growth opportunities with projected household income and population growth exceeding the national averageDiversified economy including internet retailers, technology, financials, biotechnology, healthcare, manufacturing, transportation and retailThe largest employers headquartered in the market area include U.S. Joint Base Lewis-McChord, Navy Region Northwest, Microsoft, University of Washington, and Providence Health. Other significant employers include Costco, Boeing, Nordstrom, Amazon.com, Inc., Starbucks, Alaska Air Group and Weyerhaeuser Projected Population Change ‘16-’21 Median Household Income ($000s) Projected Median Household Income Change ‘16-’21
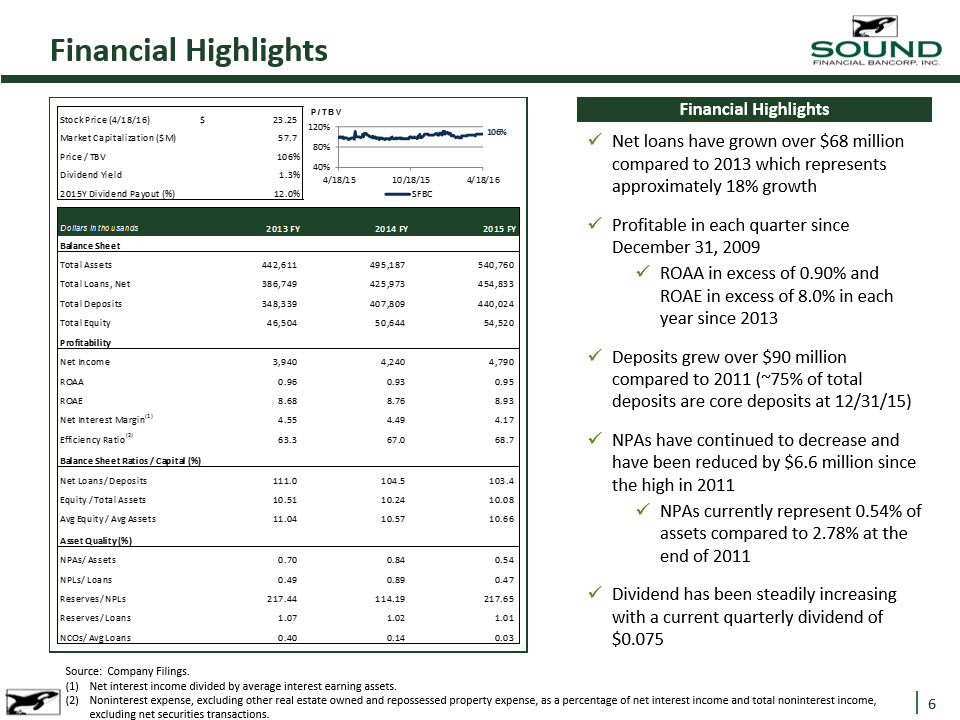
Financial Highlights Financial Highlights Source: Company Filings. Net interest income divided by average interest earning assets.Noninterest expense, excluding other real estate owned and repossessed property expense, as a percentage of net interest income and total noninterest income, excluding net securities transactions. Net loans have grown over $68 million compared to 2013 which represents approximately 18% growth Profitable in each quarter since December 31, 2009ROAA in excess of 0.90% and ROAE in excess of 8.0% in each year since 2013Deposits grew over $90 million compared to 2011 (~75% of total deposits are core deposits at 12/31/15)NPAs have continued to decrease and have been reduced by $6.6 million since the high in 2011NPAs currently represent 0.54% of assets compared to 2.78% at the end of 2011Dividend has been steadily increasing with a current quarterly dividend of $0.075
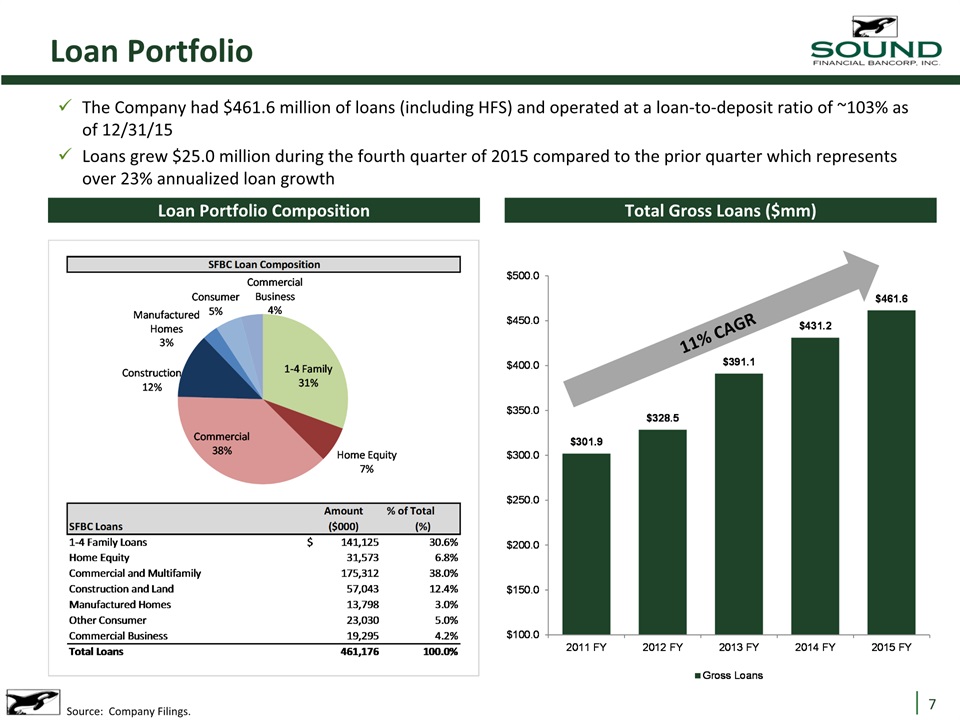
Loan Portfolio Loan Portfolio Composition Source: Company Filings. The Company had $461.6 million of loans (including HFS) and operated at a loan-to-deposit ratio of ~103% as of 12/31/15Loans grew $25.0 million during the fourth quarter of 2015 compared to the prior quarter which represents over 23% annualized loan growth Total Gross Loans ($mm) 11% CAGR
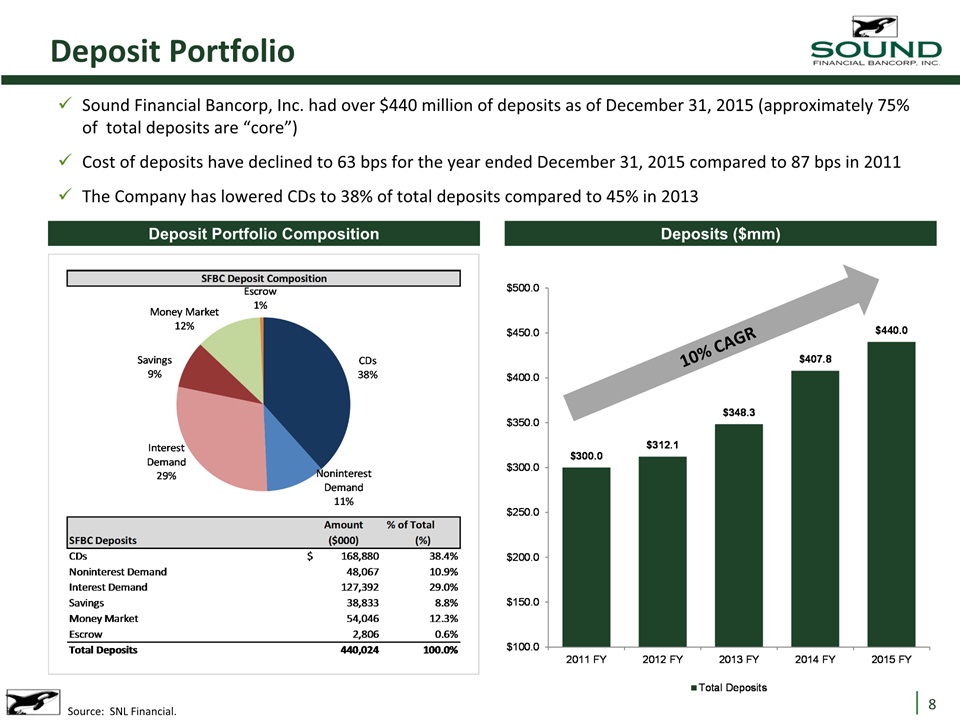
Deposit Portfolio Deposit Portfolio Composition Sound Financial Bancorp, Inc. had over $440 million of deposits as of December 31, 2015 (approximately 75% of total deposits are “core”)Cost of deposits have declined to 63 bps for the year ended December 31, 2015 compared to 87 bps in 2011The Company has lowered CDs to 38% of total deposits compared to 45% in 2013 Deposits ($mm) Source: SNL Financial. 10% CAGR
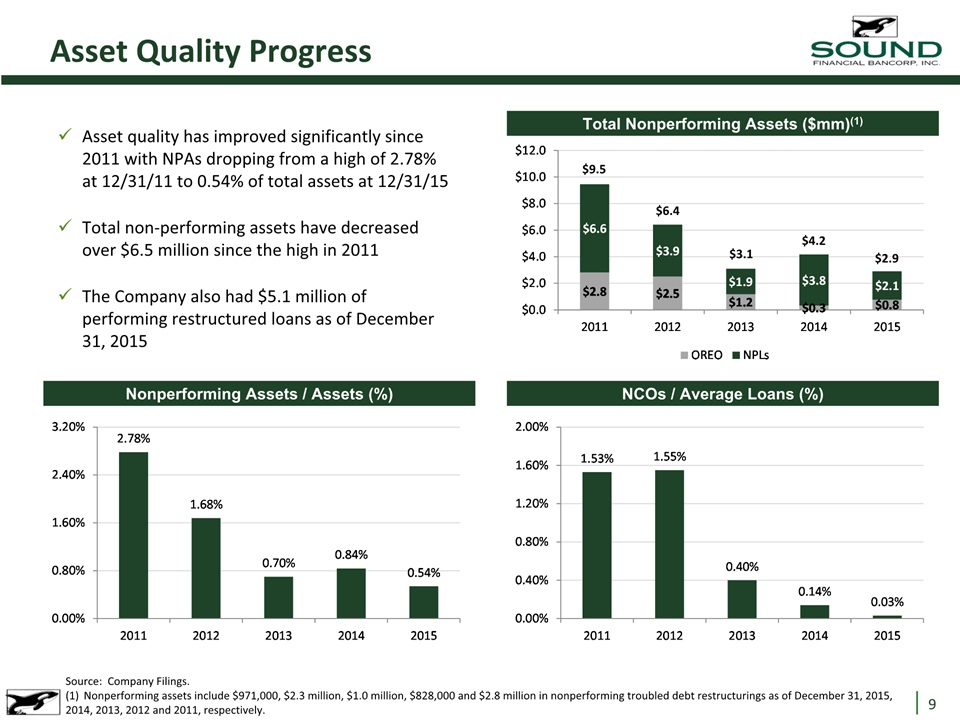
Asset Quality Progress Asset quality has improved significantly since 2011 with NPAs dropping from a high of 2.78% at 12/31/11 to 0.54% of total assets at 12/31/15Total non-performing assets have decreased over $6.5 million since the high in 2011The Company also had $5.1 million of performing restructured loans as of December 31, 2015 Source: Company Filings.(1) Nonperforming assets include $971,000, $2.3 million, $1.0 million, $828,000 and $2.8 million in nonperforming troubled debt restructurings as of December 31, 2015, 2014, 2013, 2012 and 2011, respectively. Nonperforming Assets / Assets (%) NCOs / Average Loans (%) Total Nonperforming Assets ($mm)(1) $9.5 $6.4 $3.1 $4.2 $2.9

Capital Return to Shareholders Dividends Declared Since 2013Q2 SFBC has returned capital to shareholders regularly since the second quarter of 2013Regular quarterly dividend per share paid has increased to $0.075/share Shares Repurchased Since 2013Q2 Source: SNL Financial.
Appendix

SFBC Peers Public Profitable Depositories in AK, ID, MT, OR and WA with Total Assets between $250mm – $1.0bn and NPAs / Assets < 4.0% Source: SNL Financial, data as of 12/31/2015. Market data as of 4/18/2016.Data as of 3/31/2016.Nonperforming Assets + Loans 90+ Days Past Due and Still Accruing (NPLs + OREO + Other Nonaccrual Assets + 90PD Loans)/ Total Assets

Stock Price Performance LTM Stock Price Performance Source: SNL Financial. Market data as of 4/18/2016.

Management Team & Board of Directors Source: SNL Financial.